


Scholars know a great deal about why people vote, protest, and engage in other forms of interest-based politics. We know little, however, about participation in consultative events such as town halls. Technology, moreover, has changed political communication, meaning we know even less about newer forms of engagement. Perhaps most significantly, politicians now engage citizens in unmediated politics at scale, routinely using digital and telephone town halls to interact with many constituents (Abernathy et al., Reference Abernathy, Esterling, Freebourn, Kennedy, Minozzi, Neblo and Solis2019). Exogenous events encouraged the proliferation of these modalities, as the COVID-19 epidemic caused a precipitous decline in the relative frequency of in-person town halls among U.S. legislators, with limited subsequent return to physical meetings (Gibson & King Reference Gibson and King2024, see Table 1). Thousands of remote events occur annually.
Results of hurdle models

**p < 0.01; *p < 0.05. Unit of observation is the individual/elector/resident. Models are weighted by inverse number of electors associated with phone number and include suburb-level fixed effects. The final block presents p values from F tests of linear hypotheses.
What motivates people to participate in consultative events over new modalities? These events may merely replace existing channels, replicating known patterns (e.g., Broockman and Ryan, Reference Broockman and Ryan2016). Alternatively, they could be opportunities to realize normatively desirable changes. This question is not merely academic. Elected officials keenly desire greater participation in their events.
Considering the role of technology in representation, Neblo et al. (Reference Neblo, Esterling and Lazer2018) develop the concept of directly representative democracy (DRD) as a more ambitious, yet still empirically plausible, account of how representative democracy could work in such a setting. DRD has two components: ongoing republican consultation (officials eliciting input early in policymaking, prospectively) and ongoing deliberative accountability (officials explaining past actions, retrospectively). For example, a representative might hold a virtual forum early in the policymaking process to elicit input on a proposed bill (prospective) or explain their reasoning after a vote has been cast (retrospective). At their best, consultative events could be vehicles for either component and thereby deepen the linkage between elites and the mass public.
What distinguishes DRD from other reform paradigms is its commitment to restoring the representative relationship, bypassing intermediaries such as interest groups, parties, and media, and instead facilitating direct, two-way communication between constituents and their elected officials. Drawing inspiration from the classic New England town hall meeting, once an icon of American civic life, DRD adapts the ideal of face-to-face deliberation to the realities of large-scale democracy through institutional redesign and digital tools. While traditional town halls have come to be dominated by the most extreme voices, DRD offers structured opportunities for a broader cross-section of citizens to engage in respectful, informed dialogue with their representatives. In doing so, it aims not merely to increase participation but to improve its quality, making it more inclusive, deliberative, and trusted.
Crucially, DRD also helps reconcile the tension between the trustee and delegate models of representation. By incorporating citizens into both the advisory and evaluative stages of policymaking, representatives neither blindly follow public opinion nor unaccountably substitute their own judgment. Instead, they engage constituents in a cycle of mutual reasoning—seeking input before decisions are made (ongoing republican consultation) and explaining actions after the fact (ongoing deliberative accountability). This dynamic enables citizens to see themselves as co-deliberators rather than mere spectators, and positions representatives to be both responsive and responsible in their roles.
As with all participation, a key barrier is motivation. Which component—prospective or retrospective—might be more attractive? To answer this question, we conducted a large field trial in which Australian voters received one of three invitations to participate in a telephone town hall with their member of parliament (MP). In addition to invitations framed prospectively or retrospectively, a control condition provided no explicit rationale for participation. Our study unfolded across events in May and July 2021, providing evidence on whether treatments motivated participation and for whom the treatments were most effective.
Surprisingly, the control group had higher acceptance rates than the retrospective condition for both events and the prospective condition in May. Hurdle models reveal that once that effect is accounted for, treatment group members remained on the call longer, significantly so for the prospective treatment in July. We see no differences by gender, but the youngest cohort (18–24) had higher acceptance rates in the prospective condition than in control for both events. To explain these results, we conjecture that different groups may have different preferences for consultative events (i.e., a prospective or retrospective focus), projecting that preference onto the vague control condition. Alternatively, specific framing may appear disingenuous and cause a backfire effect that lowers participation.
1. Theory and hypotheses
DRD has two components. The first is ongoing republican consultation: intervening prospectively to “help [the legislator] understand how to better represent [the constituent] going forward.” The second is ongoing deliberative accountability: entering retrospectively “to help [the constituent] to better understand why [the legislator] represented [the constituent] the way [the legislator] did.” Our experiment explicitly taps these motivations using this exact verbiage.
We expect that motivating calls for participation will primarily act via political efficacy. People with higher efficacy participate more in politics; for example, those with higher external efficacy are more likely to vote (Abramson and Aldrich, Reference Abramson and Aldrich1982). Efficacy perceptions are susceptible to change with exogenous evidence. Women see increases in external efficacy when they observe more women in public office (Atkeson and Carillo, Reference Atkeson and Carillo2007), and participation in events designed along DRD principles caused increases in efficacy (Esterling et al., Reference Esterling, Neblo and Lazer2011). Prospective and retrospective frames may be taken as evidence of one’s efficacy, thereby increasing participation. We therefore expect opportunities for both prospective and retrospective communication with officials to motivate participation relative to control.
These frames may have different effects. Efficacy is related to perceived agency (Bandura Reference Bandura1982; Bandura, Reference Bandura2006), which is emphasized more by the prospective than the retrospective frame. Additionally, people may value being shown the respect of ex ante consultation. The retrospective treatment is also more familiar, as it hews closer to the role of elections. In contrast, prospective input may seem more efficient since electoral reward and punishment are delayed and bundle together many policy choices (Urbinati, Reference Urbinati2008; Hofmann, Reference Hofmann2019).
We do not directly measure efficacy perceptions in the study. Instead, we infer efficacy from observed behavioral responses: whether individuals accept the call and how long they remain on the line. These measures capture engagement as a downstream consequence of perceived agency. While not a direct test of an efficacy mechanism, this approach is consistent with prior work in which behavioral participation is interpreted as evidence of efficacy (e.g., Esterling et al., Reference Esterling, Neblo and Lazer2011). We acknowledge the inferential limits of this strategy and return to this point in the conclusion.
In terms of our primary measure—Call Acceptance by a phone number dialed for the events under study—our main (pre-registeredFootnote 1) hypotheses are:
H1a: Call Acceptance will be higher for Prospective than Control.
H1b: Call Acceptance will be higher for Retrospective than Control.
H2: Call Acceptance will be higher for Prospective than Retrospective.
If these messages work by boosting efficacy, effects may depend on existing variation. For example, women feel less efficacious than men (Bennett and Bennett, Reference Bennett and Bennett1989; Bennett, Reference Bennett1997; Burns et al., Reference Burns, Schlozman and Verba2001; Thomas, Reference Thomas2012), driven partly by underlying differences in self-confidence (Wolak, Reference Wolak2020). As such, the effects of treatment may differ by gender. Under control, men may participate more than women if they perceive themselves as more efficacious. However, if men start with higher efficacy, the effect of a boost from (what we anticipate as) the milder, more familiar retrospective treatment may be higher for women. In contrast, higher efficacy in men could make them more susceptible to the prospective treatment.Footnote 2 We therefore hypothesize:
H3a: For Control, Call Acceptance will be higher for men than women.
H3b: The difference between Prospective and Control will be higher for men than women.
H3c: The difference between Retrospective and Control will be higher for women than men.
H3d: For men, the effect of Prospective on Call Acceptance will be higher than that for Retrospective. For women, the effect of Retrospective on Call Acceptance will be higher than that for Prospective.
We also preregistered several research questions. While the effects above focus on initial Call Acceptance, we leave it open whether treatments will influence Length of Time on Call. Treatments may be quickly overridden by the call itself (for those who actually accept the call), or they might set expectations in a way that conduces toward, or detracts from, that experience. We also have research questions about how effects depend on age, and our discussion of gender leaves open how treatments will affect net levels of participation.
RQ1: What is the effect of treatments on Length of Time on Call relative to Control?
RQ2: What is the relative effect of treatments on Length of Time on Call?
RQ3: Does age moderate treatment effects?
RQ4: Do net outcomes differ by gender in each treatment condition?
2. Experimental design, measurement, and analysis
To test our hypotheses and address our research questions, Australian MP Andrew Leigh (coauthor on this paper) conducted field experiments in the federal electorate of Fenner, which encompasses the northernmost third of Canberra and the Jervis Bay Territory.Footnote 3 The MP was motivated by a desire to maximize participation in his events. Compared with the rest of Australia, the electorate is relatively affluent. Of Australia’s 151 House of Representatives electorates, the district ranks 11th on median household income ($107,432 per year) and 35th on median mortgage repayments ($24,444 per year). Twenty-nine percent of residents were born overseas, while 27 percent speak a language other than English at home (both figures are slightly above average).
In May 2021, the MP held a first event, administered by the firm Tele-Town Hall. All phone numbers on the firm’s list (30,126 numbers associated with 34,154 individuals) were randomly assigned to one of three groups (Prospective, Retrospective, and Control) with equal probabilities. The night before the event, numbers were contacted using an automatic system. If a person answered, they received the following message, with bolded passages indicating the experimental frames:
G’day, this is Andrew Leigh calling from Gungahlin. I’m your local representative in the Federal Parliament. This is an automatic call to let you know that I’ll be holding a tele-townhall tomorrow night at 5:45pm …
Prospective: This is an opportunity for you to explain your reasoning to me on important issues, to help me understand how to better represent you going forward.
Retrospective: This is an opportunity for me to explain my reasoning to you on important issues, to help you to better understand why I represented you the way I did.
Control: <No text.>
…Tomorrow night, you’ll receive a call like this one and be asked if you want to join the conversation. Just press ‘Zero’ to be patched through. Looking forward to answering your questions tomorrow night.
On the night of the event, a second call with a similar message was delivered to each number. Similar messages were used when calls went to voicemail, replacing “This is an automatic call” with “I’m calling.” Complete scripts appear in Supporting Materials. The telephone event itself contained both prospective and retrospective elements: the MP opened the call with a short speech about current events, and then the bulk of the event was devoted to answering constituent questions (participants pressed a key on their telephones to ask a question, and were then put into a queue). Given that the event took place in 2021, much of the discussion focused on the public health response to the COVID-19 pandemic, including vaccinations, movement restrictions, and support payments to workers and businesses.
In July 2021, the MP held a subsequent event, repeating this design. For July, the firm contacted a different list of phone numbers (39,891 numbers associated with 43,455 individuals). The lists overlap; 16,266 numbers (16,990 individuals, about 50% of those contacted in May) were contacted only in July.Footnote 4 About 95% of numbers included in both events were assigned to the same treatment. The substance of the July telephone town hall was similar to the May town hall described above. In keeping with preregistration, we analyze experiments separately with the same analysis plan. To address spillovers, we present analyses of July for the entire sample (as preregistered), the subsample of newly enrolled numbers, and the subsample excluding those whose treatment changed.Footnote 5
Our main unit of analysis is the individual (i.e., voting-eligible resident, or elector). Our primary outcomes are Call Acceptance and Length of Time on Call. The former equals 1 if a person picked up the second call, delivered on the night of the event, and 0 otherwise. The latter is the length of time the phone remained connected, measured in fifths of a second. At the individual-level, we have data on Age (five-category), Gender, and Suburb, and we merge in several more suburb-level covariates.Footnote 6 We checked balance on covariates using equivalence testing (Hartman and Hidalgo, Reference Hartman and Hidalgo2018) for each pair of conditions.Footnote 7 We rejected null hypotheses of differences larger than 0.36 SD for all comparisons with p < 0.001, corrected for false discovery.
Finally, there is another complication: we have data drawn from phone numbers, but we are interested in individual-level behavior. Individuals sometimes share phone numbers. Although we have no direct evidence as to why they do so, one obvious explanation is landlines. Although we lack household composition data, 56% of electors in our dataset (28,735/51,144) are uniquely associated with their phone number, which is slightly larger than the 63% of Australians who had no landline in 2022 (Australian Communications and Media Authority, 2022). The difference would include any single-person household with only a landline. For context, our data include 38,284 unique phone numbers, and 25% (9549) are shared. Of those, 7118 are associated with only two electors, and 82% of that subset includes multiple gender values, and so are potentially heterosexual couples. Of the multi-elector phone numbers, 31% are potentially multigenerational households, measured as being associated with two non-contiguous age groups (e.g., at least one 18–24 and at least one 65+).
We therefore weight each (individual-level) observation by the inverse of the number of people associated with the same number. For example, if two individuals share a number, each receives a weight of 0.5; if three share a number, each receive 0.33; etc. The average weight is 0.88 in May and 0.72 in July. We analyze evidence at the phone number-level for robustness (see SM Tables A26–A30).
We use regression for analysis. For Call Acceptance, the main model is
 \begin{equation*}Call{\text{ }}Acceptanc{e_i} = \alpha + {\beta _1}\;Prospectiv{e_i} + {\beta _2}\;Retrospectiv{e_i} + {\text{ }}{\gamma _j} + {\text{ }}{\varepsilon _i}\end{equation*}
where individual i is associated with a number assigned to a treatment, and γj is a Suburb-level fixed effect. We interpret β 1 and β 2 as the average effects of the Prospective and Retrospective conditions relative to Control. To measure moderated effects, we use multiplicative interactions. We cluster standard errors by phone number. For Length of Time on Call, we preregistered four analyses. First, we use an analogous model to above. However, this outcome will be 0 for individuals associated with numbers that did not accept the call. Therefore, we also estimated a hurdle model that yokes together a logistic regression for Call Acceptance and a negative binomial model of Length of Time on Call; a tobit; and a linear model of the logged outcome.Footnote 8 For presentation, we focus on hurdle models. Results are similar for other specifications. All analyses appear in the SM.
3. Results
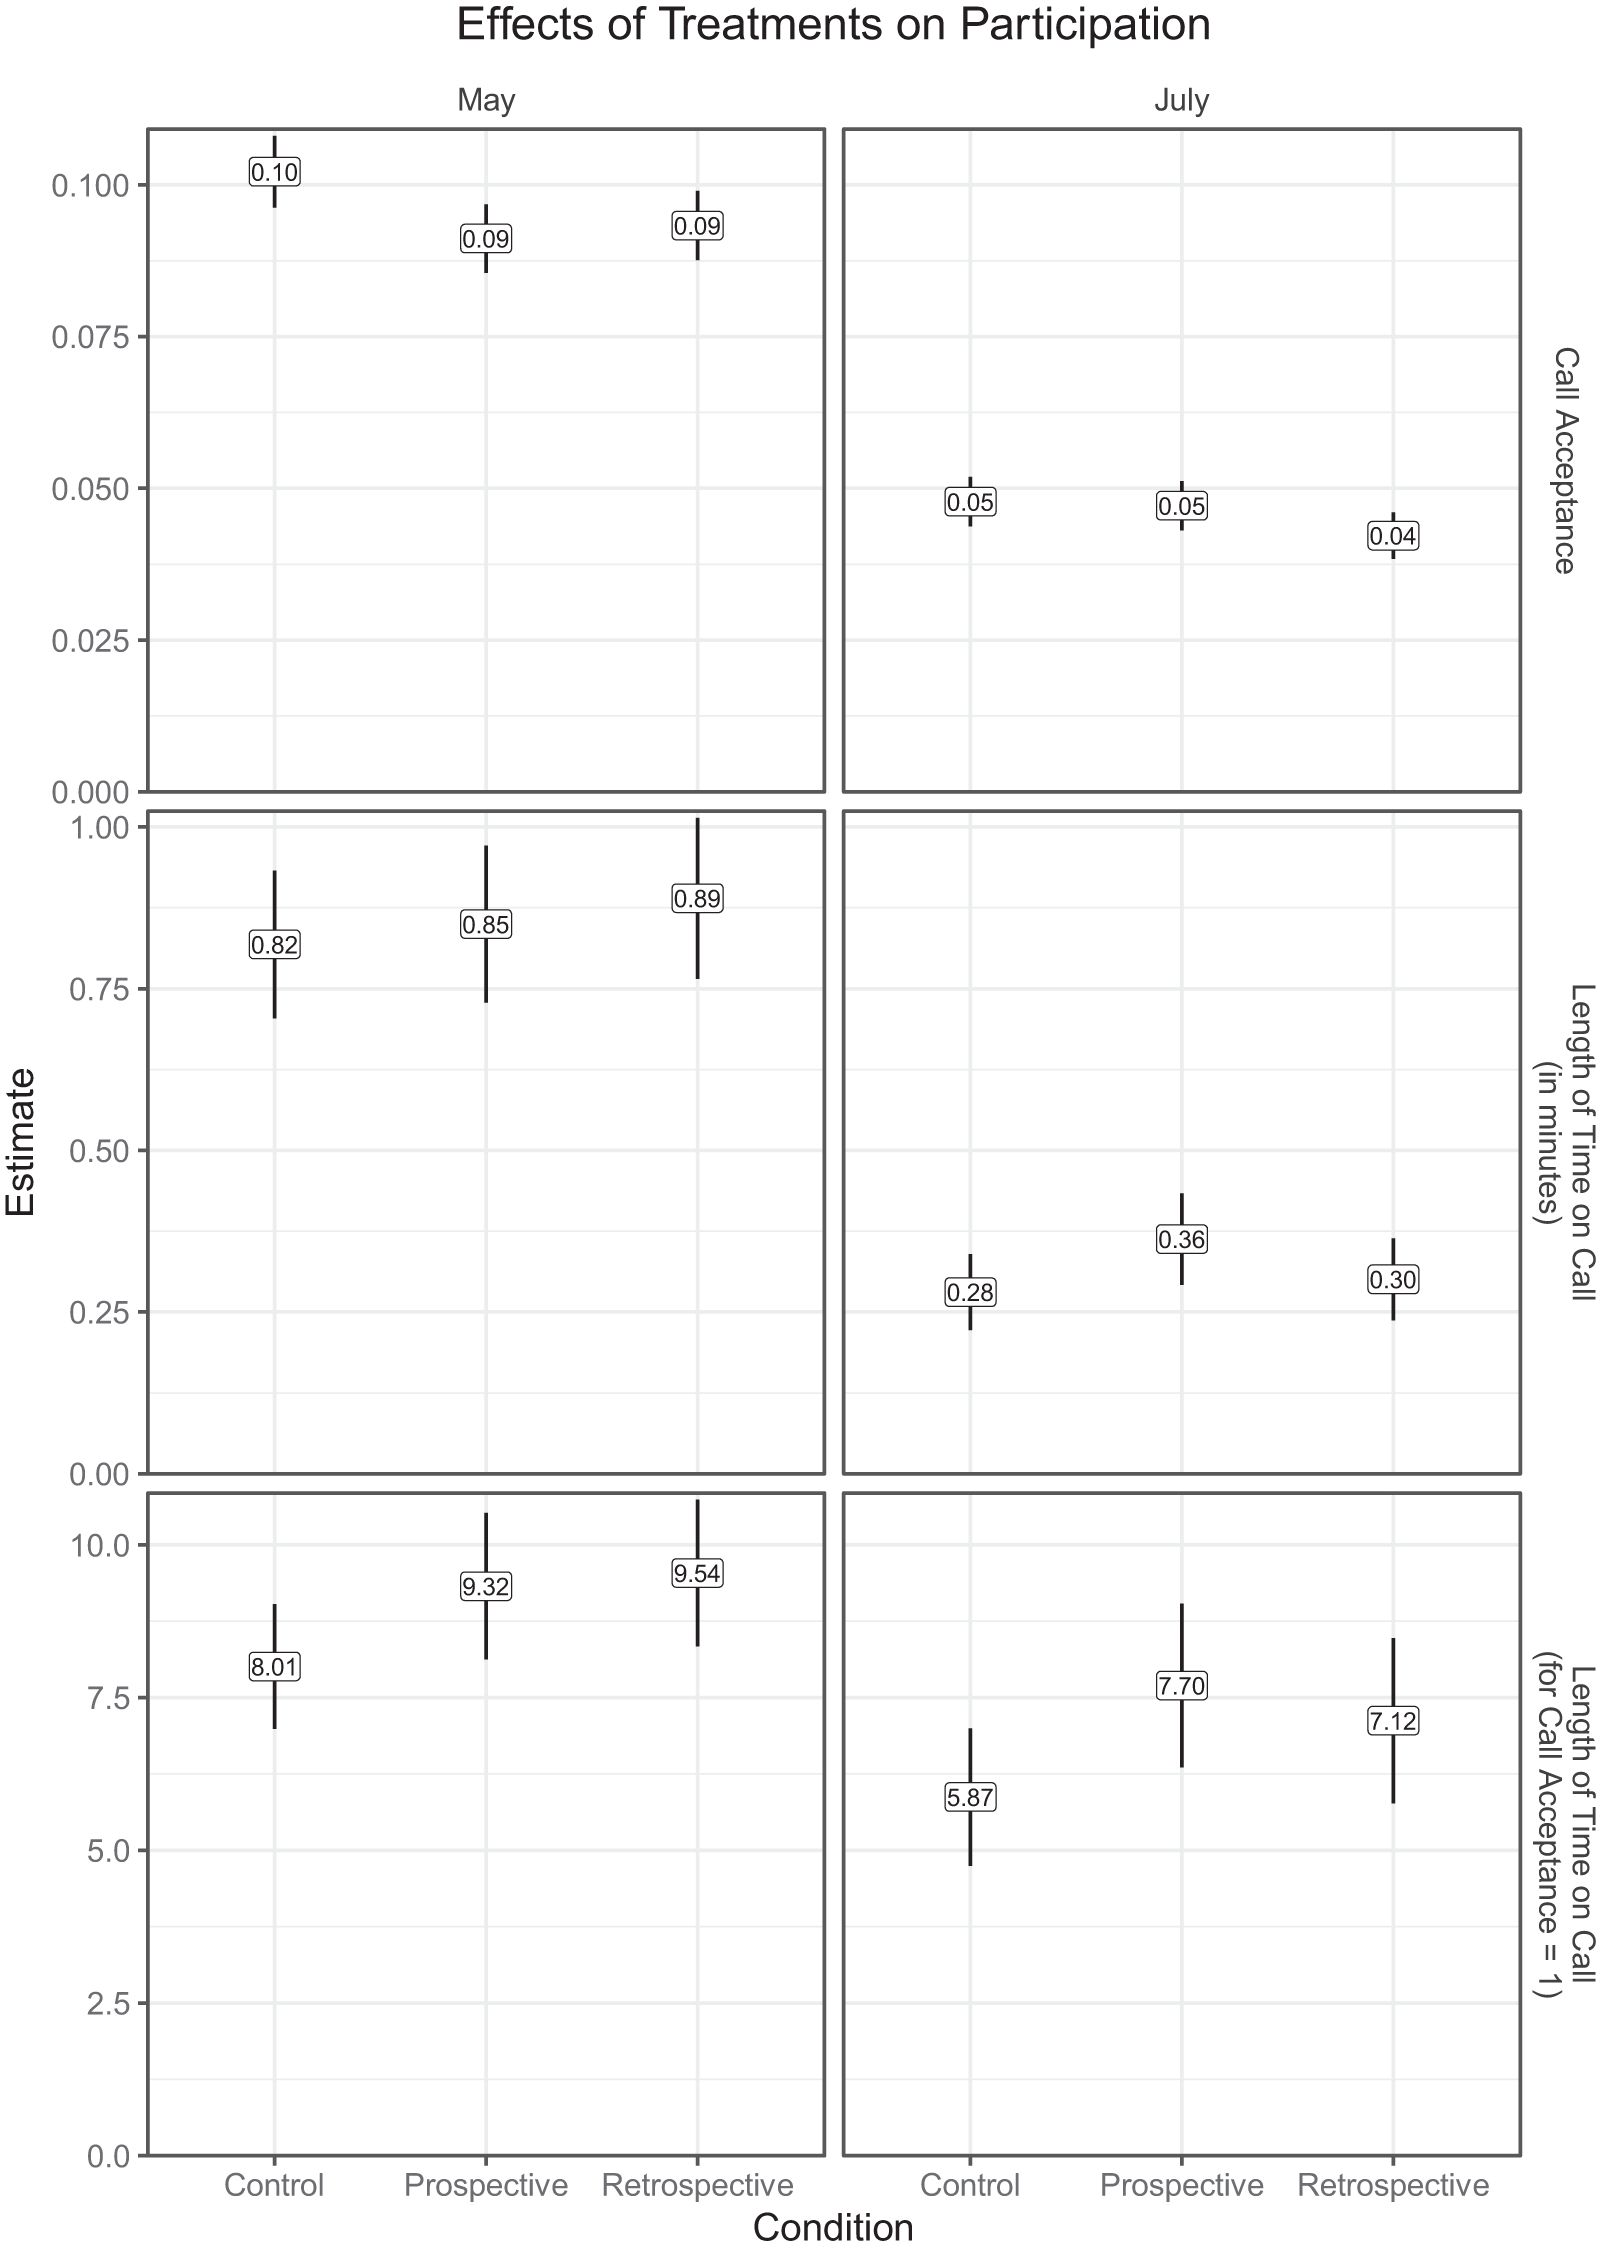
In May, we observed Call Acceptance by 12% of individuals (10% of phone numbers); in July, participation fell to 4% of individuals (4% of numbers). Each event lasted an hour, and, of those who accepted the call, the Length of Time on Call averaged 9 minutes in May and 7 minutes in July. Figure 1 summarizes the evidence with weighted means and 95% intervals. In May, against expectations, we see lower Call Acceptance in treatments than Control (top left). The differences do not persist in July (top right). For Length of Time on Call, we observe small positive differences in treatments relative to Control for both events (middle row). These differences grow once we account for differences in Call Acceptance by subsampling on individuals who accepted the call (bottom row), prompting us to focus on hurdle models.
The figure displays weighted means and 95% intervals for individuals.

Turning to regressions, Table 1 reports hurdle models of Length of Time on. The top portion of the table (rows labeled “Zero”) reports the results of what are essentially logit models of Call Acceptance. Here, the apparent negative, albeit small, differences in Figure 1 in May persist: coefficients on both Prospective and Retrospective are negative and significant at p = 0.05 (two-tailed). Furthermore, the penultimate row presents the results of an F test of equivalence between these coefficients; it fails to reject the null (p = 0.625). The results from May thus not only reject H2 but reverse the expectations we laid out in H1.
These findings are partially confirmed in July—we see no support for H1a, reversal for H1b, and weak evidence for H2. Coefficients on Prospective remain negative yet retreat close to zero and become insignificant, meaning neither support nor reversal for H1a. For Retrospective, in contrast, we see replicated evidence of reversal for H1b, with negative coefficients significant at p = 0.05 for all models. Finally, we see limited evidence of a positive difference between Prospective and Retrospective (H2), but only for the full sample (model [2]) and at the p = 0.10 level rather than our preregistered threshold of 0.05. In SM, we report similar findings from linear models (Table A5) and at the phone number level (Tables A26 and A29). Furthermore, we see no evidence to support hypotheses of differences by gender (H3a–d, Table A6) and no net effects by gender (RQ4). We conclude that not only did our experiments yield no evidence for our expectations, but we also see strong evidence in reversal of our expectation for Retrospective framing.
Turning to Length of Time on Call, the “Count” portion of Table 1 addresses RQ1 and RQ2. Here, we see limited (and, in one case, contradictory) evidence that the Prospective treatment led to more time spent on the call. Coefficients are positive yet insignificant in May (model [1]), and positive and significant in July for the full sample (model [2]) and the subsample excluding individuals associated with phone numbers whose treatment assignment switched (model [4]). However, we see the reverse for individuals associated with phone numbers newly enrolled in July (model [3]): here, the coefficient on Prospective is negative and significant. We see no significant coefficients for Retrospective, and all F tests of differences between coefficients fail to reject the null. Tobits and linear models with logged outcomes yield similar signs, but few significant coefficients (Tables A8 and A10). We conclude that there is, at best, limited evidence suggesting that the Prospective treatment increased time spent on the call, but we cannot rule out the possibility that both treatments caused such increases.
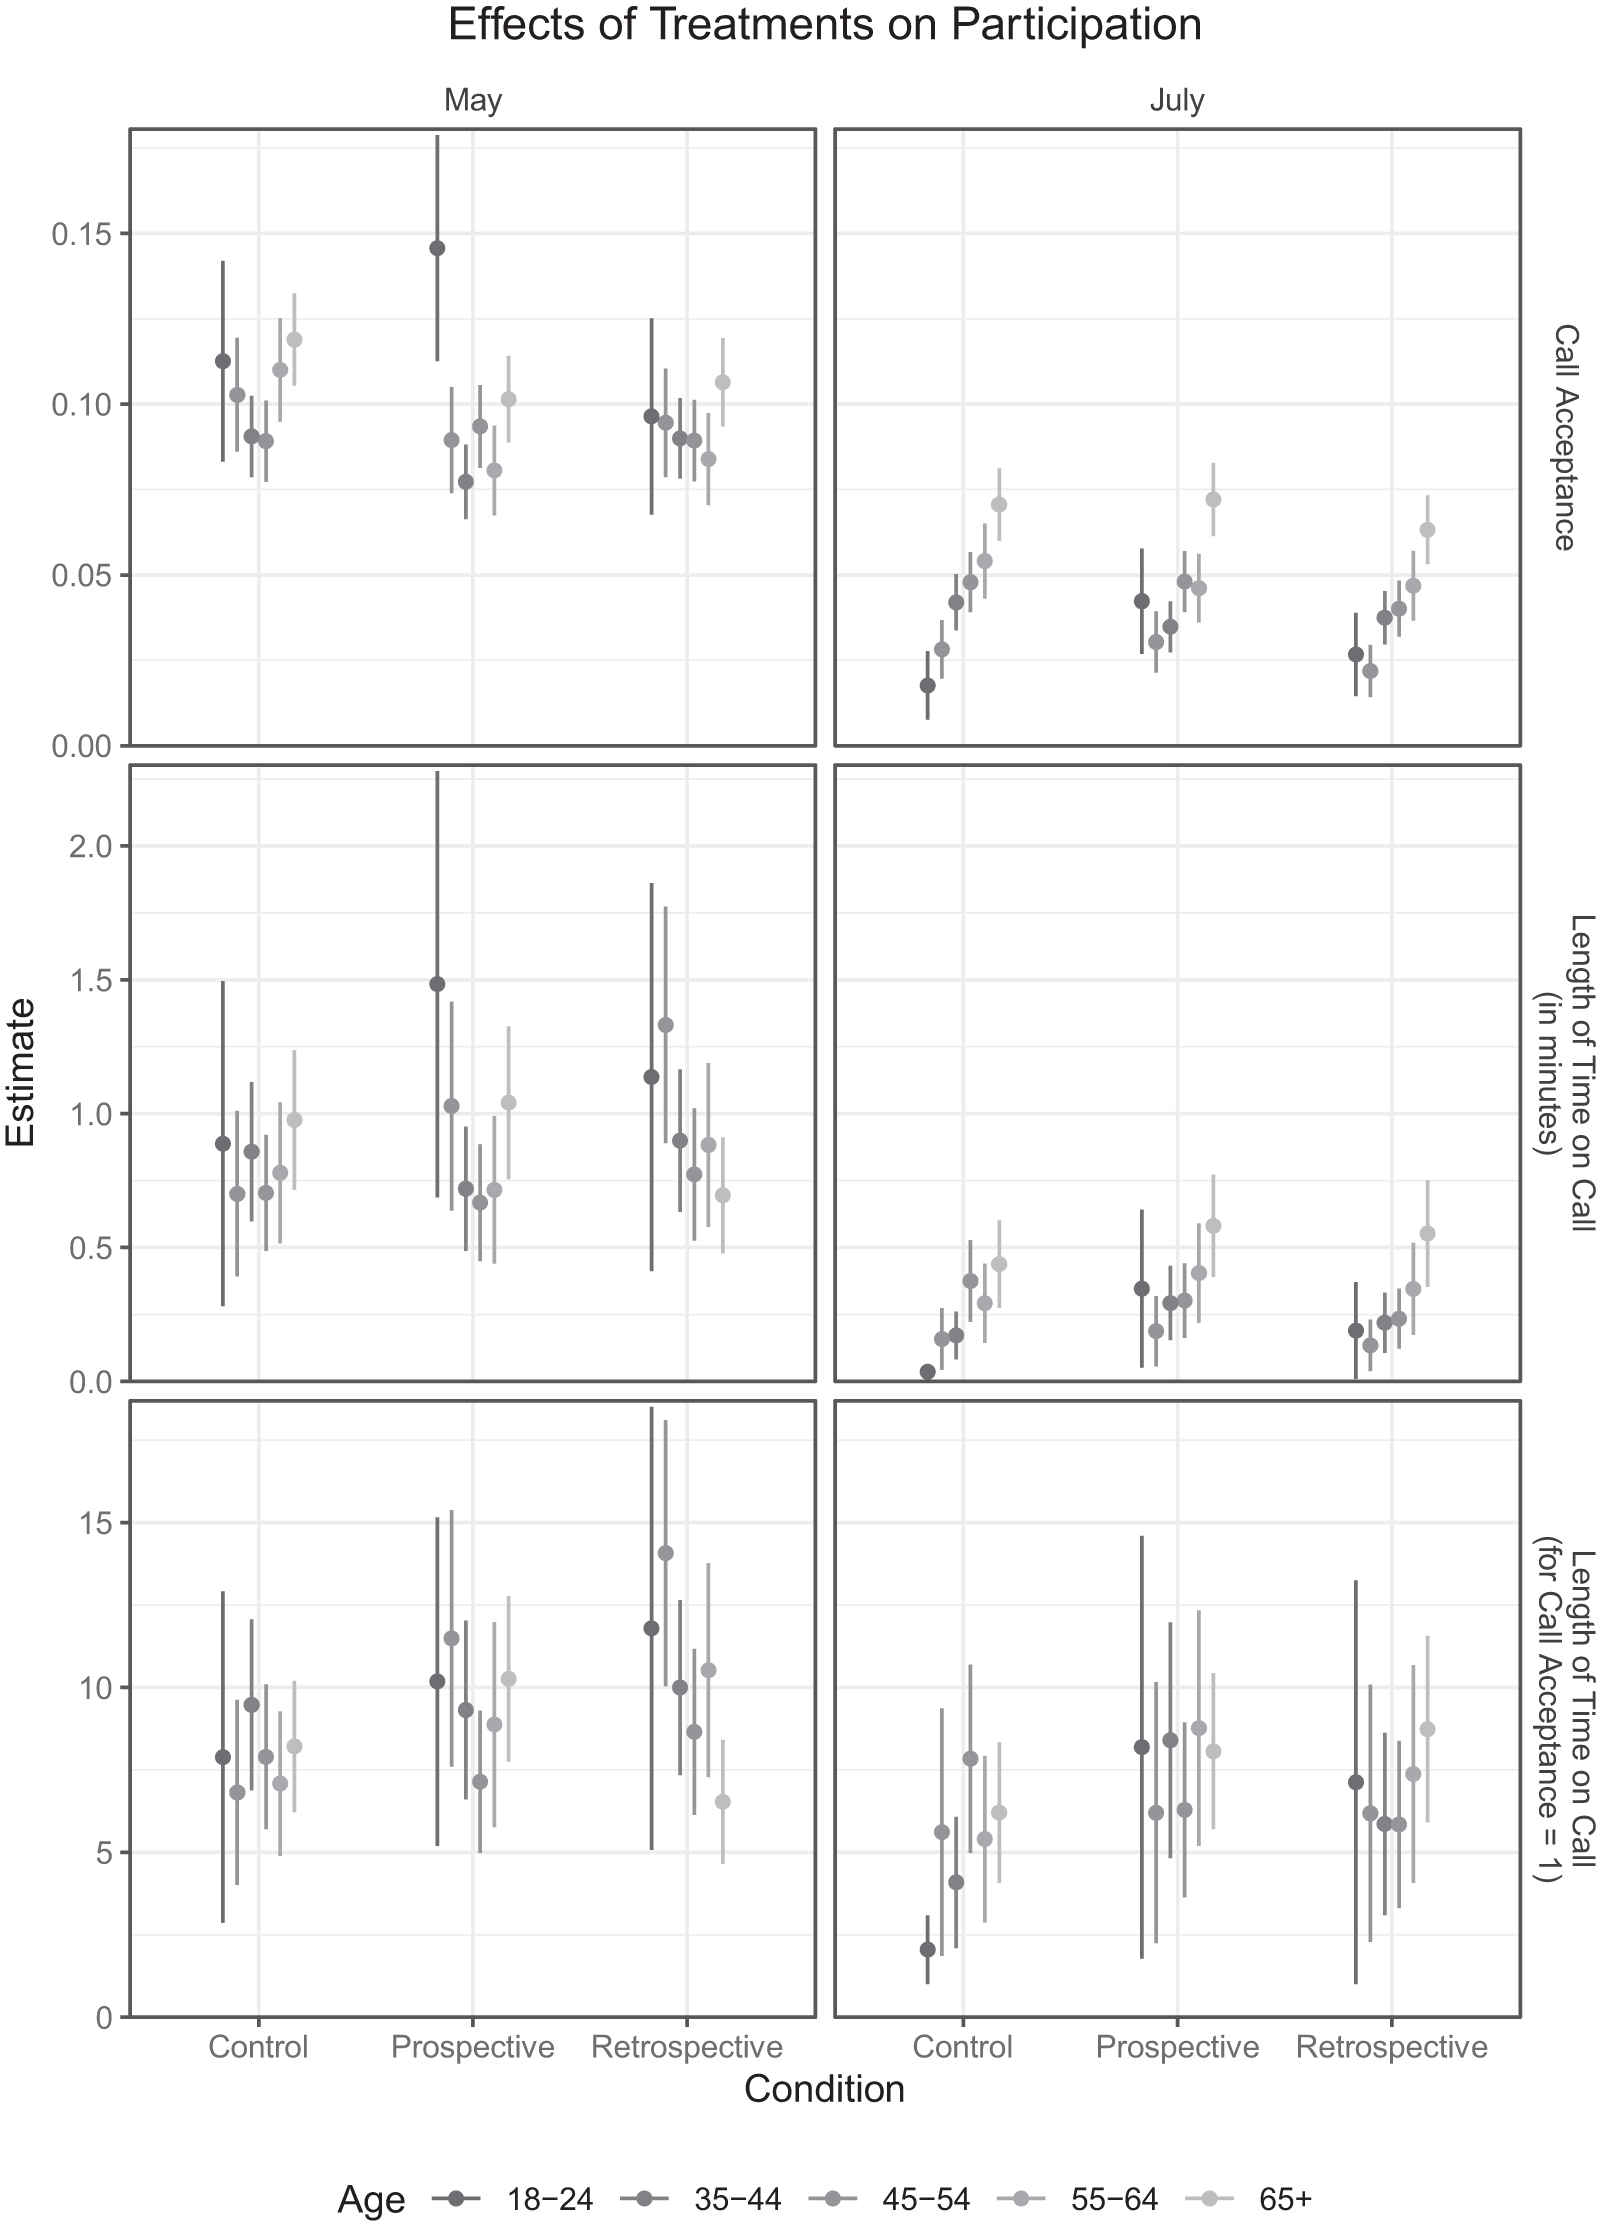
To answer R3, Figure 2 (comparable to Figure 1) breaks down outcomes by age group. Here, we see indications of moderated effects, including consistent, positive differences between Prospective framing and Control for the youngest cohort and more sporadic evidence for others. As above, a hurdle model with interaction terms yields a more rigorous analysis. While we relegate the full table to SM (Table A20), the upshot is that, for Call Acceptance, there is consistent evidence of positive coefficients on the interaction of 18–24 cohort and Prospective (at the 0.05 level for May, and the 0.01 level for July), but no such evidence for Retrospective. For Length of Time on Call, we see positive, significant coefficients for this cohort and Prospective, but only for July in the full sample and the subsample excluding treatment switchers. Only two other interactions are significant in May; neither replicates in July. We conclude that Prospective treatment effect was strongest for the youngest cohort.
The figure displays weighted means (95% intervals) for individuals.

4. Conclusion
We reported evidence that providing specific rationales does not motivate consultative participation. Rather, explicitly stipulating a retrospective rationale was demotivating relative to control. Yet specific rationales also increased the amount of time individuals spent participating. Finally, while we found no evidence of differential effects by gender, the prospective frame motivated the youngest cohort to participate. Although that result was replicated across both events, it was un-hypothesized and awaits future confirmation.
Although our approach infers efficacy from observed behavioral responses, these findings are consistent with the explanation that specifying motivation winnows participants, leaving only the more intrinsically motivated. Moreover, two further conjectures may explain these results. First, individuals may divide into groups differing on which rationale they find more motivating, and people in the control condition could project their preferred rationale onto the event. Second, individuals might find both rationales disingenuous, which could cause a backfire effect relative to simply extending an invitation. These conjectures have important practical and theoretical implications, warranting further research to adjudicate between them. If the projection explanation is correct, then people are interested in—not overly cynical about—opportunities for directly representative democratic innovations, as suggested in a U.S. context by Neblo et al. (Reference Neblo, Esterling, Kennedy, Lazer and Sokhey2010), but it remains to identify who finds which rationale more motivating (e.g., variation in efficacy, personality, identity, etc.). On the backlash explanation, however, future research should disentangle what motivated people who accepted the call (e.g., social norms, expressing grievances, attachment to the MP) and whether participation in the call changed beliefs about the value of such events and the MP’s sincerity. More generally, scholars should link inquiries in new forms of political participation to normative democratic theory to facilitate new technology serving human flourishing rather than further alienating citizens from government.
Beyond the specific academic and practical value of this study, our work illustrates the unique benefits that collaboration between scholars and practitioners can produce. Most political science claims to seek general knowledge, yet restricts itself to the status quo. Elected officials, too, seek to understand both how things are and how they might be—and though their understanding may not be scientifically grounded, it gets tested regularly at the ballot box. Scholars and practitioners, therefore, share an interest in understanding how nearby worlds differ from ours, as a precondition for realizing the efficiency and benefits of intentionally guided change (for example, around increasing political participation).
Supplementary material
The supplementary material for this article can be found at https://doi.org/10.1017/psrm.2026.10092.
Acknowledgements
We are grateful to Nick Terrell for his assistance in implementing this experiment. Authors are listed in randomized order, using the American Economic Association’s Author Randomization Tool.
Data availability
Because of privacy considerations, data for this article cannot be shared publicly. Code used to conduct all analyses can be found at Harvard Dataverse (https://doi.org/10.7910/DVN/J9YYPT).



 Open access

