


Immigration emerged as an important issue in American politics during the second half of the 2010s. Political scientists have attributed the rise and a concomitant change in mass attitudes on related policies to the presidential campaigns and administration of Donald Trump. Trump took forthrightly anti-immigration positions (Eshbaugh-Soha and Barnes, Reference Eshbaugh-Soha and Barnes2021; Hamlin, Reference Hamlin2021; Schaffner, Reference Schaffner2020; Sides, Tesler, and Vavreck, Reference Sides, Tesler and Vavreck2018) that were “the defining feature of his presidency” (Canizales and Vallejo (Reference Canizales and Vallejo2021, 151). Numerous scholars posit his presidential campaigns also used the issue to mobilize whites who held latent racial and ethnic animus (Enns and Jardina, Reference Enns and Jardina2021; Hopkins and Washington, Reference Hopkins and Washington2020; Mason, Wronski, and Kane, Reference Mason, Wronski and Kane2021; Newman et al. Reference Newman, Morella, Shah, Casarez Lemi, Collingwood and Ramakrishnan2021; Wallace and Zepeda-Millan, Reference Wallace and Zepeda-Millan2022).
This paper constitutes an effort to determine the existence and estimate the magnitude and direction of any Trump effect on public attitudes toward immigration policy before 2020. I focus on two claims made with various levels of conviction by the academic literature and popular press. The first is that together Trump’s campaigns for president and residence in the White House polarized the immigration policy attitudes of Americans, pushing them toward or away from his unambiguous anti-immigration positions and, in turn, separating them into groups supportive or oppositional to immigration. This did not happen, at least not to the same extent, on other issues. The work on Trump and race suggests a corollary, that the polarization on immigration had a racial dimension and whites adopted particularly conservative immigration views and Blacks and Latinos moved further to the left. The second claim is that Trump elevated the issue of immigration or public debates about immigration policy and influenced more Americans to consider it an important feature of our politics.
To understand whether there were such Trump effects, I gauge any influence Trump had on mass attitudes toward immigration policy to comparable standards. I use two such benchmarks, the corresponding effect of Trump’s predecessor, Barack Obama, and the equivalent effect Trump exerted on mass attitudes toward another prominent policy issue of the time, trade. The effects exerted by Trump – and Obama – are understood by survey respondents’ views of the president or presidential candidate after controlling for other sources of immigration policy attitudes. Using responses to reputable national surveys of Americans’ views, I show there existed a Trump effect on immigration policy beyond that exerted by Obama. Policy positions were polarized more by subjects’ views of the former. The Trump effect did not, however, push whites on the one hand and Blacks and Latinos on the other in opposite directions. A Trump effect on trade policy was, moreover, materially greater than the equivalent effect on immigration. With regards subjects’ beliefs in the importance of the immigration issue in public life, the Trump effect was only slightly greater than that exerted by attitudes about Obama.
Presidential (and presidential candidate) leadership of public opinion
Influential contributions to the literature on the presidential leadership of public opinion are skeptical of a potential Trump effect on immigration attitudes. To exert a material effect on Americans’ attitudes about a policy beyond any derived from traditionally important determinants such as party, ideology, and an individual’s demographic characteristics, the views of the politician must be distinctive. As an empirical matter, this is surely unusual, particularly in the current era of partisan polarization. Affect toward the parties inevitably determines citizens’ views of presidents or presidential candidates and an assessment of the policies on which they take a position (Jacobson, Reference Jacobson2019). It is increasingly difficult for citizens to distinguish the leader’s policy positions from that of the party.
What is more, well-regarded empirical analyses have come up empty-handed. Canes-Wrone (Reference Canes-Wrone2005) finds presidents exploit rather than shape mass opinion. Attempting to take advantage of significant public support for a position by adopting it does not constitute leadership and influence over public attitudes. Edwards (Reference Edwards2003) is an unwavering skeptic of presidents’ capacity to lead public opinion and has written specifically about Trump’s limitations in this regard (Edwards, Reference Edwards2012, Reference Edwards2021). He sees the Trump presidency as “another example of a president failing to move the American public to support his priority policies, providing further evidence that presidential power is not the power to persuade” (Edwards, Reference Edwards2021, 310).
There is important work fleshing out a claim presidents can exert an independent leadership effect on public opinion, however. The assertion owes much to Zaller’s (Reference Zaller1992) canonical book showing members of the public receive influential cues from political elites that can alter their opinions of policy. Lenz’s (Reference Lenz2012) comparative study also reveals voters’ views of issues are susceptible to manipulation from prominent politicians. At the very least, much of this literature posits such politicians can “frame” issues by presenting options on how to address them in either a positive or negative way to solicit similar attitudes among the mass public (Chong and Druckman Reference Chong and Druckman2007; Druckman and Nelson Reference Druckman and Nelson2003).
Any such influence need not be direct, as if, for example, extending from national addresses given by the president or even social media posts from his account (Cavari, 2007), but indirect and filtered through the traditional media that cover politics (Eshbaugh-Soha and Peake, Reference Eshbaugh-Soha and Peake2011). The effect need not be intentional either, although Rottinghaus (Reference Rottinghaus2010) argues presidents best shape public opinion when they are clear, consistent, and persistent in their messaging. Regardless, the product of influence is that supportive citizens are likely to take the position of the president or presidential candidate on an issue. Those who dislike them are likely to take contrarian views.
To be sure, those who demonstrate leadership of public opinion recognize any effects exerted are conditional and limited. Zaller (Reference Zaller1992) demonstrates that presidents’ cues are largely effective on individuals with low levels of political awareness and knowledge of public policy. Geer (Reference Geer1996) reveals this to be case on issues of low salience and that presidents are more likely to follow public opinion on policy matters that are at the center of public debate. Lenz (Reference Lenz2012) shows that, although citizens may respond to prompts given them by leaders, performance in government tends to influence public attitudes more than substantive policy positions.
The literature on presidential leadership speaks to a matter of additional interest here: a leader’s capacity to draw the public’s attention to a particular issue and elevate the importance Americans attach to it. Some work shows presidents can effectively set the policy agenda by having the public increase its focus on a particular issue and raise it to a level of greater significance relative to other issues and where it had been in the past (Cohen, Reference Cohen1995; Eshbaugh-Soha and Peake, Reference Eshbaugh-Soha and Peake2011; Wallace and Zepeda-Millan Reference Wallace and Zepeda-Millan2022; Whitford and Yates 2009). Eshbaugh-Soha and Peake (Reference Eshbaugh-Soha and Peake2011), for example, demonstrate that presidents can place issues on the national agenda through direct appeals to the public and, as is more often the case in successful endeavors, through their manipulation of the media.
The case of Trump and immigration
I believe this theoretical and empirical groundwork gives us cause to argue the conditions necessary, although possibly not sufficient, for a Trump effect on immigration policy attitudes were present. Trump was positioned to form or alter both the substance of public attitudes about immigration and the extent to which Americans believed it was an important issue. First, immigration was at the very least subject to some national debate during the early 2010s. Over the previous decade, the foreign-born population of the United States had grown by one third to 40 million and the unauthorized population by about 27 percent to nearly 11 million. In 2010, Republican states and localities began to assign their law enforcement officers to immigration duties in response to what they perceived was the administration’s permissive stance. A bipartisan “Gang of Eight” senators tried to push a bill providing a path to citizenship for undocumented immigrants in 2013. It failed, but Obama attempted to advance some of the legislation administratively by announcing the DACA strategy to shield from deportation individuals brought to the United States illegally as children. He also promulgated the DAPA policy in 2014 to protect the immigrant parents of U.S. citizens and legal permanent residents from expulsion, but the courts blocked its implementation. He presided over a record 410,000 deportations in fiscal year 2012. Obama’s race and status as the son of an immigrant appeared to make the issue of interest to the media.
Immigration was demonstrably a subject of some public interest in 2010, but there was still room for it to be elevated in the list of issues Americans felt were important. Given what could reasonably be called moderate salience, political leaders plausibly believed they had an opportunity to shape mass attitudes on the issue (Geer Reference Geer1996). Many members of the public were presumably willing to search for cues on what positions they should take on an issue that was increasingly in the news (Zaller Reference Zaller1992). A little less than ten percent of respondents to a Gallup poll about the nation’s priorities said they had “no opinion” about the level of immigration into the country, a proportion that was larger than that for many issues related to the economy, health care, foreign affairs, and crime.Footnote 1 Even as late as the 2012 presidential campaign, the topic trailed others like education, health care, “ethical and moral decline,” and Afghanistan and Iraq in Gallup’s “Most Important Issue” poll of October. Concerns about the economy, as was traditional, dominated (Saad Reference Saad2012).
Second, I suggest a sizeable proportion of the public saw Trump’s positions on immigration as clear and distinct from those not only of Democrats such as his predecessor in the White House but those traditionally held by members of the Republican Party and other conservatives. Such unambiguity is an important condition for presidential leadership of public opinion (Druckman and Jacobs, Reference Druckman and Jacobs2009; Geer Reference Geer1996; Kernell Reference Kernell1986; Zaller Reference Zaller1992). Indeed, his views were considered extreme by many (Alamillo, Haynes, and Madrid, Reference Alamillo, Haynes and Madrid2019; Canizales and Vallejo, Reference Canizales and Vallejo2021; Eshbaugh-Soha and Barnes, Reference Eshbaugh-Soha and Barnes2021; Hamlin, Reference Hamlin2021; Schaffner, Reference Schaffner2020; Sides, Tesler, and Vavreck, Reference Sides, Tesler and Vavreck2018). In a highly publicized 2015 speech declaring his presidential candidacy, he labeled many immigrants from Mexico “rapists” and bringers of “crime” and “drugs.” As president, he issued several executive orders regarding immigration, including a ban on visitors from several predominantly Muslim countries. He ended “temporary protected status” for immigrants from designated countries in Latin America, Asia, and Africa, subjecting them to possible deportation. His quest to have Congress pay for a wall along Mexico’s border consumed budget politics in the first two years of his presidency. His policies separating adults and children at the border and forcing asylum seekers to “remain in Mexico” for processing dominated the news for extended periods and were unprecedented and controversial.Footnote 2 Some researchers argue Trump not only changed the public’s understanding of the Republican Party position on immigration, he altered the way it interpreted the party’s basic ideological stance (Hopkins and Noel Reference Hopkins and Noel2022).
Trump was not the first nativist Republican to run for president. Moreover, Wong’s (Reference Wong2017, 110-83) comprehensive analysis of congressional roll-call votes from 2005 to 2014 shows Republicans to be materially and systematically more supportive of restrictive immigration policies than Democrats. Hajnal and Rivera (Reference Hajnal and Rivera2014) share similar views on the Republican Party and immigration policy prior to Trump’s presidential candidacy. But Trump’s approach was substantively and stylistically distinctive. He referred to the issue repeatedly during the 2016 campaign and considerably more than the 2012 Republican nominee, Mitt Romney (Sagir and Mockabee Reference Sagir and Mockabee2023). Trump was vocal in his criticism of fellow Republicans like primary opponents Marco Rubio and Ted Cruz (themselves Latino and sons of immigrants) who had in the past supported efforts to find a way to permit undocumented immigrants to live in the United States legally. The border wall project, of secondary interest to past Republican presidents, was a particular focus, even before Trump took the White House (Merry Reference Merry2022) and congressional Republicans publicly criticized his strategy to promote the wall in exchange for Democratic initiatives on budget policy in 2017 and 2018. As Hamlin (Reference Hamlin2021, 97) argues, “Trump’s particular brand of anti-immigration rhetoric and the sheer volume of measures his administration took to make immigrants’ lives more difficult was unprecedented.” Cox and Rodriguez (Reference Cox and Rodriguez2020, 238) characterize Obama’s approach as “targeted” and “security-focused” that presented a generally positive view of immigration. Trump, on the other hand, “doggedly pursued a maximalist enforcement agenda designed to instill fear among immigrants and promote an insular, racialized conception of our nation” (Cox and Rodriguez Reference Cox and Rodriguez2020, 238).
Trump’s rhetoric during the 2016 campaign also appeared to racialize immigration. Trump the presidential candidate tapped into white Americans’ racial conservatism and used it to move their policy attitudes. Using an experimental design, a study by Newman et al (2021) suggests Trump’s rhetoric emboldened racial conservatives to express previously latent opinions. A similar argument is made by Mason, Wronski, and Kane (Reference Mason, Wronski and Kane2021). Moreover, as Enns and Jardina (Reference Enns and Jardina2021) and Schaffner (Reference Schaffner2020, 11-12) show, Hillary Clinton’s supporters of all races, driven largely by animosity toward her rival, became more liberal on immigration in 2016. Ollerenshaw and Jardina (Reference Ollerenshaw and Jardina2023) argue that even though white Democrats moved to the left on the issue more than did Blacks and Latinos during Trump’s first term, racial and ethnic polarization grew markedly.
Trump, immigration policy attitudes, and motivated reasoning
The theoretical work on presidential leadership of public opinion and critical features of the Trump-immigration case present us with a plausible causal mechanism for a Trump effect on mass attitudes about immigration policy. Trump was an evocative figure who polarized Americans. Immigration was an issue of growing but not principal public concern throughout the first half of the 2010s and, although many of them had unformed or unfixed attitudes, it was one on which citizens knew both that Trump held a position and what that position was. Trump’s stance was perceptibly different from the Republican Party’s apparent collective position on the issue, and he seemed to care more about it than did co-partisans and Democrats. Through a process of motivated reasoning – where individuals use information to reach conclusions consistent with preexisting beliefs (Bisgaard Reference Bisgaard2019; Lodge and Taber Reference Lodge and Taber2013; Taber and Lodge Reference Taber and Lodge2006) – Americans shaped their immigration policy positions, whether anti or pro or conservative or liberal, from their support for or opposition to the polarizing national figure and presidential candidate who first took residence in the White House in 2017. Attitudes toward Trump provided a cognitive “shortcut” for them as they addressed their views of immigration. Whether they sought a way of simplifying a complex policy or were driven to defend their entrenched views of the candidate and president, many Americans, rather than mold immigration positions to their established political identity or broader beliefs, adopted or adapted their views to coincide with their attitudes toward Trump. Given Trump’s significant attention to the issue, moreover, his supporters inordinately believed immigration to be important to the country’s politics.
Related recent work finds partisans use motivated reasoning to direct their views of economic conditions. Republicans, unlike those who identified with the out-party in the past, did not weaken their opposition to Obama when economic conditions improved during his presidency (Donovan et al, Reference Donovan, Kellstedt, Key and Lebo2020). Democrats’ opinions of the economy did not darken when conditions deteriorated either. Instead, views of the president shaped citizens’ assessment of the economic situation. Here, I suggest attitudes toward Obama’s successor had the same effect on Americans’ positions on immigration and the importance they attached to the issue. The key difference is that rather than use party as the motivation for increasingly unwavering support or opposition to a president regardless of shifting circumstances, I take advantage of the distinctive features of the Trump-immigration case in the current era of partisan polarization and hypothesize views of the president and presidential candidate drive policy attitudes above and beyond any effects of party and other traditionally important determinants.
Research strategy
My argument is that support or opposition to a president or presidential candidate can shape a subject’s position on policy. When a prominent political leader makes their opinion on an issue transparent – generally through public statements and their projection in the media, when in office through policymaking – an individual’s support for that leader may result in the adoption of that position as a product of motivated reasoning. Opposition to the leader motivates the citizen to assume an antithetical stance on the issue through the same process. Several anomalous features of the case furnish reasons to believe this was so for attitudes toward Trump and immigration policy during the time he ran for president and occupied the White House. Trump’s position on an issue of growing but not central importance were clear, distinctive, and well-known.
Identifying appropriate empirical tests of such a model is challenging. It is difficult to sequence the relationship, if there is one, between the subject’s attitudes toward the leader and their expressed position on the policy. One approach is to use a panel to determine the order in which the subject adopted their views. Enns and Jardina (Reference Enns and Jardina2021) do this with two observations of survey respondents over the course of the 2016 presidential campaign. They argue Trump did change some of his supporters’ opinions on immigration. Approval for a border wall and deportation grew materially among Trump supporters.
My approach is different. I do not compare the effect of attitudes toward Trump at two specific times, but the effect of attitudes toward Trump with those toward Obama, an adjacent president who could exert a similar kind of independent effect on Americans’ immigration policy preferences. I am not so interested in precise changes in the effect of individuals’ views of Trump on their views of immigration policy, but whether it appears accurate to say these views of Trump had a meaningful effect on their views of immigration in a comparative sense – that is, more than did the equivalent views regarding Obama on immigration policy. This involves some temporal analysis, but it is merely to compare immigration policy attitudes when Obama dominated the political scene with those when Trump was central in Americans’ thoughts. The distinct approach yields broader and somewhat different findings than those generated by the Enns and Jardina (Reference Enns and Jardina2021) analysis.
More specifically, in the first part of my analysis I take large national surveys, fielded regularly throughout the 2010s, that routinely asked a battery of questions about subjects’ immigration policy attitudes. This is not a panel, but there are upwards of 50,000 subjects in each survey and a significant proportion of them responded to questions about immigration. I compare aggregated results generated by the surveys in the Obama years with those of the Trump years.
The other part of the empirical analysis centers around 2016 and the election when Trump was on the ballot and Obama still in the White House. I use two surveys that asked respondents about their vote in the election and their approval of Obama’s job performance. I am particularly interested in leveraging those with inconsistent views about the two figures – that is participants who supported both Obama and Trump and who opposed both of them – to gauge the effect views of the outgoing president and the presidential candidate had on both immigration and trade policy attitudes. Views of trade furnish a useful comparison because scholars have previously found what they consider a material “Trump effect” on the issue (Essig et al Reference Essig, Xu, Garand and Keser2021). The 2016 surveys provide a good test of the influence of views of Trump because they record immigration and trade attitudes at the same time subjects express their opinions of Obama. These opinions of Trump and Obama are not historical or a function of a respondent’s retrospective assessment.
My approach here is like that of Barber and Pope (Reference Barber and Pope2019). They, however, used a survey experiment and asked respondents if they approved of a policy of holding families arrested by border patrol together in a detention facility. They advised a third of the sample this was Trump’s policy at the time and a third that it had been Obama’s during his administration. The authors found that Democrats moved about a point along a five-point scale in opposition when exposed to the Trump treatment compared to the Obama treatment and Republicans moved about one-third of a point in favor of the policy when manipulated the same way. This does not tell us much about the magnitude of any actual Trump effect, but it does suggest support of or opposition to both Obama and Trump shape immigration attitudes.
Hypotheses
This theoretical work and my research strategy generate four hypotheses I test in the remainder of the paper in my endeavor to evaluate the character and magnitude of any Trump effect. The first states that Trump’s divisive nature and clear and distinctive position on immigration make it more likely citizens’ evaluation of him drove their attitudes about the issue more than did their assessment of Obama. Attitudes toward Trump are more likely to polarize views of immigration policy than attitudes toward Obama.
H1a: Supporters of Trump are more likely to favor more anti-immigration policies than opponents of Obama. H1b: Opponents of Trump are more likely to favor more pro-immigration policies than supporters of Obama.
The second hypothesis extends from the contention that Trump’s positions on immigration were particularly distinct and well-known meaning that his supporters and opponents were more likely to form their views of the policy from their attitudes about him than they were other issues. As noted above, the issue I use to compare the Trump effect on immigration with is trade.
H2: Attitudes about Trump are more likely to polarize attitudes regarding immigration policy than they are trade policy.
The third hypothesis is a function of what many scholars see as the racialized nature of Trump’s immigration policy stances (Enns and Jardina Reference Enns and Jardina2021; Mason, Wronski, and Kane Reference Mason, Wronski and Kane2021; Newman 2021; Schaffner Reference Schaffner2020). If there is a material Trump effect brought about by motivated reasoning on immigration attitudes in a racially polarizing manner, then his white supporters should be particularly persuaded by his anti-immigration positions and Black and Latino opponents repelled by them. The effect should be above any brought about by Obama’s positions and any additional effect his race had on the policy debate when he was president – combined effects that are in the same direction as Trump’s, here whites who do not share Obama’s race being more likely to oppose his positions and Blacks, if not Latinos, who do share his race being more likely to be positively influenced by his views.Footnote 3
H3a: White supporters of Trump are more likely to favor more anti-immigration policies than white opponents of Obama. H3b: Black and Latino opponents of Trump are more likely to favor more pro-immigration policies than Black and Latino supporters of Obama.
The fourth hypothesis tests whether, given the former’s publicized and distinctive positions on the issue, support for Trump increased immigration’s importance in citizens’ minds more than did opposition to Obama.
H4: Supporters of Trump are more likely than opponents of Obama to believe immigration is an important issue.
Did Trump “move” immigration policy attitudes more than did Obama?
The entire 2010s
To test this first hypothesis, I compare the extent to which, over the course of the decade, opinions about Trump and Obama shaped individuals’ attitudes toward immigration policy. If the views of Trump supporters and opponents are more polarized than those of Obama supporters and opponents, we have evidence consistent with the first hypothesis and a Trump effect. To do this, I use responses to a series of questions on the issue of immigration in the Cooperative Election Study (CES) in every election year from 2010-20.Footnote 4 I list the questions, to which all have binary answers, in supplemental materials Appendix A, along with responses I consider “anti-immigration.” These are not panel data, and the respondents changed from year-to-year. The questions also change somewhat over the period, but I think we can make an argument they provide comprehensive insight into Americans’ positions on the immigration matters of most interest at the time they were asked.
Because these questions evolve in response to events and political developments, the dependent variable is the principal factor generated by an analysis of survey participants’ responses to all the immigration items in a year. I report eigenvalues of the first factor and the proportion of the variance it explains in Appendix A alongside the questions. The analysis reveals a single factor explains a majority of the variance in each year. Because I give greater values to what I call anti-immigration responses, higher scores on the factor indicate a generally anti-immigration stance on the subject’s part.Footnote 5
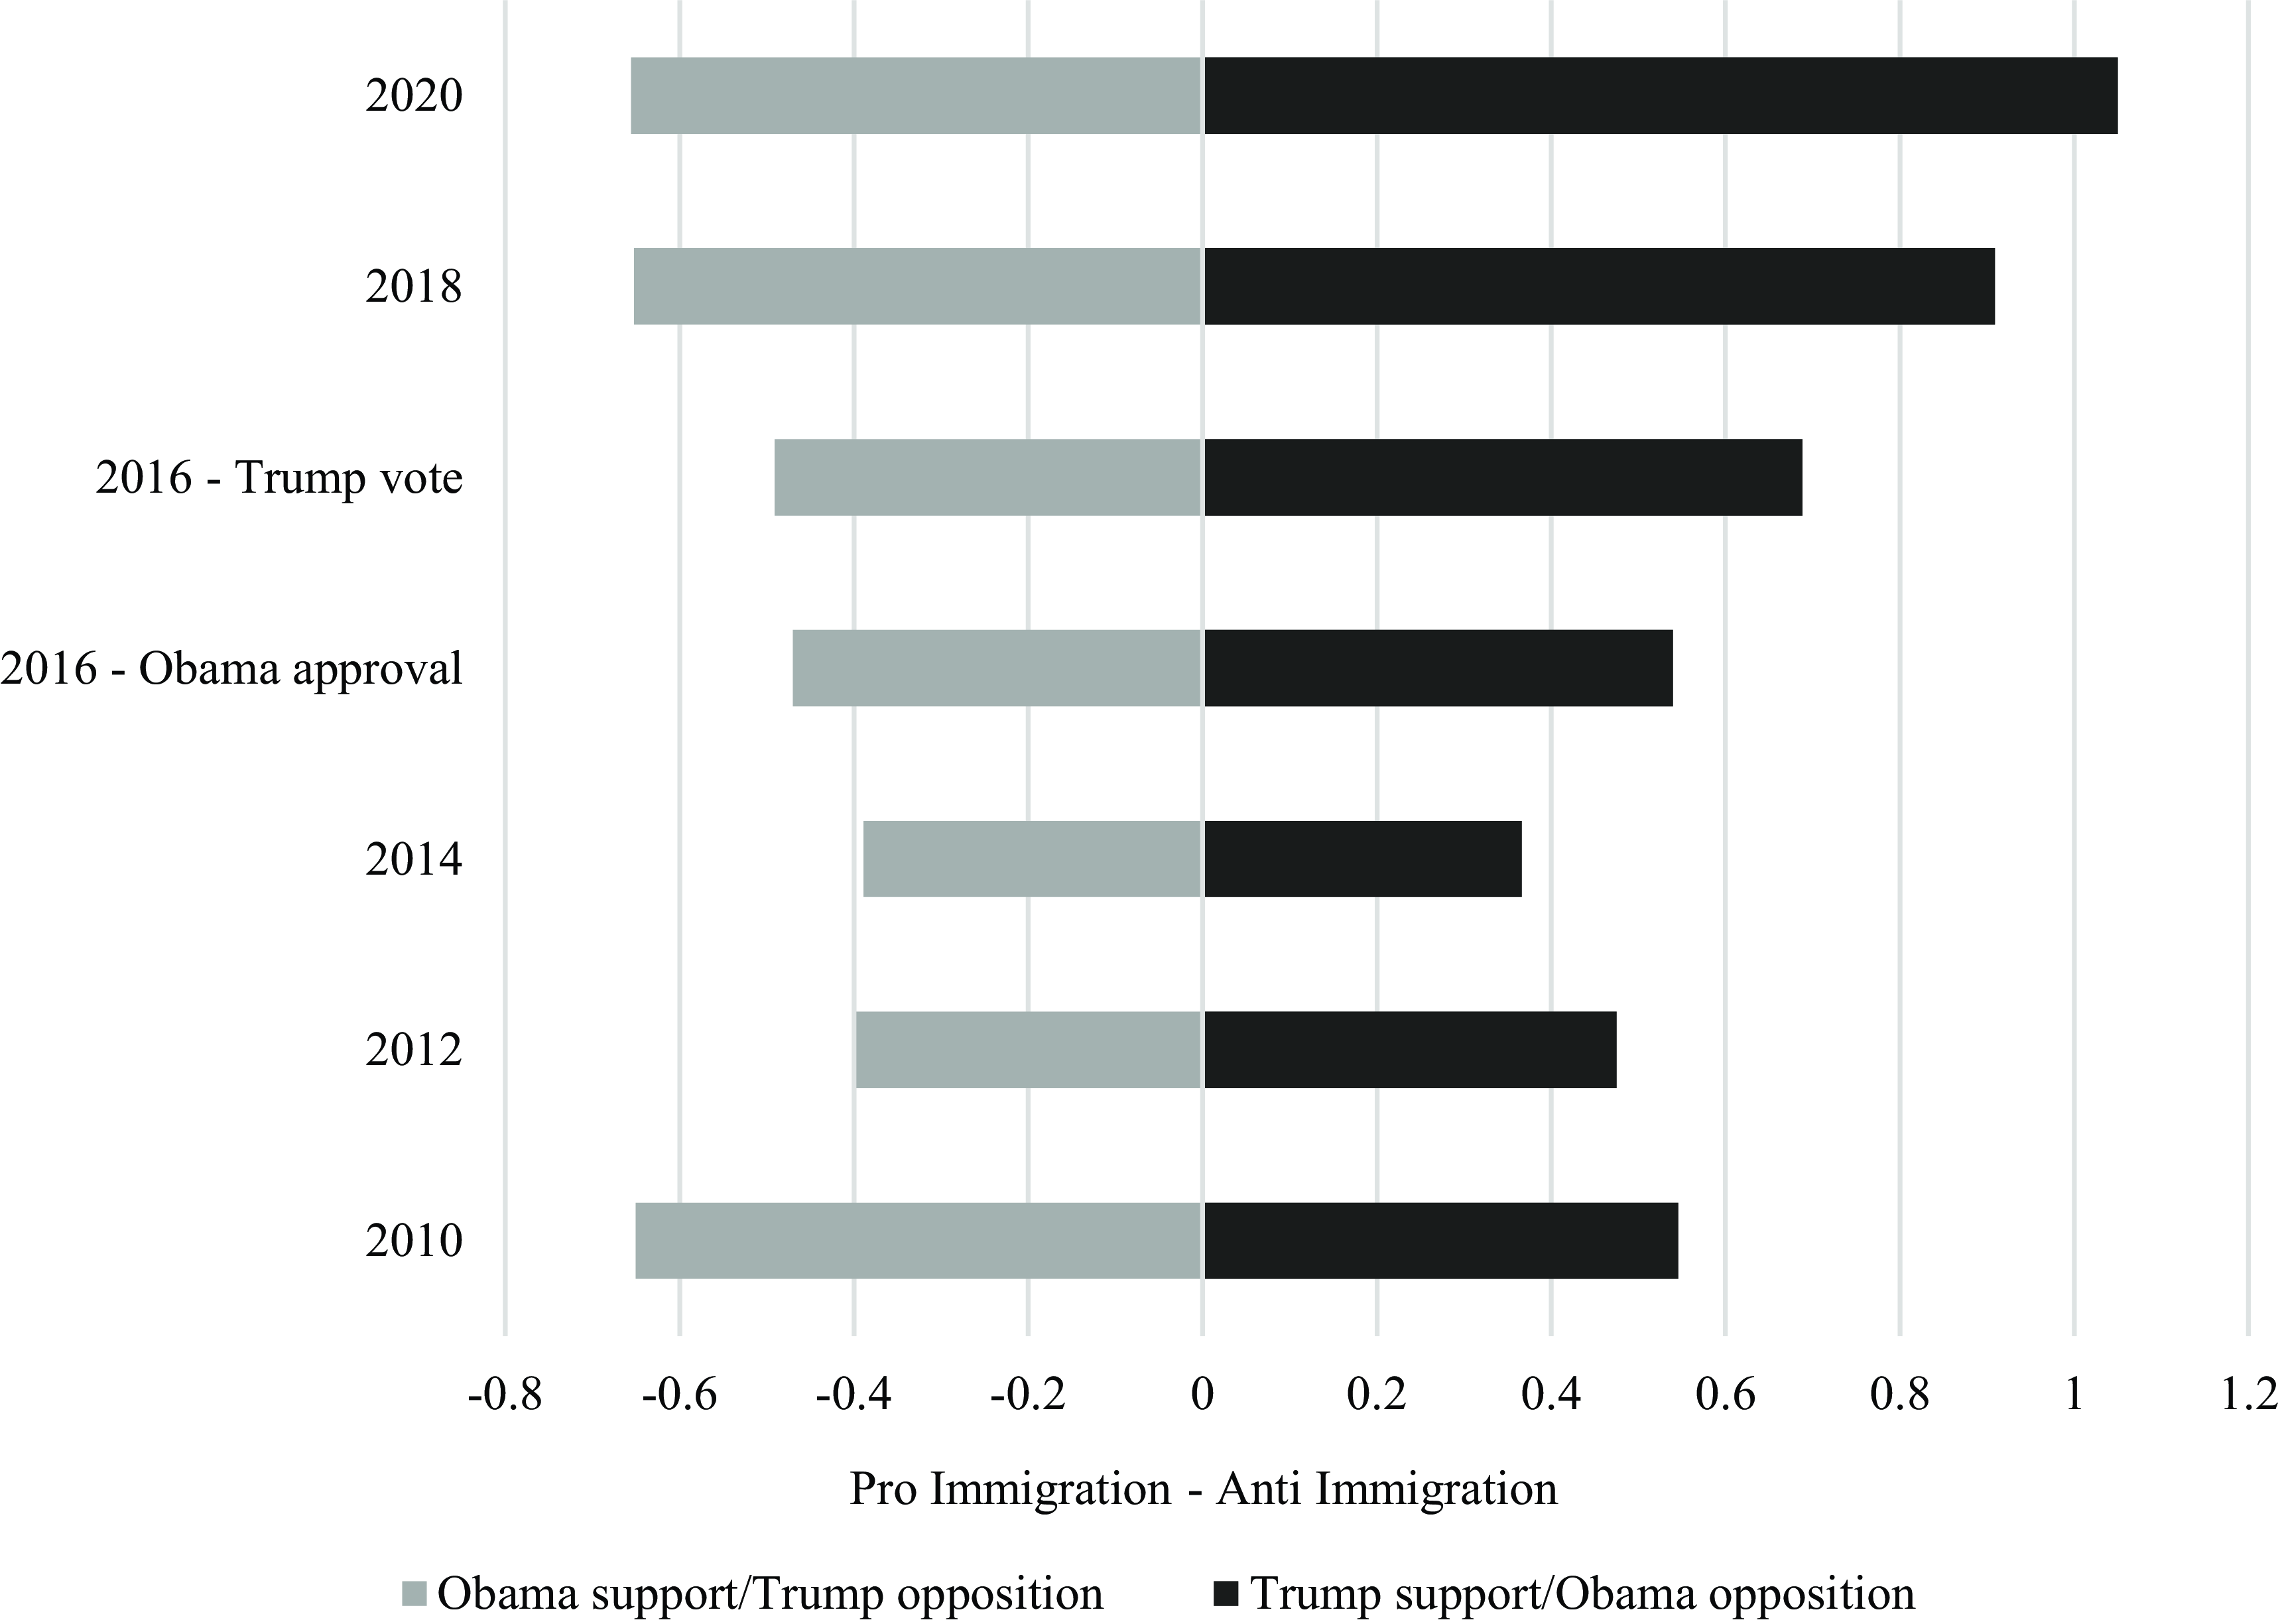
In a first test, I examine and compare the polarization of immigration attitudes under Obama and Trump. In the election years of 2012 and 2020, I look at whether the individual voted for Obama or Trump; in the years 2010, 2014, and 2018, whether they approved of the job the sitting president was doing. In 2016, I use both the vote for Trump and Obama’s job approval. Figure 1 shows the means of individuals’ factor scores when standardized as z-scores for Obama supporters/Trump opponents and Obama opponents/Trump supporters from 2010-20. The further these scores are away from zero, the less representative of the entire survey sample the group’s immigration attitudes are. Trump supporters and opponents were more polarized in 2018 and 2020 than were Obama supporters and opponents from 2010-14, although respondents noticeably polarize by support for Obama in the 2010 midterm. Much of this is driven by the greater distinctiveness of Trump supporters who appear to have moved more to the right on immigration since the Obama years than Trump opponents have moved to the left. Interestingly, Trump voters and those who did not vote for Trump in 2016 are more polarized than those who approved and did not approve of Obama. Although the 2016 finding says nothing about whether a vote for Trump made someone more anti-immigration than a vote against him moved them in a pro-immigration direction, it does suggest any Trump effect is greater than its Obama equivalent at the time and is therefore consistent with the first hypothesis.
Mean factor Z-scores of Obama supporters/Trump opponents and Trump supporters/Obama opponents, 2010-20.
Sample sizes are, 2010 = 55,400; 2012 = 54,535; 2014 = 56,200; 2016 = 64,600; 2018 = 58,341; 2020 = 60,814.
I turn now to a multivariate analysis of immigration attitudes. Table 1 presents the results of a regression model of respondents’ factor scores on the immigration policy attitudes scale with views of Obama and Trump as the key independent variables. I use a comprehensive battery of intuitively important controls. These variables are: self-reported ideology (five-point, “very liberal” to “very conservative” with “moderate” as the midpoint), party (three-point, “Democrat” to “Republican” with “independent” midpoint), Black race (non-Black and Black), Latino ethnicity, gender, marital status, age, education (six-point, “no high school” through “post-graduate education”), family income (16 categories), residency in the South, and religiosity (“How important is religion to you?,” “not at all important,” “not too important,” “somewhat important,” or “very important”). To make it easier to compare coefficients, I code cases that do not approve of or vote against Obama as I do those who approve of or vote for Trump – that is, approving of/voting for Trump and not approving of/voting against Obama are coded “1,” not approving of/voting against Trump and approving of/voting for Obama are coded “0.”Footnote 6 Statistically significant positive coefficients are indicative of a direct material effect opposition to Obama or support for Trump have on policy attitudes in the anti-immigration direction and vice-versa. A positive coefficient associated with the Trump responses that is larger than the Obama equivalent is evidence consistent with a Trump effect and the first hypothesis.
The effects of Trump and Obama support on immigration policy attitudes, CES 2010-20
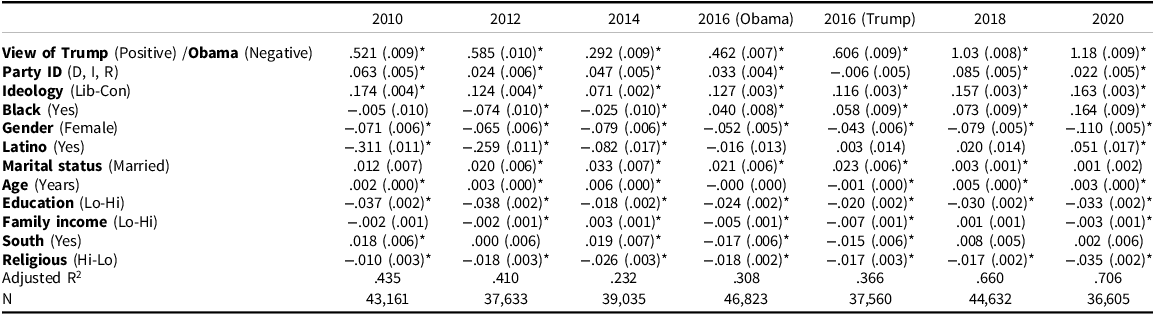
I report unstandardized coefficients with standard errors in parentheses. Trump/Obama variable is dichotomous with support for Trump and opposition to Obama coded with the higher value. The control variables are: self-reported ideology (five-point, “very liberal” to “very conservative” with “moderate” as the midpoint), party (three-point, “Democrat” to “Republican” with “independent” midpoint), Black race (non-Black and Black), Latino ethnicity, gender, marital status, age, education (six-point, “no high school” through “post-graduate education”), family income (16 categories), residency in the South, and religiosity (“How important is religion to you?,” “very important,” “somewhat important,” “not too important,” or “not at all important”). Data are vote in the presidential election year and approval in the non-presidential election year (and for Obama in 2016). The dependent variable is respondent’s factor score. CES “vv” Weight used as unreported control. Method is OLS regression, *=p < .05.
It is clear in every year views of the presidents are strongly related to attitudes about immigration policy beyond any influence exerted by factors such as party identification and self-reported ideology. Note, however, that the magnitude of the Trump variable is particularly large in 2018 and 2020. This is consistent with the analysis presented in Figure 1. In these years, it is roughly double that of views of Obama in 2010, 2012, and 2014. An assessment of Trump also has a larger effect than that of Obama in 2016. Although this is not a panel analysis and I do not theorize about precise temporal change, it is notable the Trump effect appears greater in 2018 and 2020 than in 2016. The ranges and means of the dependent variable differ slightly because, as Appendix A shows, there are different numbers of immigration policy questions each year. But they are similar enough – there are five each in 2014, 2018, and 2020 and six in 2012, for example – to suggest that the different sizes of the coefficients convey meaningful differences in effect magnitude.
Trump’s focus on immigration throughout his presidency presumably explains the increase. As his presidency unfolded and the media paid more attention to his views on the issue, it is plausible support for Trump was tightly linked to policies inimical to immigrants and immigration and his positions grew increasingly distinguishable from those attributed to other conservatives and Republicans, regardless of any greater salience the issue enjoyed. Indeed, the questions asked by CES in 2018 and 2020 seem “grabbed from the headlines” made by Trump during his years in the White House – they are on topics like a border wall, reducing legal immigration, withholding funds from police departments that do not report illegal immigrants, and DACA, among others. The proportion of variance explained by the first factors in 2018 and 2020, at .594 and .580, respectively, is considerably higher than in any other year except 2010 (.604) when there were only three immigration items on the survey. Moreover, the model goodness-of-fit is considerably stronger in 2018 and 2020 than the other years (adjusted R2 of .66 and .71). It is possible Trump’s presentation of the issue clarified it for Americans. Although Obama supporters were strongly pro-immigration, his record on the issue may have appeared less clear than his successor’s – deportations of criminals and recent border crossers increased significantly under Obama, for example. It could have attenuated any polarization Obama brought to the issue.Footnote 7 All of this is evidence consistent with the first hypothesis and a Trump effect on the substance of people’s immigration policy attitudes.
The case of 2016
A second test of the first hypothesis deploys surveys fielded in 2016 that asked participants about their views of Obama and whether they voted for Trump. This permits a direct comparison of the magnitude of any effects on immigration attitudes generated by views toward Obama with those engendered by opinions about Trump. Attitudes and votes related to Obama and Trump correlate negatively. But there were people in the CES survey who did not approve of Obama and said they did not vote for Trump or approved of Obama and said they voted for Trump –to be precise, 1,698 or 3.6 percent in the former category and 1,364 or 2.9 percent in the latter category. I leverage these respondents and their attitudes about immigration policy. If those who voted for Trump take more anti-immigration positions than those who did not approve of Obama, we have evidence attitudes toward Trump apply greater effect. If those who approved of Obama take more pro-immigration policy views than those who voted against Trump, we have evidence consistent with an interpretation attitudes toward Obama apply greater effect. Moreover, we can compare the variance in the responses between those who voted for and those who voted against Trump with those who approved of and those who did not approve of Obama. If we see materially greater variance in immigration policy views between those who voted for and against Trump, we have evidence consistent with the first hypothesis and compatible with a discernible Trump effect – that is one that is greater than any Obama effect. In this way, 2016 provides a “head-to-head” test of the relative effects of views of Obama and Trump on immigration policy attitudes.Footnote 8
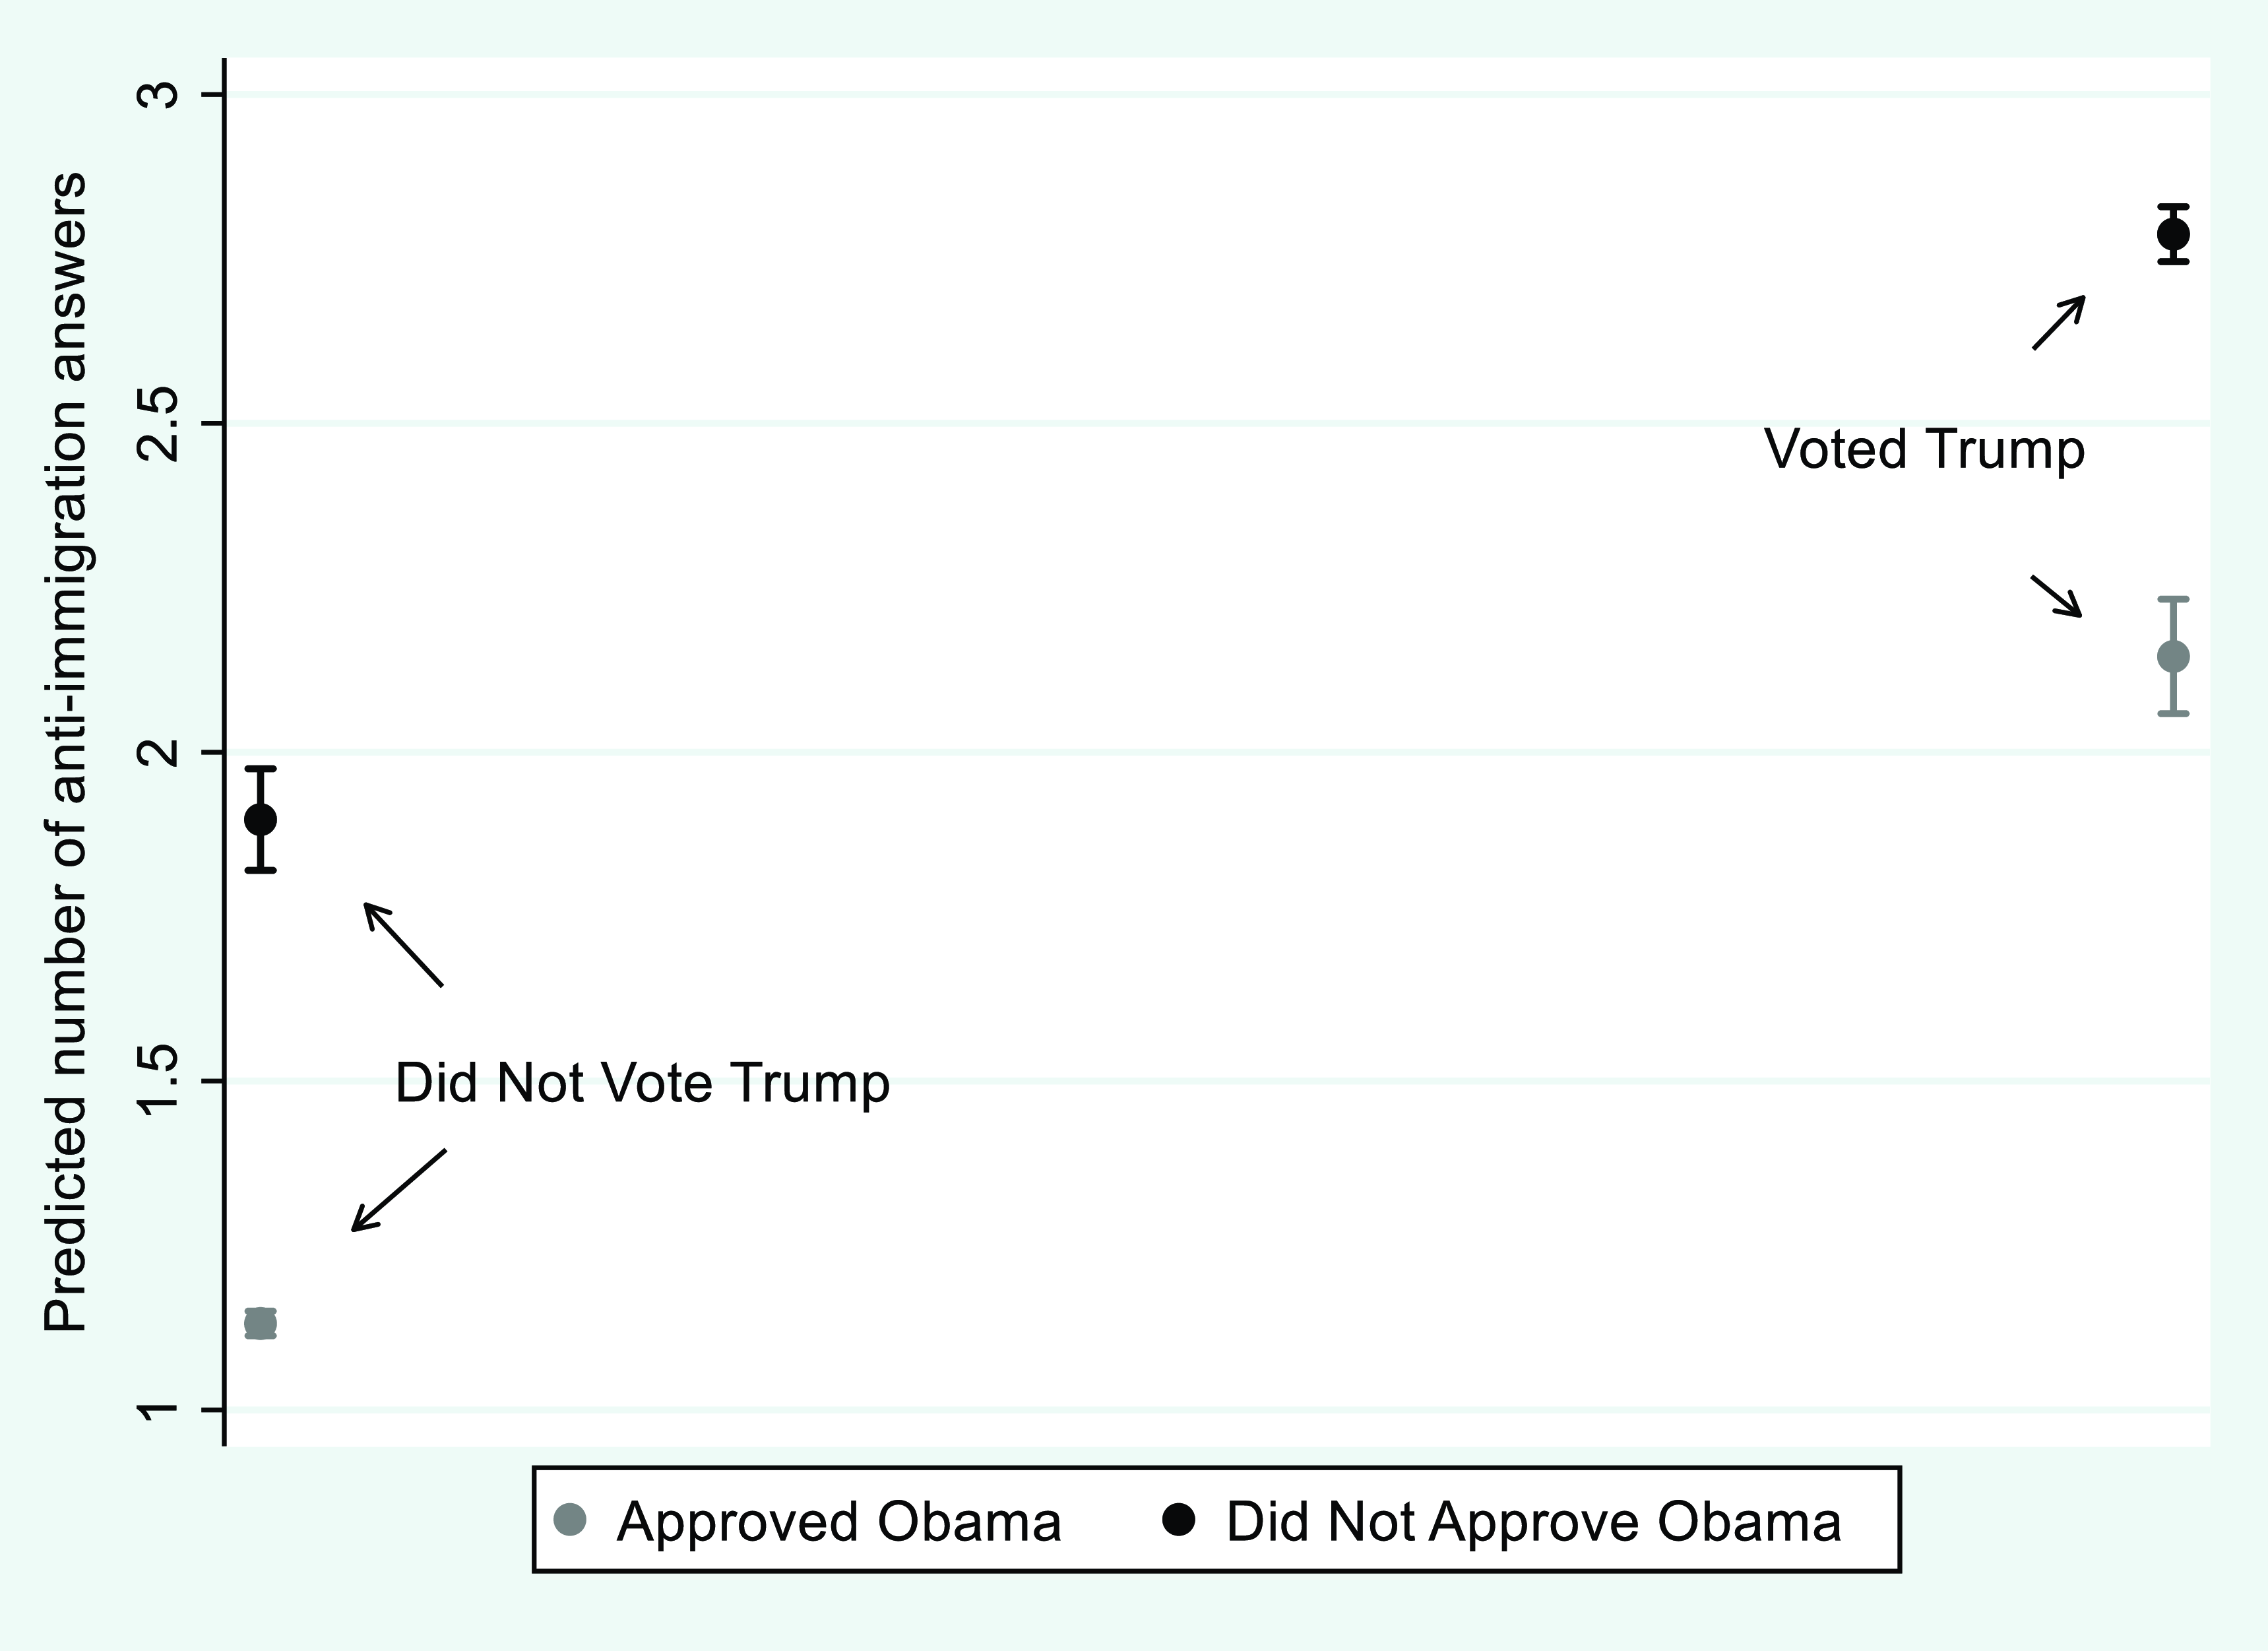
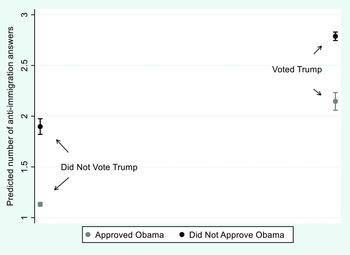
Figure 2 shows the predicted number of anti-immigration answers to the four 2016 CES survey questions when a dichotomous indicator of Obama approval is interacted with a dichotomous measure of the vote for Trump in the multivariate model used above. The method here is Poisson regression. The findings suggest any Trump effect is slight and modest beyond that generated by not approving of Obama. This is consistent with the first hypothesis. Those who did not approve of Obama provide about 0.7 more of an anti-immigration answer than those who approved of the job he was doing and those who voted for Trump just less than one more answer than those who did not. Moreover, those who voted for Trump and approved of Obama supplied more anti-immigration answers than those who did not vote for Trump and did not approve of Obama – 2.15 to 1.90 to be precise (it is clear the difference is beyond the 95% confidence interval). The full model results are in supplemental materials Appendix B.
The effects of Trump vote and Obama approval on the predicted number of anti-immigration responses, 2016.
Figure shows predicted number of anti-immigration responses to four questions when vote for or against Trump is interacted with approval/disapproval of Obama. Data are from the 2016 CES. Method is Poisson regression. Capped lines mark 95% confidence intervals.
Did Trump “move” immigration policy attitudes more than attitudes about trade?
The American National Election Studies (ANES, American National Election Studies 2019) also asked respondents about their views of immigration in 2016.Footnote 9 On the surface, ANES appears a less desirable option for analysis because it has many fewer respondents than CES, by way of illustration 100 participants approved of Obama and voted for Trump and 106 did not approve of Obama and did not vote for Trump – approximately four percent of the survey’s subjects in each case. The survey did however provide useful ordinal indicators of respondents’ attitudes toward immigration that permit investigation of the likelihood of providing extreme positions popularly associated with Trump. It also fielded questions about trade. Trade is a particularly useful benchmark to compare any effects of attitudes toward Trump on immigration. Scholars have made a persuasive case that many Americans’ attitudes about Trump shifted their positions on trade materially beyond those explained by factors like ideology and partisanship – and, by inference, attitudes about Obama. Using the 2016 ANES, Essig et al (Reference Essig, Xu, Garand and Keser2021) show that the trade policy views of those who felt warmly toward Trump – especially those with high levels of political knowledge – were more likely to adopt the then-presidential candidate’s transparently protectionist views than were other Republicans and subjects with “nationalist” attitudes. If any Trump effect beyond an Obama effect on immigration is approximately as large as that felt on trade, we can reasonably present it as evidence consistent with the second hypothesis.
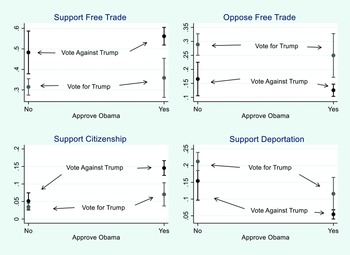
I use ANES versions of the controls from the model specifications of the CES data. These are: self-identified ideology (seven-point scale rising to “very conservative”), gender, Black race, Latino ethnicity, marital status, age, education, family income (28 categories), residency in the South, and religiosity (“Is religion an important part of your life?,” with “no” coded higher). I examine the determinants of responses to questions on immigration and trade and interact measures of Trump vote and Obama job approval to compare the magnitude, relative to one exerted by Obama, of attitudes about Trump on these issues. The trade question asks respondents whether they “favor” or “oppose” “free trade agreements with other countries” and has a “neither favor nor oppose” midpoint. The immigration question provides four responses ranging from a pro-immigration pole having government allow “all unauthorized immigrants to remain and eventually qualify for citizenship without penalties” to an anti-immigration pole where government should “make all unauthorized immigrants felons and send them back to their own country.” Full details of the ANES questions and coding can be found in supplemental materials Appendix C. Figure 3 reveals the estimates from an ordered logit estimation. The upper panel reports the predicted probability of a respondent supporting or opposing free trade, the lower panels the most “liberal” and most “conservative” positions on the immigration question. I present full model specification results in supplemental materials Appendix D.
The effects of Obama approval and Trump vote on the probability of supporting and opposing free trade and supporting citizenship and deportation for unauthorized immigrants, 2016.
Figure shows predicted probabilities on responses when vote for or against Trump is interacted with approval or disapproval of Obama. Data are from the 2016 ANES. Capped lines mark 95% confidence intervals.
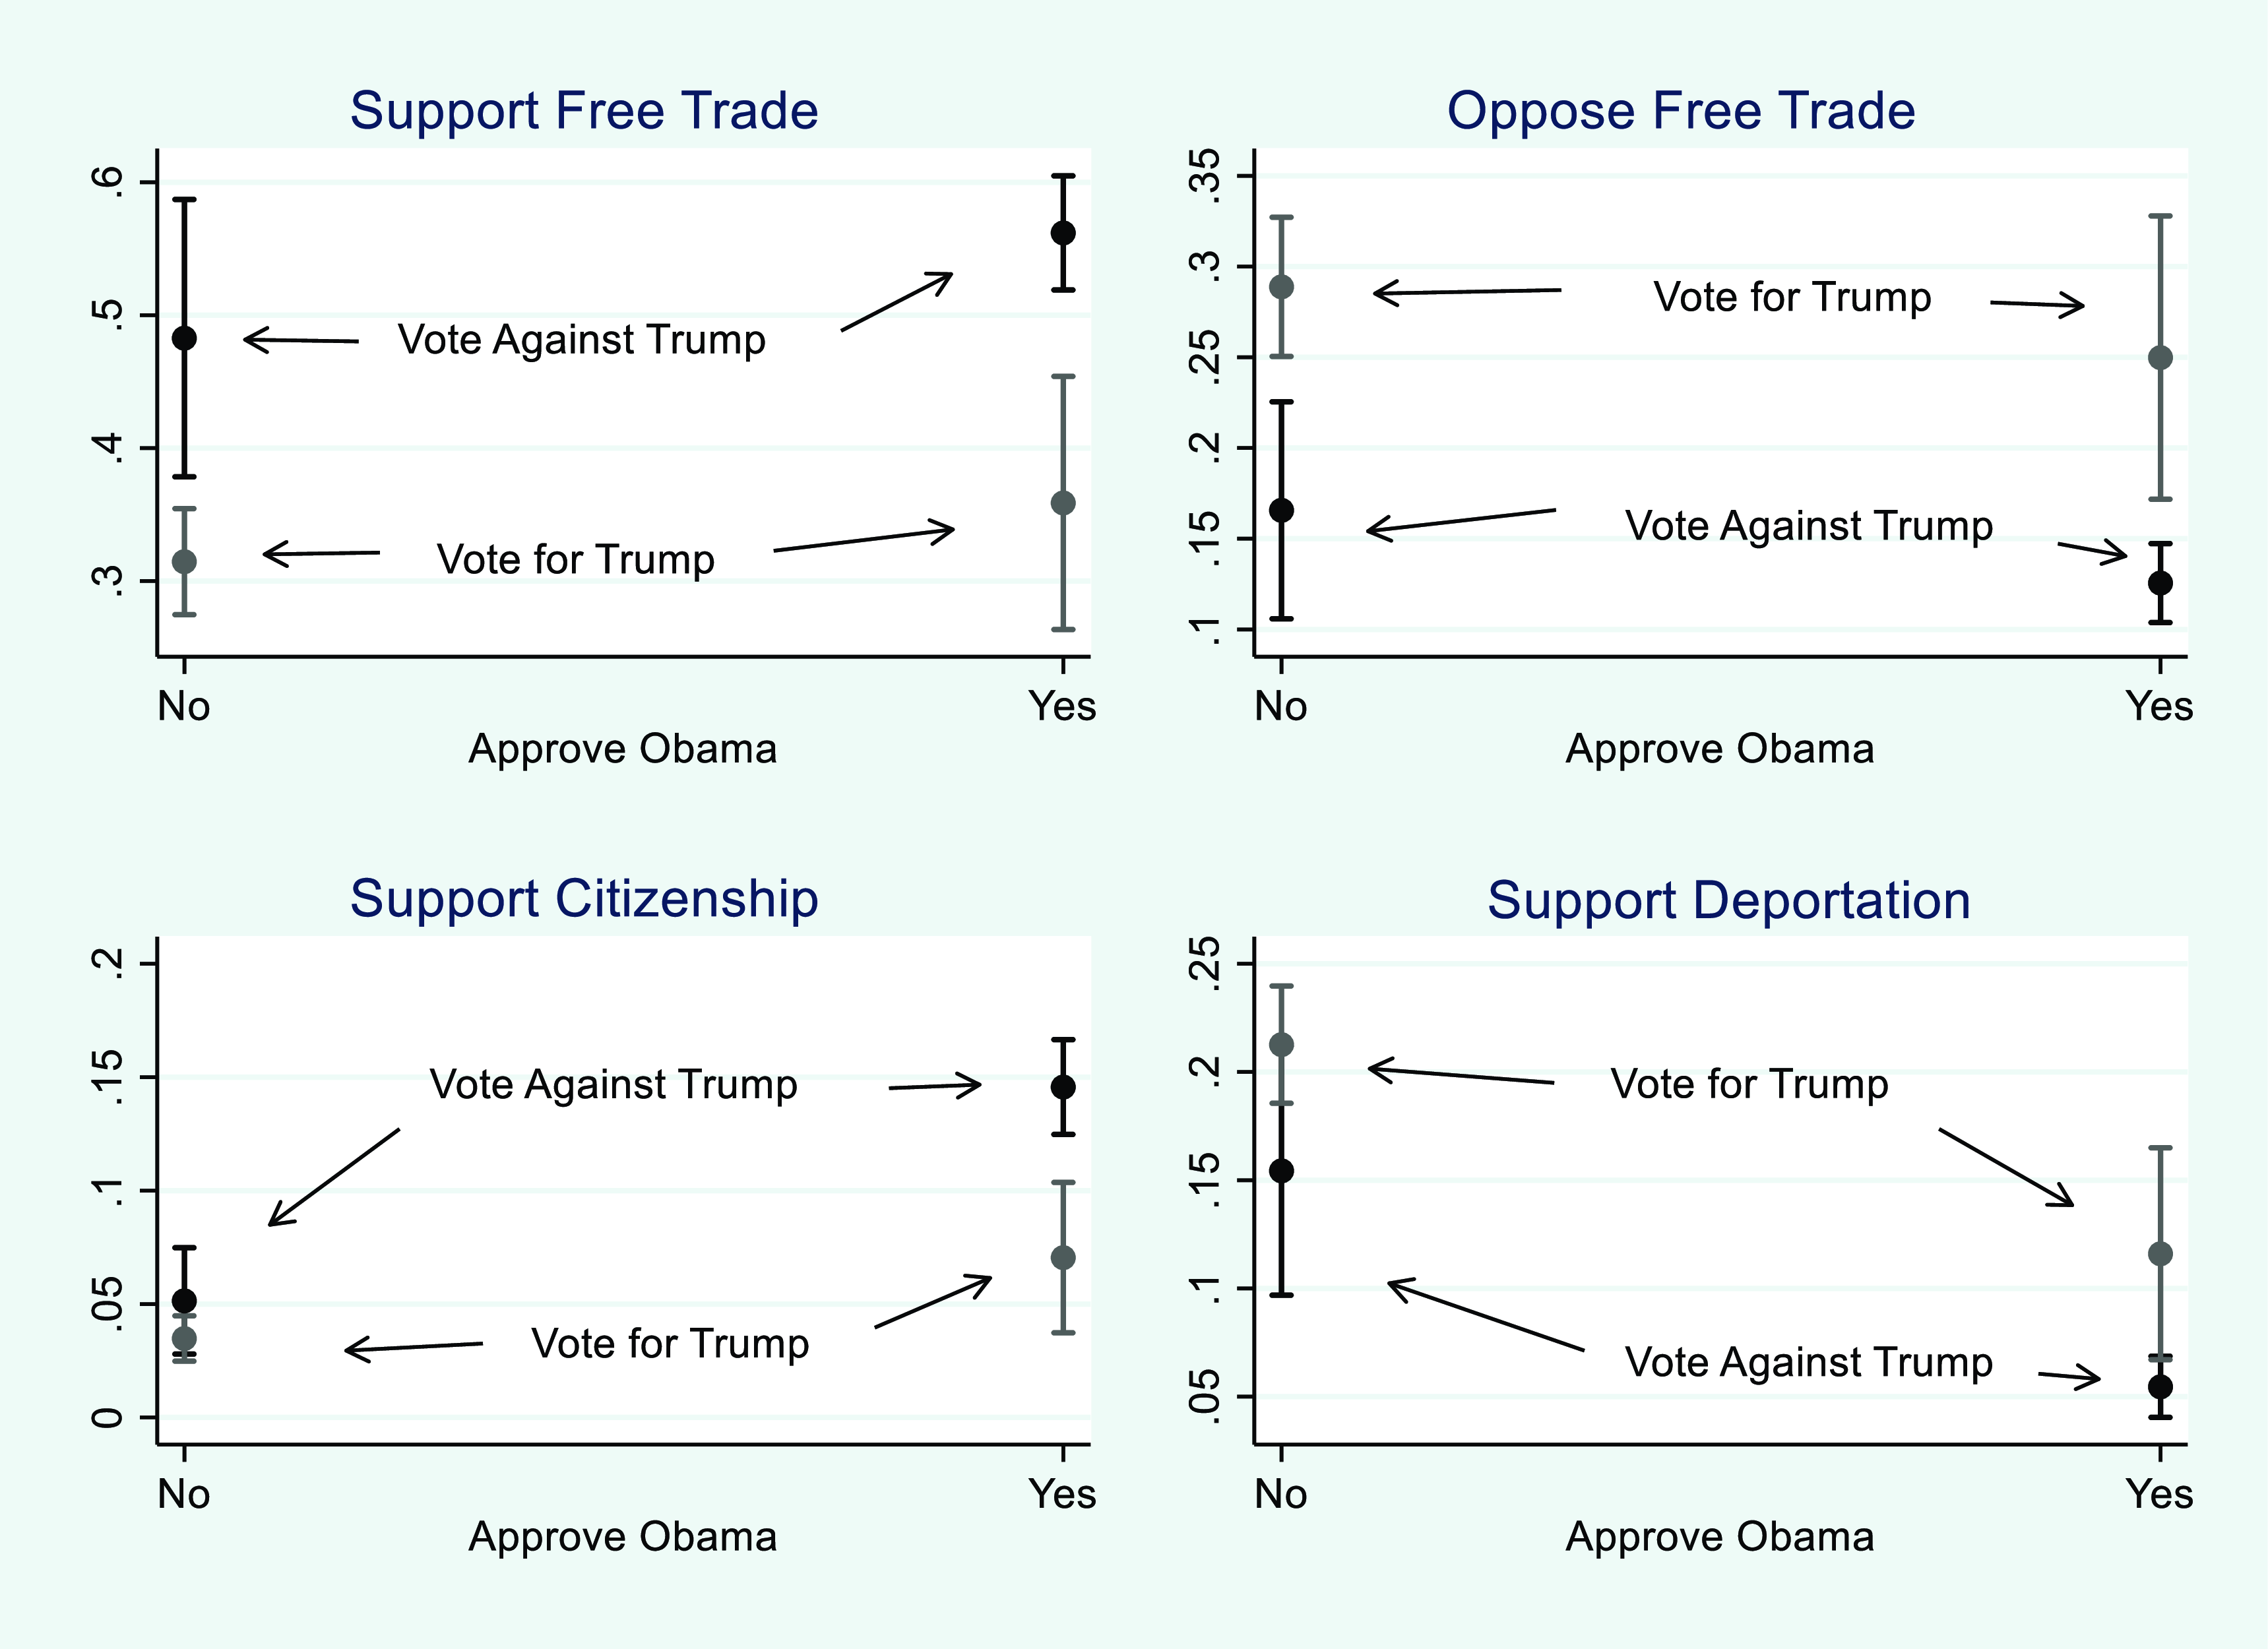
The findings show Obama approval does not condition the effect of a Trump vote on trade policy attitudes and Trump voters are discernibly more likely to oppose free trade and less likely to support free trade regardless of their feelings toward Obama – the former by about 10-15 percentage points, the latter by about 15–20 percentage points. When compared to attitudes toward Obama, any effect opinions of Trump had on immigration policy views is therefore considerably less than that exerted on trade in the same survey. An explanation for the different sizes of the effects is speculative, but it may be because respondents perceived Trump as representing a larger change from the established Republican position on trade than he did on immigration policy. Although we are looking solely at 2016 here, this is evidence inconsistent with the second hypothesis.
It should be noted, however, these results are, if anything, contrary to the first hypothesis. Whereas the Trump vote did condition the effect of Obama approval on the probability of a respondent suggesting the government should “permit unauthorized immigrants to remain and eventually qualify for citizenship without penalties” (support citizenship), the Trump voters who did not approve of Obama were no more likely to oppose citizenship than those who approved of the sitting president’s job performance. Indeed, approving of Obama increases the probability of a non-Trump voter doing so by about ten percentage points, the effect of voting against Trump by an individual who approves of Obama by only about seven percentage points. Any Obama effect is even greater when we look at support for deportation (“the government should make all unauthorized immigrants felons and send them back to their own country”). When holding the Trump vote constant, approval of Obama reduces support for deportation by a statistically significant approximately ten percentage points. When holding support for Obama constant, the Trump vote increases support for deportation by about seven percentage points, but this effect cannot be confidently distinguished from zero. Together with the results in the previous section, this analysis suggests the Trump effect on Americans’ immigration policy preferences was dynamic and grew after 2016.
Did Trump “move” white supporters’ immigration attitudes to the right and those of minority opponents to the left?
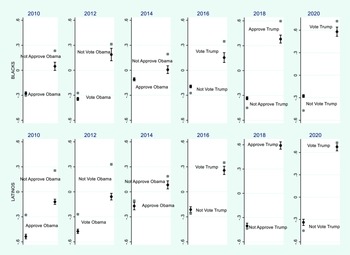
The third hypothesis asserts we should expect views of Trump to polarize immigration attitudes along racial and ethnic lines, with his white supporters more anti-immigration and his Black and Latino opponents more pro-immigration than they were relative to one another during the Obama years. I report the results of this test in Figure 4, which plots the coefficients for the variables of Black race and Latino ethnicity in the models presented in Table 1. The dependent variable is the principal factor scores, with high values denoting anti-immigration positions, of a respondent’s immigration policy attitudes in each biennial survey from 2010-20. The multivariate analysis using controls for attitudes toward Obama and Trump, party identification, ideology, gender, marital status, age, education, family income, residence in the South and religiosity is undertaken using OLS regression. The results for 2010-14 appear quite different from 2016-20. During the three Obama years, Blacks and Latinos are less anti-immigration than, respectively, non- Blacks (whites, Latinos, others) and non-Latinos (whites, Blacks, others). When Trump is on the scene, however, Blacks are, after controlling for factors like party and ideology, materially more anti-immigration than non-Blacks and Latinos are materially more anti-immigration than they were before that time.Footnote 10 While Trump’s presence seemed to polarize Americans further on the issue of immigration, the camps they formed were not as racially or ethnically distinct as they had been when his Democratic predecessor was in office. This is contrary to the second hypothesis about the racial nature of the polarization over immigration during the Trump years.
The effects of black race and Latino ethnicity on anti-immigration attitudes, 2010-20.
Regression coefficient of Black race and Latino ethnicity variables for each year. Data are from CES. Dependent variable is score on principal factor. High scores denote more anti-immigration attitudes. Capped lines mark 95% confidence intervals.
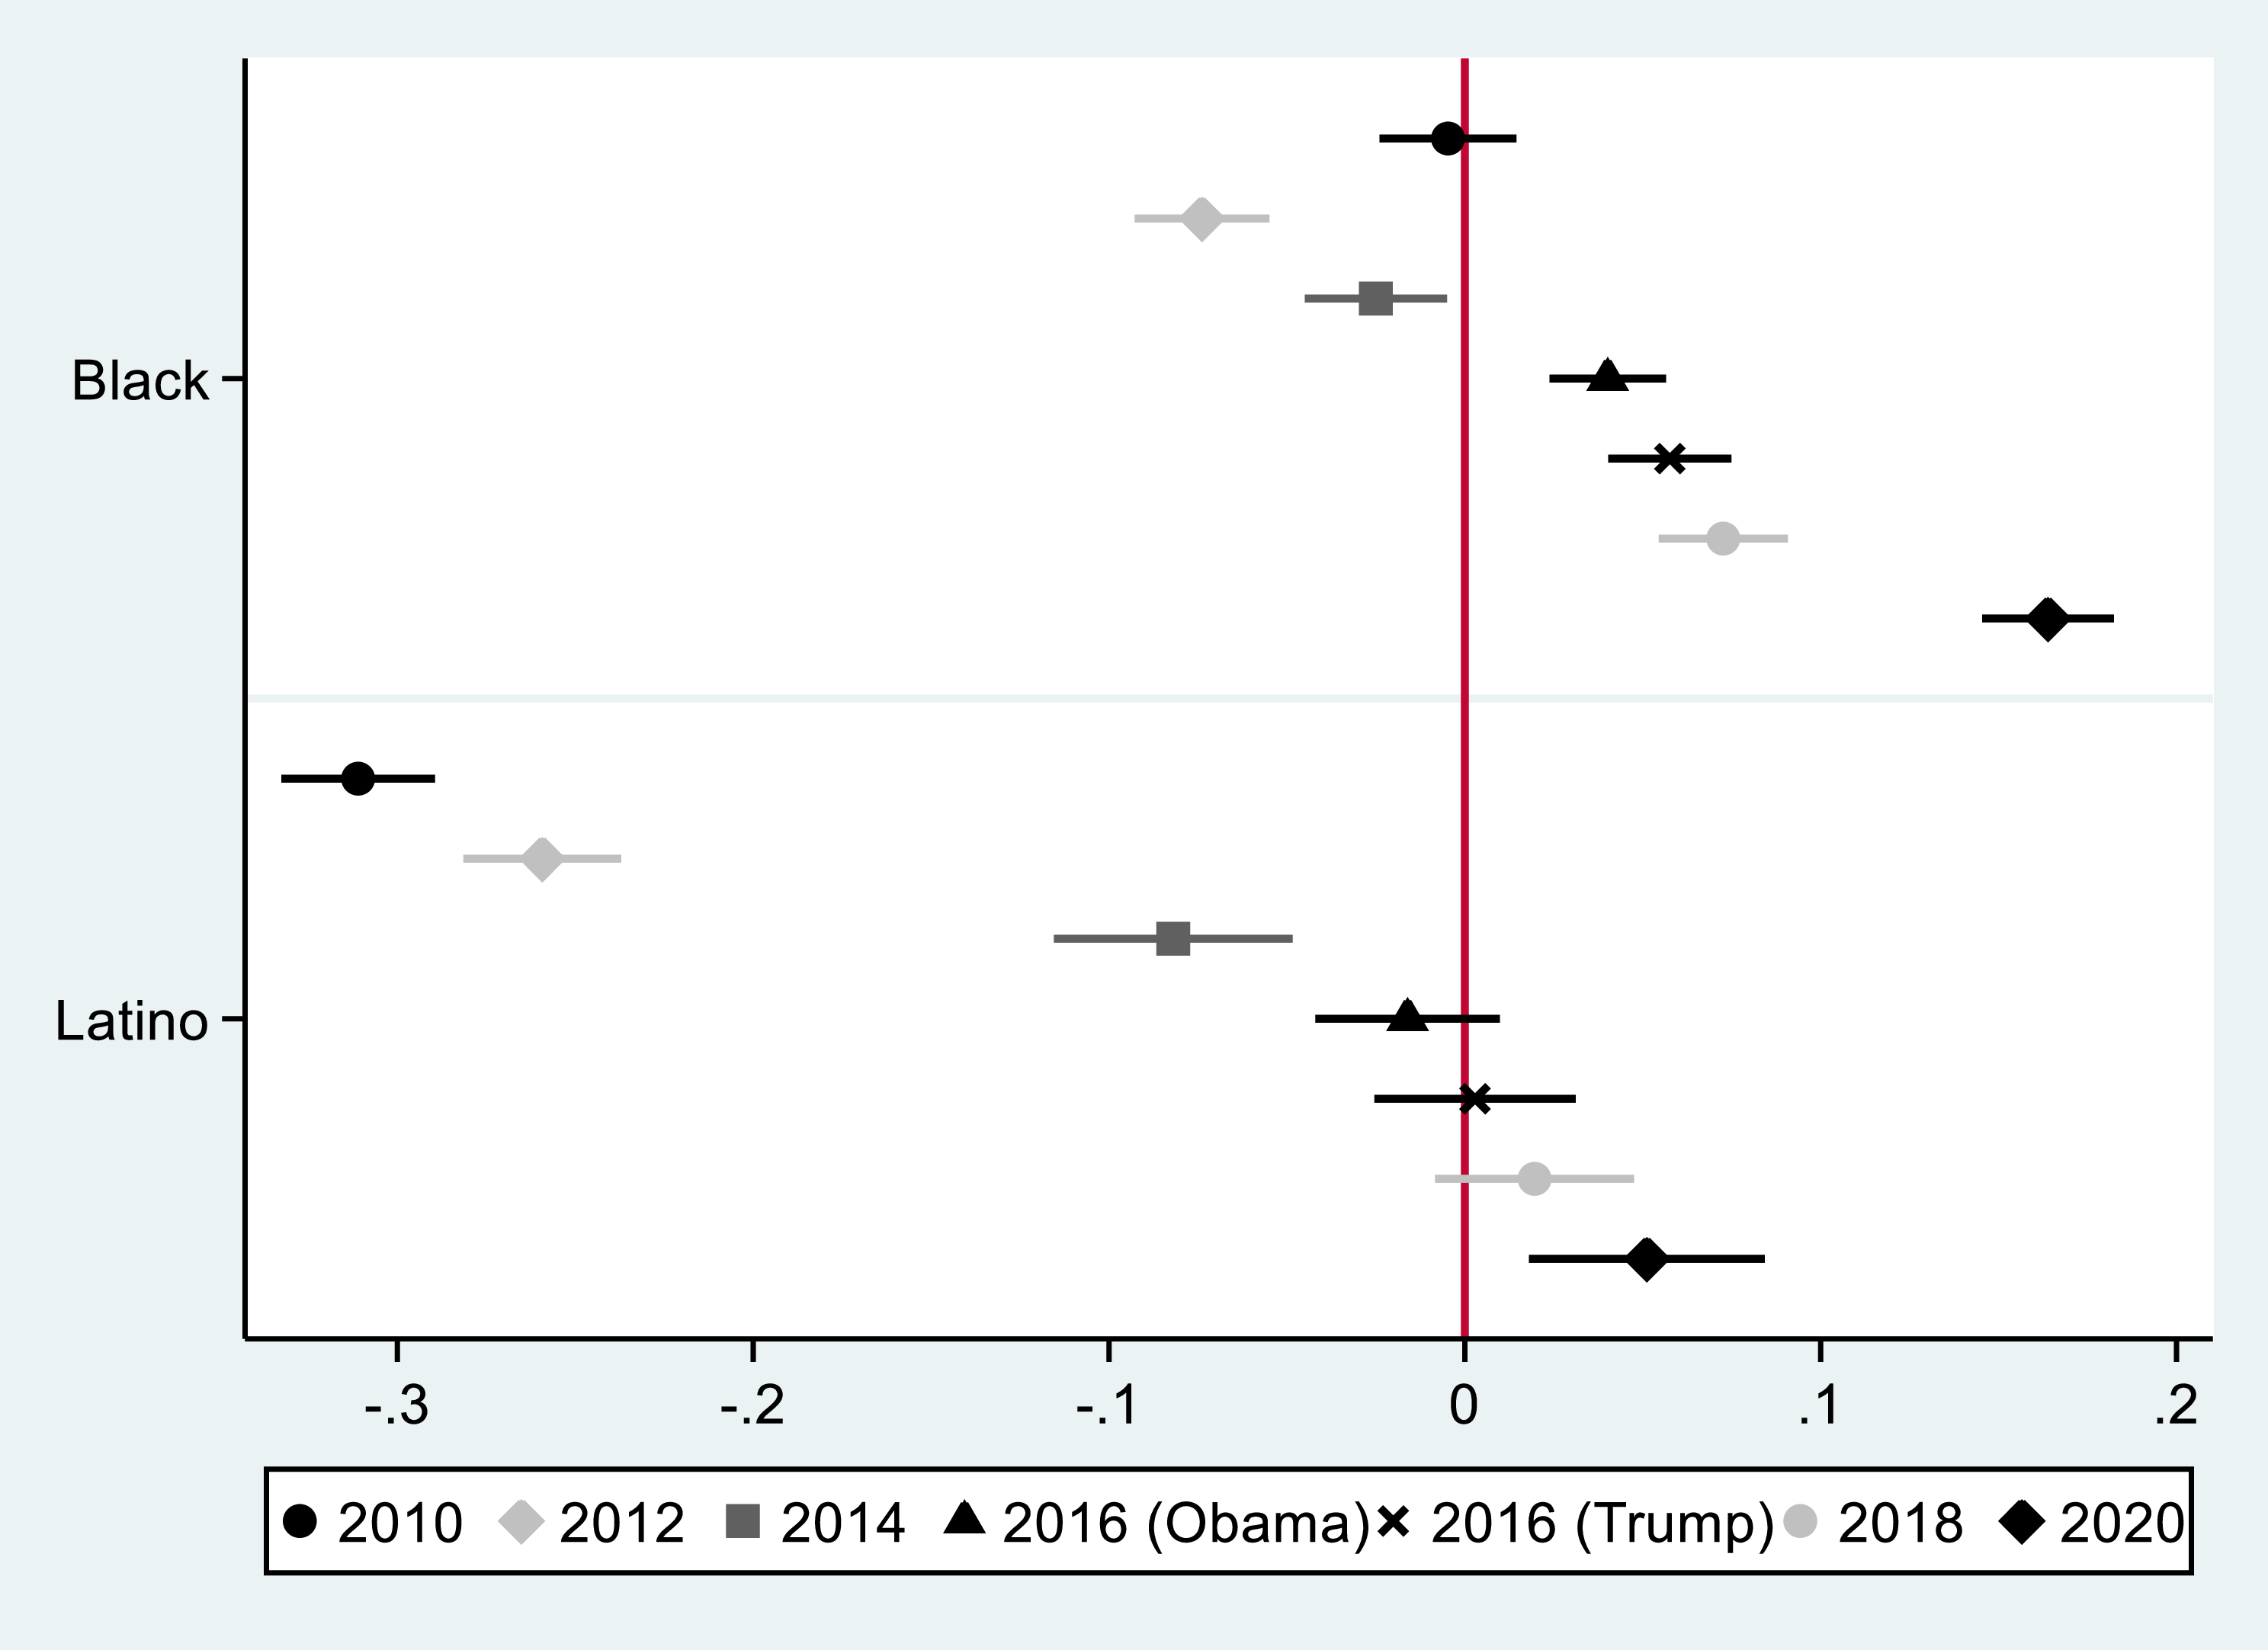
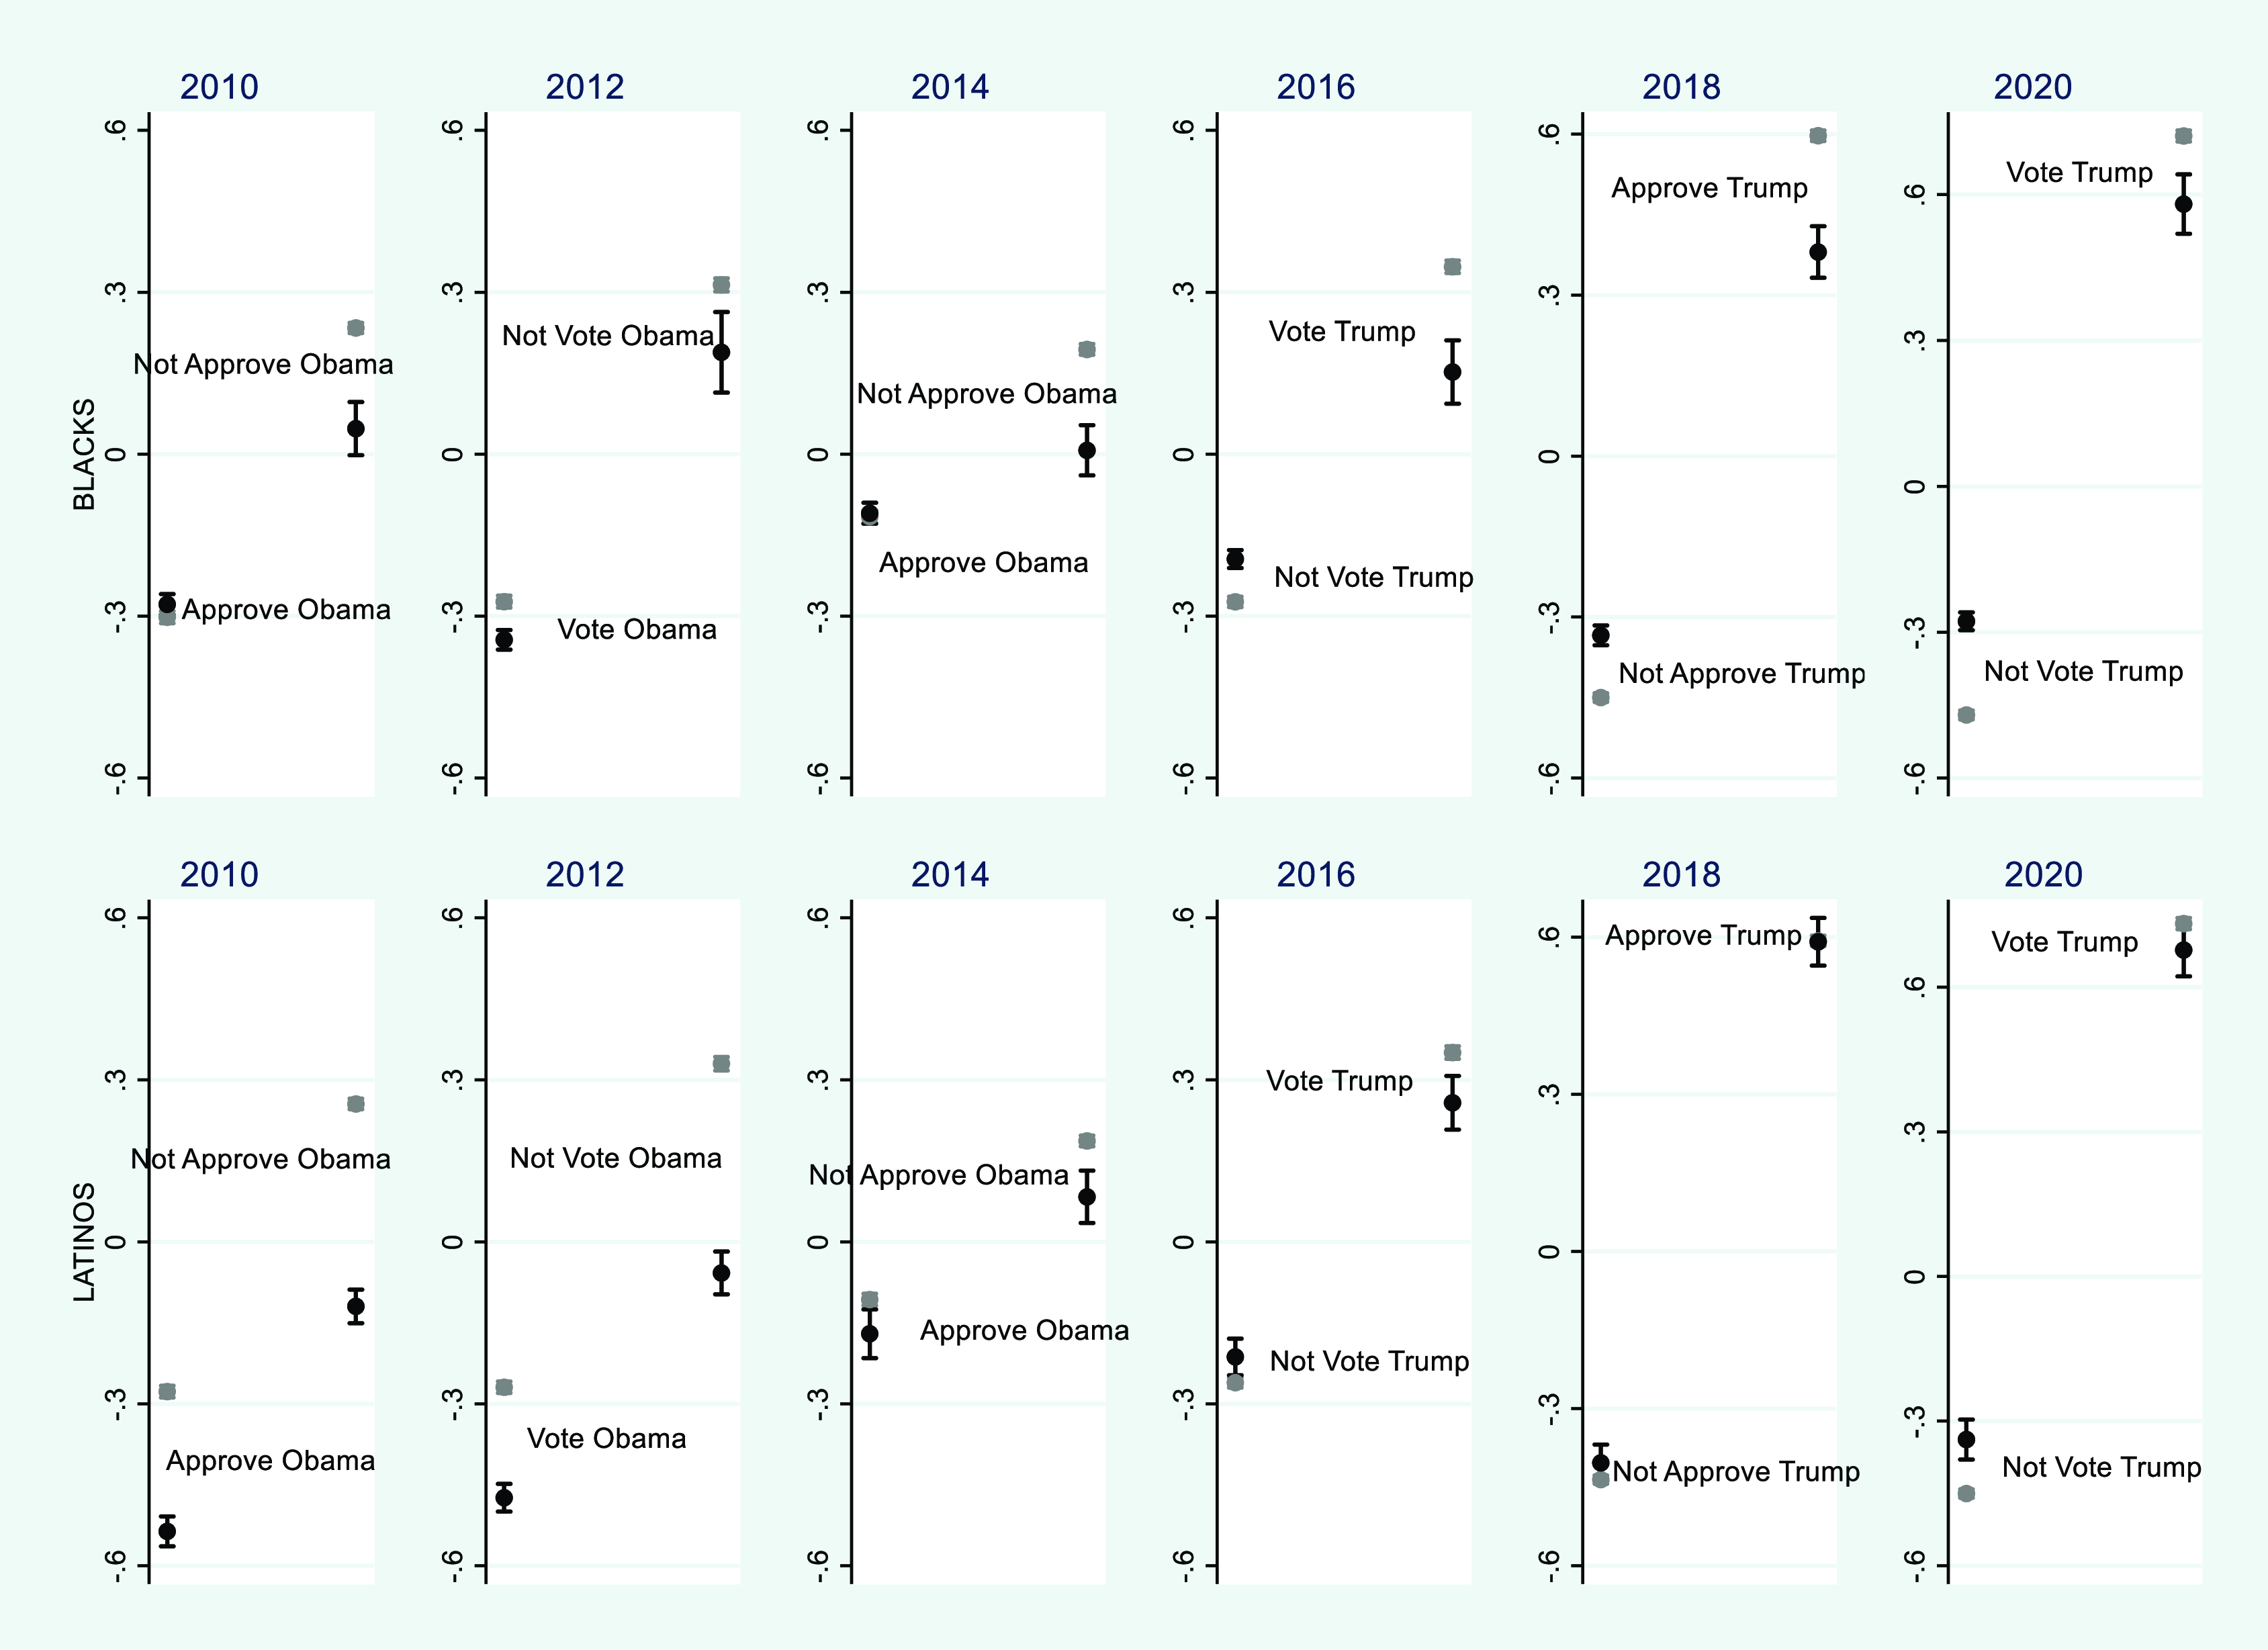
Figure 5 reports results generated from the same models, but when support for Obama or Trump is interacted with indicators of Black race and Latino ethnicity. The results – presented fully in supplemental materials Appendix E – show the effect Trump has on immigration attitudes when conditioned by race and ethnicity and are not consistent with the third hypothesis. During the Obama years, whites tended to be more anti-immigration than their Black and Latino counterparts, regardless of their evaluation of the president. There was also significant polarization of Latinos and non-Latinos, although this diminished in 2014. Once Trump ran for president, things changed. Whites became more pro-immigration relative to Blacks and Latinos and any polarization changed from inter-race or inter-ethnicity to driven by attitudes toward the president, now Trump. Black and Latino opponents of Trump became markedly more anti-immigration than their white equivalents. In fact, there are no inter-ethnic differences in the immigration attitudes of Latinos and non-Latinos who supported Trump in 2018 and 2020 and opposed him in 2016 and 2018.Footnote 11
The effects of Obama opposition and Trump support on anti-immigration attitudes when conditioned by black race and Latino ethnicity, 2010-20.
Data are from CES. Dependent variable is score on principal factor. High scores denote more anti-immigration attitudes. Findings for Blacks in the top panel, for Latinos in the bottom panel. Black dots represent Black and Latino respondents, gray dots non-Black and non-Latino respondents. Capped lines mark 95% confidence intervals.
Did Trump elevate the importance of immigration?
A central feature of the claim attitudes toward Trump materially shaped individuals’ views of immigration policy is that they “activated” as much or more than they were able to “persuade” (Sagir and Mockabee, Reference Sagir and Mockabee2023). In other words, Trump placed immigration firmly on the public agenda and did not so much shape the anti-immigration positions of those who supported him as he brought such views to the forefront of these people’s minds and made them believe the issue was now of greater importance. Trump’s sustained attention to the issue, beginning with his campaign announcement in the summer of 2015, convinced them it should be elevated to a central position within the country’s political debates (Enns and Jardina, Reference Enns and Jardina2021; Hopkins and Washington, Reference Hopkins and Washington2020; Mason, Wronski, and Kane, Reference Mason, Wronski and Kane2021; Newman et al, Reference Newman, Morella, Shah, Casarez Lemi, Collingwood and Ramakrishnan2021; Wallace and Zepeda-Millan, Reference Wallace and Zepeda-Millan2022).
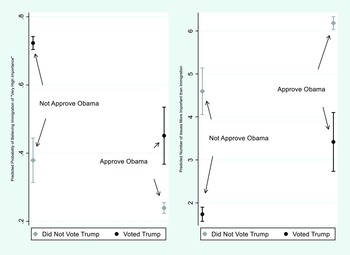
To test the fourth hypothesis and the effects attitudes about Trump had on respondents’ beliefs regarding the importance of the immigration issue, I again use the 2016 CES survey. Here, researchers asked participants to give their views on the importance to them personally of 14 different issues.Footnote 12 They were invited to provide one of five responses: “very high importance,” “somewhat high importance,” “somewhat low importance,” “very low importance,” or “no importance at all.” There are two dependent variables in this analysis, a dichotomous measure of whether the subject thought immigration was of “very high importance” and an indicator of the number of issues the respondent believed to be of greater importance than immigration (with ties excluded).Footnote 13 I run multivariate regressions, logit in the case of the former and OLS the latter, all containing an interaction of Obama approval and Trump vote. I also use the usual controls for party identification, ideology, Black race, gender, Latino ethnicity, marital status, age, education, family income, residence in the South and religiosity. I report full model specification results in supplemental materials Appendix F.
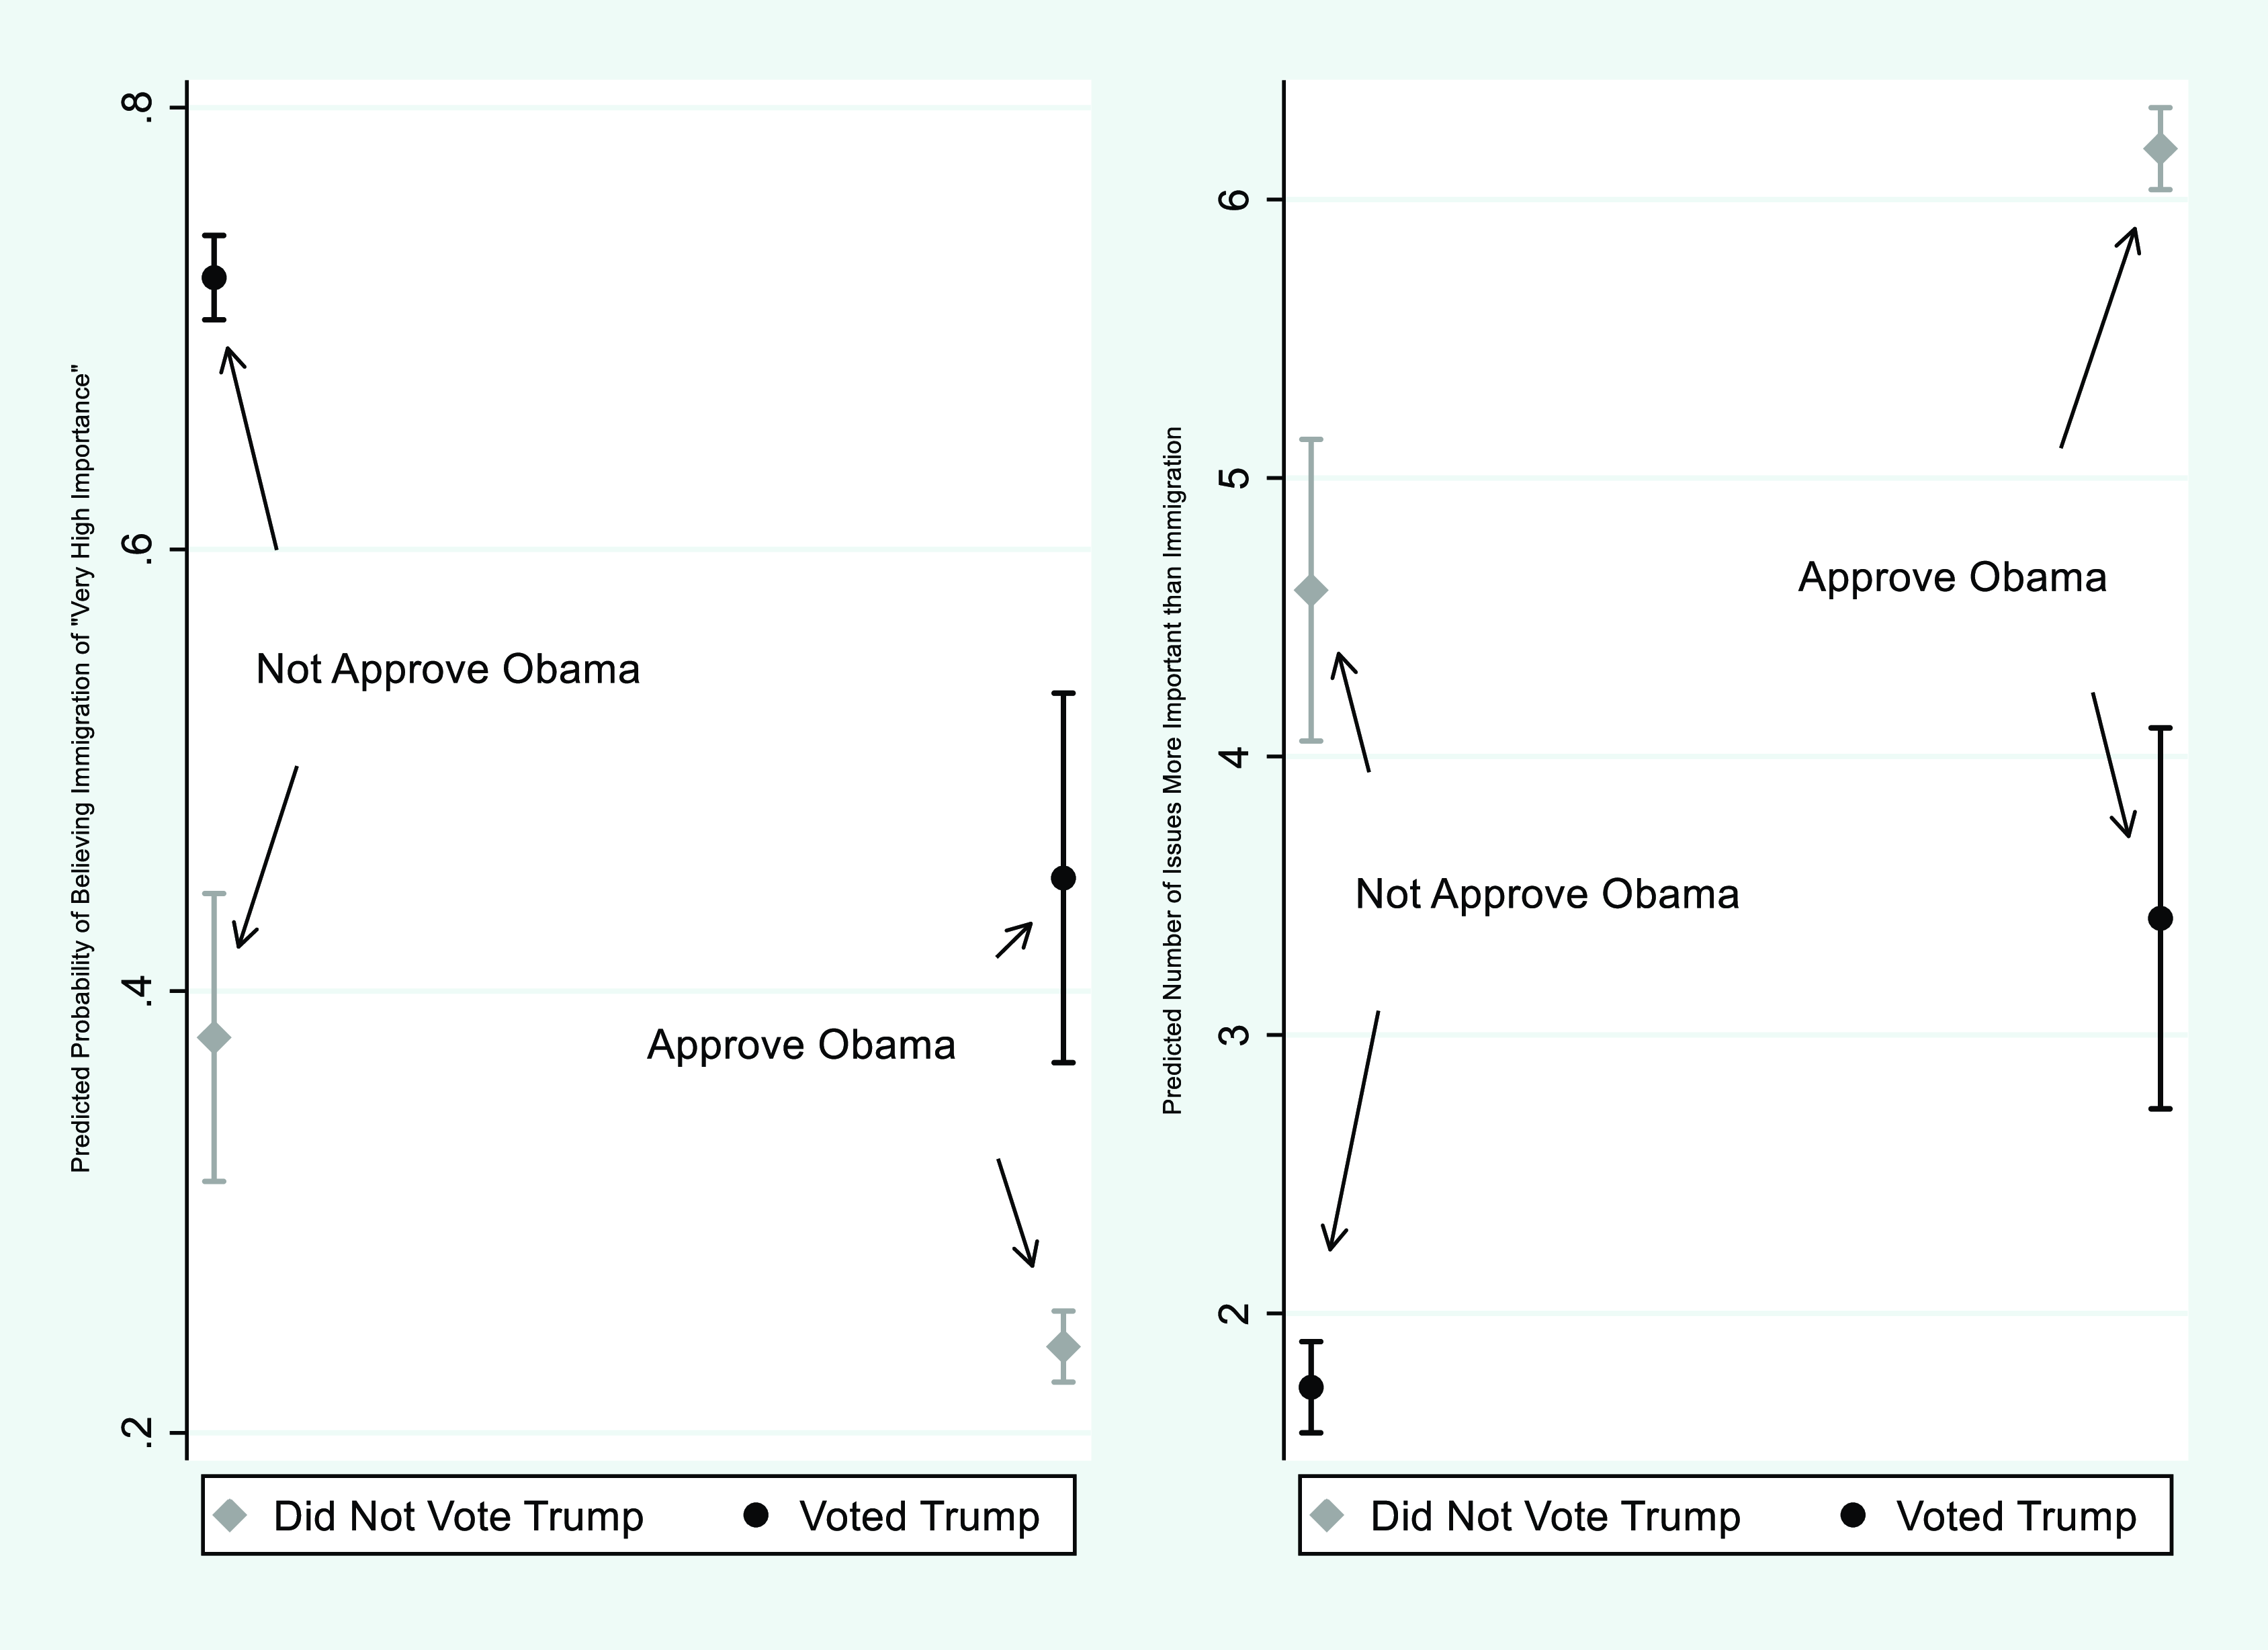
Figure 6 reveals the results of this analysis, with the left-hand panel showing the predicted probability of a respondent believing immigration to be of “very high importance” and the right-hand panel the predicted number of issues a respondent found to be more important than immigration. Both disapproval of Obama and a Trump vote increase the probability of believing immigration to be of very high importance by between 15 and 25 percentage points. There is also no statistically significant difference between a subject who approves of Obama and voted for Trump and one who did not approve of Obama and did not vote for Trump. There does appear to be a little more of an independent Trump effect with regards the number of issues a respondent thought was more important than immigration, however. A vote for Trump reduces the number of issues more important than immigration by about twice that of not approving of Obama (approximately 3 to 1.5). Although not quite outside the 95 percent confidence interval, those who approved of Obama and voted for Trump found about one less issue more important than immigration than did those who did not approve of Obama and did not vote for Trump. At best, these results provide tentative confirmation of the fourth hypothesis but push back somewhat against the argument made by several scholars that support for Trump did much to elevate the standing of immigration in people’s minds (Sagir and Mockabee Reference Sagir and Mockabee2023).
The effects of Trump vote and Obama approval on the importance of the immigration issue to respondents, 2016.
Data are from the 2016 CES. Left-hand panel shows predicted probability of believing immigration is of “very high importance,” right-hand panel the predicted number of issues viewed as more important than immigration. Capped lines mark 95% confidence intervals.
Conclusion
As domineering figures in American politics, presidents and presidential general election candidates are uniquely capable of having their policy preferences move those held by the public. Citizens, driven by significant support for or opposition to a president or presidential candidate, might use motivated reasoning and the leader’s position on an issue as a cue, just as they do phenomena like personal ideology and party affiliation. Many believe Donald Trump shaped the immigration policy attitudes of many Americans. He held clear, publicized, and unconventional views about the issue. Some empirical work on immigration attitudes asserts Trump’s influence over public opinion was material and contributed to the elevation of the issue and the polarization of policy preferences on it.
To examine any such Trump effect, I use surveys that ask a series of questions about respondents’ immigration policy attitudes fielded throughout the 2010s. I utilize the effect of attitudes toward Trump’s predecessor, Barack Obama, on mass views about immigration as a benchmark against which to gauge the extent of any influence people’s views of Trump might have had on their positions on immigration. I also compare the effect of views of Trump on immigration policy attitudes with trade policy attitudes.
My analysis largely confirms the first hypothesis – that Trump polarized supporters and opponents on immigration policy. This was especially the case in 2018 and 2020 when Trump deeply divided the public and his supporters were materially more anti-immigration than were opponents of Obama in the early years of the 2010s, and even supporters of Trump in 2016. If there was a time when Obama polarized Americans on immigration approaching the extent to which Trump did, it was the 2010 midterms. Comparing supporters of both Trump and Obama and opponents of the two men with those holding seemingly more consistent views – that is, supporting one and opposing the other – reveals attitudes toward Trump polarized subjects more than did opinions of Obama in 2016. This was a time when citizens had them both at the top of their minds.
The magnitude of any Trump effect is diminished when we compare it to the effect attitudes about him had on subjects’ views of trade policy, however. Again, using views of Obama as a comparison, an analysis of ANES data in 2016 reveals that whereas Trump clearly polarized opinion on trade policy more than did Obama, there is little appreciable difference on immigration. This important finding contradicts my second hypothesis.
The third hypothesis posited Trump polarized immigration attitudes along racial and ethnic lines. This does not seem to be the case and provides a corrective to some of the literature. Controlling for other demographic factors and important political attitudes, Black respondents in CES studies are more anti-immigration from 2016 than are non-Black respondents. Latinos go from being appreciably pro-immigration from 2010-14 to indifferent on the issue in the second half of the decade. Whites appear to have had more anti-immigration views than non-whites regardless of their views of Obama when he was president, from 2016 inter-racial and inter-ethnic differences narrowed and attitudes toward the policy polarized by views of Trump. Views of Trump, moreover, polarized whites more than they did Blacks and Latinos.
Finally, I examine the claim Trump elevated the issue of immigration and his supporters felt it was materially more important than had others and opponents of Obama. I again explore data from 2016, here looking at questions asked about the most important issue to respondents. Those who supported Trump and Obama gave around one fewer issue as being more important than immigration than those who opposed Trump and Obama. Any claim for this fourth hypothesis must be qualified, however. Others have argued the Trump effect on immigration during the 2016 campaign activated latent opposition to open and liberal policies on the issue rather than materially moved individuals’ positions on the matter (Sagir and Mockabee Reference Sagir and Mockabee2023). My study suggests otherwise and that Trump’s presence in the 2016 campaign elevated immigration in the hierarchy of issues within Americans’ minds although discernibly, only slightly.
Trump’s capacity to move citizens’ attitudes on immigration policy appears to have had broader effects on politics. Americans view Trump more favorably when their attention is drawn to the issue. During his losing 2020 campaign, COVID, the economy, health care, and race relations were all seen as more important to voters’ decisions than immigration according to Gallup.Footnote 14 The same survey fielded at roughly the same time in the 2024 cycle, however, reported the proportion of respondents who felt immigration was “extremely important” was, at 41 percent, 12 percentage points higher than in 2020.Footnote 15 In April 2025, as again-President Trump’s overall approval rating sank, a Pew Research report showed the proportion of Americans who were “very confident” Trump would make “good decisions” was highest on immigration policy – and, interestingly given the findings here, second highest on trade policy.Footnote 16 It beat out others where Trump was making high-profile decisions that spring like “tax,” “economic,” “foreign policy,” “health care,” and “managing the executive branch.” To the extent there was and presumably remains a Trump effect on immigration, it appears to be to his benefit.
Supplementary material
The supplementary material for this article can be found at https://doi.org/10.1017/S0143814X25100901.
Data availability
The data used in all quantitative analyses in this paper are available from the Harvard Dataverse Repository or by emailing the author at ataylor@ncsu.edu.
Replication materials are available in the Journal of Public Policy Dataverse at https://doi.org/10.7910/DVN/NUJNWI.
Acknowledgements
An earlier version of this paper was presented to the 2021 annual meeting of the Midwest Political Science Association. I thank David Damorfal and other attendees in addition to several anonymous reviewers for their insightful comments.
Statements and Declarations
The author did not receive support from any organization for the submitted work.
Study was not preregistered.





 Open access

