

1. INTRODUCTION
Airports can be stressful places (Caves and Pickard, Reference Caves and Pickard2001). Passengers are required to complete their tasks on time in order to catch their aircraft. Tasks at the airport can be divided into flight-related tasks and non-flight-related tasks (Popovic et al., Reference Popovic, Kraal and Kirk2009). As described by Popovic et al. (Reference Popovic, Kraal and Kirk2009) flight-related tasks are required before entering an aircraft, such as check-in, screening and boarding. These three tasks are experienced as most stressful (Halse, 1999; as cited in Caves and Pickard, Reference Caves and Pickard2001).
One of the reasons to get stressed might be the result of poor wayfinding. Poor wayfinding can lead to passengers getting lost and eventually missing their plane. Not being able to easily find the way can lead to increased anxiety and stress (Conners, Reference Conners1983). Caves and Pickard (Reference Caves and Pickard2001) explain wayfinding as one of the important factors for passengers to appreciate in an airport. Thus, improving the wayfinding experience can be beneficial for both the stress reduction of the passenger as well as the overall rating of the airport.
Wayfinding problems can be caused by information overload. People are able to ignore information they do not need, but it takes time to check what information they do need (Passini, Reference Passini1996). Consequently, stress levels can rise when wayfinding takes too long and the timeframe for catching a plane is a set. Providing direct visual access to the location can simplify wayfinding for passengers (Fewings, Reference Fewings2001). For instance, having a view of the exit makes it easy for passengers to walk directly towards the exit. For the same reason, the airplanes at the airport are visually accessible to the waiting passengers in the terminal (Fewings, Reference Fewings2001).
Wayfinding design involves spatial layouts, architectural and graphic communication (Passini, Reference Passini1996). The layout of a building can positively influence the ease of wayfinding (Baskaya et al., Reference Baskaya, Wilson and Özcan2004). In addition to the layout, graphic communication can help provide a better understanding of how to find the way. When using graphic communication, it is important to make sure it is placed within visual range. Schultz et al. (Reference Schultz, Schulz and Fricke2007) defines the visual limitations of people in a vertical range of approximately 15° and a horizontal range of approximately 62°. In addition, the head normally leans forward by 10–15° (Schultz et al., Reference Schultz, Schulz and Fricke2007). The creative director of Mijksenaar Wayfinding Experts (2018) mentioned that it is relevant to take a variety of things into account while determining the placement of a sign, such as the readability, line of sight and safety.
Schultz et al. (Reference Schultz, Schulz and Fricke2007) make a distinction between static and dynamic signs. Usually, static signs are used to inform people about the location of something. However, these signs are often not able to adapt to new situations. Dynamic signs can be updated and adjusted according to the situation (Schultz et al., Reference Schultz, Schulz and Fricke2007). Additionally, dynamic signs also make it possible to add motion to signage, which attracts attention (Mijksenaar Wayfinding Experts, 2018). Watson et al. (Reference Watson, Braithwaite and Humphreys2008) mention that “Previous research has shown that the abrupt appearance of a new perceptual object among a field of already present but changing items automatically captures attention”.
Another medium to attract attention is light. People are naturally drawn towards light (Fewings, Reference Fewings2001). Fennema (Reference Fennema2015) has applied this element by creating a smart system for airport waiting areas to intuitively guide passengers while searching for a seat in order to distribute them evenly. The same concept of using light for providing guidance to people has been tested by Akkerman (Reference Akkerman2016), who demonstrated that people become less hesitant and know where to go when seeing light.
Hidayetoglu et al. (Reference Hidayetoglu, Yildirim and Akalin2012) indicate that an increased brightness level and neutral white colour (4,000 K) results in a more positive perception of an area. In addition, good quality lighting can positively affect the mood and health of people (Royal Philips Electronics N.V., 2008). Higher colour temperatures provide a more active atmosphere, which is often required at workplaces (Philips Lighting B.V., 2016). Iskra-Golec et al. (Reference Iskra-Golec, Wazna and Smith2012) discovered that the use of blue-enriched light has a beneficial effect on the energy of people. Furthermore, Brown et al. (Reference Brown, Schoutens, Whitehurst, Booker, Davis, Losinski and Diehl2014) showed that blue light improves the alertness of in-flight crew members.
However, there is little research about how animated light is experienced by people for wayfinding purposes. The aim of this study is to understand whether the use of animated light projections can improve the wayfinding experience of airport passengers. Therefore, the aims of this paper are to: 1) discover which animations are best suited to guide wayfinding, and 2) investigate how these projections are perceived in an airport context. Therefore, two studies have been conducted to create an understanding with regard to the effect of light projections for wayfinding purposes in an airport. First, in the laboratory test (described in Section 2), four animations were developed and tested within a controlled testing environment. Subsequently, the preferred animated projection was tested in a real airport environment (field test described in Section 3). By improving wayfinding, the experience of passengers at the airport might be improved by making it less stressful.
2. LABORATORY TEST
2.1. Laboratory test method
An experiment was completed at the Delft University of Technology to validate the preferred animation for wayfinding. Additionally, the temptation of people to walk towards the light projections was tested.
2.1.1. Participants
The participants were asked to sign an informed consent prior to the study. At least ten participants were required for this study. The aim was to have a variety of ages and occupations, to reflect the variety of passengers in an airport.
2.1.2. Stimuli
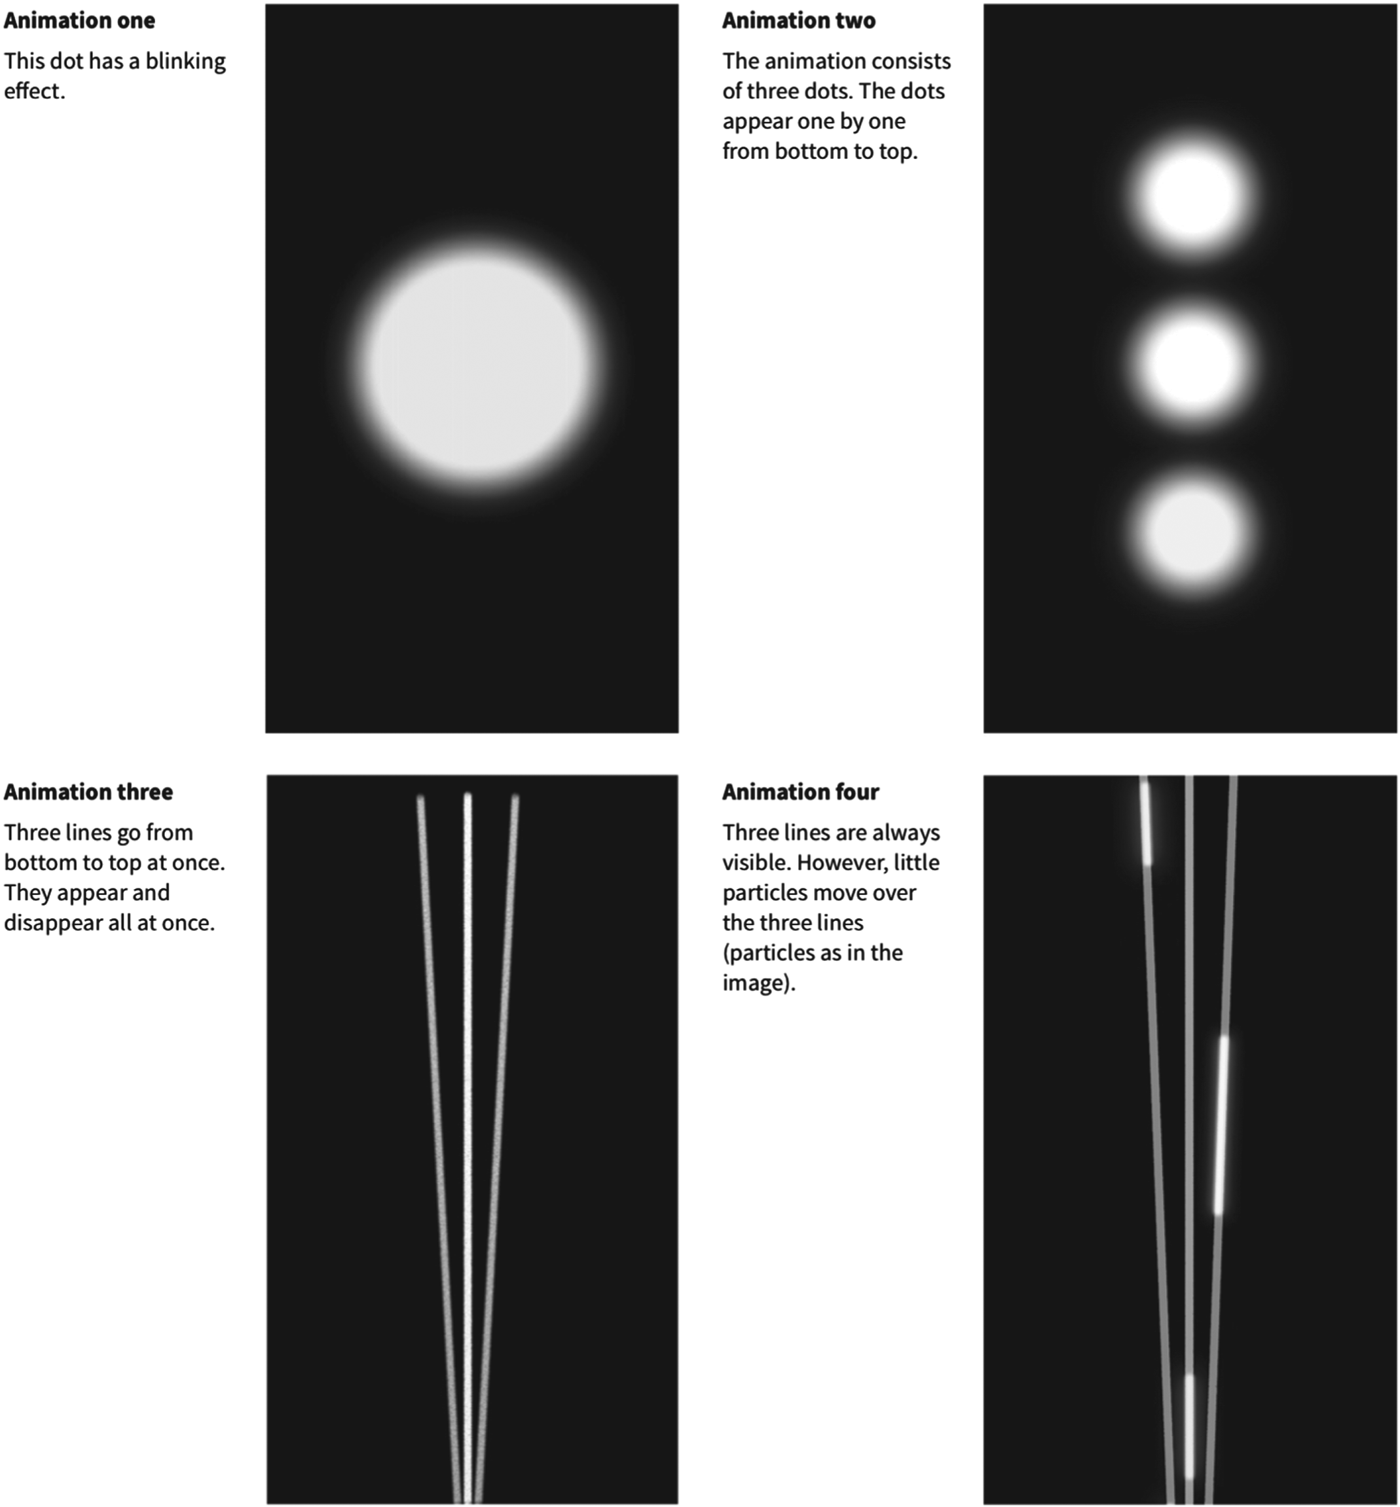
Four animations were developed using Adobe After Effects version 15.0.1 (Adobe, 2018). The animations were designed to differ in size, velocity and motion. While designing, the aim was to create variations in the motion of the animation. It was decided to have differences in singular or plural shapes whereby some were static and some dynamic. The animations and their differences are explained in Figure 1. A fifth animation (Figure 2) was designed but not used in the experiment. This animation was too straightforward (arrows) for this experiment since the goal was to use abstract shapes and animations to test if motion only can be clear for wayfinding purposes rather than using arrows and text.
The four different animations used within the lab test.
Animation with arrows (not used in the lab test).

All animations were designed with a black background (#000000) and cool white light effect (#ffffff). The black colour acts as a transparent background when projecting the animation with a projector and thus only the white light animation is perceived on the floor.
The duration of the animations was not predefined. However, the animations were continuously looped while the participants walked through them.
2.1.3. Apparatus
For this study, two projectors (LG PF1500G) were used to project the animations onto the floor. These projectors can project a full High Definition (HD) resolution of 1, 920×1, 080 pixels with 1,400 American National Standards Institute (ANSI) Lumen (LG, 2018). The ANSI Lumen describes the brightness of the projector for which 1300 lumen is the minimum for dark rooms with little to no light (Lumens Guide, 2018).
2.1.4. Materials
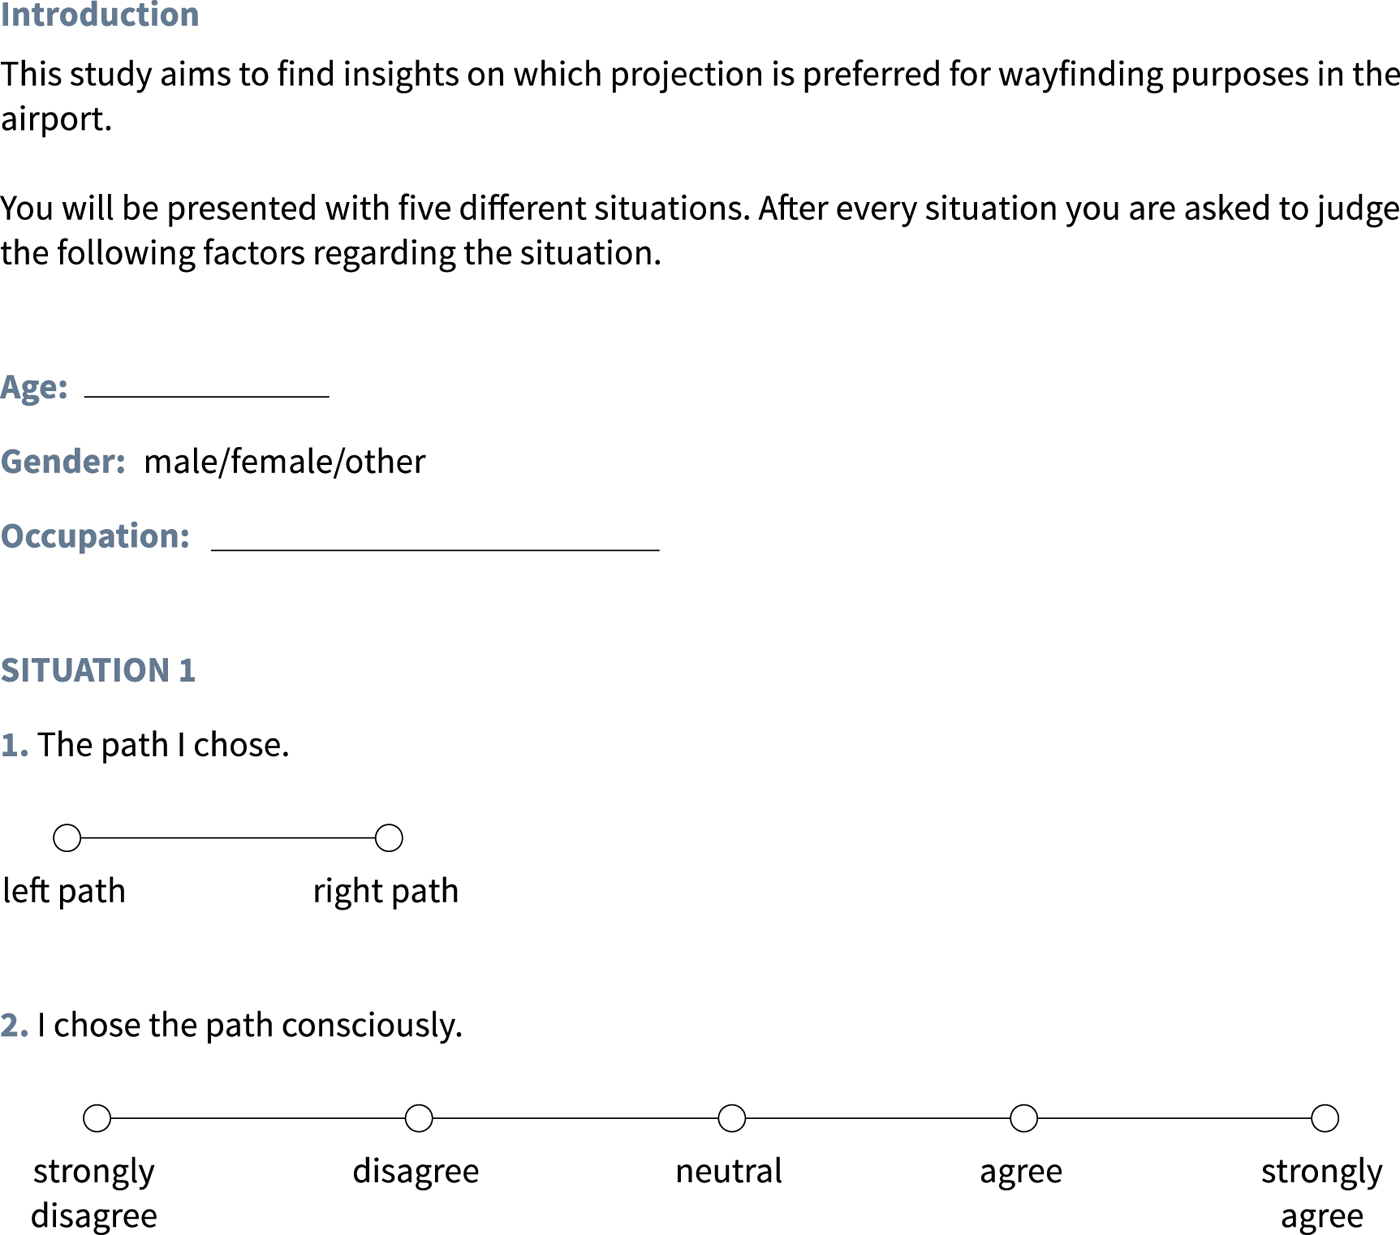
To gather quantitative data about which animation was preferred for wayfinding purposes, a questionnaire was used (Appendix A). The questionnaire consisted of a five-point Likert scale from strongly disagree to strongly agree. Participants were asked to complete the questionnaire after experiencing a specific animation. The aim of these questions was to get insights about the choices and experiences regarding that situation.
2.1.5. Setting and procedure
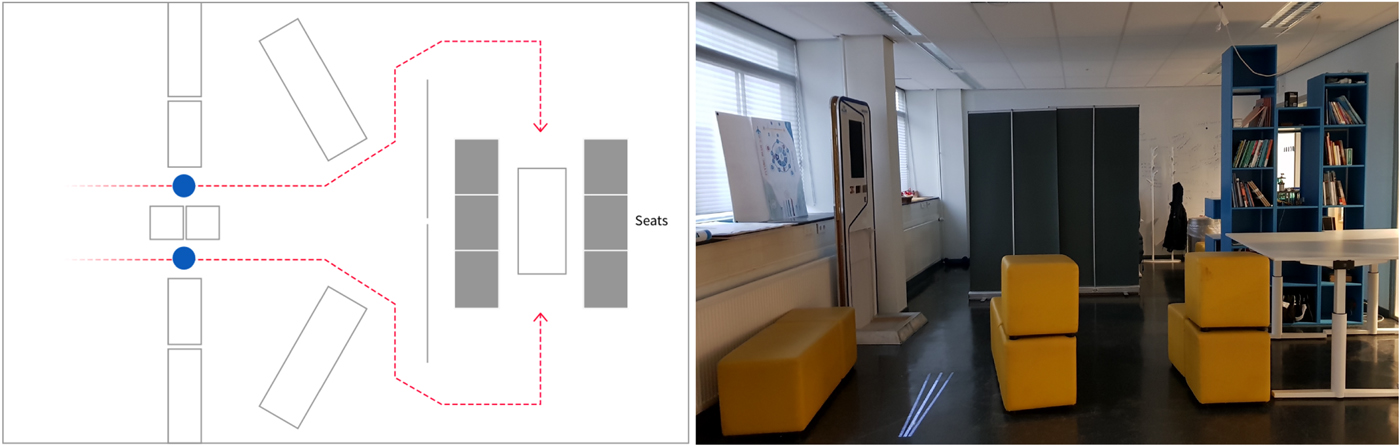
The study took place in a laboratory environment at Delft University of Technology (Delft, the Netherlands). In order to evaluate whether people will intuitively walk towards the projections it was necessary to simulate a situation in which a decision needs to be taken regarding which pathway to choose. Therefore the laboratory was constructed in a way in which there were two options to walk towards the end of the room. Two-Dimensional (2D) and Three-Dimensional (3D) visualisations of the setting are illustrated in Figure 3. The red line shows the two options for walking towards the seats. The two blue dots represent the position of the projection on the floor. The amount of daylight and light in the laboratory could be manually controlled. To provide a better perception of the animations the room was made darker by using the window blinds and switching off the light. In this setup, the level of brightness of the floor without the projection varied between 14 – 23 lux (measured with a Testo 545 lux meter). The same area with the light animation projected resulted in a level of brightness of 305 – 320 lux. The difference shows that the projection adds a relatively high level of brightness to the floor.
A 2D visual of the setting (left) and a 3D photo of the setting with a projected animation (right).
First, the participants were invited inside and were then asked to walk towards the end of the room and take a seat behind the room divider. The questionnaire was placed on the table prior to the experiment for the participant to complete. After completing the questions, the same process of walking from the entrance to the seats was repeated four more times.
In each of these repetitions, the situation was different. The first situation did not have a projection on the floor to measure the initial choice of pathway. This served as a benchmark regarding their choices for the other four situations. For the other four situations, each time only one pathway was projected with an animation. All participants experienced the four different animations and the benchmark (no projection). The sequence of these animations was different for all participants. Additionally, the projected pathway for every situation was randomised (see Appendix B).
After they had completed the questionnaire, a semi-structured interview was conducted with the participants during which the purpose of the experiment and the participants’ preferences of the projections were discussed.
2.1.6. Data analysis
The quantitative data from the questionnaires were statistically analysed through the use of the IBM SPSS (Statistical Package for the Social Sciences) Statistics 25 (IBM Corp., 2017). A non-parametric Friedman test (IBM Corp., 2017) of differences among repeated measures was conducted to understand the difference between the results for all four questions. In addition, a Wilcoxon signed rank test (IBM Corp., 2017) was performed to compare the awareness level and guidance level achieved with no animation to the situations with animation. An alpha level of.05 (p=.05) was used for all statistical tests.
2.2. Laboratory test results
For the laboratory test, ten participants (six male; four female) between the ages of 23 and 38 agreed to participate in the study. The majority of the participants (8/10) were students. None of the participants were visually impaired. One participant had colour blindness.
2.2.1. Questionnaire
During the first situation, no animation was projected in order to determine the preferred pathway (left or right). Subsequently, the four projections were randomly projected on either one of the pathways. For all participants, two animations were projected on their preferred pathway and two animations on the other pathway. When comparing the initially chosen pathway with the chosen pathway in situations with animation, there were five occurrences in which participants deviated from their preferred pathway. Animation one (three times) and two (two times) are the only ones that were avoided. Thus, when animations three and four were projected, all participants chose the pathway with the animated projection.
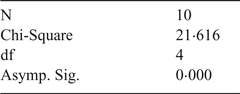
The question ‘I chose the path consciously’, aimed to create an understanding of the awareness of the participants while choosing the pathway. The question was asked for all five situations. In order to compare all five situations with regard to awareness, a non-parametric Friedman test of differences in the awareness was conducted and resulted in a Chi-Square value of 21·616 which was significant (p<0·05) (see Table 1).
Friedman test results awareness level.
Subsequently, the results for the situation with no animation was compared to the other situations through the Wilcoxon Signed-Ranks Test on an individual basis. The results indicate a highest significance level of p=0·014 for the difference between no animation and animation 3 (Table 2). The differences within the animations show no significant difference (p>0·05). Hence, it can be concluded that the awareness of choosing the pathway was significantly higher for the situations with animations compared to the first situation without an animation.
Wilcoxon signed rank test results awareness level.

The same non-parametric Friedman test was conducted for the other three questions: ‘The projection on my pathway attracted my attention’, ‘The projection made it clear where I needed to go’ and ‘I preferred the pathway with projection’, respectively. Results show that the main effect of type of animation was not significant for these questions (see Table 3).
Friedman test results for attention level, guidance level and preference level.
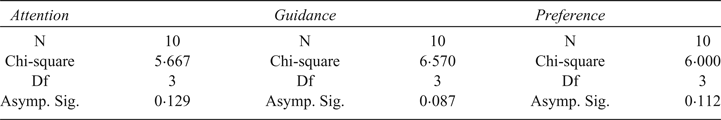
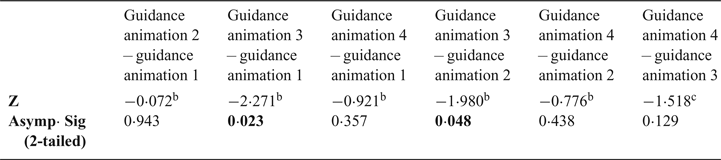
For the differences in guidance level results, however, there seems to be a trend (p=0·087). Therefore, an additional post-hoc analysis with the Wilcoxon Signed Ranks Test was conducted to examine if there were significant differences within the animations. Results show that scores of guidance were significantly higher for animation 3 compared to animation 1 (Z=−2·271, p=0·023), and higher for animation 3 compared to animation 2 (Z=−1·980, p=0·048). The other comparisons were not significant (see Table 4).
Wilcoxon signed rank test results guidance level.
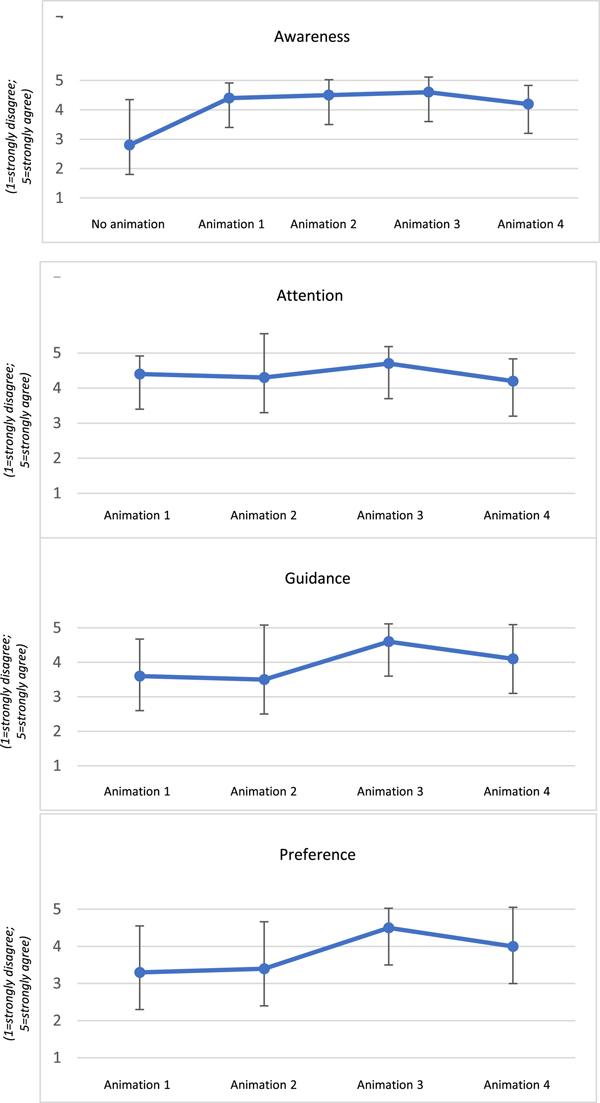
The mean of the attention, guidance and preference levels can be seen in Figure 4. Overall, animation three scores highest in all situations.
Mean values of awareness, attention, guidance and preference levels. Error bars indicate the standard deviation. The y-axis represents the results of the Likert scale from strongly disagree (1) to strongly agree (5).

2.2.2. Interviews
The results from the semi-structured interviews were quite similar to the questionnaire results. Most participants indicated that animations two and three were the clearest. This choice was motivated as being the clearest for guiding people towards a certain direction. However, animation two was also perceived as a ‘stop’ or ‘waiting’ sign as a result of the velocity of the animation: “The velocity of the animation indicated the walking speed for me” (Participant six, translated from Dutch). In addition, many participants perceived animation one as a stop sign because there was no vertical motion.
The purpose tested during the experiment was to evaluate if light projections invited the participants to walk towards the light. When asked, this purpose was clear to the participants from the laboratory experiment. The participants mentioned the words ‘guidance’ and ‘helping in finding the way’; “I think [the purpose is] to steer people into a specific direction, a bit of crowd management” (Participant three, translated from Dutch).
Participants mentioned the importance of the contrast with the floor. Animations with better contrast were perceived better than lower contrast. “I believed animation four was the least clear one due to the low contrast” (Participant seven, translated from Dutch). However, the animation itself was perceived as clear.
2.3. Laboratory test discussion
In order to validate the preferred animation, four different animations were tested in a laboratory environment prior to the observation in context. The quantitative data from the questionnaire indicate that animations three and four were most preferred for guiding people in a specific direction, whereas the qualitative data shows a preference for animations two and three. Participants preferred animation two and three due to the intuitive motion from front to back (see Figure 1 for the animations). Concurrently, animation one, the blinking effect, was not preferred by most of the participants. This animation was perceived as a stop sign since it was not moving in a vertical direction. Some participants mentioned that the velocity of the animation affected their pace, causing doubt between going or waiting.
Results from the laboratory experiment indicate that a light projection attracts attention in a controlled environment. For all but one situation, the participants noticed the projections on the floor. Using the initially chosen pathway as a benchmark, it can be said that 89% of the time participants deviated from this initial choice when an animation was projected. The awareness while choosing their pathway was high (mean values between 4·2 and 4·6 out of 5) when the animations were projected. For the first situation, the awareness had a mean value of 2·8. It is believed that the awareness was influenced after the first situation. The question how conscious they were about their initial choice of pathway could have made them aware of the chosen side. It is suggested to test only one situation with a larger number of participants to assess if light projections provide intuitive wayfinding.
The value of having contrast with the floor was mentioned by some participants. This explains the difference in the mean values of animations three (4·6) and four (4·1) regarding the clarity of the guidance. Even though the animations are similar, the differences in contrast have a great impact on the clarity.
Differences between guidance levels of different animations were not significant but p>0·1, therefore a post-hoc analysis was conducted which showed that animation three scored significantly higher on “making it clear where to go”. However, these results should be carefully considered. Further studies with a larger number of participants are needed to verify this. Since animation three scored significantly higher on guidance and was experienced as clearest by most participants, that animation was selected for the field test.
3. FIELD TEST
3.1. Field test method
In order to analyse the impact of a light projection onto the floor in an operational airport context, an observation study was conducted subsequent to the laboratory experiment.
3.1.1. Participants and setting
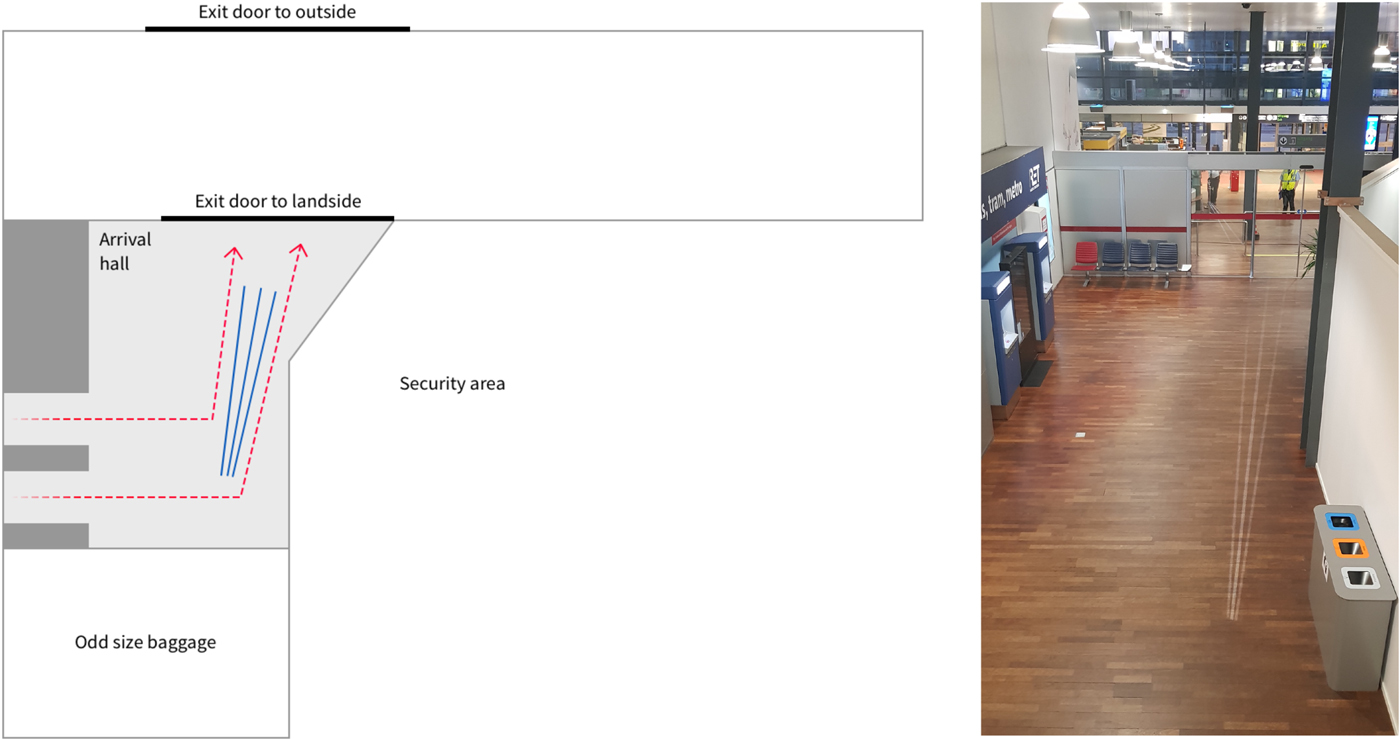
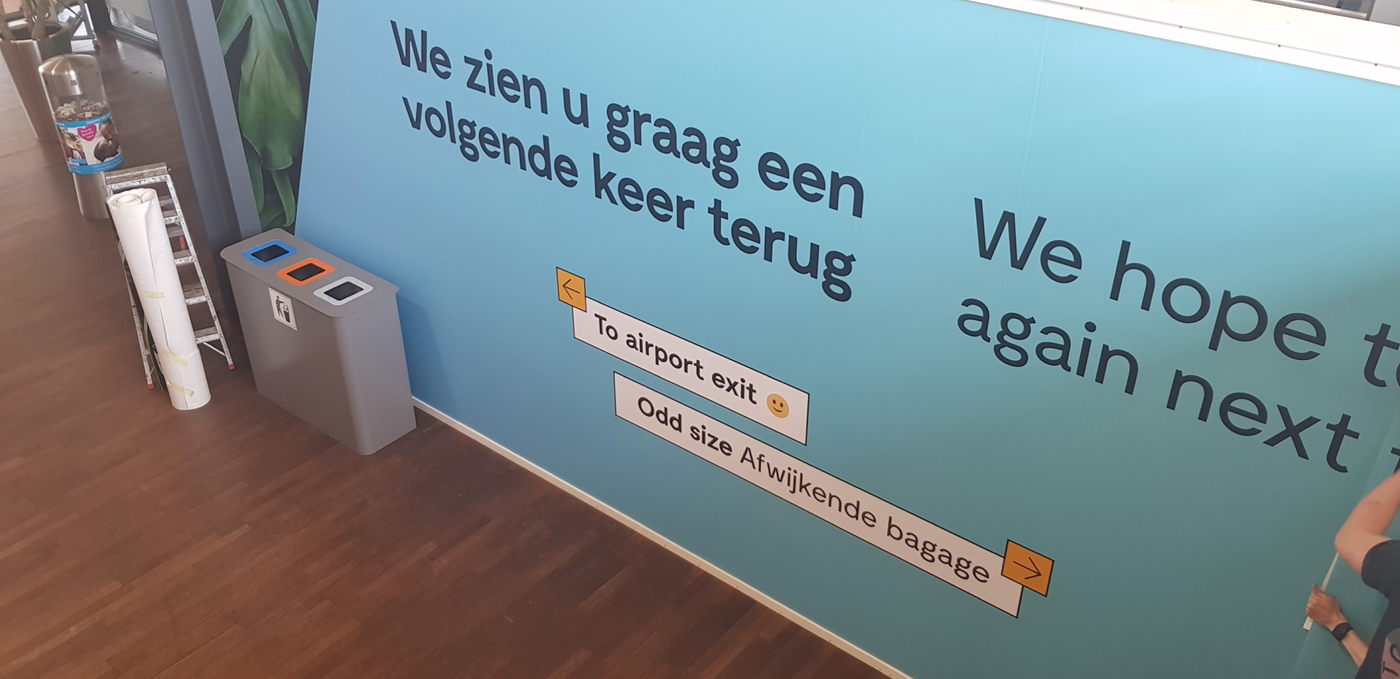
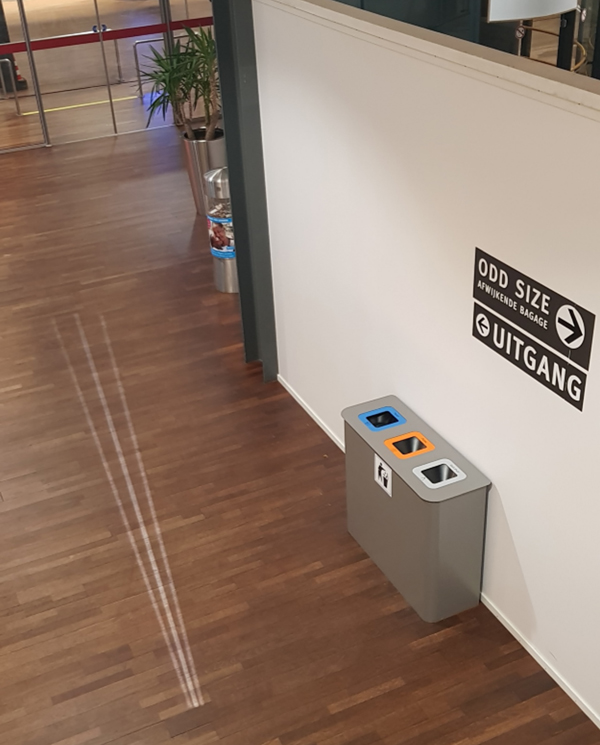
The observation study took place at the exit door for arriving passengers at Rotterdam The Hague Airport (RTHA), a small regional airport in the Netherlands. The exit was located next to the baggage belt. At this point, there was an intersection where passengers can go left or right. The left corridor is the exit and the right corridor goes to the odd-size baggage. At this intersection, information about the exit and odd-size baggage is written on the wall. The animation was projected on the floor in front of this wall (Figure 5, right). A complete map of the setting (2D) and picture can be seen in Figure 5.
A 2D visual of the test set-up at Rotterdam The Hague Airport (left); projected animation directed towards the exit (right).
3.1.2. Stimuli
The preferred animation from the laboratory test results was used for this observation. This animation was continuously looped when in use.
3.1.3. Apparatus
The equipment used for this study was one projector (Vivitek DW832) to project the animation on the floor. The projector projected with a resolution of 1, 280×800 pixels with a 5,000 ANSI Lumen capability (Vivitek, 2018). For this study, it was deliberately chosen to use a projector with high ANSI Lumen in order to increase visibility in an environment with a lot of daylight. According to the lumens guide of Projector People (Lumens Guide, 2018) 4,500 Lumen will be sufficient for bright rooms.
3.1.4. Procedure
In total, eleven flights were observed. It was required to use a projection alternately, which resulted in six flights without projection and five with projection.
The aim of the observation was to understand whether passengers became confused when looking for the exit. In addition, it was important to observe if passengers got lost or walked in the wrong direction. These observations could be compared with the situations with projection to assess if a light projection reduces confusion or people getting lost.
3.1.5. Measurements
In order to observe the effect of the projection at the airport, the behaviour of the passengers was scored. Behaviour such as signs of doubt, walking in the wrong direction, asking for assistance and confusion were marked.
3.2. Field test results
The preferred projection, animation three from the laboratory experiment, was used for the observations. The arriving passengers from eleven flights were observed (see Table 5). Overall, there were more leisure passengers than business. For six flights, no projection was used to observe the behaviour in the current situation. While exiting for the other five flights, the projection was used to observe the behaviour again. At times, passengers of different flights arrived simultaneously which resulted in multiple flights with or without a projection in sequence, whereas the aim was to use the projection alternately. Therefore, the sequence was adjusted according to Table 5 in order to evenly distribute the different conditions among the flights.
Observed flights with information about the passengers and whether the animation was projected on the floor.
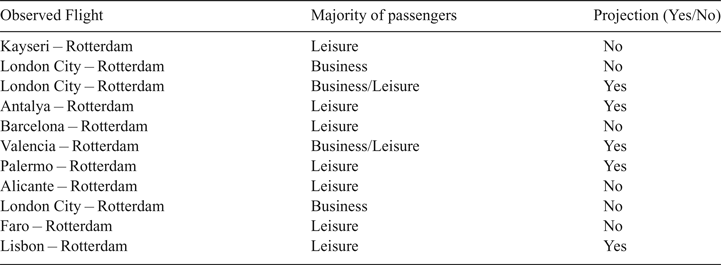
No difficulties were observed when passengers were exiting the airport when there was no projection. Many passengers were able to find their way easily. Most confusion was around locating their luggage. Observing passengers exit with the projection did not change the earlier perceived behaviour. Again, no passenger walked in the wrong direction or got lost while trying to exit. It was judged that the projection was not noticed due to the bright environment. The contrast between the light projection and floor was too low. Moreover, passengers exited in quite large groups, which often obstructed the projection on the floor. In other situations, groups of people were observed standing in front of the projection to wait for others.
3.3. Field test discussion
From the observation study, it was ascertained that the projected animation on the floor at Rotterdam The Hague Airport (RTHA) was not noticed by the passengers. The contrast between the floor and the animation was too low. A relevant factor for the lack of contrast was the bright environment caused by daylight (the test was done on a particularly sunny day). Although, 200 lux is recommended for the arrival and departure halls at an airport (Zumtobel, 2018) the illuminance level can vary between 1,000 and 10,000 on cloudy and sunny days, respectively (The Engineering ToolBox, 2018). To increase the contrast, it can be considered to either change the position of the light to a less bright environment, or to test the animations with another technology than a projector, such as luminous textiles for a carpet (for example).
Another reason for the projection being unnoticed was that passengers were standing in front of or on the light projection. The fact that light projections on the ground can be difficult to see when it is crowded and full of hand luggage was also mentioned by the expert from Mijksenaar Wayfinding Experts (2018). Hence, a finding from the observation is that when groups of passengers are walking in the same direction, it is not valuable to place the projection on the floor. However, in situations when passengers stand in line, it might be beneficial to place the projection on the floor in order to indicate when it is someone's turn. The placement of the projection has to be linked with processes (Mijksenaar Wayfinding Experts, 2018). If the process is to guide passengers through the security area, the projection can be placed on the floor, whereas when the process is to guide groups of passengers towards the exit it is better to be placed on a wall or a screen.
4. GENERAL DISCUSSION
The aims of this paper were to: 1) discover which animations are best suited to guide wayfinding, and 2) how these projections are perceived in an airport context. In the laboratory test, four animations were developed and tested within a controlled testing environment. Subsequently, the preferred animated projection resulting from the laboratory test was tested in a real airport environment.
The two studies provide valuable findings about the effect of light projections. However, there are some factors that are important to take into consideration.
It is significant to note that the RTHA is quite a small regional airport with 1·7 million passengers per year (Rotterdam The Hague Airport, 2019). Therefore, few or no decisions have to be made in wayfinding. The exit for arriving passengers was visually accessible which made it easy to find the way out (Fewings, Reference Fewings2001). Moreover, when observing the passengers exiting the airport it was noted that groups of people follow each other. Hence, when one passenger walked towards the exit, others followed. More extensive future research can focus on implementing the projection in different scenarios, for example, when standing in line prior to security. Additionally, it is suggested to test in a more complex situation where passengers occasionally do get lost to observe changes in their behaviour. The placement of the setup proved to be a non-complex situation since no difficulties in wayfinding were observed even when there was no projection. Unfortunately, it was not possible to place the setup elsewhere within the airport.
During observation, the layout of the arrival hall changed in between flights. At first, the animation was projected in front of a white wall with Dutch signs with small font size showing the way to odd-size baggage and exit. However, in between two flights the wall was changed by placing a blue design with English signs in a larger font. It is important to take this into account since it might have played a role in the behaviour of the passengers. This is, however, an inherent challenge when testing in an operational environment, such as at an airport.
For the observation study at the airport it was planned to also interview the passengers. However, once at the airport no passenger was willing to help with answering a few questions. The main reason for this was that the study observed that arriving passengers, who were usually in a hurry and therefore did not have time. In future studies, it would be helpful to observe departing passengers, since they usually have some waiting time prior to boarding and are more likely to agree to participate.
Eight out of ten participants for the laboratory test at Delft University of Technology were students. Students are not the only interesting group to use as participants for the airport context. A more diverse group of potential passengers would be more representative. One of the participants indicated they were colour blind. However, this did not affect his visual acuity on the projection since it is possible to see both the colours black and white with any form of colour blindness (Colour Blind Awareness, 2018).
As mentioned before, the tested animations were developed in Adobe After Effects version 15·0·1 (Adobe, 2018). The effect of the white colour was not tested or evaluated during the studies. According to Hidayetoglu et al. (Reference Hidayetoglu, Yildirim and Akalin2012), a colour temperature of 4,000 K can create a more positive perception of an area. However, different colours could be applied to differentiate situations and processes. Mijksenaar Wayfinding Experts (2018) described yellow as a relatively striking colour while red, on the other hand, is frequently used for signage that can refer to ‘danger’ or ‘prohibition’. Furthermore, theory from Philips Lighting B.V. (2016) and Royal Philips Electronics N.V (2008) explains that lighting can affect the mood and health of people. For instance, using blue light can have a positive effect on energy (Iskra-Golec et al., Reference Iskra-Golec, Wazna and Smith2012) and alertness (Brown et al., Reference Brown, Schoutens, Whitehurst, Booker, Davis, Losinski and Diehl2014). Therefore, consideration should be given to testing the effect of different colours for the animations in future studies.
5. CONCLUSION
Wayfinding, especially when experiencing difficulties, can be stressful for airport passengers. The aim of this paper is to understand if the use of light animations can improve the wayfinding experience within an airport context. Four light animation projections were tested and evaluated, after which the preferred animation was implemented and its impact on passenger behaviour observed at an airport.
These two user experiments revealed promising findings regarding intuitive wayfinding through light projections. In the laboratory test, participants rated the animation with the clearest vertical movement as best for indicating the direction to go. However, the same positive effect was not apparent during the field study observations at the airport. It has been assessed that the floor is not a good place for projecting light animations when large groups of people walk over it. Additionally, low contrast between the floor and projection meant many passengers did not notice the animation.
Future work should therefore involve studies to verify the effect of dynamic light projections when projected at eye-level (for example, on a wall) as well as in a less bright environment.
The paper presents the motivation, study and evaluation of using light animations for wayfinding purposes. This work contributes to findings regarding the effect of light animations to improve the wayfinding and experience within an airport context.
ACKNOWLEDGEMENTS
The authors would like to thank Mijksenaar Wayfinding Experts (in particular Fenne Roefs) for providing knowledge during the interview. Thank you Silvana Piro for helping with setting up and observing during the field study at the airport. The authors are very grateful to Rotterdam The Hague Airport for supporting and helping out with the observation at the airport, and to all the participants for volunteering in this study.
FINANCIAL SUPPORT
This project (PASSME) has received funding from the European Union's Horizon 2020 research and innovation programme under grant agreement No 636308.
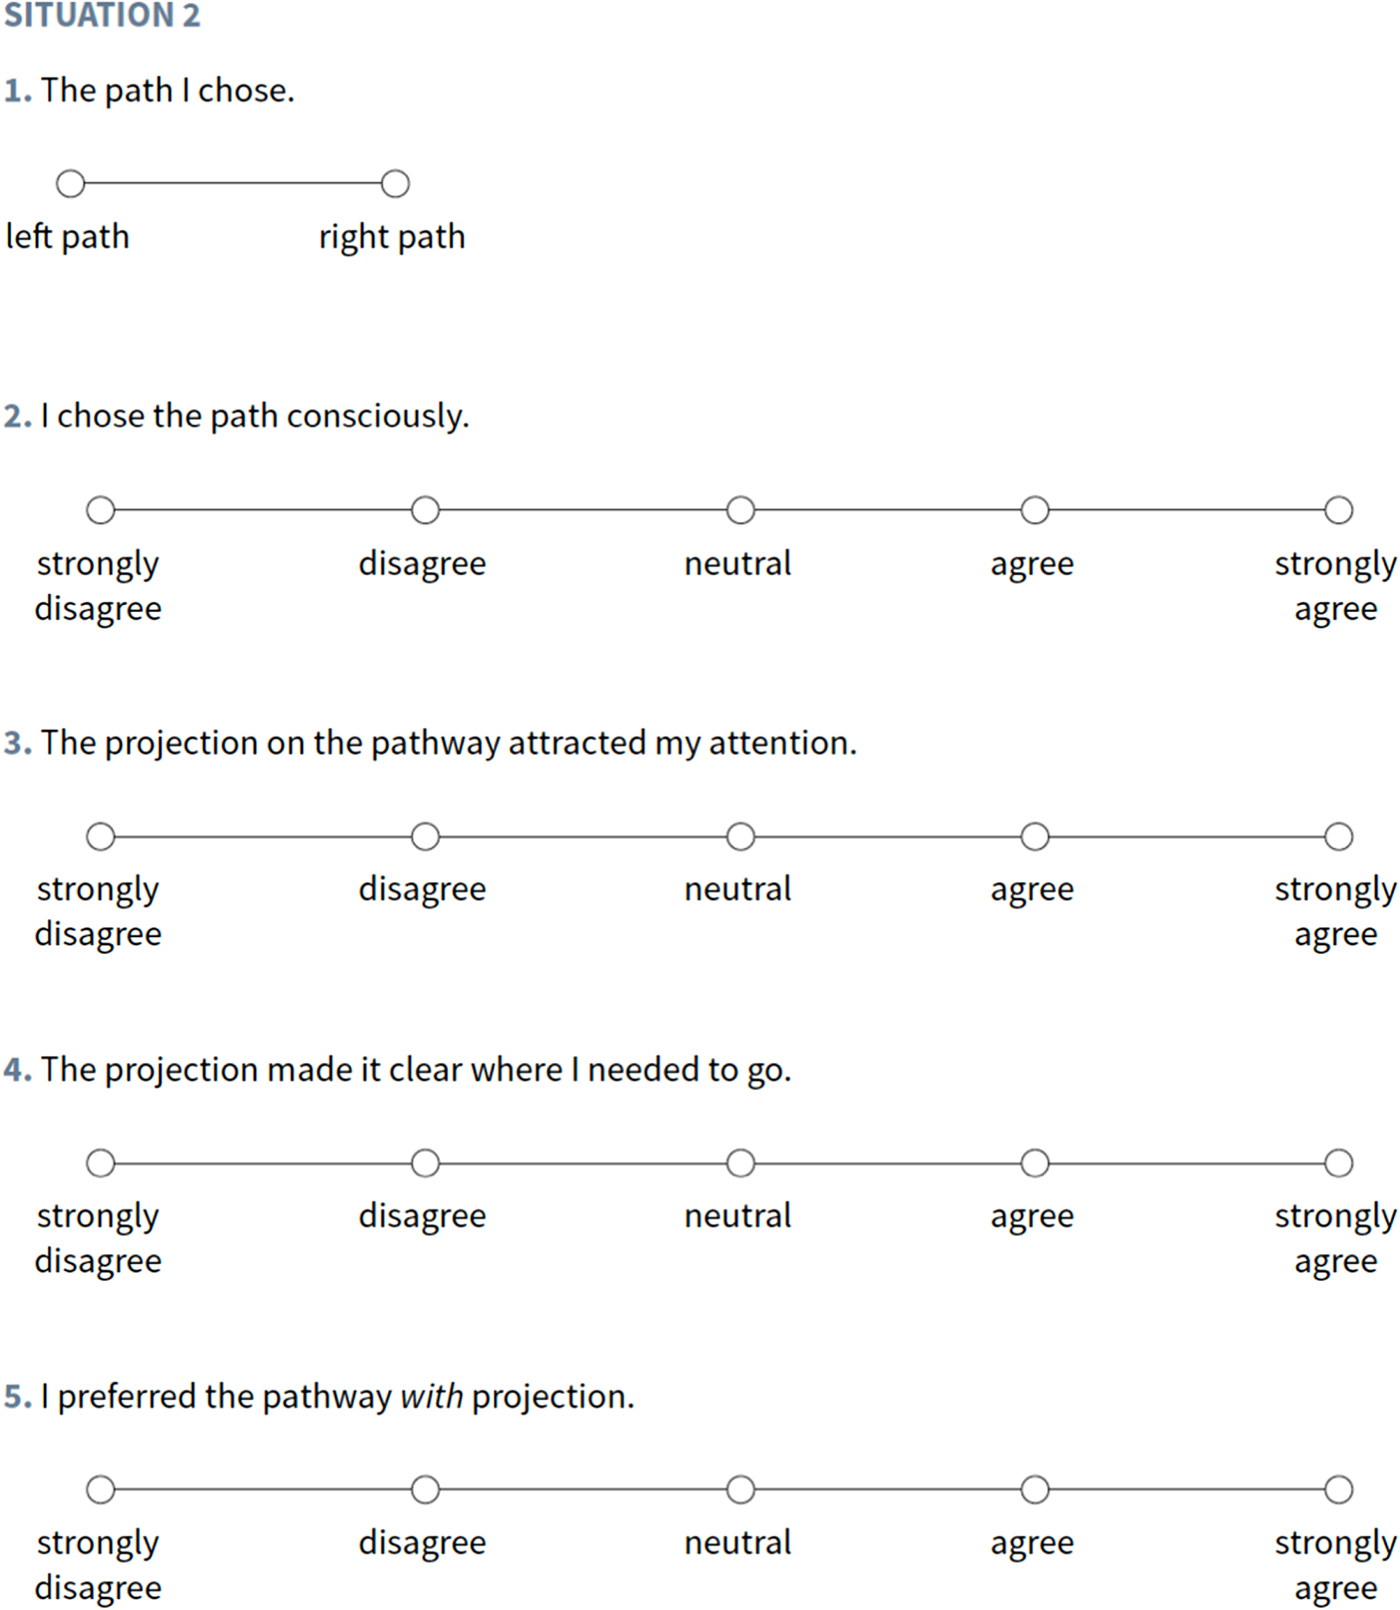
APPENDIX A: QUESTIONNAIRE FOR THE LABORATORY TEST
The following questions were repeated four more times (situations 2 to 5):
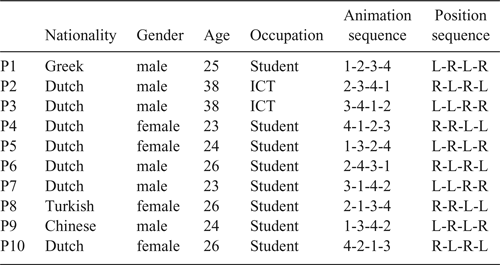
APPENDIX B: ANIMATION AND PATHWAY SEQUENCE FOR THE LABORATORY TEST
APPENDIX C: THE WALL IN THE ARRIVAL HALL
Wall at the beginning of the observation.

Wall after changing in between two flights.


 Open access