

1. Introduction
Antarctica’s ice sheet interacts with the ocean that surrounds the continent and is sensitive to changes in ocean state. This interaction is most obvious in terms of ocean temperature changes directly affecting floating ice-shelf melt rates and potentially leading to changes in the elevation and velocity of the adjoining grounded ice sheet (Reference Payne, Vieli, Shepherd, Wingham and RignotPayne and others, 2004; Reference Rignot, Casassa, Gogineni, Krabill, Rivera and ThomasRignot and others, 2004). However, the ocean tides also influence the flow of the floating ice shelves (Reference Riedel, Nixdorf, Heinert, Eckstaller and MayerRiedel and others, 1999; Reference DoakeDoake and others, 2002; Reference Brunt, King, Fricker and MacAyealBrunt and others, 2010), floating ice tongues (Reference Legrésy, Wendt, Tabacco, Rémy and DietrichLegrésy and others, 2004) and ice streams (e.g. Reference Anandakrishnan, Voigt, Alley and KingAnandakrishnan and others, 2003; Reference Bindschadler, King, Alley, Anandakrishnan and PadmanBindschadler and others, 2003a) on timescales of minutes to years. Indeed, there has been speculation that this interaction could have played a part in the generation of Heinrich-event icebergs, affecting global climate as a result (Reference Arbic, MacAyeal, Mitrovica and MilneArbic and others, 2004; Reference Griffiths and PeltierGriffiths and Peltier, 2008). The mechanism for this effect is yet to be demonstrated, but observations of forcing and response at several individual ice streams are now available from which understanding may be developed.
Along the Siple Coast of West Antarctica, the changing height of ocean water at ice-stream grounding zones induces a range of ice-stream motions from stick–slip (Reference Bindschadler, King, Alley, Anandakrishnan and PadmanBindschadler and others, 2003a,Reference Bindschadler, Vornberger, King and Padmanb; Reference Winberry, Anandakrishnan, Alley, King and BindschadlerWinberry and others, 2009) to semi-diurnal and diurnal periodic motions (Reference Anandakrishnan, Voigt, Alley and KingAnandakrishnan and others, 2003). Elsewhere in West Antarctica, the flow of Rutford Ice Stream is also modulated by the tides, with semi-diurnal, diurnal, fortnightly and semi-annual responses being most prominent in terms of displacement (Reference GudmundssonGudmundsson, 2006; Reference Murray, Smith, King and WeedonMurray and others, 2007). Ice-stream responses to known tidal forcing have been used as a natural experiment to infer ice-stream basal characteristics and develop models of ice-stream motion for the Siple Coast ice streams (Reference Anandakrishnan, Voigt, Alley and KingAnandakrishnan and others, 2003; Reference Bindschadler, King, Alley, Anandakrishnan and PadmanBindschadler and others, 2003a; Reference TulaczykTulaczyk, 2006; Reference Winberry, Anandakrishnan, Alley, King and BindschadlerWinberry and others, 2009) and for Rutford Ice Stream (Reference GudmundssonGudmundsson, 2007; Reference AðalgeirsdóttirAðalgeirsdóttir and others, 2008).
Of particular interest is the large range of responses in the flow of Rutford Ice Stream. The flow of no other ice stream has been shown to vary at such a large range of frequencies (we note that datasets of comparable length are not yet available for other ice streams). The signal at 14.76 days was shown by Reference GudmundssonGudmundsson (2007) to be closely replicated by a model which included non-linear response of the ice stream to vertical ocean-tide forcing. Interestingly, and potentially of great importance for ice-sheet models, Reference GudmundssonGudmundsson (2007) also found the model suggests that ∼5% of the mean flow of Rutford Ice Stream at the grounding line was induced purely by the non-linear response to the tides at the grounding line. The model proposed by Reference GudmundssonGudmundsson (2007) is based on the assumption that stresses resulting from the tidal forcing are transmitted upstream and affect the ice-stream velocity in a non-linear manner, so that the velocity is increased more by high tides than it is decreased by low tides; this explains why the tidal effects increase the overall ice-stream flow rate. Reference GudmundssonGudmundsson (2007) explained the relationship as resulting from transmission of stresses by linearly elastic ice, which then has non-linear impact on basal sliding or sediment deformation. The model used assumes a power-law relationship between basal shear stress and sliding of a type first proposed by Reference WeertmanWeertman (1983), and this empirical relationship is now commonly used in ice-sheet and ice-stream modelling, although with some modification (e.g. Reference PatersonPaterson, 1994). The power-law exponent is expected to be 2 or 3 (e.g. Reference PatersonPaterson, 1994), with a value very close to 3 found by Reference GudmundssonGudmundsson (2007). As presented, the model does not include the effects of direct viscoelastic response of the ice to tidal flexing, which is likely to be of greatest relevance to forcings in the semi-diurnal and diurnal bands.
One open question regarding the model of Reference GudmundssonGudmundsson (2007) is related to its ability to replicate the observed modulation of flow with periods <0.5 days, 27.55 days and ≥0.5 years (Reference Murray, Smith, King and WeedonMurray and others, 2007), which is presently unexplained. In particular, Reference Murray, Smith, King and WeedonMurray and others (2007) put forward several possible alternative mechanisms for explaining the semi-annual and annual variation in flow, but they did not test the model of Reference GudmundssonGudmundsson (2007) to see whether it could replicate their observed signal.
In this paper, we independently re-estimate the Reference GudmundssonGudmundsson (2007) model parameters using the much longer dataset of Reference Murray, Smith, King and WeedonMurray and others (2007) and test the model’s ability to explain the full set of periodic signals observed by Reference Murray, Smith, King and WeedonMurray and others (2007), from several cycles per day to many months. To do this, we force the model with tidal predictions based on the most recent ocean-tide model available for this region, as well as those based on actual tidal data collected downstream of the grounding zone. Furthermore, we predict the response over an 18.6 year tidal cycle, during which the lunar-related tidal constituents are modulated in amplitude and phase by several percent and a few degrees (Reference PughPugh, 1987). Finally, we test whether similar tidal modulation of flow may also be observable for other major Antarctic ice streams/glaciers where the amplitudes and dominant frequencies of the tidal signal are different.
2. Model and Data Information
2.1. Ice-stream (response) model
Reference GudmundssonGudmundsson (2007) modelled the total forward surface velocity, u s, of Rutford Ice Stream as
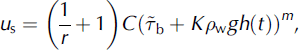
where r is the ratio between the mean sliding velocity and the mean forward deformational velocity, ![]() is the mean basal shear stress, K is a site-specific constant of proportionality between the tidally related hydrostatic pressure variation, ρ
w
gh(t), and the resulting perturbation in basal shear stress, ρ
w is the density of sea water (1023 kg m−3), g is acceleration due to gravity (9.81 m s−2), C is the sliding coefficient and m is the power-law exponent. Reference GudmundssonGudmundsson (2007) fit model parameters as listed in Table 1 (solution A), but noted that this set of model parameters is not unique in providing a satisfactory fit to the data segment analysed. Reference GudmundssonGudmundsson (2007) provided a detailed discussion of physically plausible values of
is the mean basal shear stress, K is a site-specific constant of proportionality between the tidally related hydrostatic pressure variation, ρ
w
gh(t), and the resulting perturbation in basal shear stress, ρ
w is the density of sea water (1023 kg m−3), g is acceleration due to gravity (9.81 m s−2), C is the sliding coefficient and m is the power-law exponent. Reference GudmundssonGudmundsson (2007) fit model parameters as listed in Table 1 (solution A), but noted that this set of model parameters is not unique in providing a satisfactory fit to the data segment analysed. Reference GudmundssonGudmundsson (2007) provided a detailed discussion of physically plausible values of ![]() , K and m in Equation (1), which we do not repeat here.
, K and m in Equation (1), which we do not repeat here.
Model parameters: A from Reference GudmundssonGudmundsson (2007), the others fitted to data from Reference Murray, Smith, King and WeedonMurray and others (2007); see text for details. Formal errors on the parameters determined using least squares (solutions C, D and E) are <1 × 10⁻⁴. Also shown are the mean velocity and the contribution of the tides to mean velocity

The time-variable component of the modelled motion is controlled purely by the tidal height, h(t), at a given time, t, at the grounding line. Rounding the value of m = 3.04 found by Reference GudmundssonGudmundsson (2007) to exactly 3 (consistent with, for example, Reference PatersonPaterson, 1994) allows us to investigate the frequency response given by the model. We show below that this value of m is also in agreement with a much longer data time series. We expand the relevant part of Equation (1) to obtain:
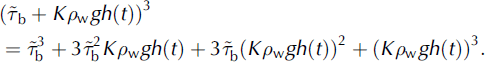
The time-variable response in this model is therefore governed by powers 1–3 of h(t). Consider now pairs (i and j) of tidal constituents such that:
where A, ω = 2π/T and φ are the constituent-specific amplitude, angular frequency and Greenwich phase, respectively, for tidal constituents with period T. Simplifying further to study the frequency content of the response only, we take Ai = Aj = 1 and φi = φj = 0. After manipulation:
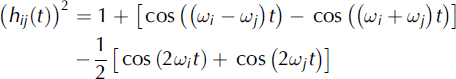
and
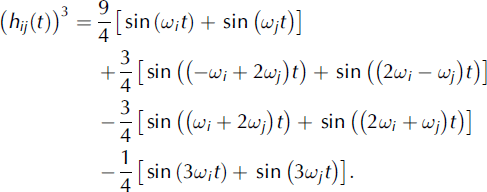
In the form of Equations (4) and (5), the modelled frequencies of response, hidden in Equation (2), may be read directly. We examine the frequencies in Equations (4) and (5) more closely in section 3.
2.2. Tidal (forcing) model
We initially force Equation (1) with a recent regional Antarctic tide model, CATS2008a, an updated version of the CATS02.01 model described by Reference Padman, Fricker, Coleman, Howard and ErofeevaPadman and others (2002). CATS02.01 predictions were used by Reference GudmundssonGudmundsson (2007) to force Equation (1). At the time of writing, CATS2008a is the most accurate ocean-tide model for the circum-Antarctic seas, with per-constituent error generally <0.05 m. Included in CATS2008a are four major semi-diurnal (M2, S2, K2, N2) and four diurnal (K1, O1, P1, Q1) tidal constituents (see Table 2 for frequencies). From these we infer many other related tidal constituents in these bands in a standard way (Reference PughPugh, 1987). We do not include forcing from longer-period signals, such as fortnightly terms, since the ice stream does not respond elastically at these frequencies, while it does perfectly so in the semi-diurnal band and very nearly perfectly in the diurnal band (Reference GudmundssonGudmundsson, 2007). Adopting an ocean-tide model means that we can make tidal predictions very close to the grounding zone, but any model errors will propagate into the predicted ice-stream response. To complement this approach, we also force Equation (1) with tidal predictions based on GPS observations of vertical tidal motion ∼20 km downstream of the grounding line (Reference GudmundssonGudmundsson, 2007). To do this, we use the analysis of Reference King and PadmanKing and Padman (2005) who separated related constituents in this short record (P1/K1 and S2/K2) using phase and amplitude relationships in CATS02.01 and we make tidal predictions based on those constituents, inferring related constituents as above. There will be some error in not accounting for the difference in tides at this location compared with those in the grounding zone. There is also error in CATS2008a; at the ice-shelf GPS site, differences between the CATS02.01/CATS2008a and observed tidal constituents reach several centimetres (Reference King and PadmanKing and Padman, 2005).
Response periods (days) for the major semi-diurnal and diurnal constituent pairs with m = 3

Owing to the non-linear nature of the model, the low-frequency terms are particularly sensitive to changes in the predicted amplitude and phase of the vertical semi-diurnal and diurnal tides. To examine the sensitivity to tidal errors, we modified the CATS2008a predicted M2 tide by 0.1 m in amplitude and evaluated Equation (1) (using the Reference GudmundssonGudmundsson (2007) values) and compared the output to results using an unmodified CATS2008a prediction. This level of vertical tidal error produced only an 8 mm difference in modelled horizontal displacement amplitude at 14.76 days and only a 3 mm difference in the semi-diurnal band. The same error applied to K2 produced a 50 mm difference at 183 days and a 1 mm difference in the semi-diurnal band. This suggests the modelled displacements are largely invariant to reasonable ocean-tide prediction errors, except at the longest periods where tide-related errors may be substantial.
2.3. Ice-stream position data
Our comparison of model and data is based on the ∼2 year dataset of Reference Murray, Smith, King and WeedonMurray and others (2007). However, there is a large data gap during the first ∼0.5 years (Reference Murray, Smith, King and WeedonMurray and others, 2007), so we excluded the entire earlier part of the time series. This yielded a highly periodic ice-stream response as shown in Figure 1 (after detrending the along-flow position) of ∼1.5 years in duration (although with some significant gaps). This is substantially longer than the similarly located records of Reference GudmundssonGudmundsson (2006) and Reference AðalgeirsdóttirAðalgeirsdóttir and others (2008), both of which were ∼7 weeks in duration. The record of Reference AðalgeirsdóttirAðalgeirsdóttir and others (2008) forms the initial portion of the record of Reference Murray, Smith, King and WeedonMurray and others (2007) and hence is not included in our analysis. In using this long record, we sacrifice some time-series precision and accuracy due to necessarily different GPS data analysis techniques (the shorter records were derived relative to a local base station, with some GPS systematic errors differencing, whereas the longer record we use was derived using Precise Point Positioning where they do not difference). Most notably, the record of Reference Murray, Smith, King and WeedonMurray and others (2007) has larger GPS-related systematic bias at some tidal periods (e.g. K1, K2 and S2; Reference King, Watson, Penna and ClarkeKing and others, 2008). Here we typically present detrended along-flow position in figures, but the displacement due to mean flow is also included in the model tuning and analysis.
Observed and modelled response (after detrending) using fits to the displacement data. Data are shown in terms of (a) velocity and (b) residual to mean along-flow displacement. Velocities with periods ≤1 day have been smoothed (a). Date format: Oct05 = October 2005.

3. Results
Using Equations (4) and (5), the model response periods for m = 3 were determined and are shown in Table 2. Examining the M2/S2 pair first, it is seen that the ice stream is predicted to respond with periods from 4 hours to 14.77 days. Indeed, the longest of the periods matches exactly that observed by Reference GudmundssonGudmundsson (2007). As observed empirically by Reference GudmundssonGudmundsson (2007), this pair of constituents generates semi-diurnal and fortnightly responses. However, the other constituent pairs also give modelled responses with long periods (>1 day, all due to the ω 1 − ω 2 component of Equation (4); Table 2). The semi-annual signal is the dominant contribution to the observed effect on detrended ice-stream position (Reference Murray, Smith, King and WeedonMurray and others, 2007) and we note that this period is predicted by the model to originate from pairs of major tidal constituents S2/K2 and K1/P1. Reference Murray, Smith, King and WeedonMurray and others (2007) demonstrated signals at 4 hours, 4.8 hours, 6 hours, 8 hours, 0.5 days, 1.0 days, 14.76 days, 27.55 days, and near 183 and 365 days. Table 2 shows that the signal at 4 hours, 6 hours, 0.5 days, 14.76 days, 27.55 days and 182.62 days may be explained by semi-diurnal forcing alone. Some part (<10 mm) of the high-frequency signal may have come from the GPS data analysis approach (Reference King, Watson, Penna and ClarkeKing and others, 2008). A poorly resolved long-period (near-annual) signal was reported by Reference Murray, Smith, King and WeedonMurray and others (2007), but there is no predicted response at periods longer than 183 days in Table 2. However, there are many non-tidal environmental factors (e.g. atmospheric pressure variations, snow loading and changing basal characteristics) that could account for annual and longer-period variations.
Reference Murray, Smith, King and WeedonMurray and others (2007) show no or little evidence of the predicted 13.66, 9.61 or 9.13 day signals shown in Table 2. The absence of a 13.66 day signal is particularly interesting since O1 and K1 are both large-amplitude signals in this region (Reference Padman, Fricker, Coleman, Howard and ErofeevaPadman and others, 2002) as is M2, although K2 is smaller. However, our reanalysis of the record of Reference Murray, Smith, King and WeedonMurray and others (2007) shows some signal at these periods (Table 3 lists the observed 13.66 day signal amplitude and phase). This difference may be due to the fact that Reference Murray, Smith, King and WeedonMurray and others (2007) used only an amplitude spectra computation, whereas we use least squares to estimate signal at the actual frequency.
Constituent amplitudes, A, and phases, φ, for solutions shown in Figure 2 and the response-to-forcing amplitude ratio. Constituents are only listed where CATS2008a forcing is >0.01 m or where long-period response exists at tidal frequencies. The m = 3 solutions correspond to solution A (Table 1) with K = ±0.16 and the m = 2 solution corresponds to solution E (Table 1). Formal errors are for the 95% confidence interval. Phases are omitted where the constituent amplitude is not significantly different from zero

The presence of 14.76 and 183 day signals due to non-linearity is important since the actual tidal forcing at these frequencies is small but the observed signal is large (Reference GudmundssonGudmundsson, 2006, Reference Gudmundsson2007; Reference Murray, Smith, King and WeedonMurray and others, 2007). A linear response to the tides could not explain the observed signal (Table 3; table 1 of Reference Murray, Smith, King and WeedonMurray and others, 2007); Equation (3) highlights that the long-period response related to ω 1 − ω 2 has its origin in non-linearity.
Examining the diurnal constituent pairs reveals an analogous set of long-period responses, due to ω 1 − ω 2, as for the semi-diurnal constituents. Short-period responses include frequency bands already seen for semi-diurnal pairs, plus responses near 8 hours and 1.0 days.
To overcome the simplifications required to produce Equations (4) and (5), we also forced Equation (1) with CATS2008a. Only constituents in the semi-diurnal and diurnal bands were used in the prediction (Table 3). For this initial examination, we used the model parameters of Reference GudmundssonGudmundsson (2007) as repeated in the first column of Table 1, with K = +0.16 corresponding to his site ∼40 km upstream of the grounding zone (our site is ∼50 km upstream, so we expect some difference). Figure 1 shows the predicted response for a period of nearly 1.5 years. The agreement between the model signal and the semi-annual signal is particularly good.
To examine the model output further, we performed a tidal decomposition on the predicted velocity response (Reference Pawlowicz, Beardsley and LentzPawlowicz and others, 2002). Figure 2 shows the constituent amplitudes. Amplitudes and phases (and their uncertainties) of the constituents where long-period response occurs are given in Table 3, alongside the responses at the major semi-diurnal and diurnal tidal periods.
Amplitude of observed and modelled periodic signals by their period, with different bands shown in (a–d). The m = 3 solutions correspond to solution A (Table 1) with K = ±0.16, and the m = 2 solution corresponds to solution E (Table 1). In many cases the two m = 3 signals over-plot one another exactly. Note the better agreement with the observations in the long period (d) for m = 3 compared with m = 2 and the lack of signal at ∼0.17 days (a) for m = 2.

The model parameters estimated by Reference GudmundssonGudmundsson (2007) may be refined using the longer dataset available to us. We determined model parameters in two ways: first using observed displacement, as done by Reference GudmundssonGudmundsson (2007), and second after computing velocity from the observed displacements (the velocity rather than displacement is modulated by the tides and is what is modelled in Equation (1)).
3.1. Fitting to displacement
For the displacement analysis we followed the procedure of Reference GudmundssonGudmundsson (2007) by first forward-integrating the modelled velocities to produce modelled displacements, meaning that the model tuning is dominated by fortnightly and semi-annual signals, plus the mean velocity. We tuned the model by minimizing the RMS of the observed minus-modelled detrended displacement signal on a parameter-byparameter basis. We tested a wide range of values around the values of Reference GudmundssonGudmundsson (2007), modifying one parameter while holding the others fixed. However, we note that r and C are mutually dependent in this model and hence cannot be determined independently. The determined model parameters are given in Table 1 (solution B). We found the model parameters to be well defined at the level of precision given in Table 1.
The model predictions of velocity based on these parameter values are shown in Figure 1, along with detrended displacement computed using forward integration. The velocity signal is shown after filtering out signals with periods ≤1 day. These are shown alongside the predictions using the parameter values from Reference GudmundssonGudmundsson (2007). The values of Reference GudmundssonGudmundsson (2007) clearly are not appropriate for our site, as they predict a higher mean velocity; otherwise the output is very similar. Regardless of model parameters, the amplitude of the semi-diurnal and diurnal signals is clearly overestimated. As we expect, given that mean flow, semi-annual and fortnightly signals dominate the displacement time series, the fit for these frequencies is better than for the semi-diurnal and diurnal frequencies.
3.2. Fitting to velocity
We then attempted to fit the model to the velocity data using least squares. In contrast to the displacement fit, fitting to velocity will emphasize the higher-frequency signals. Since the highest-frequency terms are subject to unmodelled physics as well as GPS systematic error at some frequencies, we filtered these out by computing velocities based on the GPS positions over 2.5 days and also filtering the modelled velocities. To enable linearization of Equation (1), we took the logarithm of both sides, meaning that we actually fit to log10(us). In the least-squares solution we fixed r = 107 (value determined by Reference GudmundssonGudmundsson, 2007) to overcome the mutuality with C but estimated the other parameters together. Using r = 110 instead (Table 1, solution B) will result in a slightly lower value of C. To help stabilize the solutions we added non-negativity constraints to ![]() , C and m. We found that allowing m to be completely freely varying produced unstable results, so we constrained m = 3 to within ±0.05, but noted that it adjusted by <0.001, suggesting that this constraint did not distort the solution. The solution converged quickly to the values shown in Table 1 (solution C). We repeated the solution on a shorter (∼7 week) section of data and found almost identical values, suggesting that the solution is not dependent on the frequency of the signal, at least at long periods. The solution showed no preference for the sign of K and, when negative initial values of K were specified, it converged to K = −0.18, instead of K = +0.18, with the other parameters being identical.
, C and m. We found that allowing m to be completely freely varying produced unstable results, so we constrained m = 3 to within ±0.05, but noted that it adjusted by <0.001, suggesting that this constraint did not distort the solution. The solution converged quickly to the values shown in Table 1 (solution C). We repeated the solution on a shorter (∼7 week) section of data and found almost identical values, suggesting that the solution is not dependent on the frequency of the signal, at least at long periods. The solution showed no preference for the sign of K and, when negative initial values of K were specified, it converged to K = −0.18, instead of K = +0.18, with the other parameters being identical.
Comparing the determined model parameters in Table 1, we note that fitting to the velocity gives a ∼20% lower value for ![]() and a 100% increase in the value of C, when compared with the solution tuned to displacement. The value of K changes only marginally. Comparing Figures 1 and 3 shows that solution C provides a substantially better fit to the observations. The 14.76 day signal is particularly well replicated, with only very small error in mean velocity (Table 1).
and a 100% increase in the value of C, when compared with the solution tuned to displacement. The value of K changes only marginally. Comparing Figures 1 and 3 shows that solution C provides a substantially better fit to the observations. The 14.76 day signal is particularly well replicated, with only very small error in mean velocity (Table 1).
To test the influence of tide model prediction errors in CATS2008a, we forced Equation (1) with the tidal prediction based on the downstream GPS observations rather than CATS2008a. The differences in best-fit parameters are very small (Table 1 solutions C and D). The modelled velocity and displacement for solutions C and D are shown in Figure 3, with the prediction based on CATS2008a giving too large an amplitude for the fortnightly and semi-annual signals (Table 2).
Same as Figure 1 but using the fits to the velocity data.

We then repeated the solution after first constraining m = 2. This solution did not converge. Table 1 shows the parameter values after 20 iterations (solution E), and the modelled velocity and displacements are shown in Figure 3. It is evident that the solution with m = 2 cannot replicate the observed long-period signal amplitude (Fig. 2) at the same time as replicating the mean flow rate (Table 1). However, the m = 3 solution does provide a good fit to both. Furthermore, Figure 2 shows that the higher-frequency signal seen in the observations at 6 cycles d−1 (0.167 days; Table 2) is not evident with m = 2. We note signal in the observations also at 5, 7 and 8 cycles d−1, but these are consistent with GPS observation error (Reference King, Watson, Penna and ClarkeKing and others, 2008). Following this analysis, we focus on the m = 3 solutions forced by the GPSderived tidal predictions for the remainder of this paper.
To investigate more closely the content of the observation-model fit across the entire time series, we computed Lomb amplitude spectra which are suited to gappy data (Reference ScargleScargle, 1982; Reference Press, Teukolsky, Vetterling and FlanneryPress and others, 1992). Figure 4 shows the amplitude spectra for the observed displacements and for those that remain after removing the model prediction. We note that the dominant fortnightly and semi-annual terms are well fit by the model. At the highest frequencies the model amplitude becomes obviously too large. The phases of the semi-diurnal and diurnal terms are particularly sensitive to model parameters (not shown). The amplitude over-prediction at semi-diurnal and diurnal amplitudes can be seen also in Reference GudmundssonGudmundsson (2007), using model parameters heavily influenced by the fortnightly term (and unaffected by the semi-annual terms). Reasons for the poor quality of the model fit at the higher frequencies are discussed below (see section 4).
Lomb amplitude spectra for the observations together with the residual after removing the model output (solution D). (a) Low-frequency signal and (b) high-frequency signal.

The semi-annual signal observed by Reference Murray, Smith, King and WeedonMurray and others (2007), and now shown to be reproducible by the model of Reference GudmundssonGudmundsson (2007), is not the longest-period signal that may be predicted by Equation (1). The lunar-related constituents (all considered here, except S2) undergo modulation throughout the 18.6 year lunar node tide cycle (Reference PughPugh, 1987). To examine the effect of this decadal change in the sub-daily term, we forced the model over 1.5 cycles (28 years from 1990.0). In addition to the signals evident in Figure 1, a signal with period 18.6 years and displacement amplitude ∼0.5 m is predicted by the model. Therefore, the effect on velocity is negligible and is unlikely to be of consequence.
4. Discussion
When considering the derived parameters by fitting two independent displacement datasets (ours and Gudmundsson’s) to the ice-stream response model they mostly compare very well, especially considering the fact that the procedure we used for our much longer dataset emphasizes the fit of the semi-annual signal, which could not be detected by Reference GudmundssonGudmundsson (2007) due to the shorter record (∼7 weeks) available to him. Our 25% smaller value of C, the sliding coefficient, is reflective of a lower velocity at our site (Fig. 1).
However, the superior fit to the model when using velocity data strongly suggests that the values based on displacement are not optimal, probably suffering from the simplistic fitting approach used and the dominance of the along-flow motion in the fitting. Our revised values of ![]() and C remain well within the plausible range. Despite the differences in fitting techniques and parameter values, the preferred value of m agrees with those of 2 or 3 quoted in the literature (e.g. Reference PatersonPaterson, 1994). Indeed, the employed model shows a very strong preference for m = 3, with m = 2 (or indeed m = 1) unable to fit the observations. These facts suggest that both the model and the derived parameters are robust and may well be more widely applicable.
and C remain well within the plausible range. Despite the differences in fitting techniques and parameter values, the preferred value of m agrees with those of 2 or 3 quoted in the literature (e.g. Reference PatersonPaterson, 1994). Indeed, the employed model shows a very strong preference for m = 3, with m = 2 (or indeed m = 1) unable to fit the observations. These facts suggest that both the model and the derived parameters are robust and may well be more widely applicable.
We have found K to have two minima, one near +0.17 (as found by Reference GudmundssonGudmundsson, 2007) and the other near −0.17. This may be interpreted as supporting the model as presented: if the model (Equation (1)) is correct, then K should be negative because increasing water level at high tide causes compressive (negative stresses) to be set up in the ice body (Reference GudmundssonGudmundsson, 2007). However, Reference GudmundssonGudmundsson (2007) also noted model refinements that could lead to a positive K being expected. The main difference between +0.17 and −0.17 is that the modelled diurnal and semi-diurnal signals change signs, as shown in Table 3. The longer-period terms remain unchanged. Neither choice of K gives agreement of the modelled phases of M2, N2, O1 and Q1 (all unaffected by GPS errors) with the observed phases (Table 3). We note, however, that the modelled semi-diurnal and diurnal terms of Reference GudmundssonGudmundsson (2007) are close in phase with their observations when they use positive K. Regardless, our data do not yet allow a definitive discrimination between these two minima; GPS analysis advances may yield a more precise reanalysis in the future, but the greatest change in semi-diurnal and diurnal phases (and amplitudes) will likely come through more complete model physics as discussed below.
4.1. Model fit at diurnal and semi-diurnal periods
At present, the relatively poor fit between the model and the diurnal and semi-diurnal flow variations is not explained fully. We can, however, speculate on three possible limitations of the model which could be significant (see also the discussion of Reference GudmundssonGudmundsson, 2007). Further data would be required to address these possibilities.
4.1.1. Basal conditions
Deviations from the model would be expected if there are changes in the manner in which the ice stream responds to tidal forcing, perhaps due to changes in the basal water system, or in the processes dominating flow at the bed. Reference SmithSmith and others (2007) show that profound changes at the bed of Rutford Ice Stream can occur rapidly. Observed changes have been: (1) switching between sediment deformation and basal sliding flow mechanisms; (2) formation and evolution of large bed forms (e.g. drumlins and mega-scale glacial lineations); and (3) hardening or softening of bed sediments without a switch between deforming and sliding. All of these can occur over timescales as short as approximately months to years. These changes in basal conditions could be a plausible explanation for variations in best-fit model parameters over longer periods, such as those we observe between years in the data, but are less likely to occur quickly enough to impact at significantly higher frequencies.
4.1.2. Effective stress
The normal formulation of the Weertman sliding law includes a non-linear effective stress term in the denominator. Thus, variations in the effective stress at the ice-stream bed should also cause deviations from the model’s predictions. The most plausible cause of such variations would be changes in the basal water pressure. Although there are no measurements of basal water pressure beneath Rutford Ice Stream, there are some potentially relevant data from Whillans Ice Stream. Unlike Rutford Ice Stream, flow variations on Whillans Ice Stream are driven by predominantly diurnal tides (Reference Bindschadler, King, Alley, Anandakrishnan and PadmanBindschadler and others, 2003a). Diurnal variations in basal water pressure, seismicity and vertical strain have been measured on Whillans Ice Stream (Reference Harrison, Echelmeyer and EngelhardtHarrison and others, 1993; Reference Engelhardt and KambEngelhardt and Kamb, 1997), which appear to be related to the ocean tides at the grounding line. As there is also a correspondence between basal seismicity and tidal forcing on Rutford Ice Stream (Reference AðalgeirsdóttirAðalgeirsdóttir and others, 2008), it is possible that this is due to tidally driven variations in basal water pressure. However, a full understanding of this possibility must wait until simultaneous basal water pressure, sliding rate and seismic emissions are measured on Rutford Ice Stream.
4.1.3. Combined tidally influenced mechanisms
A final possible explanation for the poorer fit at diurnal and semi-diurnal periods is that a number of different mechanisms may occur simultaneously that interfere destructively at these periods. For example, Reference Murray, Smith, King and WeedonMurray and others (2007) suggested that the interaction of ungrounding at high tide with changes in back-stress and sliding rate could modify the nature of the semi-diurnal and diurnal responses between spring and neap tides, because the phase of these responses will be different for the various mechanisms.
4.2. Model predictions for other ice streams
Reference GudmundssonGudmundsson (2007) considered the implications of the ice-stream response model for other ice streams, both those where tidal heights at the grounding line are similar to Rutford Ice Stream and those where they are significantly different. He concluded that different dynamic responses were mostly due to variations in tidal forcing, rather than any fundamental differences between the ice streams. Following our success applying the same model to our ∼1.5 year time series from Rutford Ice Stream, we now use it to make predictions for two other ice streams. This allows us to predict dynamic behaviour, which can be tested with field observations, and provide a further assessment of the applicability of the model. Figure 5 shows the predicted response using model parameters from Reference GudmundssonGudmundsson (2007). We used local tidal predictions from CATS2008a. The Rutford Ice Stream values are shown for comparison. We chose these two ice streams because we consider it possible that field observations to compare with the model predictions could be obtained in the near future.
Predictions of response by period (a, c) and residual to mean along-flow displacement (b, d) for three ice streams forced using the semi-diurnal constituents only (a, b) and both the semi-diurnal and diurnal constituents (c, d).

The semi-diurnal tides near Bindschadler Ice Stream and Lambert Glacier grounding lines are much smaller than those near Rutford Ice Stream and hence the predicted response is 2–10% of the Rutford response at semi-annual periods, as can be seen in Figure 5a and b. The response due to the diurnal terms is, however, similar. This is in disagreement with Reference GudmundssonGudmundsson (2007) who, after examining only semi-diurnal forcing of Bindschadler Ice Stream, suggested that a diurnal signal would dominate any long-period response (ignoring any frequency dependence in the elastic response of the ice stream). Instead, Figure 5c and d show that, assuming identical model parameters apply, tidal modulation of flow at semi-annual and fortnightly periods may also be observable at these other locations, with the amplitude of variations at along-flow positions greatest at lower frequencies (the converse will be true in terms of along-flow velocity). Since the signal-to-noise ratio of the long-period response is greatly increased relative to that for diurnal and semi-diurnal modulations, this could assist attempts to understand ice-stream/till interactions. Table 2 gives the periods of possible modulation that need to be considered. This will, of course, be subject to the model and its parameters being appropriate to these regions also. Tests reveal that amplitudes of variations in flow rate scale with the magnitude of the basal shear stress. This could be tested easily with appropriate GPS datasets, although long records of precise ice motion have not yet been published for either location.
4.3. Tidal component of mean ice flow
A necessary result of the non-linear response to tidally varying basal shear stress is that some component of the mean ice-stream velocity is present only because of the ocean tides (Reference GudmundssonGudmundsson, 2007). The contribution of tides to mean flow is given in Table 1 for the various solutions, showing a substantial increase (from 3.6% to 6.2% of mean flow) using our revised parameter values. This time-averaged component of the mean flow is almost entirely contributed by the (h(t))2 term in Equation (2), with a near-negligible component provided by the fourth term. The (h(t))2 term contributes to mean flow, according to this model, since it always possesses a positive mean, regardless of the sign of h(t) or K. The tidal component of mean flow in this model will therefore scale with the square of the tidal amplitude and is not sensitive to the sign of K.
Interestingly, this suggests that if the tidal range was to change for some reason, then the ice stream would also undergo a change in its mean velocity. Such a change in ocean-tide range may have occurred around Antarctica during the Holocene, for example (Reference Arbic, MacAyeal, Mitrovica and MilneArbic and others, 2004, Reference Arbic, Mitrovica, MacAyeal and Milne2008; Reference Griffiths and PeltierGriffiths and Peltier, 2009). The non-linear response of the model means that larger tidal range will give much faster mean ice-stream flow and smaller tidal range will give slightly slower flow (zero tidal range gives ∼6% slower flow in the case of the present-day Rutford Ice Stream). One implication of this is the potential influence on ice flow of sub-ice cavity shape near the grounding line. A restricted cavity normally amplifies the tidal range, although it is possible for damping to occur under some conditions. Falling sea level, for example, at a location where this reduced the cavity such that tidal amplification was significantly increased, would theoretically result in an increase in ice flow.
5. Conclusions
The flow of Rutford Ice Stream deviates from linear with periods ranging from < 1 day to 183 days. Previous results have shown that a model which includes a non-linear response to the tidal range at the grounding line is able to reproduce the 14.76 day signal (Reference GudmundssonGudmundsson, 2007). We have shown using exact analytical expressions based on m = 3 in Equation (1) that the same model predicts response periods from 4 hours to 183 days when forced by the major semi-diurnal and diurnal tides. Using an ice-flow record spanning 1.5 years the model is able to reproduce the semiannual modulation of flow observed by Reference Murray, Smith, King and WeedonMurray and others (2007). Best-fitting model parameter values based on this dataset are strikingly similar to those determined by Reference GudmundssonGudmundsson (2007) on an earlier and much shorter data span. However, parameter values obtained by fitting to velocity produce a substantial improvement in the fit to the model. Notably, we also find that an exponent to the basal shear stress with a value very close to 3 best explains the data; certainly a value of 2 does not fit the observations. The model, using our determined parameters, best fits the longer-period signal (semi-annual and fortnightly) but overestimates the amplitude of the signal at diurnal and semi-diurnal periods, highlighting that the simple model of Reference GudmundssonGudmundsson (2007) is not complete. For comparison, we predicted the response of Bindschadler Ice Stream and Lambert Glacier. Given identical model parameters, these ice streams show a similar response to Rutford Ice Stream but with ∼1–2 orders of magnitude smaller variability when forced by semi-diurnal tides alone. When forced by the diurnal tides alone, the response was similar for all three regions, with amplitude measurable with continuous GPS over several months. Ice-motion records spanning many months have not yet been reported for these locations. However, should they become available, they could indicate how widely applicable the Reference GudmundssonGudmundsson (2007) model is.
Importantly, the ability of the model to reproduce accurately both semi-annual and fortnightly signals suggests that the model is robust. Further evidence for the model robustness is the presence of predicted signal at most of the observed higher frequencies, with GPS error likely responsible for some of the unmodelled signal. Indeed, the response frequencies strongly suggest that they could not be explained by anything other than a non-linear interaction with forcing at tidal frequencies. One consequence of this is that some component of the overall ice-stream flow is provided solely by the present-day tides (Reference GudmundssonGudmundsson, 2007) and that tidal modification at the grounding line would result in a different flow regime of this major ice stream. The importance of this effect remains to be tested.
Acknowledgements
M.K. was funded by the UK Natural Environment Research Council (NERC) and a Research Councils UK Academic Fellowship, field data collection was funded by NERC Antarctic Funding Initiative and the British Antarctic Survey, and T.M.’s participation in the field was supported by a Leverhulme Trust Fellowship. R. Hindmarsh, T. O’Donovan and H. Pritchard are thanked for maintaining equipment in the field. We thank L. Padman and R. Pawlowicz for providing CATS2008a and t_tide, respectively. H. Gudmundsson kindly provided some GPS data. We thank B. Smith and L. Padman for very detailed and constructive reviews.


