


Introduction
The transition towards sustainable energy sources has garnered increasing attention in the United States (U.S.). Among more sustainable sources, solar and wind proliferation are more widespread due to notable gains in both cost efficiency and generation capacity (NREL 2021; Stid et al. Reference Stid, Shukla, Kendall, Anctil, Hyndman, Rapp and Anex2025). Nevertheless, utility-scale deployment, defined as 1 MW in capacity or greater, remains capital-intensive and involves complex trade-offs, particularly related to land use. Within this context, patterns of solar adoption reveal clear regional disparities. For instance, Southwestern states such as California, Arizona, Nevada, and Utah have reported higher installation rates and larger shares of electricity capacity derived from solar compared to the national average, benefiting from both high solar irradiance and relatively limited land-use conflict (EIA 2019; Hernandez et al. Reference Hernandez, Hoffacker and Field2014). On the other hand, in the Southeastern U.S., where solar irradiance is comparable to that of the Southwest, expansion has proceeded at a slower pace due to factors such as competing land demand, terrain heterogeneity, and climatic variability (Brown et al. Reference Brown, Tudawe and Steimer2022; Cuppari et al. Reference Cuppari, Higgins and Characklis2021).
In addition to the biophysical constraints, sociopolitical factors also shape the prospects for solar development. For example, stakeholder opposition, particularly among rural landowners, has emerged in response to large-scale energy projects, often driven by divergent political perspectives or concerns related to agricultural production (Tidwell and Tidwell Reference Tidwell and Tidwell2021). Caplan et al. (Reference Caplan, Woods, Chamberlain and Klain2025) further documented similar patterns of negative perception. Additionally, pressures from urbanization and concerns about ecological degradation mirror broader tensions in land-use planning, as seen in urban-adjacent contexts such as Boise, Idaho (Narducci et al. Reference Narducci, Quintas-Soriano, Castro, Som-Castellano and Brandt2019).
One alternative that is increasingly proposed is agrivoltaics. Under this model, landowners lease land to solar utilities while continuing existing farm operations, thereby alleviating concerns over permanent land-use change. Such dual-purpose land uses are not new in U.S. agriculture. For example, renewable energy initiatives have long included wind farm leases (Winikoff and Parker Reference Winikoff and Parker2024), which often provide supplemental income that serves as a financial buffer for agricultural producers (Majumdar and Pasqualetti Reference Majumdar and Pasqualetti2018; Vezzoni Reference Vezzoni2025).
Current research on agrivoltaics has primarily focused on its agricultural implications, particularly the microclimatic effects of solar panels on crop performance through modifications in shading, temperature, humidity, and soil moisture (Al-Mamun et al. Reference Al-Mamun, Dargusch, Wadley, Zulkarnain and Aziz2022). These changes can enhance yields for certain plant types, including row crops, vine crops, and specific fruits (Barron-Gifford et al. Reference Barron-Gafford, Pavao-Zuckerman, Minor, Sutter, Barnett-Moreno, Blackett, Thompson, Dimond, Gerlak, Nabhan and Macknick2019; Touil et al. Reference Touil, Richa, Fizir and Bingwa2021). Comparable benefits have also been documented in livestock systems, where grazing beneath panels can improve land-use efficiency, provide shade for animals, and contribute to soil quality (Towner et al. Reference Towner, Karas, Janski, Macknick and Ravi2022; Vaughan et al. Reference Vaughan, Brent, Fitzgerald, Wright and Kueppers2023).
Despite these agronomic benefits, a persistent barrier to wider adoption is farmers’ limited familiarity with the technology and lease contracts, which can be lessened by providing information. Information provision has been proposed as a strategy for reducing uncertainty surrounding emerging practices (Heiman et al. Reference Heiman, Ferguson and Zilberman2020; Pannell and Zilberman Reference Pannell and Zilberman2020). For instance, in conservation leasing contexts, expanding access to information has helped improve familiarity and support adoption decisions (Buckley Biggs et al. Reference Buckley Biggs, Shivaram, Acuña Lacarieri, Varkey, Hagan, Young and Lambin2022; Cuppari et al. Reference Cuppari, Fernandez-Bou, Characklis, Ramirez, Nocco and Abou-Najm2024; Macy et al. Reference Macy, Swanson, Seay-Fleming, Gerlak and Barron-Gafford2025; Pascaris et al. Reference Pascaris, Gerlak and Barron-Gafford2023; Weigel et al. Reference Weigel, Harden, Masuda, Ranjan, Wardropper, Ferraro, Prokopy and Reddy2021).
However, evidence on the effectiveness of such interventions remains mixed. On one hand, information can reduce uncertainty by clarifying potential risks and returns, encouraging more timely adoption (Dessart et al. Reference Dessart, Barreiro-Hurlé and Van Bavel2019; Greiner et al. Reference Greiner, Patterson and Miller2009). Information may also function as a behavioral nudge, fostering environmentally responsible practices (Palm-Forster et al. Reference Palm-Forster, Griesinger, Butler, Fooks and Messer2022). On the other hand, studies caution that information campaigns may overstate benefits, while outcomes often depend on message framing and the pace of farmer learning (Graham and Abrahamse Reference Graham and Abrahamse2017; Oyinbo and Hansson Reference Oyinbo and Hansson2024; Wuepper et al. Reference Wuepper, Wree and Ardali2019).
In addition to informational barriers, the economic viability of agrivoltaics frequently potentially depends on policy support. While projects may achieve profitability through cost synergies, such as the shared use of materials, equipment, and farm assets alongside solar infrastructure (Trommsdorf et al. Reference Trommsdorff, Hopf, Hörnle, Berwind, Schindele and Wydra2023), programs like the Rural Energy for America Program (REAP) are often necessary for agrivoltaics to outperform exclusive agricultural land use (Mishra et al. Reference Mishra, Miao, Musa, Brothers, Khanna, Rabinowitz, Mwebaze and McCall2025). Yet, despite these financial considerations, relatively little is known about how landowner perceptions, attitudes toward leasing, and the interaction of behavioral and financial factors shape willingness to participate in agrivoltaics agreements (Al-Mamun et al. Reference Al-Mamun, Dargusch, Wadley, Zulkarnain and Aziz2022).
This study contributes to the literature on agrivoltaics adoption by pursuing two primary objectives. First, characterize and estimate the influence of farm, farmer and other characteristics on farmers’ willingness to lease their land for agrivoltaics. Second, estimate whether additional information on agrivoltaics affects willingness to lease land for solar development. To address the research objectives, we utilize data obtained from a survey of 177 farmers in South Carolina. The survey was conducted in the fall of 2024 and spring of 2025. Willingness to lease land for agrivoltaics was measured using a 5-point Likert scale ranging from Very Unlikely to Very Likely. Given the ordinal nature of this variable, an ordered logit model was used to estimate the influence of farm and farmer, and to assess the effect of additional information on the probability of agrivoltaics adoption.
The information treatment consists of two levels: control (basic information) and treatment (additional information). Farmers were randomly assigned to one of these levels, enabling us to estimate the causal effect of information provision. This paper contributes to the literature, indicating that information matters in reported willingness to lease, which suggests that policies designed to increase information are likely to have an impact on adoption. This result suggests that increasing farmers’ awareness of agrivoltaics can indirectly help curb emissions from energy production by increasing the adoption of agrivoltaics.
Methodology
Survey design
The data for this study were obtained from a larger project aimed at promoting and incentivizing the adoption of conservation practices among agricultural producers in South Carolina (SC) who produce the major agricultural commodities in the state. Farmers were invited to participate in the project through email, phone, online platforms, social media, extension meetings (interactions) and through the Clemson University and South Carolina State University extension network during 2023 and 2024.Footnote 1 Given the nature of recruitment efforts, it is unknown how many farmers and farm managers were contacted to enroll in the program during this period, for reasons such as email lists might have duplicated addresses, a lack of knowledge of who participated in the extension meetings, and uncertainty on how many people accessed the project website or social media pages.
In the first year of the project, 304 farmers applied to participate, of whom 286 met the eligibility criteria. Of these, 255 signed participation agreements. Completion of a questionnaire was required to receive incentive payments. The data used in this study were collected from survey instruments administered to participants in the second year of the program. Of the 255 initial program participants, 215 continued into year two. Surveys were conducted between November 2024 and February 2025. The final sample consisted of 177 responses and does not represent all farmers enrolled in the second year of the program, as some farmers had not completed the survey when the program was terminated in April 2025.
The survey instrument employed a blocked experimental design to control potential informational framing effects. Respondents were randomly assigned to one of two treatment groups: the “Basic Information” block and the “Additional Information” block. Respondents in the “Basic Information” block received only a definition of agrivoltaics. Respondents in the “Additional Info” block received a definition of agrivoltaics, along with information on typical project sizes and the potential benefits of leasing land for agrivoltaics projects, including a range of payments and potential impacts on agriculture.
A total of 80 respondents were assigned to the basic group and 97 respondents to the additional information group. Except for the additional provision of information as described below, the survey remained the same for both groups. The basic information statement was as follows:
This project aims to assess producer decisions regarding agrivoltaic solar energy. The results of the survey will help us better understand how to assist farmers in improving their working capital and farm profitability.
“Agrivoltaics” refers to solar panels that are co-located on the same land as agriculture. This concept is also referred to as “solar grazing”, “agrisolar”, “dual use solar”, and “low-impact solar”
To build the additional information treatment, we draw from several sources, including academic and industry outlets (Ong et al. Reference Ong, Campbell, Denholm, Margolis and Heath2013; Walley-Stoll Reference Walley-Stoll2022). The additional information block was:
This project aims to assess producer decisions regarding agrivoltaic solar energy. The results of the survey will help us better understand how to assist farmers in improving their working capital and farm profitability.
“Agrivoltaics” refers to solar panels that are co-located on the same land as agriculture. This concept is also referred to as “solar grazing”, “agrisolar”, “dual use solar”, and “low-impact solar”. The smallest utility-scale projects are around 7–10 acres in size. “Utility-scale” is defined as 1 Megawatt (MW) in capacity. However, the profitability of projects can increase with the size and capacity of projects and is dependent on location, panel density, and orientation.
Solar leasing rates are reported to range from $250–$2000 per acre. Footnote 2 Solar Panels can provide important shade, allowing livestock to rest under them during hot months.
After receiving the informational treatment, survey respondents were asked: “If approached by a solar energy company or government utility, how likely are you to consider signing a lease agreement allowing them to build solar panels on your land in exchange for a lease payment?” Respondents indicated their willingness to lease on a five-point Likert scale with options ranging from Very Unlikely to Very Likely. Those who selected Unlikely or Very Unlikely were further asked to provide a reason, with response options including insufficient lease payment, physical limitations of the land, concerns about potential land damage, and reluctance to enter a contract.
In another block of the survey, questions were added to capture information about the agricultural operation, such as acreage. Sociodemographic characteristics were also gathered for the respondents (i.e. gender, education, years of farming experience). Finally, respondents were asked questions to assess their agreement with environmental statements and identify their risk preferences.
Empirical strategy
Considering the nature of our variable of interest (willingness to lease land for agrivoltaics development (y i )) reflects ordered levels of potential future participation ranging from weak to strong, we employed an ordered logit model for the analysis. This logit model and the probit model has been used in several studies on adoption of technologies (Berg et al. Reference Berg, Thayer, Silva, Vassalos, Wang and Smith2025) and willingness-to-pay (Behler et al. Reference Behler, Silva, Vassalos and Ureta2024; Umberger et al. Reference Umberger, Thilmany McFadden and Smith2009). This modelFootnote 3 can be specified as: $y_i^* = \boldsymbol{X}_i^{\prime}\beta + u_i$
where i represents the respondents (i = 1, 2, ⋯, 177), y i * is the latent variable capturing producer i’s willingness to lease, X i is a vector containing the independent variables, including the information treatment, farm, and farmer characteristics. β is a vector of parameters to be estimated, excluding the intercept, and u i is the stochastic error that follows a logit distribution. The relationship between the variable of interest (y i ) and the latent variable (y i *) is given by: ${y_i} = j\ if{\mu _{j - 1}} \lt y_i^* \lt {\mu _j}$
where μ j are the threshold parameters known as “cut-points” and estimated jointly with the β for j alternatives.
Figure 1 presents the distribution of the dependent variable (yi ) by information treatment (basic versus additional). Overall, most respondents reported being very unlikely to lease their land for agrivoltaics, with only about 25% indicating that they would be likely or very likely to lease. However, differences emerge when responses are disaggregated by treatment group. Consistent with expectations, respondents who received additional information were less likely to select very unlikely (28% compared to 38% under the basic information treatment) or unlikely (16% compared to 19%). At the same time, the proportion choosing neutral (29% versus 20%) or likely (14% versus 8%) increased. Table 1 provides descriptive statistics for the key variables.
Distribution of willingness to lease land for agrivoltaics development by information type – basic (n = 80) versus additional information (n = 97).
Note: Percentages for willingness to lease were calculated for each information group separately. For additional information, the percentages were 28%, 16%, 29%, 14% and 12%, roughly adding to 100%.

Descriptive statistics of variables used in the regression model

Note: (base) refers to the reference base in the regression analysis.
We also controlled for farmer characteristics, aiming not only to obtain an accurate estimate of the effect of additional information but also to shed light on which characteristics are associated with a greater willingness to lease their land for agrivoltaics. To capture the influence of farmers’ demographics, we created a dummy variable female equal 1 if the respondent was female, 0 otherwise; nonwhite equal 1 if the respondent was non-white and 0 otherwise; and bachelor or higher equal 1 if the respondent has a bachelor’s degree or higher, 0 otherwise. As shown in Table 1, most of our respondents are white males, with only 15% identifying as female and 36% responding non-white. To capture a farmer’s experience, we created two dummy variables Farmer5to10, equal to 1 if the farmer reported 5–10 years of farming experience, 0 otherwise and FarmerMore10, equal to 1 if the farmer reported 11 years or more of experience, 0 otherwise. Most respondents in our sample (74%) have more than 10 years of experience.
Following Finger et al. (Reference Finger, Wüpper and McCallum2023), respondents were asked to self-assess their financial risk preferences with respect to external financing on a scale from 0 (very unwilling to take risk) to 10 (very willing to take risk). This measure, referred to as Financial Risk, was included among the explanatory variables. The mean value was 3.68, with a median of 4 (Table 1), suggesting that respondents are generally risk averse, leaning closer to unwilling than willing to take risks. Notably, 28.8% of respondents selected 0 or 1, while only 11.3% selected 7 or higher, indicating that – with few exceptions – most participants identify as financially risk averse.
The willingness of farmers to lease their land for agrivoltaics might also be associated with their environmental beliefs, especially because energy production alternatives have been shown and are widely associated with the environment. To account for this association, a question was added to the survey that asked respondents to state their agreement to the following statement using a 5-level Likert scale: “Considering the Environment in Production Decisions Lowers Profit.” The dummy variable Environmental trade-off was created and equals 1 if the respondent has selected Agree and Strongly Agree. Approximately 20% of the respondents reported either agreeing or strongly agreeing to the statement.
Some respondents may have previously acquired knowledge about agrivoltaics through various channels, including meetings with extension agents. Respondents were asked: “How often have you interacted with an extension agent in the last 12 months?” and prompted to select ranges of interactions from none to 12 or more times in the last 12 months. To account for the potential association between such interactions and willingness to lease, we included multiple binary variables to characterize a farmer’s interactions with extension agents. A dummy variable of Extension2to3, coded as 1 if the farmer meets with extension agents 2–3 times per year, 0 otherwise was added. A second dummy variable of Extension4to5, coded as 1 if the farmer meets with extension agents 4–5 times per year, 0 otherwise, was added. A third variable of Extension 6orMore, coded as 1 if the farmer met with extension agents 6 or more times a year, 0 otherwise, was added. These thresholds were chosen to capture interactions occurring roughly twice a year, up to every other month or more, which exceeds typical meeting frequency expectations. In our sample, 17% of respondents met with extension agents six or more times over the past year, with 43% among those who received basic information and 57% among those who received additional information.
The survey asked respondents to report total sales for the operation for the last three years. Approximately 8% of the sample reported sales greater than $1,000,000. Yet, 42% of the sample reported sales of less than $25,000. Using the midpoint of the ranges, the mean was $289,000 and median sales were $125,000. Based on the USDA measure of small farms (USDA, 2021),Footnote 4 less than or equal to $350,000, we created our dummy variable, Sales larger than $350k. It is important to notice that even though our sample split producers into three programs (Leafy Greens, Beef Forage and Peanuts), producers in each program oftentimes report multiple production types. Our sales measure captures this production diversity. See the appendix for the question text.
As mentioned above, our sample is composed of producers enrolled in a project split into three programs – leafy greens, beef forage and peanut programs. Program assignment was selected by the producers, mostly based on their main commodity; however, farmers may produce more crops than the commodity listed in the program. For example, Leafy Greens program enrollees also reported producing other vegetables (97%) and row crops (39%), Beef Forage program enrollees also reported producing timber (41%) and other livestock (100%), and Peanuts program enrollees also reported producing other row crops (100%), timber (34%) and livestock (25%). These numbers also show that even though our sample consists of respondents participating in a project with programs that cover three different commodities, the number of crops produced is greater than just the incentivized commodity and is a reasonable representation of the broader agricultural production in the state.Footnote 5 For a full breakdown of production types reported by producers in each program please see Appendix C.
To control for factors and characteristics that motivated producers to enroll in one of the three programs, we created three dummy variables (Leafy Greens Program, Beef Forage Program, and Peanut Program), each equal to 1 if enrolled in that program and 0 otherwise. Note that producers could only enroll in one program. To control for differences in production across the state, we created four regional dummy variables – Upstate (10 counties, and 27 respondents), Low Country (12, and 65), Midlands (12, and 25) and Peedee (12, and 60). We also controlledFootnote 6 for solar exposure using solar irradiance by zip code obtained from the United States Department of Energy NREL. A geospatial data layer showing direct normal irradiance (DNI) from 1998 to 2016 for the state of South Carolina was downloaded (Sengupta et al. Reference Sengupta, Xie, Lopez, Habte, Maclaurin and Shelby2018), and an average was calculated based on zip code using ArcGIS Pro.
Results
The estimated coefficients of the ordered logit model are reported in Table A1, and the marginal effects for all variables are in Table 2. Ten of the 18 independent variables are statistically significant at least the 10% level, indicating that several factors, including farm and farmer characteristics and fixed characteristics, are associated with the willingness to lease their land for agrivoltaics. Plots of the marginal effects for additional information and experience are in Figures 2 and 4.
Marginal effects

Standard errors in parentheses *p < 0.1, **p < 0.05, ***p < 0.01.
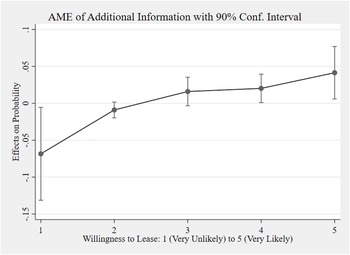
Average marginal effects for Additional Information over all five categories of the willingness to lease with a 90% confidence interval.

Our results on additional information confirm the analysis presented in Figure 1, that additional information can incentivize leasing of their land to agrivoltaics. Specifically, additional information has a specific impact on those who are strongly opposed to this technology. The average marginal effect on Very Unlikely is −0.0685, which means that those who received additional information are nearly 7 percentage points less likely to respond Very Unlikely. Figure 2 shows that additional information largely decreases the probability of selecting Very Unlikely and increases the probability of selecting Likely (2 percentage points) and Very Likely. Respondents who received additional information were 4.1 percentage points more likely to select Very Likely and 2 percentage points more likely to select Likely. Given that the extra information provided to respondents showed both a range of additional revenue from leasing and other benefits, we are unable to discern what type of information was more important to their decision.Footnote 7
While additional information has a substantial effect on decreasing the likelihood of answering Very Unlikely, it also increases the likelihood to lease their land for this energy alternative. Farmers usually obtain information from an array of sources such as directly from extension agents, from neighbor farmers, input suppliers, and social media nowadays. In the survey, respondents selected among 16 alternatives for the following question “Select up to 3 outlets from which your primary source of advice on farming practices comes.” The top three answers were Cooperative Extension Agent (60% of the respondents selected), Other farmers (58%), and Conferences, Meetings, & Trade Shows (27%).Footnote 8 A policy that relies on distributing information on agrivoltaics through extension agents and at conferences can reach 72% (n = 127) of the respondents in our sample. Of those respondents, 45% did not receive additional information on our study, and 50% reported Very Unlikely and Unlikely. It is very unlikely that extension agents and conferences have been widely discussing agrivoltaics, which implies that an increase in its discussion can reach out to 50% of those not interested and increase leasing of this energy alternative.
In an environment where subsidies for clean energy may not exist, a policy design that explores an educational component for those who are leaning toward leasing land to agrivoltaics (Neutral, Likely, and Very Likely – a total of 89 respondents or 50%) is very likely to have a positive impact on the expansion of agrivoltaics. While we are not measuring consumer acceptance of energy generated from agrivoltaics as in Zeddies et al. (Reference Zeddies, Parlasca and Qaim2025) or farm products produced jointly with energy, our results show some openness from farmers to lease their land, which could help guide companies through the expansion of agrivoltaics.
Reasons for low desirability
Participants who answered Very Unlikely or Unlikely to the adoption question (n = 88) were asked a follow-up question regarding their reasons for reluctance to adopt agrivoltaics. Specifically, respondents were instructed to select at least one of nine possible alternatives. Figure 3 presents the full list of alternatives along with the number of respondents who selected each. The most frequently cited concern was “Concerns over damage to my land,” selected by 44 respondents (50%). This was followed by “I do not want people on my land” (29 respondents, 33%), and both “I do not want to risk reducing yields” and “Other reason,” each selected by 25 respondents (28%). Among those who chose “Other reason,” approximately one-quarter cited aesthetic concerns, with comments such as “looks terrible,” “aesthetics,” and “visuals.”
Results in Figure 3 indicate that more information (in addition to the one provided in this study) can help increase acceptance of agrivoltaics. For instance, concerns regarding damage to the land and concerns about yield could be curbed through providing extra information to farmers. Conversely, approximately half of the respondents who answered Very Unlikely or Unlikely, indicated that information campaigns may have limited efficacy. To illustrate, 33% selected “I do not want people on my land,” while others cited issues such as aesthetics and mistrust of solar companies in open-text responses.
Reasons to report Very Unlikely and Unlikely to lease land for agrivoltaics by information (number of respondents for each category is listed in horizontal bar).

Additional associations with willingness to lease
In addition to information treatment, several other variables were statistically significant. Their marginal effects are displayed in Table 2 and in Figure 4. Farmers who self-reported being willing to take financial risk (greater values for the variable Financial Risk) are more likely to have selected Very Likely to lease their land for agrivoltaics, and are less likely to have selected Very Unlikely. Our results show that farms with sales greater than $350,000 and farmers who believe that environmentally friendly farming lowers profit are less likely to lease their land for agrivoltaics.
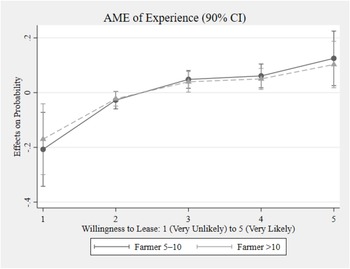
Average marginal effects for Farmer5to10 and FarmerMore10 over all five categories of the willingness to lease with a 90% confidence interval.

Farmers reporting experience of 5 to 10 years and more than 10 years of farming experience are more likely to lease (Figure 4). One explanation is that these farmers, in comparison to those in their first few years of production, are now able to focus on other areas of the operation and can consider adopting alternative income streams. The marginal effects are similar for these experience levels. Respondents with 5–10 years of experience were 12.5 percentage points more likely to select Very Likely, and respondents with 10 years or more of experience were 10.3 percentage points more likely to select Very Likely.
Finally, we find that many of the sociodemographic variables to describe the farmer are not statistically significant. We also find that the Extension interaction variables are not statistically significant. This is not surprising as Extension agents are largely focused on increasing knowledge of production practices and not business literacy or profitability, such as the implementation of alternative land uses or streams of income.
Conclusions
Although the U.S. Southeast benefits from favorable solar irradiation, producers remain hesitant to adopt solar panels due to a combination of biophysical constraints and socio-political considerations. Concerns regarding the potential displacement of agricultural land are particularly pronounced. Agrivoltaics presents a promising pathway to address these challenges by allowing landowners to lease land for solar development while sustaining agricultural production, thereby aligning renewable energy expansion with the preservation of farmland.
One explanation for the limited adoption of agrivoltaics systems is the potential lack of producer awareness and understanding of this emerging technology. This study contributes to the literature by assessing how information provision influences the likelihood that producers will adopt agrivoltaics. Results indicate that respondents who received more detailed information about agrivoltaics were 6.9 percentage points less likely to report being very unlikely to lease land, underscoring the role of information in shaping farmers’ willingness to adopt. Among respondents who indicated they were unlikely to lease, many cited concerns that appear to stem from misinformation or knowledge gaps. Consistent with producers’ own assessments of credible information sources, policies that promote the dissemination of agrivoltaics information through extension agents, workshops, and conferences could enhance willingness to lease. These findings suggest that targeted educational initiatives and outreach programs providing accurate and up-to-date information on agrivoltaics technologies could meaningfully increase adoption.
While this study is among the first to examine farmers’ perceptions and willingness to lease land for agrivoltaics, the sample is limited to producers in South Carolina during the 2024/2025 season and recruitment was limited to agencies’ rosters of contacts, resulting in a sample with a few characteristics that are not representative of the larger U.S. population. This might limit the transferability of results outside of the Southeast. Future research should expand the geographic scope to include other states, with particular attention to regional comparisons such as the Southeast versus the West. In addition, although this study identifies key farm and farmer characteristics that influence willingness to lease, further research could explore payment structures and contractual terms that are most attractive to producers, as well as how these features shape adoption decisions.
Supplementary material
The supplementary material for this article can be found at https://doi.org/10.1017/age.2026.10036.
Data availability statement
The survey data used in this research is confidential. However, code is available upon request.
Acknowledgements
The authors would like to thank the suggestions and comments from reviewers and the editor as part of the review process.
Funding statement
This material is based upon work supported by the U.S. Department of Agriculture, under agreement number NR233A750004G049.
Competing interests
The authors declare no competing interests.





 Open access

