


‘… whenever possible, adopt estimation thinking and avoid dichotomous thinking’.
(Cumming, Reference Cumming2014, p. 8)
‘… it is a custom more honoured in the breach than the observance’.
(Hamlet, Act 1 Scene 4)
Many recommend that researchers should acknowledge statistical uncertainty and quantify explanatory power to discourage naïve or overstated interpretation (e.g., Cohen, Reference Cohen1994; Cumming, Reference Cumming2014). Consequently, efforts to improve the reporting of quantitative research encourage or mandate reporting confidence intervals or credibility intervals (which quantify measurement precision or uncertainty) and measures of effect size (which quantify the degree of explanatory power attributable to a factor).
Wilkinson and the American Psychological Association (APA) Task Force on Statistical Inference (Reference Wilkinson1999) recommend that researchers should ‘always present effect sizes for primary outcomes’ (p. 599) and that ‘interval estimates should be given for any effect sizes involving principal outcomes’ (p. 599). Indeed, the APA Manual states that ‘complete reporting of all tested hypotheses and estimates of appropriate effect sizes and confidence intervals are the minimum expectations for all APA journals’ (Section 3.7). Such prescriptions are a response to concerns—voiced over many decades—that conclusions about scientific hypotheses should not rely solely on inferences about the (mere) presence of effects identified via null hypothesis significance testing (NHST) and should pay close attention to the size of those effects (Cohen, Reference Cohen1994; Cumming, Reference Cumming2014; Meehl, Reference Meehl1967, Reference Meehl1978). Interestingly, the APA Manual does not reference effect sizes or confidence intervals in its guidance for how to discuss results, as distinct from how to report results. However, Wilkinson and The APA Taskforce (Reference Wilkinson1999) recommend that a Discussion section should: ‘Explicitly compare the effects detected in your inquiry with the effect sizes reported in related previous studies’ (p. 607). Moreover, many of the arguments for reporting effect sizes and confidence intervals relate to the interpretations and conclusions that researchers can draw from their data, and/or the application of findings and conclusions beyond the confines of their current research study. For instance, in building a case for wider reporting of effect sizes and confidence intervals, Cumming (Reference Cumming2014, p. 8) encouraged researchers to use ‘knowledgeable judgment in context to interpret effect sizes’ and ‘whenever possible, adopt estimation thinking and avoid dichotomous thinking’. Such encouragements reflect the view that, often, evidence that a non-zero effect exists provides sparse information about a theoretical proposition or practical application, as compared to knowing how much the effect departs from zero and the precision with which that effect is estimated (Cohen, Reference Cohen1994; Meehl, Reference Meehl1967, Reference Meehl1978). Therefore, it seems reasonable to expect that, if effect sizes and confidence intervals are reported, there would (perhaps should) often be some discussion of the implications for theory and/or application of that effect size information and the uncertainty or precision associated with their estimation.
Consequently, in this research study, we set out to assess practices for reporting and discussing effects within a sample of recently published research articles from a single field of research, namely, Judgment and Decision Making (JDM). We examined Results sections to identify which of those articles report (i) p-values, (ii) standardized effect sizes, and (iii) confidence/credibility intervals; and we examined the articles’ narrative sections (Abstract, Discussion/Conclusion) for explicit reference to: (i) the presence or absence of an effect, (ii) the size of an effect, and (iii) the uncertainty or imprecision associated with a finding.
For our primary research questions, we estimated 6 proportions:
-
1. The proportion of articles with Results sections that contain at least one report of:
-
1a. a p-value for a null hypothesis significance test;
-
1b. a standardized effect size;
-
1c. a confidence or credibility interval.
-
-
2. The proportion of articles with Discussion/Conclusion sections that discuss:
-
2a. the presence or absence of an effect;
-
2b. the size of an effect;
-
2c. the uncertainty or precision associated with a finding (e.g., estimate range).
-
Based on our small-scale pilot work and our informal observations as consumers of research and readers of the literature on research practices in the psychological sciences, we began our investigation with some assumptions about what we would likely find. We expected that almost all empirical research articles would report significance tests, that the clear majority would report effect sizes, and that around half to three-quarters would report confidence/credibility intervals. Within the narrative sections of these articles, we expected to find that almost all discussed the presence/absence of effects, while almost none discussed the precision of estimation as quantified by confidence/credibility intervals. For the proportion of articles with discussion of effect sizes, our expectations were similar to what we expected for reports of standardized effect sizes, whereby we expected most (though far from all) articles to discuss effect size information. Our study preregistration shows these predicted proportions in the form of subjective probability distributions generated by each author via techniques described in O'Hagan et al., (Reference O'Hagan, Buck, Daneshkhah, Eiser, Garthwaite, Jenkinson, Oakley and Rakow2006). Our method for this study was designed to provide principled sampling and objective coding of research articles to address our research questions, while severely limiting the influence of our expectations for what we would find.
1. Method
We analyzed a sample of 150 papers published during 2023 in 6 international research journals in the field of JDM. Data, materials, and code are available (osf.io/apfg8/). We preregistered our study and analysis plan with the Open Science Framework (OSF, osf.io/rwz6e/).
1.1. Sampling strategy
The field of JDM was selected based in part on the research interests of the authors but also our instinct that researchers working in this field, in which uncertainty is a foundational concept, would (or should) be committed to acknowledging and communicating uncertainty when estimating effect sizes and presenting their conclusions. Within this wider field we chose 3 journals we presumedFootnote 1 had a more psychological focus (Decision,Footnote 2 Judgment and Decision Making, and Journal of Behavioral Decision Making) and 3 with a more economic focus (Journal of Economic Psychology, Journal of Risk and Uncertainty, and Journal of Behavioral and Experimental Economics). Journals were selected based on the senior author’s knowledge of the field and 2023 as the most recent full year at the point we began our investigation. An advanced search on Web of Science was used to extract a list of papers published by each journal in 2023 from which we excluded papers that were evidently not empirical articles (e.g., tagged as editorial, correction, review, etc.). From the remaining set of articles, 25 articles were randomly selected for each journal with the total sample size (N = 150) sense-checked by conducting a precision power analysis using IBM SPSS Statistics (Version 29): for proportions between 0.1 and 0.9, the 95% confidence interval has width between 0.10 and 0.16 when N = 150 (see preregistration for details).
1.2. Coding procedure: Overview
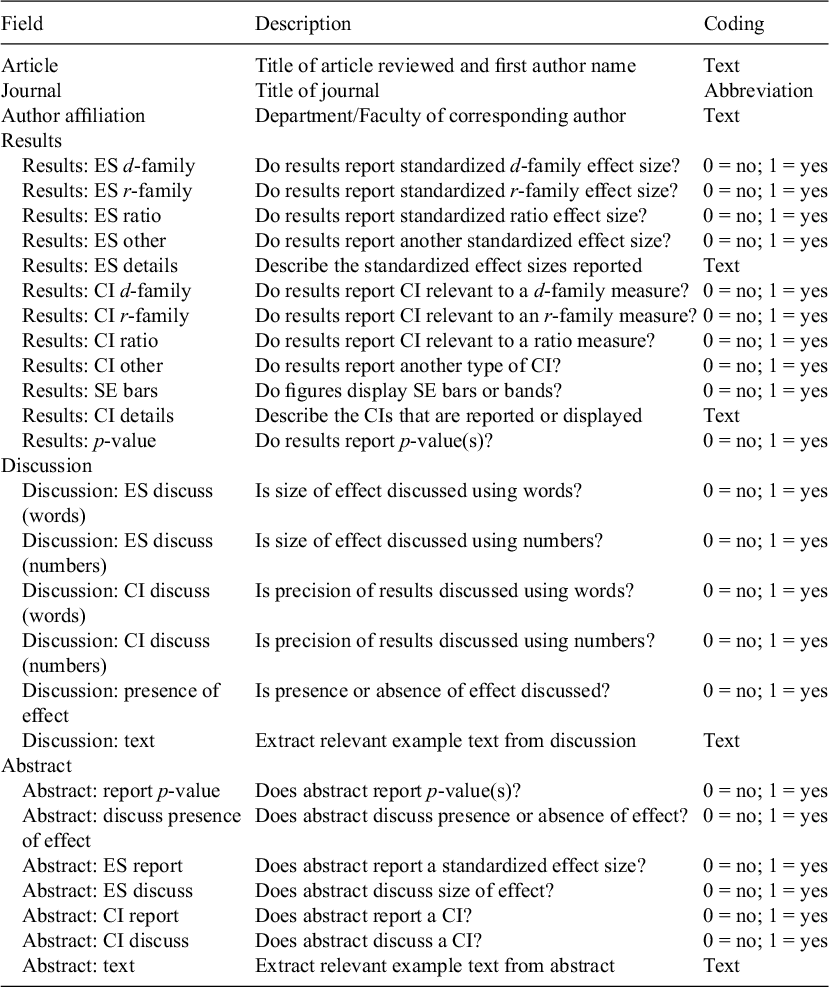
The data collected for each paper and the coding criteria used are summarized in Table 1 and described in more detail in the sections that follow.
Summary of preregistered primary coding system

1.3. Coding methodology: Reporting effect size
We coded for the reporting of standardized measures of effect size in the Results section(s) of each article, assigning ‘0’ or ‘1’ for each of 3 ‘families’ of effect size at the level of the article (Table 2; and described below). By aggregating those sub-codes, we coded whether each article reported any standardized effect size. We allowed for an ‘other’ category of effect sizes but did not identify any during our review.
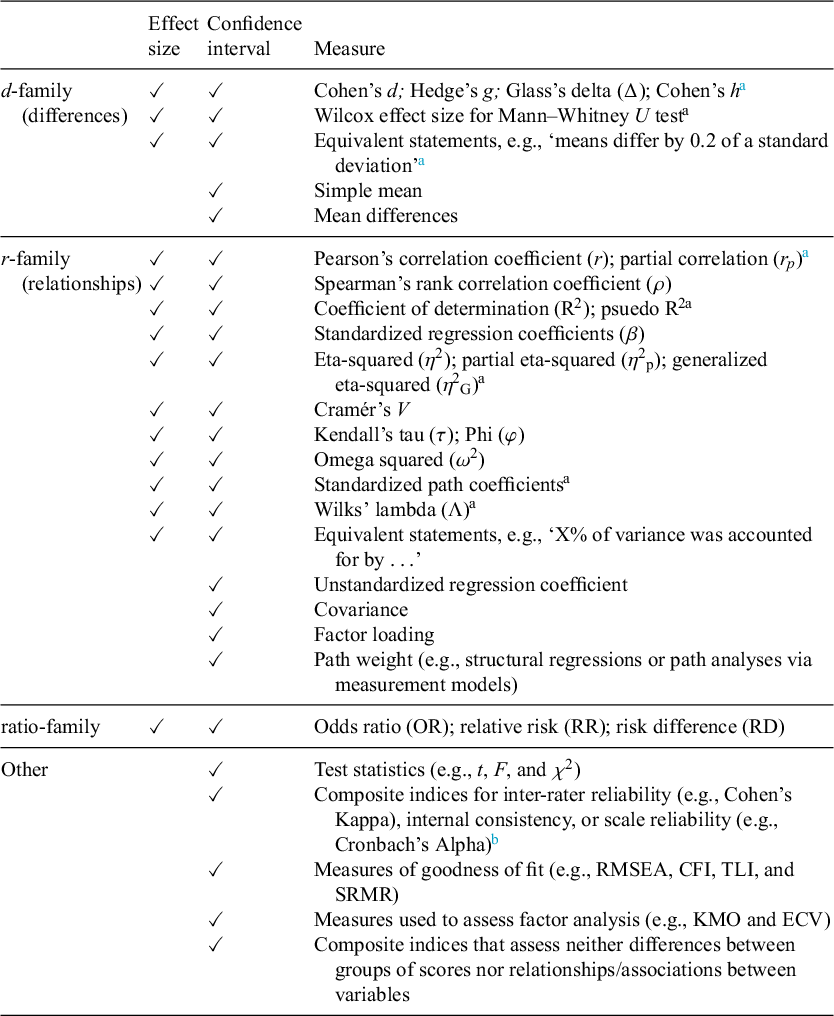
Categorization for reporting of standardized effect sizes (ESs) and confidence intervals (CIs) in Results sections, by family

a Denotes measures added to the list during the course of the analysis as we found them reported in papers.
b Correlation coefficients used for this purpose are categorized under r-family.
Effect sizes are often referred to as being part of the ‘d-family’ or ‘r-family’ (Rosenthal, Reference Rosenthal, Cooper and Hedges1994). The former compare differences between groups or conditions and the latter indicate the degree of correlation or association between variables. Commentators take a somewhat variable approach to ratio measures such as odds ratios (ORs) with some addressing them in the context of d-family measures (Howell, Reference Howell2013), and others describing them as being akin to association type effect sizes. This variability may simply reflect that ORs suit both 2 × 2 contingency tables and regression models (Ialongo, Reference Ialongo2016). For our analysis, we coded ORs and similar ratios in their own third category, consistent with the views of Goulet-Pelletier and Cousineau (Reference Goulet-Pelletier and Cousineau2018) and Rosnow and Rosenthal (Reference Rosnow and Rosenthal2003). We did not identify a definitive source for categorizing effect sizes and acknowledge that others may reasonably categorize some of these measures differently. Table 2 shows the full list of the categories that we used.
Our decision to code a study as having reported an effect size (in the Results) only if a standardized effect size measure was used (and thereby overlook unstandardized measures in the original units of measurement) reflected 2 practical considerations:
-
(i) we felt it would be unduly subjective in terms of coding papers to draw a clear line between original units of measurement reported in a way that conveys meaningful information about an effect size and those which are reported in a way that does not convey meaningful information about an effect size and therefore fail to communicate effect size informationFootnote 3 ;
-
(ii) although unstandardized, original units of measurement are understandable and meaningful in some contexts of psychological research, this is not always the case (e.g., when the reader has little prior knowledge or experience of the context). Psychological variables are often measured on scales that are not as readily familiar or ‘concrete’ as, for example, height or reaction time would be, or on scales which vary between study designs (e.g., 5-point vs. 9-point scales).
We did not include Bayes Factor or unstandardized regression coefficients as (standardized) effect sizes for this code. Where a regression or beta coefficient was reported together with a standard error (SE), we routinely assumed it was unstandardized unless otherwise specified in the article or a contrary interpretation was readily apparent from the context.
1.4. Coding methodology: Discussing effect size or presence/absence of effect
When coding whether a study discussed effect size (for an effect examined in that article) we took a broader approach than that described above for reporting effect size, looking for phraseology relevant to effect size more generally. This approach meant that studies could be coded as discussing effect size despite not having reported a standardized measure of effect size.
The distinction between language indicating a binary assessment of presence or absence of an effect and language discussing the size of an effect is somewhat nuanced, which adds an element of subjectivity to our coding—albeit we checked for inter-rater reliability as described below. Words, such as ‘more’, ‘most’, ‘many’, ‘large’, etc., were the most ambiguous. Ultimately, we drew a distinction based on whether phraseology conveyed more than just the direction of an effect. For example, ‘larger’ conveys information solely about the direction of an effect, while ‘large’ suggests an attempt to communicate information about the extent of an effect. We extended this principle to ordinal comparisons between effects. For instance, we took the view that statements, such as ‘effect A was much bigger than effect B’ or ‘effect C was 3 times the size of effect D’ do not communicate effect size because such statements allow for the possibility that effects A–D are all very small, or are all very large. This is analogous to the observation that relative risk statements give no information about absolute risk, making them problematic for transparent risk communication (e.g., in medicine or healthcare; Gigerenzer and Edwards, Reference Gigerenzer and Edwards2003). The word ‘significant’ was treated as indicating the presence or absence of an effect rather than extent of an effect, that is, we assumed the word ‘significant’ to have been used in relation to NHST unless it was very clear otherwise from the surrounding context/phraseology. Phrases, such as ‘robust result’, were not coded as discussing effect size on the basis we felt the most natural interpretation was that the author intended to communicate the level of reliability/replicability of a result across multiple pieces of analysis rather than the size of an effect.
We felt it was helpful to distinguish between discussions of effect size using words versus those using numbers because each approach may have advantages/disadvantages. Communications based on verbal descriptors (e.g., ‘relatively small’, ‘many’) can create ambiguity because they may be interpreted differently by different readers or in different contexts (Parducci, Reference Parducci1968) Conversely, communications using numbers can be viewed as more precise—but might be difficult to contextualize (e.g., is 60% good/bad, big/small) because the point of comparison, or reference class, may not be clear (Rakow et al., Reference Rakow, Heard and Newell2015; Windschitl and Weber, Reference Windschitl and Weber1999). A single sentence or statement could provide evidence of discussion in words and numbers, for example, ‘the effect was very large (around 40%)’. In these instances, we coded papers as having discussed effect size in both words and numbers. We coded text as discussing effect size in numbers regardless of whether the number was given in numerals (e.g., 0.67, 2/3rds) or words (e.g., two-thirds).
Discussion of the presence of an effect and the size of an effect can both be indicated within a single compound statement, for example, ‘we found a large effect of X’. In these instances, we coded papers as having both discussed the presence or absence of an effect and having discussed the size of the effect.
1.5. Coding methodology: Reporting confidence/credibility intervals
We coded for any instance in an article of reporting confidence intervals or credibility intervals (e.g., highest density intervals) for any quantity, which could be reported as text (e.g., in a table) or shown in figures. To simplify terms in this article, we use the term confidence interval to refer to either type of interval. Our sub-codes for reporting confidence intervals included a sub-code corresponding to each of the 3 ‘families’ of effect size measure—though we included both standardized and unstandardized measures. CIs for simple means, medians, or mean differences were coded as d-family on the basis that they support an examination of difference. We included confidence intervals for factor loadings as r-family on the basis that a factor loading conceptually represents a regression coefficient. Confidence intervals for a proportion were coded as ratio family. The category ‘CI Results other’ was used to code for confidence intervals which could not be coded as belonging to the d-family/differences, r-family/relationships, or ratio-family; for instance, confidence intervals for fit statistics, test statistics, and compound measures of reliability. We did not identify a definitive source for categorizing confidence intervals and acknowledge that others may reasonably categorize some of these measures differently. Table 2 shows our full list of the categories.
1.6. Coding methodology: SE bars (visual reporting of a standard error)
Our pilot review suggested that displaying SE (e.g., SE of the mean) bars on figures might be more common than displaying confidence intervals graphically. As such, we separately coded papers according to whether bars or bands representing the estimated SE of a parameter were shown on figures. We coded SE bars separately from CIs because SE bars do not convey the same degree of information concerning the precision of parameter estimation as that conveyed by a confidence interval.Footnote 4 We did not code SE when solely reported in text or tables because this typically involves the provision of a single number which does not convey information about a range in the same way as an SE bar (because further calculation is required to define an interval’s limits).
If error bars/bands/intervals displayed on figures were not labeled or referenced in a way that enabled us to determine whether they were CIs or some other type of error bar, we coded the paper as having reported an SE bar rather than a confidence interval.
1.7. Coding methodology: Discussing confidence intervals
When coding whether an article discussed confidence intervals, we took a broad approach looking for phraseology that communicates the degree of (un)certainty or precision associated with an estimated value or effect size (e.g., ‘the confidence intervals for X were narrow’). It was not necessary for the specific words ‘confidence’, ‘credible’ or ‘interval’ to have been used (e.g., ‘parameter estimates were precise’ or ‘the plausible range for this effect is X to Y’ would qualify).
1.8. Coding methodology: Reporting p-values
We coded as yes where an exact p-value was given, where ‘p <’ or ‘p >’ indicated a limit (bound) for the p-value or * denoted p < x.
1.9. Coding methodology: General principles
We did not review the supplementary materials of articles including any materials that sat external to the article itself, whether described as supplementary materials, appendices, or otherwise. We did review information included in footnotes or appendices (provided appendices were included with the main article and not in supplementary materials) if the footnote or appendix had been referred to from the section of the article that was relevant to a code (viz. Results, Discussion/Conclusion).
We coded as ‘yes’ where there was reporting of any standardized effect size in the relevant section(s) of an article, we did not require that standardized effect sizes were reported for all results. The same approach was taken for reporting p-values, confidence intervals and discussion of effect sizes/confidence intervals/presence or absence of effects.
For coding discussion: we reviewed sections/subsections of articles titled Discussion or Conclusion as well as combined sections, for instance, those titled Results and Discussion. Where an article included multiple Results or Discussion sections, for example, Discussion sections for each of a number of individual experiments plus a General Discussion, all such sections were reviewed. For example, the interim Discussion sections for 3 studies plus a General Discussion would, together, be treated as ‘the Discussion’ (section) of the article for the purposes of our coding. Where the Author’s choice of sub-headings (e.g., ‘Modeling’ and ‘Findings’) required a judgment call as to which sections to treat as Discussion versus Results this was noted in our comments for that article (see open data). One cue that we used to make these judgments was whether numeric data were summarized in the section, or whether the section consisted only of words (i.e., respectively, ‘Results’ vs. ‘Discussion’). If effect sizes, confidence intervals or p-values were only reported or discussed in sections titled Method, Procedure, or similar, they were not coded as ‘yes’ for the code. Effect sizes or confidence intervals in tables were coded according to where in the text the table was referenced, not according to the page on which the table was located. For example, if a table reporting a confidence interval was referenced in both Methods and Results, it was coded as having reported a confidence interval in the Results section, irrespective of which section of the article the table was located in.
To support additional analysis of how authors use effect sizes and confidence intervals, we also recorded any reference to statistical power in relation to the research being reported in the article (e.g., power calculations). We decided to do this after commencing coding of the 150 articles and therefore this was not preregistered. Subsequent to completing and reporting our investigation, following a Reviewer’s suggestion, we re-examined all 150 articles in our sample to estimate the prevalence of Bayesian data analysis in JDM research. To do so, one author [MB] used ctrl-F to search the full article contents for ‘Baye*’, ‘BIC’, ‘BF’, ‘B0’, and ‘B1’, and from the extracts so identified placed each article into 1 of 4 categories: (1) Bayesian methods used to analyze data (2) the Bayesian information criterion (BIC) was the only Bayesian method mentioned, (3) ‘Other’ reference to Bayes (e.g., discussing Bayesian theory, learning, or updating) which did not entail data analysis, or (4) No reference to ‘Bayes’. The extracts used to assign articles to categories ‘1’ to ‘3’ were checked by the other author [TR] to confirm/revise the coding. This analysis is pertinent to our investigation because Bayesian methods have, over many years, been put forward as a viable (perhaps superior) alternative to NHST (Cohen, Reference Cohen1994; Greenwald, Reference Greenwald1975)—and some JDM researchers have been among the most ardent proponents of using Bayesian methods in psychology (e.g., Edwards et al., Reference Edwards, Lindman and Savage1963).
1.10. Inter-rater reliability
Two procedures were implemented to assess and assure coding reliability. All example text extracts identified by the first coder [MB] in support of coding for discussing effect size or confidence intervals were reviewed by the second coder [TR] and any difficult decisions about coding for ‘family’ of ES or CI were flagged for discussion. First, any discrepancies in judgment were discussed and agreed. To illustrate the outcome of such discussions and the ‘boundaries’ between our category codes, Table S6 in the Supplementary Material sets out examples of coding for discussion of effect size that were either identified as marginal cases for discussion or where initial coding by MB was subsequently changed after discussion between the authors. Second, of the 150 articles that were coded by one author [MB], 30 articles (20%) were also independently blind-coded by the other author [TR]. Inter-rater reliability was assessed as percentage agreement across all of the primary binary codes and using Cohen’s Kappa. The raw data for this assessment are available at osf.io/apfg8/, including Cohen’s Kappa for each binary code. Cohen’s Kappa for the 6 primary measures set out in the introduction ranged between 0.65 and 0.97 (specifically, 0.76, 0.79, and 0.86 for reporting results; and 0.97, 0.67, and 0.65 for discussion). Overall, the mean level of absolute agreement across all 27 binary codes was 0.94.
1.11. Data analysis
Analysis was carried out using Rstudio (Posit team, 2022) and the tidyverse (Wickham et al., Reference Wickham, Averick, Bryan, Chang, McGowan, François, Grolemund, Hayes, Henry, Hester, Kuhn, Pedersen, Miller, Bache, Müller, Ooms, Robinson, Seidel, Spinu and Yutani2019), rio (Chan et al., Reference Chan, Leeper, Becker and Schoch2023), correlations (Makowski et al., Reference Makowski, Wiernik, Patil, Lüdecke and Ben-Shachar2022), and ggcorrplot (Kassambara, Reference Kassambara2023) packages. Code was prepared in advance of data collection to answer the specific questions set out in full in Table S2 in the Supplementary Material. SPSS was used to compute 95% binomial CIs for proportions. Additional exploratory analyses (not prepared in advance) were conducted to assess how effect sizes are referenced in the context of power analyses, and how 8 of our coded elements were associated with each other.
2. Results and discussion
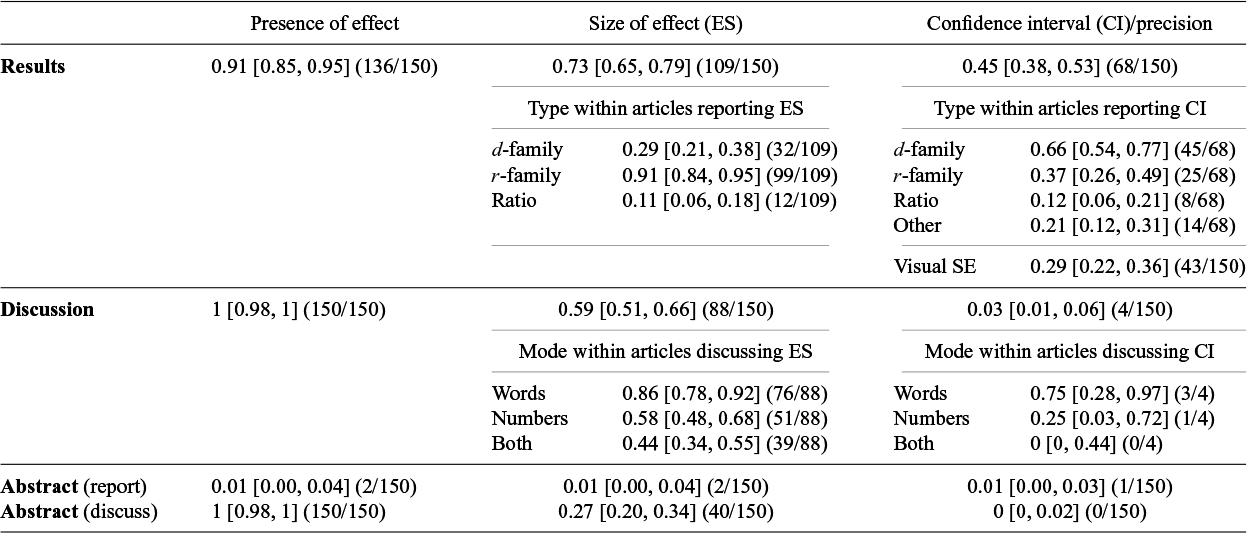
Our primary results appear in Table 3 with results by journal in Tables S3 and S4 in the Supplementary Material. In line with our expectations prior to starting this review, almost all articles reported a p-value and without exception all articles discussed the presence or absence of an effect. Consistent with our expectations, around three-quarters reported at least one standardized effect size; but slightly fewer (three-fifths) referred to effect size information in their discussion, which was a smaller proportion than we had expected would do so. We found that slightly less than half of the articles reported at least one confidence/credibility interval (having expected that half to three-quarters would do so) and found that almost none discussed the precision or range of estimation as quantified by confidence/credibility intervals.
Proportion [95% binomial CI] with the corresponding fraction for each coded element in parentheses

Note: Sub-proportions need not sum to 1 as an individual article may have included more than one type of effect size or confidence interval.
2.1. Reporting practices for quantitative results in JDM
Based on the proportions shown in the upper panel of Table 3, and their relatively narrow confidence intervals, we can draw some reasonably precise conclusions about reporting practices in recent JDM research articles. First, it may surprise readers that nearly 10% of the research articles that we sampled—all of which reported quantitative research—did not report a single p-value. Certainly, this was a surprise to us because we had expected this to be very rare indeed. We scrutinized the contents of these 14 ‘no p-value’ articles to understand how they analyzed and reached conclusions about their quantitative data (summarized in Table S5 in the Supplementary Material). Eleven articles used computational modeling of one kind or another, and several reported confidence/credibility intervals or error bars. Further exploration found that, compared to articles reporting p-values, the no p-value articles were somewhat less likely to report standardized effect sizes and power analyses, or be published in an economic focus journal, and were more likely to use Bayesian methods (Table S7 in the Supplementary Material). There was at least one no p-value article from each of the 6 journals we examined, with 6/14 published in Decision. Thus, clearly, statistical inference using p-values is not a strict pre-requisite for JDM publications. Nonetheless, NHST survives (and perhaps thrives) in JDM research. Yet, for the most part, NHST is employed within a mixed economy alongside other quantitative tools and approaches, as illustrated by the fact that only 17 of the 150 articles we reviewed reported a p-value but no standardized effect size, confidence interval or SE bars (0.11, 95% [0.07, 0.17]). So, while there may be no full-scale rejection of NHST as some have advocated (for some advocates, see Fidler, Reference Fidler2002), our data may offer 2 crumbs of comfort to those who favor approaches to inference that do not rely on null hypothesis testing. First, quantitative research using (exclusively) non-NHST approaches does get published in JDM journals. And second, there is little evidence of sole reliance on reporting p-values without any estimates of effects being reported.
Next, the reporting of effect size information seems to be reasonably common. From our data, we estimate that around 7 in 10 recent JDM research articles report at least one standardized measure of effect. Given that some of the complementary set of 3-in-10 articles report unstandardized effect size information in ways that are meaningful to readers,Footnote 5 we think this means that the field is aligning reasonably well with the APA Task Force recommendation to ‘always present effect sizes for primary outcomes’ (Wilkinson et al., Reference Wilkinson1999, p. 599).
Third, however, the field seems not so well aligned with that same Task Force’s recommendation that ‘interval estimates should be given for any effect sizes involving principal outcomes’ (p. 599) or Cohen’s (Reference Cohen1994) recommendation to ‘routinely report effect sizes in the form of confidence limits’ (p. 1002). Our analysis suggests that only 4 or 5 in every 10 recent JDM research articles report at least one confidence interval. If one extends the ‘interval estimate’ definition to include graphical SE bars, the proportion of papers reporting at least one interval estimate rises a little. In our data, there were 27 of the 150 articles that presented figures with SE bars without reporting any true confidence interval, meaning that 0.63 of the sample (95/150) reported at least one CI or figure with SE bars (95% CI [0.55, 0.71]). However, for these data, it is worth noting that intervals defined by estimate ± SE lack the precision of a confidence interval because the percent confidence associated with the interval is not known to the reader unless the sample is very large. Moreover, error bar presentations are often not displaying an interval for the effect of primary interest (Cumming, Reference Cumming2014) as when means ± 1 SE are shown when mean differences are the phenomenon of interest.
Aggregating the data for ES and CI in Table 3 together, it seems that—to a reasonable degree—reporting practices in JDM research reflect an estimation perspective (Cohen, Reference Cohen1994; Cumming, Reference Cumming2014). Only 20 of the 150 articles we reviewed did not report any standardized effect size, any confidence interval or use SE bars (0.13, 95% CI [0.09, 0.19]).
By themselves, the fine-grained data on which ‘families’ or types of effect size measure or confidence interval are reported hold limited interest (Table 3). For example, the fact that 99 articles reported an r-family effect size while only 32 reported a d-family effect size could simply reflect that correlation and regression techniques are wonderfully flexible and widely used. However, a comparison of the columns for ES and CI in Table 3 reveals a curious quirk. Among articles that report a standardized effect size, substantially more report an r-family effect than report a d-family effect (91% vs. 29%). This between-family difference reverses for confidence interval reporting, wherein CIs for r-family effects are less common than CIs for d-family effects (37% vs. 66%). We can only speculate as to the reasons for these discrepant patterns—a different kind of study to ours would be needed to uncover whether, for example, researchers focus on different kinds of statistical concept for different families of effect; whether different traditions of research design or data analysis have distinct reporting conventions; or whether something as mundane as the defaults within commonly used software packages make it more or less likely that a standardized ES or a CI is generated for particular kinds of analyses.
2.2. The discussion of findings in JDM research
For 60 years or more, researchers have been documenting the reporting practices of research articles in the behavioral sciences (e.g., Sterling, Reference Sterling1959). Therefore, our review represents just one more offering in this tradition, albeit one that, we hope, provides useful information about the reporting of results in a specific field (JDM) at a specific point in time (publication year 2023). What may be somewhat unusual is our systematic analysis of how results are discussed in the narrative sections of research articles—though see Finch et al. (Reference Finch, Cumming, Williams, Palmer, Griffith, Alders, Anderson and Goodman2004) who, like us, examined whether authors discussed confidence intervals and error bars. The most noteworthy findings of our analysis can be seen in the middle panel of Table 3, and in the discrepancies revealed by comparing the upper and middle panels of that table.
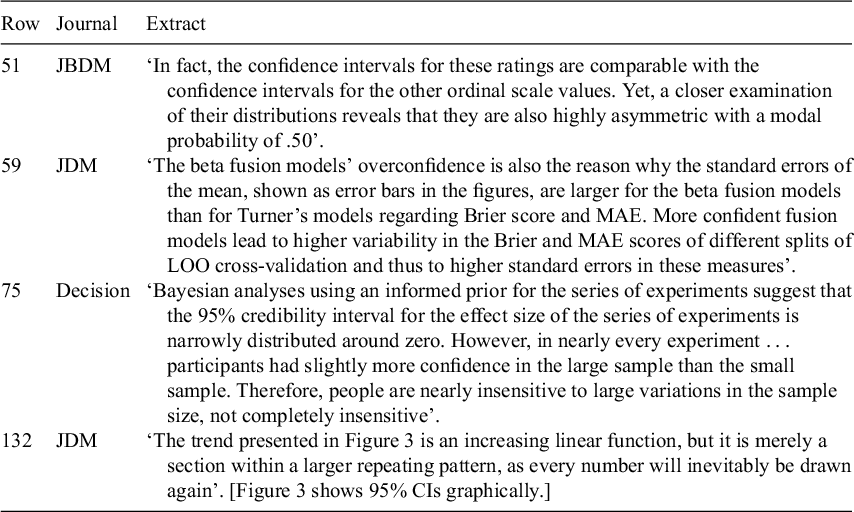
Most striking is the near-complete absence of discussion of the information about the uncertainty or precision of estimation, or estimation range, that is contained within a confidence or credibility interval. Thus, while we identified 68 articles that reported at least one confidence interval, we identified only 4 articles that made explicit reference to some feature of a confidence interval or SE bar in the Discussion/Conclusion section of the article. Because this practice was so rare, it is feasible to present all 4 text extracts so coded in Table 4. Our data for discussing CIs point to the same conclusion given by Finch et al. (Reference Finch, Cumming, Williams, Palmer, Griffith, Alders, Anderson and Goodman2004) who analyzed 696 articles published 1990–2000 in Memory & Cognition (of which 30% reported confidence intervals or error bars on figures):
Our analysis of the textual references to error bars provided little evidence that authors had incorporated information from the bars into the statistical arguments that they made; inclusion of bars and/or CIs appeared to make little difference to the NHST practices routinely used. (Finch et al., Reference Finch, Cumming, Williams, Palmer, Griffith, Alders, Anderson and Goodman2004, p. 323)
Extracts from all 4 articles coded as having discussed confidence intervals in words or numbers

Note: Row number refers to the master spreadsheet of our data available at osf.io/apfg8/.
Of course, because our coding exercise was both a vigilance task (requiring careful reading) and a judgment task (requiring judgments about the meaning of text), it is possible that we missed some instances that should have been ‘yes’ for this code for ‘discussing CI’. However, we sought to mitigate the difficulties associated with coding by preparing a detailed codebook, and, via blind independent coding of 30 articles, we established that our coding was reasonably reliable. Ultimately, of course, the best approach would be for other researchers to conduct close replications and replications-with-extension of our research (Brandt et al., Reference Brandt, IJzerman, Dijksterhuis, Farach, Geller, Giner-Sorolla, Grange, Perugini, Spies and Van't Veer2014; Hüffmeier et al., Reference Hüffmeier, Mazei and Schultze2016; Schmidt, Reference Schmidt2009) to establish the reliability of these and other findings from our study.
Notwithstanding those caveats, why then does it appear that JDM researchers report confidence intervals fairly frequently but almost never refer explicitly to what those intervals represent when discussing findings or presenting conclusions? One possibility is that such discussion is unnecessary because the reader can see the confidence intervals in the Results, from which they can make their own interpretations about uncertainty/precision, effect size, or patterns in the data, and then draw their own conclusions, accordingly. Certainly, one benefit of detailed and transparent reporting is allowing readers to form their own opinions about the data. That said, such an approach seems inconsistent with much of what we (as a field) do choose to discuss in our research articles because we’d be unlikely to leave-it-to-the-reader when it comes to interpreting the correlation coefficients or mean differences that are relevant to our main hypotheses. A second possibility is that confidence interval information may inform the conclusions that we draw—but rarely in ways that translate into explicit verbal expressions about range estimation or the precision of estimation. For instance, I might use the middle portion of an interval to inform what I write about the best estimate of an effect. Or, seeing that the interval includes small effect sizes might prompt me to make only cautious claims about the size of that effect. A third possibility is that journal guidelines and other best-practice prescriptions are clear and detailed on what is expected when reporting results (including expectations to report confidence intervals) but often provide little or no guidance on discussing findings and presenting conclusions. Therefore, over time, perhaps researchers learn what they should be reporting and change their practice to align with guidelines for reporting, while old habits die hard when writing the Discussion—whereby the ‘new statistics’ (Cumming, Reference Cumming2014) that they report are barely discussed. A fourth, related, possibility follows from Cohen’s (Reference Cohen1994) conjecture that confidence intervals were ‘rarely found in the literature’ because ‘they are embarrassingly large!’ (p. 1002). Perhaps, despite 30 years of encouragement to report confidence intervals in an article’s Results section, researchers are reluctant to draw attention to their ‘embarrassingly large’ intervals in the Discussion section. A fifth possibility is that reporting confidence intervals barely impacts how we think about data, if at all (Simonsohn, Reference Simonsohn2014). For example, if one treats confidence intervals as simply another procedure for rejecting a null hypothesis, one might focus only on whether the interval excludes the point null value and ignore all other information contained in the interval. If so, there would be little incentive to discuss range estimates or the precision of estimation because confidence intervals are not being used to provide information beyond that which the significance tests provide. A sixth possibility has been suggested to us, which is that, perhaps, some researchers are not confident (or not knowledgeable) about what information a confidence interval conveys. For example, Zhang et al. (Reference Zhang, Heck, Meyer, Chabris, Goldstein and Hofman2023) reported that it was common to misinterpret measures of estimation precision (e.g., SE bars) as measures of data variability, with up to half of a sample of experienced data scientists making that misinterpretation (depending upon which data visualizations were shown). Therefore, it might make sense that an author would not discuss the uncertainty or precision implied by a confidence/credibility interval if they assumed that the interval pertained to other features of their data.
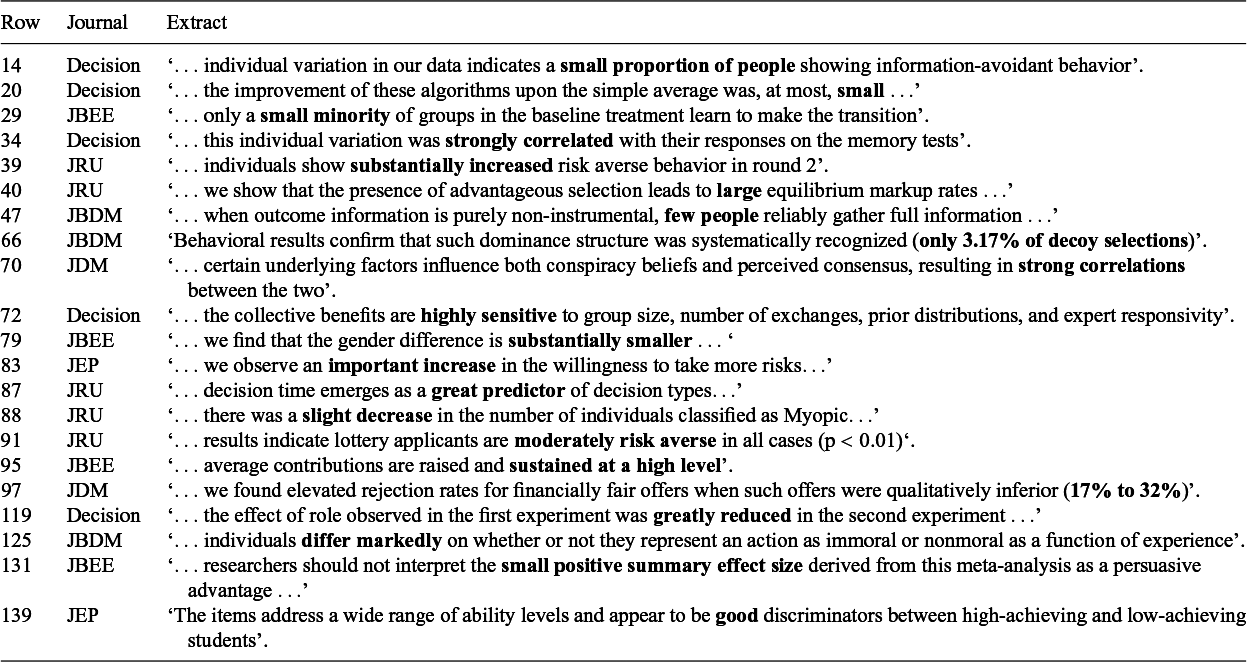
Aspects of these possibilities for why confidence intervals are rarely discussed may also be relevant to the role played by effect size information within Discussion/Conclusion sections. Taking Table 3 at face value suggests reasonable regard for discussing effect size information in the Discussion or Conclusion sections of JDM research articles. In our sample, the proportion of articles that included some discussion of effect size information was slightly lower than the proportion that reported at least one standardized effect size (0.59 vs. 0.73)—a drop-off from Results to Discussion that is much less severe than we observed for confidence intervals. However, these numbers may hide just how minimal the discussion of effect size was in many of those articles. Combining 2 metaphors: we cast our net wide, and set our bar low, for what we would include as ‘discussing effect size’. First, the effects referred to could be ones that had been reported as standardized effects or as unstandardized effects (whereas for reporting results we coded only for standardized effect sizes for the reasons explained in our Method). Second, any statement about the degree, strength, or incidence rate of an effect, which went beyond dichotomous categories or mere directionality, would qualify as ‘discussing effect size’ because more than just the presence/absence of an effect was indicated. In essence, this meant that for ‘discussing effect size in words’ (the most common category of ES discussion, Table 3) it was sufficient that authors used adjectives or adverbs that could be conceptualized as anchor points on a short Likert scale (e.g., small, medium, large; e.g., slightly, moderately, substantially). To gain a fuller appreciation of the (often) limited and/or imprecise discussion of effect size information in JDM research articles, please consult Table 5 after reading the 3 sentences that follow, which describe the table’s contents. To document our decisions for the ‘discussing effect size’ code, we always sought to record 2 or more extracts for each sub-code (discussion in words, discussion in numbers). For 21 of the 88 articles coded as ‘discussing effect size’, we could only identify one such extract per article—all 21 extracts are shown in Table 5. In other words, if the 21 sentences shown in Table 5 had not been in the Results section of their respective articles, we would have identified that 45% of articles (67/150) had discussed effect size, rather than 59% of those 150 articles.Footnote 6
Extracts from articles coded as having discussed effect size in words or numbers based on a single instance

Note: Row number is a reference to the master spreadsheet of our data available at osf.io/apfg8/. Emphasis added via bold-face type. Table S6 in the Supplementary Material provides additional detail on coding of discussing effect size in words or numbers, providing examples of marginal cases ultimately coded as ‘yes’ or as ‘no’.
When the data in Table 3 are seen in this light, it would appear that the Discussion sections of JDM research articles provide much more information about the presence of effects than they provide about the size of those effects. This may say more about our theorizing than our writing habits because—like much of behavioral science—our theories are often clear about the predicted direction of effects but unclear about what size of effect to expect (Meehl, Reference Meehl1967, Reference Meehl1978). Arguably, however, this is an indictment of some of the theorizing in the behavioral sciences (and a prompt to build theories which make precise predictions, for instance, through computational modeling, Guest and Martin, Reference Guest and Martin2021) not a defense for paying little heed to effect size information (Dienes, Reference Dienes2019). For example, JDM researchers interested in whether, why, and how nudges or boosts work—for which questions knowing about the presence or direction of effects might be sufficient for some scientific progress—are usually also interested in how much difference those interventions make—a determination that requires effect size information. Additionally, if effect sizes and their precision of estimation are not discussed in an article, or discussed only in general terms, this suggests that comparisons with previous research are not very detailed or precise. In the context of science as a cumulative endeavor, this may fall short of what we should be aiming for.
2.3. Abstracts are to articles as impressionism is to the art world
The scientific abstract provides the headline information about why research was done, what methods were used, what was found, and what it might mean. It’s an opportunity for authors to tell readers what’s most important about the research article. As such, the lower panel of Table 3 paints an interesting picture. Put simply, it seems that detail matters little when it comes to how results or conclusions are included in an Abstract. In the 150 papers we reviewed, the Abstract always included a statement about the presence of an effect, sometimes contained discussion of effect size (at less than half the rate for Discussion sections), but very rarely contained information about any other features that our review considered.
2.4. Exploratory analysis of reports of statistical power
Additional to our primary coding and analyses discussed above, we recorded any text extract that referred to the statistical power associated with the research reported in the article. We found that 46 of the 150 articles (0.31, 95% CI [0.24, 0.38]), reported carrying out a power analysis (none of which used a specified width of CI to report a precision power analysis). Of the articles reporting a power analysis, 0.87 (40/46, 95% CI [0.75, 0.94]) referred to an effect size in the broadest sense (e.g., ‘sufficient to detect a small effect’) and 0.72 (33/46, 95% CI [0.58, 0.83]) mentioned a specific standardized effect size (e.g., Cohen’s d of 0.5). It was interesting to us that 5 of those 33 papers (0.15, 95% CI [0.06, 0.30]), referred to a standardized effect size in the context of a power analysis but did not include a standardized effect size in their Results. Potentially, this seems at odds with the reasons why one would perform a power analysis for a specified effect size. If one had a minimum effect of interest in mind, wouldn’t one wish to compare the effect that was found against that minimum size, using the same standardized measure that had defined it? Likewise, if using an effect size from previous research for a power calculation, one might expect the ‘new’ effect to be reported in a way that allowed comparison with the prior effect (i.e., using the relevant standardized ES).
2.5. Exploratory analysis of the penetration of Bayesian methods in JDM research
Via additional coding (not preregistered) we classified 22/150 articles (0.15, 95% CI [0.10, 0.21]) as using Bayesian methods to analyze data. The methods included Bayes factors, Bayesian estimation, Bayesian regression and mixed-effects models, and various forms of Bayesian modeling and model comparison. Among the remaining 127 articles, 8 (5%) had BIC as their only Bayesian method, 8 (5%) used ‘Bayes’ only in a context unrelated the analysis of the current data, and 112 (75%) made no mention of ‘Bayes’.
2.6. Exploratory analyses of the associations between coded elements
Additionally, we examined the associations between 8 of our binary codes, primarily to explore what features of an article and its reported results predicted the discussion of effect sizes in the Discussion/Conclusions (see Table S7 and Figure S1a in the Supplementary Material). We did not attempt the equivalent analysis for discussing the presence of effects or discussing CIs because the former always occurred and the latter rarely occurred, meaning that there was little or no variance in these behaviors that could be associated with other factors. We found that discussing effect size was slightly more common in articles that (1) reported no p-value, (2) included Bayesian methods, and/or (3) were published in the 3 psychology-focus journals (vs. economic-focus journals). However, each of those association was weak and not statistically significant, with |r| $\approx$
0.2 (Figure S1b in the Supplementary Material). Perhaps also noteworthy, neither reporting ES or reporting CIs significantly predicted the discussion of effect sizes, each with |r| < 0.1, and neither of the positive limits of the CIs for these correlations extended to r = 0.3. Thus, any association between reporting ES and discussing ES is likely weak. Also interesting to us was that reporting a power analysis was moderately associated with reporting (1) CIs or SE bars, (2) at least one p-value, and (3) standardized effect sizes in the Results (Figure S1c in the Supplementary Material). These associations were medium-sized, with r
$\approx$
0.2 (Figure S1b in the Supplementary Material). Perhaps also noteworthy, neither reporting ES or reporting CIs significantly predicted the discussion of effect sizes, each with |r| < 0.1, and neither of the positive limits of the CIs for these correlations extended to r = 0.3. Thus, any association between reporting ES and discussing ES is likely weak. Also interesting to us was that reporting a power analysis was moderately associated with reporting (1) CIs or SE bars, (2) at least one p-value, and (3) standardized effect sizes in the Results (Figure S1c in the Supplementary Material). These associations were medium-sized, with r $\approx$
0.3, and make sense in terms of how power analyses are often specified (e.g., computations within an NHST framework, predicated on a specific effect size). Also, power analyses were more frequently reported in the psychology-focus journals than the economic-focus journals.
$\approx$
0.3, and make sense in terms of how power analyses are often specified (e.g., computations within an NHST framework, predicated on a specific effect size). Also, power analyses were more frequently reported in the psychology-focus journals than the economic-focus journals.
2.7. Limitations, constraints on generality, and future directions
As discussed above, a coding exercise like the one we reported here relies on vigilance and judgment. We did our best to produce a coding scheme and protocol that promoted valid and reliable coding. Nonetheless, human fallibility dictates that some category boundaries between codes remained fuzzy and that some noise remained in the application of our coding scheme. This, together with the fact that our sample size was limited to 150 articles by our available time and resources, means that we cannot treat the proportions we report as sufficiently precise estimates to make fine-grained determinations on the basis of small differences between proportions. Therefore, we have sought only to draw conclusions that fall within the limits defined by our reliability of measurement and precision of estimation.
Hindsight revealed one limitation arising from our decision to code based on the location of information in a research article (viz. Results vs. Discussion/Conclusion vs. Abstract). First, the section headings Results and Discussion are not used in all articles; therefore, sometimes we had to decide which sections to treat as ‘Results’ and which as ‘Discussion’. These cases were mainly in the journals with an economics research orientation. Second, inevitably, and quite reasonably, academic writing varies such that some Results sections are more narrative than others. One consequence of this is that there will be instances where discussion of effect sizes took place in Results sections, which—due to its location—would not have contributed to the code ‘discussion of effect size in words’. The same could be true for textual references to confidence intervals. We maintain that it was, nonetheless, valuable to code for discussing effect sizes or confidence intervals in Discussion sections because that is, presumably, where readers expect to find the Author’s arguments about those data as pertaining to what can be concluded from the data.
There are good arguments why, often, reporting unstandardized effects in the original units of measurement is preferable to reporting standardized effect size measures (Baguley, Reference Baguley2009). Although we do not reject those arguments, we considered only standardized effect size measures for our coding of Results sections. This was because we reviewed articles covering diverse topics and using diverse methods of analysis, and did not feel we could reliably judge which (unstandardized) data summaries could be regarded as ‘suitable’ measures of effect for all articles. Therefore, our review provides a restricted snapshot of the information about effect sizes that authors present. For a more inclusive coding of effect size information that might be desirable, we think it would require a more restrictive sampling plan for what articles are considered. For example, by considering only articles that might be eligible for a meta-analysis of a specific effect, it might be easier to identify what counts as legitimate effect size information (standardized or unstandardized) for that effect (e.g., by consensus of the researchers who study that effect).
We coded for reporting and discussion at the level of the article, not at the level of each individual effect. For example, an article reporting one p-value, standardized ES, or CI, received the same code for the relevant feature as an article reporting 100 instances of that statistic. This means that we did not distinguish between an article’s primary or principal effects and its secondary or incidental effects—and to have done so for every article would, we believe, have been impossible. Nonetheless, this feature of our coding should be considered when interpreting our findings. For example, we recorded that 45% articles reported at least one confidence interval. But this cannot be interpreted as 45% compliance with guidance that ‘interval estimates should be given for any effect sizes involving principal outcomes’ (Wilkinson et al., Reference Wilkinson1999, p. 599) because it may be that CIs were only reported for effects that were secondary to the study hypotheses.
In defining our coding scheme, we were informed by longstanding recommendations to use confidence intervals and effect sizes in statistical arguments (e.g., Cohen, Reference Cohen1994; Greenwald, Reference Greenwald1975) and the guidelines that subsequently recommended reporting confidence intervals and effect sizes (e.g., APA Publication Manual, 2020; Wilkinson et al., Reference Wilkinson1999). Those guidelines imply that confidence intervals might be used alongside null hypothesis tests (Fidler, Reference Fidler2002). There are, of course, alternatives to NHST which we did not specifically include in our preregistered coding plan—most notably Bayesian methods. So, while we included Bayesian credibility intervals when coding for interval estimates, and we assumed that Bayesians would care about reporting and discussing effect sizes,Footnote 7 we did not code for reporting Bayes Factors or whether the information they contain is explicitly discussed in the research article. A future extension of our study might do that and/or consider whether the use of computational modeling is associated with particular patterns of reporting results and discussing findings.
Finally, we should consider whether our findings generalize from JDM research to other sub-fields of the psychological and behavioral sciences. Quantitative approaches to research are the norm in JDM, the statistical techniques employed by JDM researchers are diverse, and statistical reasoning is a core JDM topic. Therefore, we think it unlikely that JDM researchers are less focused on reporting detailed statistical information and using it to make arguments than the average behavioral scientist. For this reason, we do not think it likely that many other sub-fields have higher levels of reporting and discussing of effect sizes and confidence intervals than we have observed. Of course, it is for further research to determine whether that is the case.
3. Conclusions
Our review of 150 recent JDM articles suggests a disconnect between how JDM researchers report quantitative results and how they present conclusions based on those data. In the articles we sampled, it was common to report effect size information and reasonably common to report on the precision or uncertainty of estimated effects via confidence or credibility intervals or SE bars. Thus, as has been advocated for, over many years, there is much in the reporting of data that goes beyond examining statistical significance—reflecting a focus on estimating effects rather than merely detecting effects. However, while this estimation perspective is often apparent in Results sections, the corresponding estimation mindset is not so frequently apparent in the narrative sections of research articles (i.e., the Discussion, Conclusion, or Abstract). Often, the arguments from data and discussion of findings seem to be operating with a much lower level of information than the results provide. When effect sizes are discussed, this often goes only a little beyond the information provided by null hypothesis significance tests. And much of the information contained in the confidence intervals that are (fairly often) reported is not explicitly incorporated into the statistical arguments which are made in the Discussion section. These tendencies toward low information conclusions in the Discussion section are even more pronounced in the Abstract of JDM research articles.
Now, quite possibly, all is well, and this is how it should be (e.g., because readability must sometimes take precedence over detail or precision). However, we think our study raises some questions for each of us to consider. Am I extracting all the information that I should from the statistics that I report and discussing my hypotheses accordingly? If I adopt new practices in data analysis and follow good practice in reporting data, are there new modes of statistical thinking that I should adopt and different writing practices that I should follow?
Supplementary material
The supplementary material for this article can be found at http://doi.org/10.1017/jdm.2026.10037.
Data availability statement
Data and code are available at osf.io/apfg8/.
Acknowledgements
We thank the members of the Basic Psychological Science Research Group and the Research Monday seminar series at King’s College London for comments on this work.
Author contributions
Both authors contributed equally to this work; the order of authorship is arbitrary.
Funding statement
This research received no specific grant funding from any funding agency, commercial, or not-for-profit sectors.
Competing interest
The authors declare none.


 Open access