

1. Introduction
During the last decade, many Greenland outlet glaciers have exhibited dramatic calving retreats coincident with increasing flow speed and rates of thinning not explained by surface melt alone (Reference Rignot and KanagaratnamRignot and Kanagaratnam, 2006; Reference Moon and JoughinMoon and Joughin, 2008;Reference Thomas, Frederick, Krabill, Manizade and MartinThomas and others, 2009). Ice discharge into the ocean from Greenland outlet glaciers constitutes a large fraction of mass wastage for the ice sheet (Reference Rignot and KanagaratnamRignot and Kanagaratnam, 2006; Reference Van den BroekeVan den Broeke and others, 2009). Therefore, an understanding of processes controlling outlet glacier dynamics is essential for estimating future contributions to sea-level rise from the Greenland ice sheet. While the triggering of recent changes in Greenland is most likely attributable to climate change, the relative importance of various components (atmospheric and oceanographic changes) of climate forcing remains unclear. Greater surface melt due to higher air temperatures is resulting in increasing contributions to sea- level rise (Reference BoxBox, 2005; Reference HannaHanna and others, 2008). Recent studies and oceanographic data suggest that warming oceans are also having an impact on eustatic sea-level rise contributions through increased calving and thinning of Greenland outlet glaciers (Reference Holland, Thomas, de Young, Ribergaard and LyberthHolland and others, 2008; Reference Motyka, Truffer, Fahnestock, Mortensen, Rysgaard and HowatMotyka and others, 2011). Interactions between warm ocean water and marine-terminating outlet glaciers and the effects of glacier dynamics have the potential to dominate contributions to sea-level rise from the ice sheet.
During the late 20th century the terminus position of Jakobshavn Isbrӕ, on the west coast of Greenland, was stable, relative to current behavior, with a seasonal fluctuation in terminus position of ~2.5 km and a persistent floating tongue (Reference Sohn, Jezek and VeenSohn and others, 1998). Surface speeds, measured by Reference Echelmeyer and HarrisonEchelmeyer and Harrison (1990) in the mid- 1980s, indicated almost no seasonal variation in flow. In the early 2000s the floating ice tongue began a pattern of breakup and the glacier retreated by >12 km from a fairly stable position (Reference Podlech and WeidickPodlech and Weidick, 2004). Concurrent with the retreat, measurements of ice motion began to show seasonal velocity variations (Reference Luckman and MurrayLuckman and Murray, 2005) and flow speeds doubled (Reference Joughin, Abdalati and FahnestockJoughin and others, 2004). This resulted in a drawdown of upstream ice and thinning of the glacier by tens of meters per year (Reference KrabillKrabill and others, 2004). During the retreat the year-round floating tongue disintegrated and only re-formed each winter upon the cessation of calving (Reference JoughinJoughin and others, 2008a; Reference Amundson, Fahnestock, Truffer, Brown, Lüthi and MotykaAmundson and others, 2010). The seasonal floating tongue has played an important role in reducing flow during the winter and slowing the rate of retreat (Reference JoughinJoughin and others, 2008a). As the retreat progresses, surface speeds continue to increase and the terminus is moving into a much deeper part of the fjord with a reverse bed slope (Reference Plummer, Gogineni, Van der Veen, Leuschen and LiPlummer and others, 2008). This configuration causes an unstable front position (Reference Vieli, Funk and BlatterVieli and others, 2001; Reference SchoofSchoof, 2007) and has been observed to result in dramatic retreat rates in other glacier systems (Reference Meier and PostMeier and Post, 1987). The drainage basin of Jakobshavn Isbrӕ encompasses ˜5%, or 9.2 ˟ 104km2, of the areal extent of the Greenland ice sheet (Reference Rignot and KanagaratnamRignot and Kanagaratnam, 2006), and continued retreat and thinning have the potential to affect the discharge of a large portion of the ice sheet.
During its retreat, surface speeds on Jakobshavn Isbrӕ have been documented with remote-sensing techniques (Reference Joughin, Abdalati and FahnestockJoughin and others, 2004, 2008a;Reference Luckman and MurrayLuckman and Murray, 2005). While these techniques are able to map seasonal and interannual changes in velocity, the timing and rates of these variations are obscured by low temporal resolution. Our study complements the remote-sensing record with measurements from GPS receivers, allowing resolution of ice motion on cub diurnal timescales.
By observing ice motion on short timescales we can better constrain the nature and timing of the reaction of Greenland’s outlet glaciers to surface meltwater input. Variability of surface melt supply has been suggested as one mechanism for forcing ice-sheet acceleration (Reference Zwally, Abdalati, Herring, Larson, Saba and SteffenZwally and others, 2002; Reference Parizek and AlleyParizek and Alley, 2004). On the other hand, sufficiently large melt rates can lead to more efficient drainage of basal water (Reference SchoofSchoof, 2010). In this case, the impact of increased melt can have the opposite effect and ice motion can experience deceleration. This paper focuses on the details of velocity variations on short timescales on Jakobshavn Isbrӕ at locations along a center line ˜20- 50 km from the terminus. Combined with estimates of surface melt and timing of supraglacial lake drainages, we present results demonstrating the complex response of ice motion to meltwater input as well as the seasonal and interannual response of flow to changes in glacier geometry.
2. Methods
2.1. Ice motion
GPS observations were conducted on Jakobshavn Isbrӕ at three continuously occupied sites and one temporary site, along an approximate glacier center line (Fig. 1). Measurements were taken from May 2006 to September 2008 at the three continuously occupied sites: C1, C2 and C3. The lowermost site, C1, was placed ˜20km upstream of the 2006 terminus followed by sites C2 at 30km and C3 at 40 km. During summer 2007, an additional GPS site, C0, was temporarily occupied ˜4km downstream of C1. GPS measurements were also recorded from June to August 2007 at four sites along a transect perpendicular to the direction of glacier flow, situated between C2 and C3. Sites P1 and P2 were located to the north of the glacier, P3 and P4 to the south. Additional data were recorded between May and August 2008 at five sites situated along flowlines north and south of the glacier (Fig. 1; Table 1). Sites N1, N2 and N3 were located along the north margin, with sites S2 and S3 along the southern margin. We used dual-frequency GPS receivers (either Trimble 5700, Trimble NetRS or Topcon GB-1000) at all sites. GPS antennas were mounted atop a triangular arrangement of 1 in (2.54cm) steel poles drilled vertically into the ice. On-ice GPS data were processed against a base station located on bedrock with baseline distances of 20–40km. We determined the coordinates of the base station using the Auto-GIPSY static GPS processing service (now APPS; http://apps.gdgps.net). Position solutions for the on-ice sites were produced every 15 s using the differential kinematic processing tool Track (version 1.22), a component of the Massachusetts Institute of Technology GAMIT/GLOBK GPS processing software suite (http://www.gdgps mit.edu/simon/gtgk/index.htm).
Map of Jakobshavn Isbrӕ study area with glacier sites C0, C1, C2, C3; ice-sheet sites N1, N2, N3, S2, S3, P1, P2, P3, P4; and GPS base station. Color-coded surface speeds derived from SAR (RADARSAT) in 2006 are overlaid on a 2004 ASTER (Advanced Spaceborne Thermal Emission and Reflection Radiometer) scene. Solid black curve indicates 2004 terminus position.

Data coverage for glacier (C1–3 and C0) and ice-sheet sites (P1–4, N1–3 and S2–3) given in day of year. Numbers in parentheses indicate the final day of hour-long daily acquisitions during winter where applicable.

Position time-series data were manually inspected to identify obvious processing errors. These errors were most commonly a stepwise change in position followed by a stepwise return lasting a few hundred to thousand epochs (one epoch is 15 s). Such errors appear as very rapid accelerations immediately followed by deceleration in velocity time series. Once identified, the erroneous data segments were removed before further processing. There were also periods of missing data due to insufficient power for the GPS receivers.
GPS position time series for all sites were smoothed using a smoothing spine interpolation method implemented in the MATLAB (version 7.7) software package. This method resulted in a level of smoothing comparable to a 12 hour local linear regression scheme. Smoothing was applied to horizontal and vertical data separately. Horizontal ice surface velocities were derived from the smoothed position time-series data. Each spring we retrieved and reinstalled the glacier GPS receivers (C1, C2 and C3) as close as possible to the starting position of the previous year, with the goal of having the GPS units track the same Eulerian coordinates from year to year. This allowed for the secular evolution of surface flow to be observed. Due to the rough, broken surface of the lower glacier, we were unable to reposition the GPS receivers in exactly the same starting location from one year to the next. Due to the high strain rates and the difference in starting position in subsequent years, it was necessary to correct the velocity time series for differences in starting position.
We used strain rates derived from 2007 synthetic aperture radar (SAR) surface velocity data (Reference JoughinJoughin and others, 2008a) to apply a constant velocity correction, δuξ;, to each year of glacier velocity data. The correction is a function of the local longitudinal strain rate, ![]() and the difference in starting positions, along a local flowline coordinate ξ. We define e as the initial position in the first year and ξ2 as the initial position in subsequent years. We applied infinitesimal strain theory, as the velocity corrections are small compared with overall ice motion. Accounting for this velocity difference allows for accurate comparisons of the surface speed in one location from one year to the next
and the difference in starting positions, along a local flowline coordinate ξ. We define e as the initial position in the first year and ξ2 as the initial position in subsequent years. We applied infinitesimal strain theory, as the velocity corrections are small compared with overall ice motion. Accounting for this velocity difference allows for accurate comparisons of the surface speed in one location from one year to the next
In order to identify seasonal trends in surface speeds, daily-average position data for glacier sites were detrended to remove the components of motion associated with the large surface speeds and longitudinal strain rates at Jakobshavn Isbræ. Initial velocities, u 0, at time, t 0, from GPS were used to calculate the expected motion influenced by a constant relative acceleration, α, defined as
and a time-dependent longitudinal strain rate ![]() which deviates from an initial strain rate,
which deviates from an initial strain rate, ![]() due to constant relative acceleration
due to constant relative acceleration
If relative acceleration is small such that α(t – t0)≪1 then the expected position, ![]() can be approximated by
can be approximated by
where γ is a combined acceleration term due to a constant relative acceleration and a nearly constant strain rate:
A more thorough treatment of the derivation of Eqn (4) can be found in the Appendix. Initial velocities are calculated by finding the best-fitting rate of change over the first 20 days of measured position data. During each of these 20 day periods, there was no evidence of speed-ups or any other rapid variability. A nonlinear least-squares routine is used to determine the combined acceleration term, γ, for each time series. The expected motion can then be subtracted from the measured motion, ξmeas, leaving residual positions, ξres:
This analysis is similar to the technique employed by Reference Amundson, Truffer, Lüthi, Fahnestock, West and MotykaAmundson and others (2008) for removing the effects of large strain rates from short time series (not subject to significant interannual acceleration) of GPS data near the terminus of Jakobshavn Isbræ. When applied to year-long time series, this method efficiently removes long-term trends due to interannual acceleration and longitudinal strain rates. However, the assumption that the relative acceleration term is constant and small does not allow for any distinction between the effects of interannual acceleration and longitudinal strain rates.
To examine glacier velocity variations on shorter timescales, continuous velocity time series were derived from the smoothed GPS position data. These continuous velocities were used to determine the amount of diurnal variability through the melt season. The amplitude of diurnal variations was analyzed using a Gabor transformation,

a moving Fourier transform with a Gaussian window (Reference GaborGabor, 1946). Continuous velocity data were detrended and then multiplied by a Gaussian function with maximum amplitude of 1 and sigma of 2 days. The windowed velocities were then transformed with the Fourier transform to determine spectral coefficients of the diurnal frequency. We define diurnal strength as the square of the norm of G for f =1d-1 and it represents the variability due to diurnal frequencies of velocity data centered within the Gaussian window. This calculation was performed every 6 hours, resulting in a time series of the diurnal strength of velocity variations. To classify diurnal strength, a threshold of 2 ˟ 105m2 d-2 was used to determine the presence or absence of significant diurnal variations in speeds.
2.2. Terminus position
We used Landsat images to document the continued retreat of Jakobshavn Isbræ. Mean terminus positions were determined using available cloud-free panchromatic Landsat 7 scenes. For each image, the glacier terminus was digitized and a mean front position was calculated across a 3km swath perpendicular to the glacier center line (Reference CassottoCassotto, 2011). Data coverage is lacking during winter months due to lack of solar illumination, making it difficult to determine the exact maximum extent of the glacier each year; however, the minimum position of the terminus is generally well defined.
The timing of large calving events, in the manner of capsizing, full-glacier-thickness icebergs described by Reference Amundson, Truffer, Lüthi, Fahnestock, West and MotykaAmundson and others (2008), was determined with a catalog of calving events on Jakobshavn Isbræ compiled by Reference Amundson, Clinton, Fahnestock, Truffer, Lüthi and MotykaAmundson and others (2012) using broadband seismic, time-lapse photographic and remote-sensing (Moderate Resolution Imaging Spectroradiometer (MODIS)) data.
2.3. Surface melt
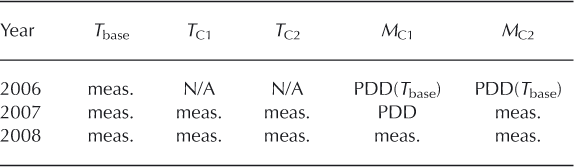
Air temperatures at C1 and C2 were recorded every 15 min. In order to estimate surface melt, ablation was measured at the same sites during the 2007 and 2008 melt seasons. Surface ablation data were recorded every hour using the pressure sensor method described by Bøggild and others (2004). Data gaps in our temperature and ablation records prevented consistent, year-to-year measurements of melt (Table 2). In order to produce continuous melt estimates for both sites each year, we used available temperature records combined with ablation measurements from C1 and C2 to construct a temperature-index melt model. For 2006, we use daily-average temperature data from the GPS base station (Fig. 2) to infer temperatures at C1 and C2. Temperature lapse rates were calculated between the base station (150ma.s.l.) and C1 (700ma.s.l.) and C2 (970ma.s.l.) using data from 2007 and 2008. The lapse rates were applied to the base station temperature data and these corrected temperatures were used as input to the temperature-index model for C1 and C2 during 2006. To estimate 2007 melt at C1, we used in situ temperatures as input to the temperature-index model.
Data source for melt at sites C1 and C2 for years 2006–08. Tbases TC1 andTC2 are surface temperature at the base station, C1 and C2 respectively. MC1 and MC2 refer to surface melt(measured or modeled) at C1 and C2. PDD(Tbaces) means that the melt was delived with the temoerature-index model using lapse-rate corrected surface temperature from the base station. PDD indicates melt was modeled using in situ surface temperatures
Temperature–temperature regression plots with lapse rates between base station and on-ice sites C1 (a) and C2 (b).

We calculated degree-day factors (DDFs) using daily- average temperature and melt data for C1 and C2 in 2008. This calculation follows Eqn (8), taking the ratio of measured melt, M, over the sum of positive degree-days, T+, at intervals, At, of 1 day.

These DDFs were then applied to estimated (2006;C1 and C2) and measured (2007;C1) temperatures to provide estimates of surface melt where direct measurements were unavailable. Direct measurements of surface ablation were recorded in 2008 at site C1 and also during 2007 and 2008 at site C2.
2.4. Supraglacial lakes
We used Landsat 7 panchromatic scenes to manually identify time intervals when supraglacial lakes drained each melt season. The timing of drainage for individual lakes, or groups of lakes, was subsequently refined using MODIS 250m granules. When lakes were identified as full in one MODIS frame and empty in the next we assumed a drainage event had occurred during the time period between obser-vations. The areal extents of full lakes that would later drain were digitized. For this study we only considered lake drainage events within ˜30km of the nearest GPS station. We identified lake drainage events during each of the melt seasons 2006, 2007 and 2008.
This method only constrains the timing of lake drainage, but does not indicate whether the water is routed along the surface, englacially or subglacially. This has implications, because only subglacial events have the potential to affect ice motion.
3. Results
3.1. Ice motion
GPS records were successfully processed during 2006–08 for sites C1, C2 and C3; during 2007 for site C0; during summer 2007 for sites P1, P2, P3 and P4; and during summer 2008 for sites N1, N2, N3, S2 and S3. We estimate an uncertainty of 6 mm in horizontal position and 2 cm in vertical position at the beginning of each season by examining position noise during periods of otherwise steady motion. However, these values are likely higher at later dates when a greater length of the antenna pole is exposed above the ice surface, resulting in larger errors due to motion of the antenna not associated with ice motion. To illustrate the evolution of surface speeds throughout the melt season, daily-average positions were used in calculating velocities. Daily-average velocities were then corrected for different starting positions using Eqn (1) and strain rates (3 ˟ 10-4d-1 at C1;1 ˟ 10-4 d-1 at C2;and 7 ˟ 10-5d-1 at C3) derived from RADARSAT SAR data acquired during summer 2007. Due to the robust statistics of daily-average positions, the uncertainty in daily-average position is small. Estimates of uncertainty for continuous velocity time series can be characterized based on timescales: velocity uncertainties over 24 hours, 1 hour and 15 min are 0.1, 10 and 70 mm d-1, respectively. Velocity uncertainties are estimated by calculating the standard error of the mean for positions averaged over the above intervals and propagating this error through the time derivative of average positions.
Daily-average velocity time series for the glacier sites are shown in Figure 3 for melt seasons 2006–08. Continuous velocity time series for ice-sheet sites during 2007 are shown in Figure 4a and velocities at ice-sheet sites during 2008 are shown in Figure 4b. Portions of the vertical data from glacier and ice-sheet margin sites during 2006 and 2007 are presented later in Figure 8. Vertical position has not been corrected for variations in downslope motion as horizontal speeds are exceptionally steady, varying <10%, and surface slopes are small (<2°), making such corrections negligible. As such, values of vertical position were simply detrended with respect to time, and arbitrary additive constants were applied to improve clarity. Hereafter, we use the term uplift to refer to positive changes in the detrended vertical position. Dates of occupation for all GPS sites are presented in Table 1.
Surface velocities from continuous GPS records at glacier sites C1 (a), C2 (b) and C3 (c) from 2006 to 2008. Vertical dashed lines indicate the timing of short-duration speed-up events described in Section 3, following the same color coding as velocity curves.

(a) Surface speed from 2007 GPS records at ice-sheet sites P1 and P2 (north), P3 and P4 (south). (b) Surface speed from 2008 GPS records at ice-sheet sites N1, N2 and N3 (north), S2 and S3 (south). Vertical dashed lines indicate the timing of short-duration speed-up events described in Section 3.

During each melt season, at the glacier sites, we see a steady spring acceleration followed by one or two brief speed-ups, each lasting 1–3 days (Fig. 3). After the first of the short speed-ups, the spring acceleration is interrupted and velocities are more variable (Fig. 5). At GPS sites located on the glacier, the brief speed-ups are often followed by a period of slower flow, during which speeds are less than prior to the speed-up. We refer to these periods of slower flow as extra slowdown events (Reference MeierMeier and others, 1994) and discuss them in more detail in Section 4. The number, timing and magnitude of the short speed-up events and, when applicable, extra slowdowns is variable from one year to the next, but they occur simultaneously at all the glacier sites, with no measurable delay.
Surface velocities for glacier sites C1 (a) and C2 (b) are shown in blue (2006), red (2007) and green (2008), consistent with Figure 3. Surface melt is shown with black step-plots for C1 and C2: filled bars indicate direct measurements of surface melt; unfilled bars are from the temperature-index model. In 2006, at both sites, surface melt was calculated using the temperature-index model with lapse-rate-corrected temperatures recorded at the base station. Horizontal black lines above each time series denote periods during which diurnal velocity variations are present. Gray boxes above each velocity curve indicate lake drainage events, where the width of each box corresponds to the time interval over which the indicated number of lakes drained.

In 2006 we identified as many as four short-lived speedup events all occurring after day 200 (Fig. 3). Three of these speed-ups, beginning days 201,215 and 227, coincide with periods of enhanced surface melt and uplift. The speed-up event on day 204 occurred during a time when melt rates were falling (Fig. 5). These speed-up events are observed at C1 and C2 and, to a lesser degree, at C3. There were no GPS deployed at ice-sheet sites in 2006, precluding any comparison of the timing and occurrence of speed-ups on the glacier versus the ice sheet.
During 2007, speed-up events were observed at ice-sheet sites as well as on the glacier. At C1 there were speed-ups on days 177, 181 and 233. The first three speed-ups were also recorded at C0 and C2, but data gaps prevented the possibility of observing the day 233 event at these sites. There is evidence of enhanced surface melt associated with the day 177 event only. At ice-sheet sites there was a speedup event on day 169 at sites P1 and P2, both to the north of the main glacier, that was not reflected in the glacier data. On day 181 there was a notable speed-up of ˜33% at P4 and a much smaller speed-up at P3. Both P4 and P3 are situated south of the main glacier.
The temporal coverage of data from the glacier sites in 2008 was less extensive compared to previous years and, possibly as a result, we identified fewer speed-up events in that year. We see two minor speed-ups on days 166 and 170 at C1, C2 and C3. There was also a speed up on day 211 that was only observed at C2, the only glacier site recording data at the time. There is also some indication of a possible speed-up event around day 187 at the three sites, but the full timing and the magnitude of the event is obscured by data gaps. At the ice-sheet sites we see a pattern in which the occurrence of a given speed-up is restricted to one side of the glacier or the other. At the northern sites we find speed- ups on days 164, 179 and 188, whereas at southern sites there were two speed-ups: one on day 194 and another on day 212. Due to poor data coverage of continuous GPS data it is impossible to confirm any possible patterns of timing and distribution of speed-up events in 2008.
Velocities at the ice-sheet sites in 2007 and 2008 showed steady speeds with little variability prior to an initial speedup each year (Fig. 4). Following the early-season period of steady flow, ice surface speeds at the ice-sheet sites are generally greater and more variable; diurnal variations also become evident during this time. GPS sites on the same side of the glacier (north or south) tend to be very similar, with a few exceptions. The timing of speed-up events and the amplitudes of diurnal variability are similar at P1 and P2 (north of the glacier) in 2007, and time series at P3 and P4 (south of the glacier) are alike except for two speeds-ups that occur at P4, but not P3, on days 182 and 199. During 2008, velocity time series at sites north of the glacier (N1, N2 and N3) and, likewise, at sites to the south (S2 and S3) share a similar shape, but the amplitude of diurnal variability is greater at sites further downstream, which are closer to the ice-sheet margin.
The effect of ice motion subject to a constant relative acceleration was removed from the position data for the three glacier sites using Eqns (4) and (6) with remote- sensing-derived strain rates. To examine the timing of changing glacier speeds as a response to seasonal forcings (e.g. surface meltwater forcing and seasonal calving behavior), velocity anomalies were determined for each year of data. These anomalies were calculated using the residual position data. Anomalies were derived from smoothed residual positions in order to suppress short-term effects. The velocity anomalies are defined as the difference between measured velocities and expected velocities calculated using the time derivative of Eqn (4). Positive values of velocity anomaly indicate times when the glacier is flowing faster than the mean year-long flow, and, conversely, negative anomalies indicate speeds less than mean flow.
3.2. Terminus position
The results of the Landsat terminus position mapping (Fig. 6) show the rapid retreat and high variability during the period of ice tongue break-up previously described by Reference Podlech and WeidickPodlech and Weidich (2004) and Reference Luckman and MurrayLuckman and Murray (2005). During the years 2001–05, the average rate of retreat was almost 3000 m a-1 and seasonal fluctuations were as much as 6 km. After 2005, the rate of retreat was slower, an average of 500 m a-1, and more steady. Every year from 2005 up to 2010, the glacier advanced during winter and formed a floating tongue that would then break up in spring. Seasonal variations were particularly pronounced in years 2007–09. Reference Joughin, Das, King, Smith, Howat and MoonJoughin and others (2008b) identified such fluctuations during 2004–07 as a primary control on the seasonal evolution of ice flow on outlet glaciers in West Greenland. In the winter of 2009, this pattern did not continue; while the retreat rate has remained steady since 2005, there was no substantial floating tongue formed in winter 2009/10 (Reference CassottoCassotto, 2011). Iceberg calving continued through the winter of 2009 and spring 2010, preventing the terminus advance necessary for the formation of a floating tongue (Fig. 6).
Landsat-derived mean terminus position (circles) with the timing of major calving events (triangles) cataloged from passive seismic measurements (Reference Amundson, Clinton, Fahnestock, Truffer, Lüthi and MotykaAmundson and others, 2012), 2001–11. Velocity anomalies of the glacier sites are shown in blue (C1), red (C2) and green (C3). Positive values of velocity anomaly indicate times when the glacier is flowing faster than the mean year-long flow; conversely, negative anomalies indicate speeds less than mean flow.

3.3. Surface melt
In order to estimate daily surface melt, DDFs were calculated at sites C1 and C2 in 2008 following Eqn (8). We calculated a DDF for site C1 of 1.2 ˟ 10-2 m w.e. K-1 d-1 and at C2 of 1.4 ˟ 10-2 m w.e. K-1 d-1. These values are within the range used by Reference Fausto, Ahlstrom, Van As, Johnsen, Langen and SteffenFausto and others (2009) for cold and warm conditions on bare ice in Greenland. They were applied to the C1 and C2 temperatures determined from the lapse-rate corrected base station measurements. Between C1 and the base station we calculated a lapse rate of 6.6 K km-1, and between C2 and the base station we found a lapse rate of 7.5 Kkm-1. The same 2008 DDF was used with temperatures measured at C1 to calculate melt at C1 in 2007. The results of temperature-index melt calculations are presented in Figure 5.
Periods of significant diurnal velocity variations, identified with the Reference GaborGabor (1946) transform method following Eqn (7), were determined for sites C1 and C2 in 2006, 2007 and 2008 and are represented in Figure 5 as horizontal black lines above each velocity time series. During the spring acceleration, before the first speed-up, there is little or no diurnal velocity variation at C1 and C2. Each year the onset of diurnal variation in surface speed follows the first speed-up (Fig. 3; Section 3.1) when surface melt is sustained at elevated levels for several consecutive days. Following onset, the amplitude of the diurnal velocity variations is greatest during times with large positive degree-days, corresponding to daily surface melt of ˜0.05 m w.e. or greater.
In 2007, total surface melt was at least two times greater than in 2006 or 2008 when comparing cumulative melt rates during periods of overlapping data coverage. The anomalously high melt observed during 2007 is confirmed by modeling results (Reference Mernild, Liston, Steffen and ChylekMernild and others, 2010) and remote- sensing observations (Reference MoteMote, 2007) of West Greenland. The surface speeds at C1 and C2 also had the greatest amount of diurnal variability in 2007, and the onset of high diurnal strength appears related to the cumulative melt for the season. In years when surface melt begins earlier and is more intense, diurnals begin earlier and diurnal amplitudes are greater.
3.4. Supraglacial lake drainage events
The areal extent and timing of supraglacial lake drainage events are depicted in Figure 7 for 2006, 2007 and 2008. In general, we find that the majority of the lake drainage events occurred south of the glacier, where more lakes occur. During summer 2006 we identified three time periods with lake drainage events: days 202–204, days 204–211 and days 213–218. During 2007 there was only one time period with observed drainages: days 179–183. In 2008 there were two lake drainage periods: days 178–192 and 192–201. In some cases, we observe the same lake(s) repeatedly draining each year; however, this is not always the case, and of 14 lakes, only 5 drained more than once in 3 years.
Outlines of supraglacial lake drainage events were identified using MODIS 250 m scenes during the 2006 (a), 2007 (b) and 2008 melt seasons (c). The background image shows the ice surface after lakes have drained, with the areal extent of full lakes color-coded by the dates over which they drained. Most lake drainages occur to the south of the main glacier, where a greater number of large lakes form each year.

4. Discussion
4.1. Interannual velocity variations
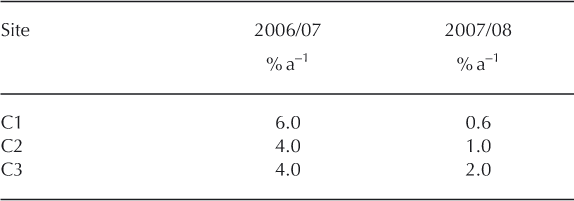
The GPS-derived surface velocities on Jakobshavn Isbræ show a general pattern of increasing speed from one year to the next (Fig. 3). Reference JoughinJoughin and others (2008a) have identified a ˜5%a-1 acceleration trend in SAR-derived surface velocities on the glacier from 2004 to 2007. Our GPS record confirms the general trend of steady acceleration between 2006 and 2007, but we observe a departure from this trend between 2007 and 2008 (Fig. 3; Table 3). A smaller increase in speed (approximately half that during the previous year) was observed between 2007 and 2008 at the furthest upstream site C3, with even smaller increases for downstream sites C2 and C1.
Interannual acceleration as a percentage per year of earlyspring surface speed
Reference JoughinJoughin and others (2008a) demonstrated that the interannual acceleration since the early 2000s has been driven by changes at the ice front. The deviation, from 2007 to 2008, from a steady interannual trend in the GPS speeds shows that sites closest to the terminus have the strongest response to changes in forcing; in this case to changes that resulted in less acceleration (Table 3; Fig. 3). This suggests that both acceleration and deceleration are controlled at the ice front. From 2001 to 2005 the average rate of terminus retreat was nearly 2500 m a-1, which is greater than the retreat rate during the time period 1997–2001, when the onset of terminus retreat and increasing speeds occurred (˜1500ma-1) (Reference Luckman and MurrayLuckman and Murray, 2005). More recently, from 2005 to 2009, the average rate of terminus retreat was only ˜500ma-1 (Fig. 6). Despite these large variations in retreat rate, during the period 1997–2009 the interannual acceleration was very steady with a relative acceleration of 5–8%a-1 (Reference JoughinJoughin and others, 2008a). In contrast, on shorter timescales surface speeds are more closely connected to seasonal terminus position.
4.2. Seasonal velocity variations
In the lower reaches of the glacier (˜10–20km from the terminus) flow speeds are controlled by glacier geometry and terminus boundary conditions (Reference JoughinJoughin and others, 2008a), with surface speeds greatest near the terminus. This type of tidewater behavior has also been confirmed by modeling results at Helheim Glacier, East Greenland (Reference Nick, Vieli, Howat and JoughinNick and others, 2009). In addition to an interannual acceleration in response to the decadal trend of decreasing glacier length, surface speeds are affected by seasonal variations in terminus position. Since 2000, the terminus position of Jakobshavn Isbrӕ has varied by as much as 5–8 km a-1, primarily due to seasonality of calving (Fig. 6). As the rate of calving increases in the spring, the glacier responds by speeding up (Fig. 6). We find that the lower glacier responds to changes in terminus position first, with response times increasingly delayed moving up-glacier. Based on the velocity anomaly data presented in Figure 6 we note a time delay in the velocity response to the start of calving and terminus retreat in spring. It is more difficult to identify a similar pattern in the fall, as Landsat-derived terminus positions become unavailable due to a lack of solar illumination. However, SAR-derived terminus position and surface velocity data, continuous through a whole year, allow for a full examination of the seasonal response to variations in terminus position. Reference Joughin, Das, King, Smith, Howat and MoonJoughin (2008b, Fig. 4) presents SAR-derived surface speeds and terminus positions from 2005 to 2007 and these data show delays of ˜40–50 days between the onset of seasonal terminus retreat and the beginning of the seasonal acceleration in spring. In fall seasons, there is a significantly shorter delay of 10–20 days between the onset of terminus advance and when the glacier begins to decelerate. The asymmetry of seasonal response to terminus position suggests separate glacier behavior in response to an advancing terminus versus a retreating terminus.
In early winter, the rates of ablation and calving both cease or are greatly reduced. This leads to simultaneous glacier advance and thickening. We hypothesize that variations in glacier speed are primarily controlled by ice thickness through its influence on effective basal pressure, and hence sliding, as also suggested by Reference JoughinJoughin and others (2012). In fall, the gradual advance of the glacier proceeds simultaneously with a gradual thickening of ice at the grounding zone, and velocity response is immediate over the lower glacier, with large areas of the lower glacier gradually thickening and slowing at the same time. In spring, as the winter floating tongue disintegrates rapidly, the ice thickness response upstream of the grounding zone is delayed as increased flow at the calving front progressively thins the glacier. Speed response is delayed at up-glacier sites by the time required for thickness changes, and therefore sliding speed, initiated at the grounding zone to propagate upstream, similar to the suggestion by Reference PfefferPfeffer (2007) of upward propagation. So in fall, it is not necessary to propagate any changes in thickness, whereas in spring thickness changes are propagated up from the terminus. It is important to note that the spring speed-up coincides with the disintegration of the floating tongue, which sometimes occurs well before the onset of surface melt (Reference JoughinJoughin and others, 2008a). It is therefore not comparable to spring speed-up events, as observed on alpine glaciers. Such events do exist, as we show below, but they are distinct from this seasonal evolution.
The pattern of seasonal velocity variations was interrupted dramatically in summer 2007, when all glacier GPS sites slowed down simultaneously in midsummer. The onset of this slowdown was sudden (Figs 3 and 5), and it significantly affected the average seasonal velocity. We discuss this event in more detail in Section 4.4.
4.3. Diurnal velocity variations
At all GPS sites, the velocity response to surface melt is not constant through the melt season. We see no evidence for tidal modulation at diurnal or semi-diurnal frequencies at sites >10 km upstream of the terminus (Reference Podrasky, Truffer, Fahnestock and LuthiPodrasky and others, 2010). Furthermore, there is no evident shift in the timing of diurnal maxima throughout a tidal cycle as one would expect with the major tidal constituents which have periods not exactly equal to one solar day. We thus conclude that any diurnal variations in surface velocity at the sites in this study are due to surface melt. In spring seasons when the supply and variability of meltwater are low, we see a steady acceleration at the glacier sites with low diurnal variability. By the start of summer, the spring acceleration is interrupted by rapid speed-up events synchronous across all glacier GPS sites (Fig. 3). Following the first speed-up we see evidence for diurnal variations, indicating that the glacier is able to respond to surface meltwater input on short timescales (Fig. 5). The timing of diurnal maxima is ˜6 hours after local noon at all sites, with little change throughout the melt season. The amplitude of diurnal variations is greatest when surface melt is increasing at both glacier and ice-sheet sites (e.g. Fig. 5 during days 189–194 in 2007 and during days 190–195 in 2008). The velocity response of the ice-sheet sites closely matches the estimates of surface melt: speeds are greater during periods of enhanced melt and are lower when there is less melt.
The absolute amplitude of diurnal variability is similar at both glacier and ice-sheet sites and is as much as 10cmd-1 during periods of strong diurnal variation (Figs 4 and 5). While the amplitude of diurnals may be similar on the glacier and ice sheet, the amplitude of diurnals relative to background flow is smaller on the glacier compared to ice- sheet sites. The relative amplitude of diurnal variability at glacier sites is ˜1–2% and at ice-sheet sites it is closer to 5%. We find a similar pattern regarding the expression of short-term velocity events at glacier versus ice-sheet sites. On the ice sheet, the largest of the short-term velocity events represent ˜30% increases in speed, whereas large events on the glacier amount to a speed increase of 5–10%.
4.4. Short-term velocity events
On seasonal and shorter timescales, summer speeds are influenced by the combination of an early-season terminus retreat and surface meltwater forcing. During spring, at the beginning of each annual velocity record, short-term variations in surface speed are at a minimum (Figs 4 and 5). During this period, there is low correlation between surface melt and velocity. We interpret this to mean that both the quantity and variability of surface melt reaching the bed is low during spring. As rates of surface melt increase, the velocity time series are punctuated by brief velocity events of duration 1–3 days, as described in Section 3. These short-term velocity events consist of sudden speed-ups, lasting for only a few days (Figs 3 and 4), and are distinct from the longer steady spring acceleration described in Section 4.3. The magnitudes of the speed-ups on Jakobshavn Isbrӕ, 5–10%, are similar to those observed at Helheim Glacier, East Greenland (Reference AndersenAndersen and others, 2010). However, the magnitude of these speed-ups is small compared with other West Greenland outlet glaciers: Reference Bartholomew, Nienow, Mair, Hubbard, King and SoleBartholomew and others (2010) observed speed-ups in excess of 200% at land- terminating Russell Glacier, and speed-ups as large as 33% have been reported on Kangiata Nunata Sermia, a tidewater outlet glacier 500 km south of Jakobshavn Isbr* (Reference SoleSole and others, 2011). The relatively large speed-ups of marine- terminating Kangiata Nunata Sermia may be a consequence of where measurements were made rather than a difference in glacier behavior. The GPS measurements presented by Reference SoleSole and others (2011) were made high on the glacier (35–70km from the terminus) in a region where the glacier is bedded at or above sea level. Surface speeds at these sites are also significantly lower than speeds in the terminus region, and as a result the region of study at Kangiata Nunata Sermia may have a response to surface meltwater forcing that falls somewhere between a fast-flowing tidewater outlet and the surrounding ice sheet. While the percent speed-ups observed at marine-terminating outlets are small, the absolute change in flux associated with a 5% increase in surface speed at Jakobshavn Isbrӕ or Helheim Glacier is large, due to the high ice velocity and large ice thickness.
Onset of the speed-ups is rapid, typically <1 day, and the duration of enhanced flow ranges from 2 to 5 days. At glacier sites, the speed-up is almost always followed by a drop in speed, or extra slowdown, where speeds are reduced to less than that before the onset of the event. Extra slowdown events were observed to occur multiple times in a single melt season. The largest of the extra slowdowns resulted in a 5% reduction in flow for 2 days at C1 in summer 2007 (Fig. 8b). At ice-sheet sites, there are no extra slowdowns; at these sites speed-up events are followed by slowdowns which do not result in lower speeds than before the event. Extra slowdown events have been observed elsewhere in Greenland (Reference SoleSole and others, 2011) and were first described by Reference MeierMeier and others (1994) on Columbia Glacier, Alaska, USA.
(a) Surface speed (black) and vertical position (gray) of GPS sites C1, C2 and C3 (in 2006 there were no ice-sheet GPS sites) during a speed-up event beginning day 201 in 2006. (b, c) A speedup event beginning day 181 in 2007 was recorded at glacier sites C0, C1 and C2 (b) and margin sites P3 and P4 (c). Speed anomalies (a, c), are simply surface speeds shifted with arbitrary additive constants for clarity. Surface speeds presented in (b) are unmodified. Values of vertical position are from detrended vertical GPS position with arbitrary additive constants applied to offset the different curves for clarity.

Periods of reduced speed due to extra slowdown events were found to last on the order of 8 days. We propose that the speed-up events due to rapid uplift were associated with the input of large amounts of surface water and we now examine whether the duration of the slowdown events can be understood in terms of creep closure of over-enlarged, low-pressure subglacial drainage channels following the period of enhanced water input. Reference Bartholomaus, Anderson and AndersonBartholomaus and others (2008) have suggested that the timescale for creep closure of subglacial conduits under ice sheets should be shorter than for valley glaciers, due to the thick ice and potentially large effective stress found on ice sheets. But, in the case of marine-terminating glaciers, conduit closure is slowed due to necessarily high subglacial water pressure. For ice grounded below sea level, the subglacial water pressure must be sufficiently high to generate positive gradients in pressure, necessary to route water to the terminus. That is, the water head upstream of the terminus must be greater than sea level in order to drive water flow. The minimum constraint on water head is independent of bed elevation, which implies that water pressures under overdeepened glacier beds will be greater than those beneath flat or forward-sloping glacier beds. Estimates of the ice thickness and bed elevation taken from Reference Plummer, Gogineni, Van der Veen, Leuschen and LiPlummer and others (2008) are ˜2000m thick and 1500 m below sea level at C1 and 2000 m thick and 1000 m below sea level at C2. The sea-level constraint on water pressure at the terminus dictates a minimum water pressure at C1 and C2 corresponding to a water level of 500 and 1000 m below the ice surface at C1 and C2, respectively.
In general, the rate of creep closure of subglacial conduits is reduced in the presence of finite basal water pressure. In the case of tidewater systems, where ice is grounded below sea level, subglacial water pressures will be maintained at or above a minimum pressure dictated by bed topography. This means that, at the bed of tidewater glaciers, conduit closure via viscous creep will be slower than for conduits at atmospheric pressure. Following the description of RÖthlis-berger (1972), based on a theory first presented by Reference NyeNye (1953), we define r as the conduit radius, a as the rate of wall melt due to viscous heating, A as the flow law parameter, n as the flow law exponent and Neff as the effective pressure (difference between ice overburden and subglacial water pressure)

For this analysis we are interested in the maximum rate of conduit closure for a given effective pressure, so we assume that a is much smaller than ŕ (non-zero values of a will have the effect of increasing closure times). Assuming a flow law exponent of 3, the solution to Eqn (9) for a conduit of initial radius, r0, at time t0 , is

and can be solved for a characteristic timescale, τ, over which the conduit radius has decreased to a value e-1 times r0:

Figure 9 shows conduit closure timescales as a function of englacial water depth for a range of flow law parameters (over a temperature range 0 to –5°C (Reference Cuffey and PatersonCuffey and Paterson, 2010) and from observations of creep closure of tunnels (Reference NyeNye, 1953)) and an ice thickness of 2000 m. Closure timescales of 1, 8 and 100 days would require water levels of 670, 400 and 270m (below the ice surface) respectively.
Characteristic timescale for conduit closure due to ice creep as a function of water depth below ice surface. Timescales were computed for a range (gray shading) of flow law parameters, 1˟10–24 to 5˟10–24 s–1 Pa–3, as well as for a single value (black line) of 2.4˟10–24 s–1 Pa–3 (Reference NyeNye, 1953; Reference Cuffey and PatersonCuffey and Paterson, 2010). A flow law exponent of 3 was used in all calculations. Ice thickness was assumed to be 2000m and the rate of conduit wall melt was assumed to be small compared to creep closure. Dashed line indicates water depth (160m below ice surface) corresponding to zero effective pressure.

These response times are based on a very simple model, but they do suggest that the observed duration of extra slowdowns could be explained by the fact that conduits in regions where ice is grounded below sea level must remain pressurized at a minimum level. Because the rate of creep closure is greatly reduced by the low effective pressures below the glacier, any conduits enlarged by enhanced water flux would remain over-enlarged for days after water flux returns to normal levels. It is important to note this analysis neglects the influence of rapid basal motion for conduit destruction or disconnection (Reference Kamb, Engelhardt, Fahnestock, Humphrey, Meier and StoneKamb and others, 1994). These processes related to high rates of basal motion would effectively reduce the characteristic timescale for conduit closure.
In most instances, the occurrence of the speed-up/extra-slowdown pairs is closely related to the rate of surface melting; but in a few cases the speed-ups do not appear to be related to temperature-index modeled surface melt. For instance, the record at C1 in 2007 (Fig. 5) shows a speed-up around day 181 while rates of modeled surface melt are low and decreasing. However, Figure 8b clearly shows that the event coincides with rapid uplift characteristic of a hydraulic jacking event (Reference Iken, Rothlisberger, Flotron and HaeberliIken and others, 1983). During this event it seems that the temperature-index model is not accurately quantifying all of the sources of surface runoff, such as supraglacial lake drainages (Reference DasDas and others, 2008; Reference Hoffman, Catania, Neumann, Andrews and RumrillHoffman and others, 2011) and enhanced surface melt due to high turbulent heat fluxes across the ice/atmosphere interface (Reference HockHock, 2003).
During the days surrounding the speed-up event on day 181 in 2007, a weather station near the GPS base station recorded air temperatures ranging from 2°C to 5°C and sustained winds in excess of 5 m s-1 (personal communication from D.M. Holland, 2009). Similar meteorological conditions, favoring high rates of atmospheric turbulent heat flux and enhanced rates of surface melt, were observed at Columbia Glacier in summer 1987 (Reference MeierMeier and others, 1994). In this case, the timing of a short-lived speed-up event was best explained by an increase in the volume of stored water, with the subsequent extra slowdown occurring as the volume of stored water decreased. A second extra slowdown event, later in the same season on Columbia Glacier, coincided with heavy rainfall lasting 2 days. The inability to measure the meltwater discharge of Jakobshavn Isbr* makes it difficult to draw conclusions about the relation between basal motion and stored water. However, similarity to the extra slowdown events at Columbia Glacier and the characteristic vertical motion during events at Jakobshavn Isbrӕ suggest a common mechanism for the extra slowdowns of the two glaciers.
In addition to the enhanced surface melt in 2007 – more than twice that in 2006 or 2008 – there was also the occurrence of multiple lake drainage events. From day 179 to 183, seven lakes south of the glacier were observed to drain. This time period closely brackets the speed-up and subsequent extra slowdown events beginning on day 181. The high frequency of lake drainages during days 179–183 was the greatest within our study and is also large compared to an investigation of lake drainages by Reference Hoffman, Catania, Neumann, Andrews and RumrillHoffman and others (2011), who found typical lake drainage frequencies of one drainage per melt season or less. In this instaṁnce, supraglacial lake drainage is another likely mechanism for rapid input of water to the glacier bed. As it was closest to the drained lakes and exhibited the largest velocity response, it seems likely that the speed-up and uplift event at the southernmost site, P4 (Fig. 8c), is related to rapid input of surface water from supraglacial lakes draining to the bed. For the more distant ice-sheet and glacier sites, it is more difficult to conclude whether the velocity response is due to lake drainage or surface melt. However, the lack of velocity response at the two ice-sheet sites north of the glacier suggests that the velocity event on day 181 was primarily forced by lake drainage events rather than a region-wide surface melt event.
As discussed above, speed-up events are usually followed by a slow recovery to pre-speed-up velocities. However, in summer 2007, two events led to large slowdowns that negated essentially the entire interannual acceleration for that year. A speed-up event on day 181 was followed by speeds below background speed for the next 8 days (Fig. 3). Additionally, a second slowdown event (not fully captured in Figs 3 and 5 due to discontinuous GPS records) occurred around day 220. As a result of the data gap, we cannot confirm that the day 220 slowdown was preceded by an initial speed-up. However, the day 220 slowdown (Fig. 3) led to an initial drop in velocity of 12% at C1 and affected the season-long average velocity. While slowdown events were also observed in 2006 (Fig. 8a), the magnitude of the 2007 events appears to be exceptional. The day 220 extra slowdown event is also captured in the SAR-derived data (Fig. 10), but the smaller-magnitude events (e.g. on day 201 in 2006) are less obvious. Generally, a comparison between GPS and SAR speeds shows agreement of better than 3%. However, the GPS measurements are better suited for resolving the rapid nature and the amplitude of these speed-up/extra-slowdown events (Fig. 10).
Comparison of RADARSAT-derived 24 day SAR velocities with GPS velocities at C1, summer 2007. Percent difference between GPS average and SAR speeds is shown for each 24 day period.

The 2007 melt season on Jakobshavn Isbrӕ was anomalous in timing and duration: it started earlier and was more intense than in the other years of our study (Fig. 5) as well as many other years of the same decade (Reference MoteMote, 2007; Reference Mernild, Liston, Steffen and ChylekMernild and others, 2010). As a result of the longer melt season, the potential for extra slowdown events to influence ice motion was greater. It is possible that such long, intense melt seasons (e.g. in 2007) on Greenland outlet glaciers could act to moderate increasing flow speeds by offsetting melt-induced speed-ups with extra slowdowns. A similar process, through which seasonal speed-ups in the ablation area of the ice sheet are offset by more efficient drainage later in the season, has already been recognized over seasonal timescales (Reference ColganColgan and others, 2011; Reference Sundal, Shepherd, Nienow, Hanna, Palmer and HuybrechtsSundal and others, 2011) and has been suggested as an important process over longer timescales as well (Reference Truffer, Harrison and MarchTruffer and others, 2005;Reference Van de WalVan de Wal and others, 2008).
5. Conclusions
We measured surface melt and ice motion for three melt seasons on Jakobshavn Isbræ and the adjacent ice sheet. While surface speeds on Jakobshavn Isbræ are remarkably steady, when compared to typical land-terminating glaciers, there are variations in glacier surface velocities over a wide range of timescales. On long timescales, 3 years of GPS measurements confirm that the glacier is still accelerating from year to year. However, there are indications that surface velocities deviate from a steady rate of acceleration in certain years. Between 2007 and 2008 there was very little (2%a-1 or less) interannual acceleration, a significant departure from the 4–8%a-1 observed in other years. The effect of these anomalies on glacier flow is strongest at sites nearest the terminus.
On seasonal timescales, the glacier experiences a steady spring acceleration – associated with the onset of glacier terminus retreat – with sites near the terminus speeding up first, followed by sites further upstream. Seasonal velocity variations rarely exceed 10% a-1. This pattern of steady spring speed-up is interrupted each year by more variable flow with the beginning of the melt season. In the fall, after the end of the melt season, the glacier experiences deceleration as the rate of calving slows and the terminus begins to gradually readvance. The fall glacier deceleration occurs uniformly on the lower glacier, which is possibly explained by thickening ice due to the cessation of ablation and calving and the influence of increased ice thickness on effective pressure, thereby reducing sliding. In spring, however, the floating tongue often breaks up rapidly and associated ice-thickness changes on the glacier propagate upward from the terminus. The velocity response in spring is thus delayed and leads to an asymmetry in velocity response to changes in terminus position.
On even shorter timescales the seasonal evolution of surface speed is punctuated by brief speed-up events, with the largest events resulting in deviations of ˜10% of background speed. After the steady spring speed-up, velocities on the glacier and ice sheet are more variable than in spring, and are closely related to the rate of surface melt. The presence of diurnal velocity variations during this time suggests that the glacier is able to respond to inputs of surface water on short timescales. Often, the speed-ups were followed by extra slowdown events, where the speeds following the event are lower than prior to the beginning of the event. This pattern of extra slowdowns following speed- ups was observed to occur multiple times in a given season.
While the duration of the speed-ups was typically short, the extra slowdowns resulted in periods of slower flow for as much as a week or longer. We attempt to partially explain the long duration of extra slowdowns with a simple model for the creep closure of a subglacial conduit. The large ice thickness of Jakobshavn Isbrӕ would be sufficient to collapse any subglacial channels within a matter of hours. However, the necessarily high basal water pressures imposed by the tidewater geometry decrease the rate of creep closure, thus favoring longer periods of increased effective pressure. The simple model explaining the duration of extra slowdown events is supported by the fact that there are no observed extra slowdowns at the ice-sheet sites, where the bed topography is at or near sea level.
A likely mechanism responsible for generating pairs of speed-ups and extra slowdowns is the sudden input of large amounts of surface water, either from enhanced surface melt or the drainage of supraglacial lakes. This hypothesis is bolstered by observations made on Columbia Glacier in 1987 (Reference MeierMeier and others, 1994) where two extra slowdown events were explained by increases in stored water: in one instance from heightened rates of surface melt due to large atmospheric turbulent heat flux and in the second by a large rain event. Observations of similar extra slowdowns on Columbia Glacier, Kangiata Nunata Sermia (Reference SoleSole and others, 2011) and on Jakobshavn Isbr* may suggest that this type of response to meltwater input is common on tidewater glacier systems.
In some cases, the long duration of extra slowdowns on Jakobshavn Isbrӕ suppressed glacier flow enough to cancel the enhanced flow resulting from the preceding speed-up. In summer 2007 two particularly strong extra slowdowns exerted an influence on the mean flow for the entire season. The combined effect of these two events entirely cancelled the early spring speed-up in 2007 and is likely responsible for the negligible interannual acceleration from 2007 to 2008. The season-long influence of extra slowdowns on Jakobshavn Isbrӕ is identifiable in the remote-sensing record, but in situ observations of glacier flow are more suitable for investigating the underlying physical mechanisms responsible for the events. The use of a suite of complementary measurements providing wide spatial coverage and high temporal resolution is necessary for understanding how dynamic tidewater systems, like Jakobshavn Isbrӕ, will respond to future changes in climate.
Acknowledgements
Support for this project was provided by NASA’s Cryospheric Sciences Program (NNG06GB49G). Logistical support was provided by CH2M Hill Polar Field Services and instrument support was provided by the University Navstar Consortium (UNAVCO). We thank J. Brown, M. Luthi and R.J. Motyka for help in the field, and S. Herreid for his GIS wizardry. Helpful discussions with A. Aschwanden greatly improved the clarity of the figures. We thank two anonymous reviewers for comments which greatly improved the clarity of the manuscript.
Appendix
Beginning with the total derivative for a vector field of velocity, υ,
the total derivative of the longitudinal (along-flow) component, u, of the velocity is
The acceleration of Jakobshavn Isbrӕ has been observed to scale with surface speeds. In other words, acceleration is greatest in fast-flowing regions. A reasonable way to describe this type of acceleration is to treat it as a percent acceleration, where all points on the glacier speed up by the same constant amount proportional to speed. For a constant relative acceleration, a, the acceleration is related to the velocity by

While the relative acceleration does not vary with position, the time rate of change of velocity does change. In the case of Jakobshavn Isbræ it will be greatest near the terminus and decrease upstream. Such a distribution of acceleration imposes a time-dependent strain rate. To find the strain rate as a function of time we start by integrating Eqn (A3):
and then differentiate Eqn (A4) once with respect to ξ,

Since α is a constant with respect to ξ and the gradient of velocity defines the strain rate, the time-dependent strain rate is
Substituting Eqns (A5) and (A3) into Equation (A7) results in the following for the total derivative:
which is separable and can be integrated to find the time- dependent velocity,

Here we argue that where values of α are small, and time intervals are not greater than a year, then Eqn (A6) will be approximately linear, even for fast-flowing Jakobshavn Isbrӕ. Expanding the exponential and integrating Eqn (A8) we find an expression for the expected position as a function of time:
Define γ as the sum of α and ![]() the expected position is
the expected position is

While this treatment does not allow for discrimination between the acceleration and strain rate, the primary purpose of Eqn (A10) is to remove most of the signal associated with the effects of large strain rates and interannual acceleration from the GPS position time series.


