


Introduction
In dry direct seeding, dry rice seeds are sown directly into dry soil, unlike the traditional system in which seedlings are transplanted into flooded fields (Kumar and Ladha, Reference Kumar and Ladha2011). Erratic rainfall patterns are a major production constraint in direct-seeded rice in Asia and Africa, and the problem is exacerbated by predictions of more variable rainfall under a changing climate (Cai et al., Reference Cai, Santoso, Wang, Yeh, Il, Cobb, Collins, Guilyardi, Jin, Kug, Lengaigne, Mcphaden, Takahashi, Timmermann, Vecchi, Watanabe and Wu2015; Trenberth, Reference Trenberth2011). Dry spells soon after planting can therefore cause crop failure, with only 5 % to 30 % of the sown seeds emerging (Kanno et al., Reference Kanno, Garcia, Suralta, Corales, Bueno, Banayo, Sta. Cruz, Kumar and Kato2023; Ohno et al., Reference Ohno, Banayo, Bueno, Kashiwagi, Nakashima, Corales, Garcia, Sandhu, Kumar and Kato2018). They can also delay seedling emergence by up to 10 days compared with moist conditions (Kanno et al., Reference Kanno, Kumar and Kato2025; Tuong et al., Reference Tuong, Singh, Siopongco and Wade2000).
The crop failure caused by drought can potentially be mitigated by adjusting seeding depth. For rice, sowing depths greater than 4 cm (hereafter, ‘deep sowing’ compared with the generally recommended 1–2 cm) have achieved higher final emergence and earlier crop establishment under drought by allowing seeds to absorb moisture from deeper in the soil (Kanno et al., Reference Kanno, Garcia, Suralta, Corales, Bueno, Banayo, Sta. Cruz, Kumar and Kato2023). However, under moist conditions, deep sowing can decrease final emergence and delay crop establishment compared with shallow sowing (Kanno et al., Reference Kanno, Kumar and Kato2025). The development of a platform for such risk assessment would help researchers form recommendations to support farmer decisions on when to sow seeds and at which depth.
To assess the risks and benefits of different agricultural management scenarios, simulations with crop models are commonly conducted. A simulation study using the APSIM model with 44 years of climate data showed that changing the sowing date to an appropriate time increased the yield of direct-seeded rice in India from 2 to 3 t/ha to more than 5 t/ha (Balwinder-Singh et al., Reference Balwinder-Singh, Kumar, Poonia, Srivastava and Malik2019). A Chinese simulation using the CERES model with 20 years of weather data showed that choosing an appropriate sowing time could increase the yield of direct-seeded rice by up to 1 t/ha (Zhou et al., Reference Zhou, Jin, Liu and Si2023). Simulations of deep and early sowing of wheat in Australia with an empirical emergence model combined with the APSIM model showed the possibility of higher yield by a maximum of 1.5 t/ha under a climate similar to that of the past 100 years (Zhao et al., Reference Zhao, Wang, Kirkegaard and Rebetzke2022).
However, ORYZA, a rice model incorporated in APSIM, lacks functions for simulating the initial phase from sowing to emergence and requires users to input the emergence date and seedling population density (Li et al., Reference Li, Angeles, Marcaida, Manalo, Manalili, Radanielson and Mohanty2017). CERES-Rice simulates emergence date from sowing date but not population reduction during emergence period (Ritchie and NeSmith, Reference Ritchie, NeSmith, Hanks and Ritchie1991; Ritchie et al., Reference Ritchie, Singh, Godwin, Bowen, Tsuji, Hoogenboom and Thornton1998; Singh et al., Reference Singh, Ritchie and Godwin1993). For seedling emergence in direct-seeded rice, several studies have modelled the effect of soil temperature (Hamasaki and Nemoto, Reference Hamasaki and Nemoto2020; Sawada et al., Reference Sawada, Ohsumi, Yasumoto, Kojima and Nakagawa2023; Zhou et al., Reference Zhou, Jin and Wang2022). However, our literature review found no studies of modelling of the effect of soil moisture or sowing depth on rice emergence because the concept of sowing depth adjustment is relatively new in rice culture (Kanno et al., Reference Kanno, Garcia, Suralta, Corales, Bueno, Banayo, Sta. Cruz, Kumar and Kato2023, Reference Kanno, Kumar and Kato2025, Reference Kanno, Kumar and Kato2026; Ohno et al., Reference Ohno, Banayo, Bueno, Kashiwagi, Nakashima, Corales, Garcia, Sandhu, Kumar and Kato2018).
Major growth models for dryland crops such as wheat or maize have functions to simulate germination and emergence dates. In these models, germination is commonly determined by soil moisture, and emergence happens when a certain thermal time (expressed as degree-days) has been accumulated, with emergence usually defined as a linear function of sowing depth (Hunt and Pararajasingham, Reference Hunt and Pararajasingham1995; Jones et al., Reference Jones, Ritchie, Kiniry, Godwin and Otter1984; Keating et al., Reference Keating, Carberry, Hammer, Probert, Robertson, Holzworth, Huth, Hargreaves, Meinke, Hochman, McLean, Verburg, Snow, Dimes, Silburn, Wang, Brown, Bristow, Asseng, Chapman, McCown, Freebairn and Smith2003). In some cases, the accumulation of thermal time is also regulated by soil moisture (Ritchie et al., Reference Ritchie, Singh, Godwin, Bowen, Tsuji, Hoogenboom and Thornton1998). Although a few attempts have been made to model the reduction of wheat final emergence by drought or deep sowing, these have yet to be incorporated into larger models (Al-Mulla et al., Reference Al-Mulla, Huggins and Stöckle2014; Zhao et al., Reference Zhao, Wang, Kirkegaard and Rebetzke2022). Process-based approaches to simulate this stage often become computationally complicated (i.e., they greatly increase calculation times), which makes them unsuitable for integration into more comprehensive models (Al-Mulla et al., Reference Al-Mulla, Huggins and Stöckle2014; Bradford, Reference Bradford2002). Another approach is to empirically simulate final emergence and to combine it with a process-based model for the emergence date, but there seems to be no widely accepted method for this analysis (Zhao et al., Reference Zhao, Wang, Kirkegaard and Rebetzke2022). Furthermore, rice emergence is much more sensitive than wheat or maize to sowing depth (Itabari et al., Reference Itabari, Gregory and Jones1993; Mahdi et al., Reference Mahdi, Bell and Ryan1998; Rebetzke et al., Reference Rebetzke, Richards, Fettell, Long, Condon, Forrester and Botwright2007; Knappenberger and Koller, Reference Knappenberger and Köller2012; Cox and Cherney, Reference Cox and Cherney2015; Kanno et al., Reference Kanno, Kumar and Kato2025; Mohan et al., Reference Mohan, Schillinger and Gill2013).
To better simulate the effects of sowing depth and soil moisture on the emergence of direct-seeded rice, our research group has recently developed two models. One is an empirical model to estimate final emergence (the number of emerged seedlings divided by the number of sown seeds) from data on sowing depth and soil water tension (Kanno et al., Reference Kanno, Kumar and Kato2025). The other is a process-based model that estimates emergence dates on the basis of sowing depth, daily soil temperature and daily soil water tension (Kanno et al., Reference Kanno, Kumar and Kato2026). The objectives here were therefore to build a process-based model to simulate final emergence and the emergence date of dry direct-seeded rice from actual daily weather data and to quantify the effect of different sowing depths on the risk of crop failure under rainfed conditions through scenario analysis. To our knowledge, such a modelling system does not currently exist in the literature.
Materials and methods
Overall model
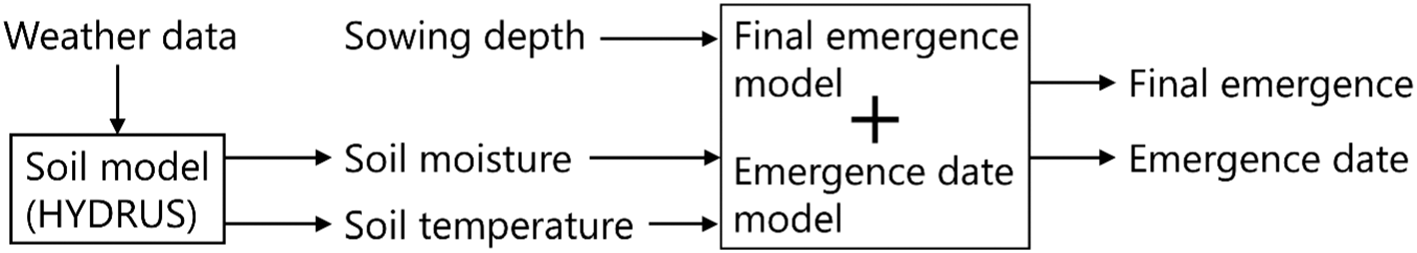
We developed a new modelling framework that combined the HYDRUS-1D soil model (Šimůnek et al., Reference Šimůnek, Genuchten and Šejna2008), a rice final emergence model and a rice emergence date model (Figure 1). We applied the model to a lowland farm at the Institute for Sustainable Agroecosystem Services, University of Tokyo, Nishitokyo, Japan (35°44′N, 139°32′E). The soil at the site is an Andosol with a silty loam texture (sand 30 %, silt 57 %, clay 13 %). A soil profile of 100 cm depth consists of Kuroboku Andosol from 0 to 40 cm depth and Tachikawa loamy Andosol from 40 to 100 cm depth (Kato et al., Reference Kato, Kamoshita, Abe and Yamagishi2007). The model parameters for HYDRUS-1D had previously been calibrated and evaluated at this site by Kato et al. (Reference Kato, Nishimura, Imoto and Miyazaki2011). The rice emergence date model was also developed and evaluated in the same environment using the indica cultivar Rc420 (IR83383-B-B-129-4) (Kanno et al., Reference Kanno, Kumar and Kato2026). Here, we first evaluated the final emergence model using field data and then integrated the evaluated models to predict the emergence date and final emergence from daily weather data and sowing depth. We then used this framework to assess the risk of poor emergence under varying sowing depths through scenario analysis. All modelling, simulation and statistical analysis were conducted in R v. 4.5.1 software (https://www.r-project.org/), except for the soil simulation with the HYDRUS-1D, version 4.17.0140 (Šimůnek et al., Reference Šimůnek, Genuchten and Šejna2016).
Overview of the model framework.

Validation of the final emergence model
In previous research, we developed an empirical rice model of final emergence (the proportion of sown seeds that produced emerged seedlings) (Kanno et al., Reference Kanno, Kumar and Kato2025). The model simulates final emergence as a product of two logistic functions: one for sowing depth and the other for soil water tension. Each function has two genetic parameters, and thus the whole model has four parameters for each cultivar. Here, we validated the model with data from a field experiment that were not used for model parameterization. The field experiments were conducted under rainfed conditions at the study site in the summers of 2018, 2020 and 2023. The methodologies and results of each experiment are documented in Kanno et al. (Reference Kanno, Garcia, Suralta, Corales, Bueno, Banayo, Sta. Cruz, Kumar and Kato2023, Reference Kanno, Kumar and Kato2025). From the 2018 experiment, we used data from two trials with different sowing dates under relatively dry conditions for the validation. The trial with sowing on July 11 had only one sowing depth (8 cm), whereas the trial with sowing on July 20 had two sowing depths (1 and 4 cm). From the 2020 experiment, we chose data from the deep-sown (6 cm) plots in a trial of dry sowing on August 5. In the 2023 experiment, we used four sowing depths (2, 4, 6 and 8 cm) under drought conditions.
All data were combined and the final emergence for each plot was predicted using the model based on the measured sowing depth and soil water tension. For the soil water tension, the input value was defined as the minimum of the 6-day geometric mean from sowing to the day when the measured emergence stopped increasing. The model performance was evaluated by calculating the goodness of fit (R 2) and the root-mean-square error (RMSE) from the observed (O i ) and predicted (P i ) final emergence values:
 $$\begin{align} RMSE=\sqrt{{1 \over n}{\sum }_{i=1}^{n}\left(P_{i}-O_{i}\right)^{2}} \end{align}$$
Scenario analysis
Daily weather data from 1977 to 2024 were obtained from the Japan Meteorological Agency (JMA) Nerima station (4.9 km from the site), except for relative humidity, which was obtained from the JMA Tokyo station (21.5 km from the site). For missing temperature data, values were estimated by interpolation using the temperatures of the preceding and following days. The scenario analysis on rice emergence under rainfed conditions consists of three steps (Figure 1). For the soil, the weather data were input into HYDRUS-1D to simulate soil water potential and soil temperature. A bimodal Durner–Mualem model was adopted to describe soil hydraulic properties (Durner, Reference Durner1994). For soil thermal properties, a model from Chung and Horton (Reference Chung and Horton1987) was used. As upper boundary conditions, daily rainfall, air temperature, relative humidity, sunshine hours and wind speed were used as inputs. As lower boundary conditions, free drainage for water flow and zero gradient for heat transport were assumed. Although the simulation was conducted for the whole 48-year period, it was reset to the initial values of –500 cm H2O (−49 kPa) soil water potential and 20 °C soil temperature for all layers at the start of each year, since the assumption of continuous fallowing for the whole period was unrealistic. We used the simulation outputs from May to September for the next steps to minimize the effect of the initial values and to focus more on the effect of soil moisture rather than cold stress. The simulated soil water potential and soil temperature values at designated sowing depths were summarized into daily means. The soil water potential (negative values) was converted to soil water tension (positive values) by turning negative values into positive values that were then used as inputs for the rice emergence models.
For the rice emergence, the final emergence model takes sowing depth and soil water tension as inputs; these values must represent the period from sowing to emergence (Kanno et al., Reference Kanno, Kumar and Kato2025). On the other hand, the process-based model for emergence date calculates the time to reach 50 % of target final emergence on the basis of daily soil water tension and temperature data, in addition to sowing depth (Kanno et al., Reference Kanno, Kumar and Kato2026). We combined these two models by first estimating a potential final emergence with only the soil moisture function of the empirical model based on the soil water tension during the 14 days after sowing. Next, we simulated the date to reach 50 % of that potential emergence using the process-based model and then re-simulated the final emergence with the empirical model based on the sowing depth and the soil moisture from sowing to the simulated emergence date. The soil water tension inputs into the empirical model were defined as the minimum 6-day geometric means in the designated periods. If the number of simulated days from sowing to emergence was less than 6 days, the geometric mean of that period was used. If the target emergence could not be reached within 14 days in the process-based model, the simulation was stopped, and the emergence was considered ‘delayed’. In this case, the soil water tension value used for the estimation of final emergence was taken from the emergence at 14 days after sowing. The simulation was conducted with sowing dates set as every day between May and September and the final emergence and days from sowing to emergence were recorded for each sowing date. We performed three sets of simulations with different sowing depths (1, 4 and 6 cm) as scenarios to quantify the effect of sowing depth.
For the simulated final emergence and days to emergence, we performed Kolmogorov–Smirnov tests with Bonferroni’s correction and defined statistical significance as P < 0.05, to compare the cumulative distribution functions for different sowing depths or sowing months. In addition, we calculated the probability that the final emergence fell below 0.8 for each 5-day sowing window between May 1 and September 27 (150 days, 30 periods) over the 48-year period to visualize the risk of poor emergence from different sowing depths.
Results
Validation of final emergence model
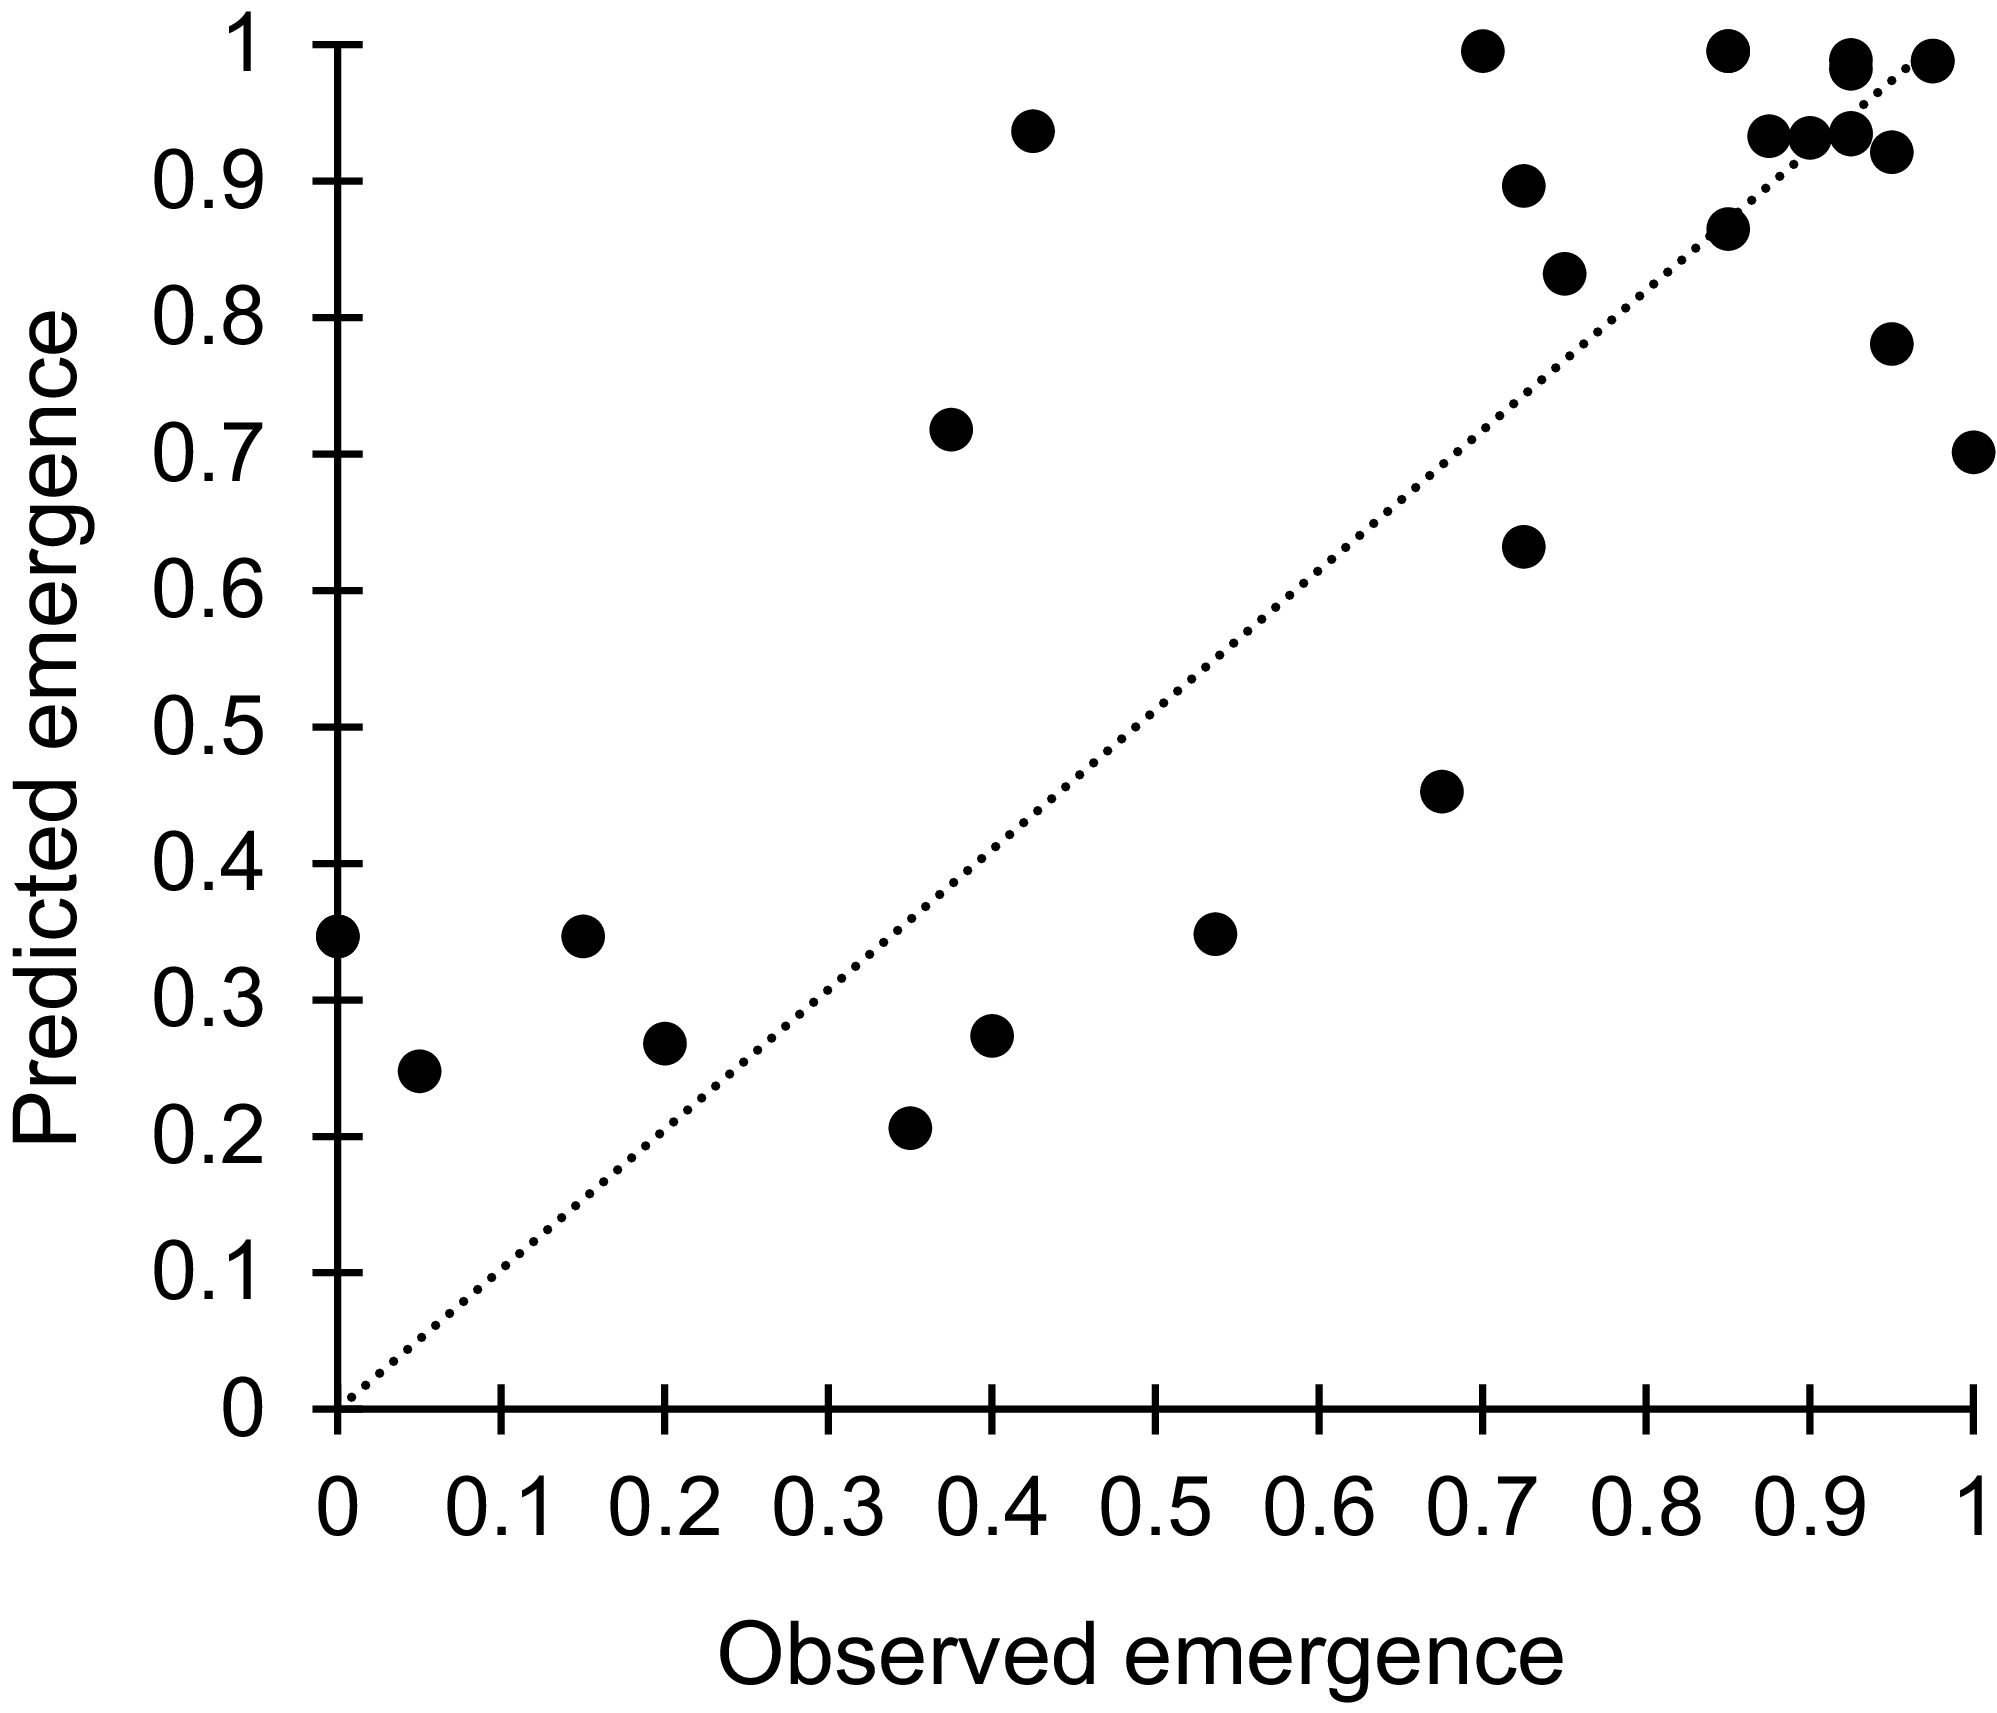
Figure 2 shows the validation results of the emergence model. In the relationship between the observed and simulated final emergence values, R 2 = 0.67 and RMSE = 0.16.
The observed rice final emergence (ratio of emerged plants per sown seeds) in the field experiments and the predicted final emergence by the final emergence model (n = 29).

Overall model and scenario analysis
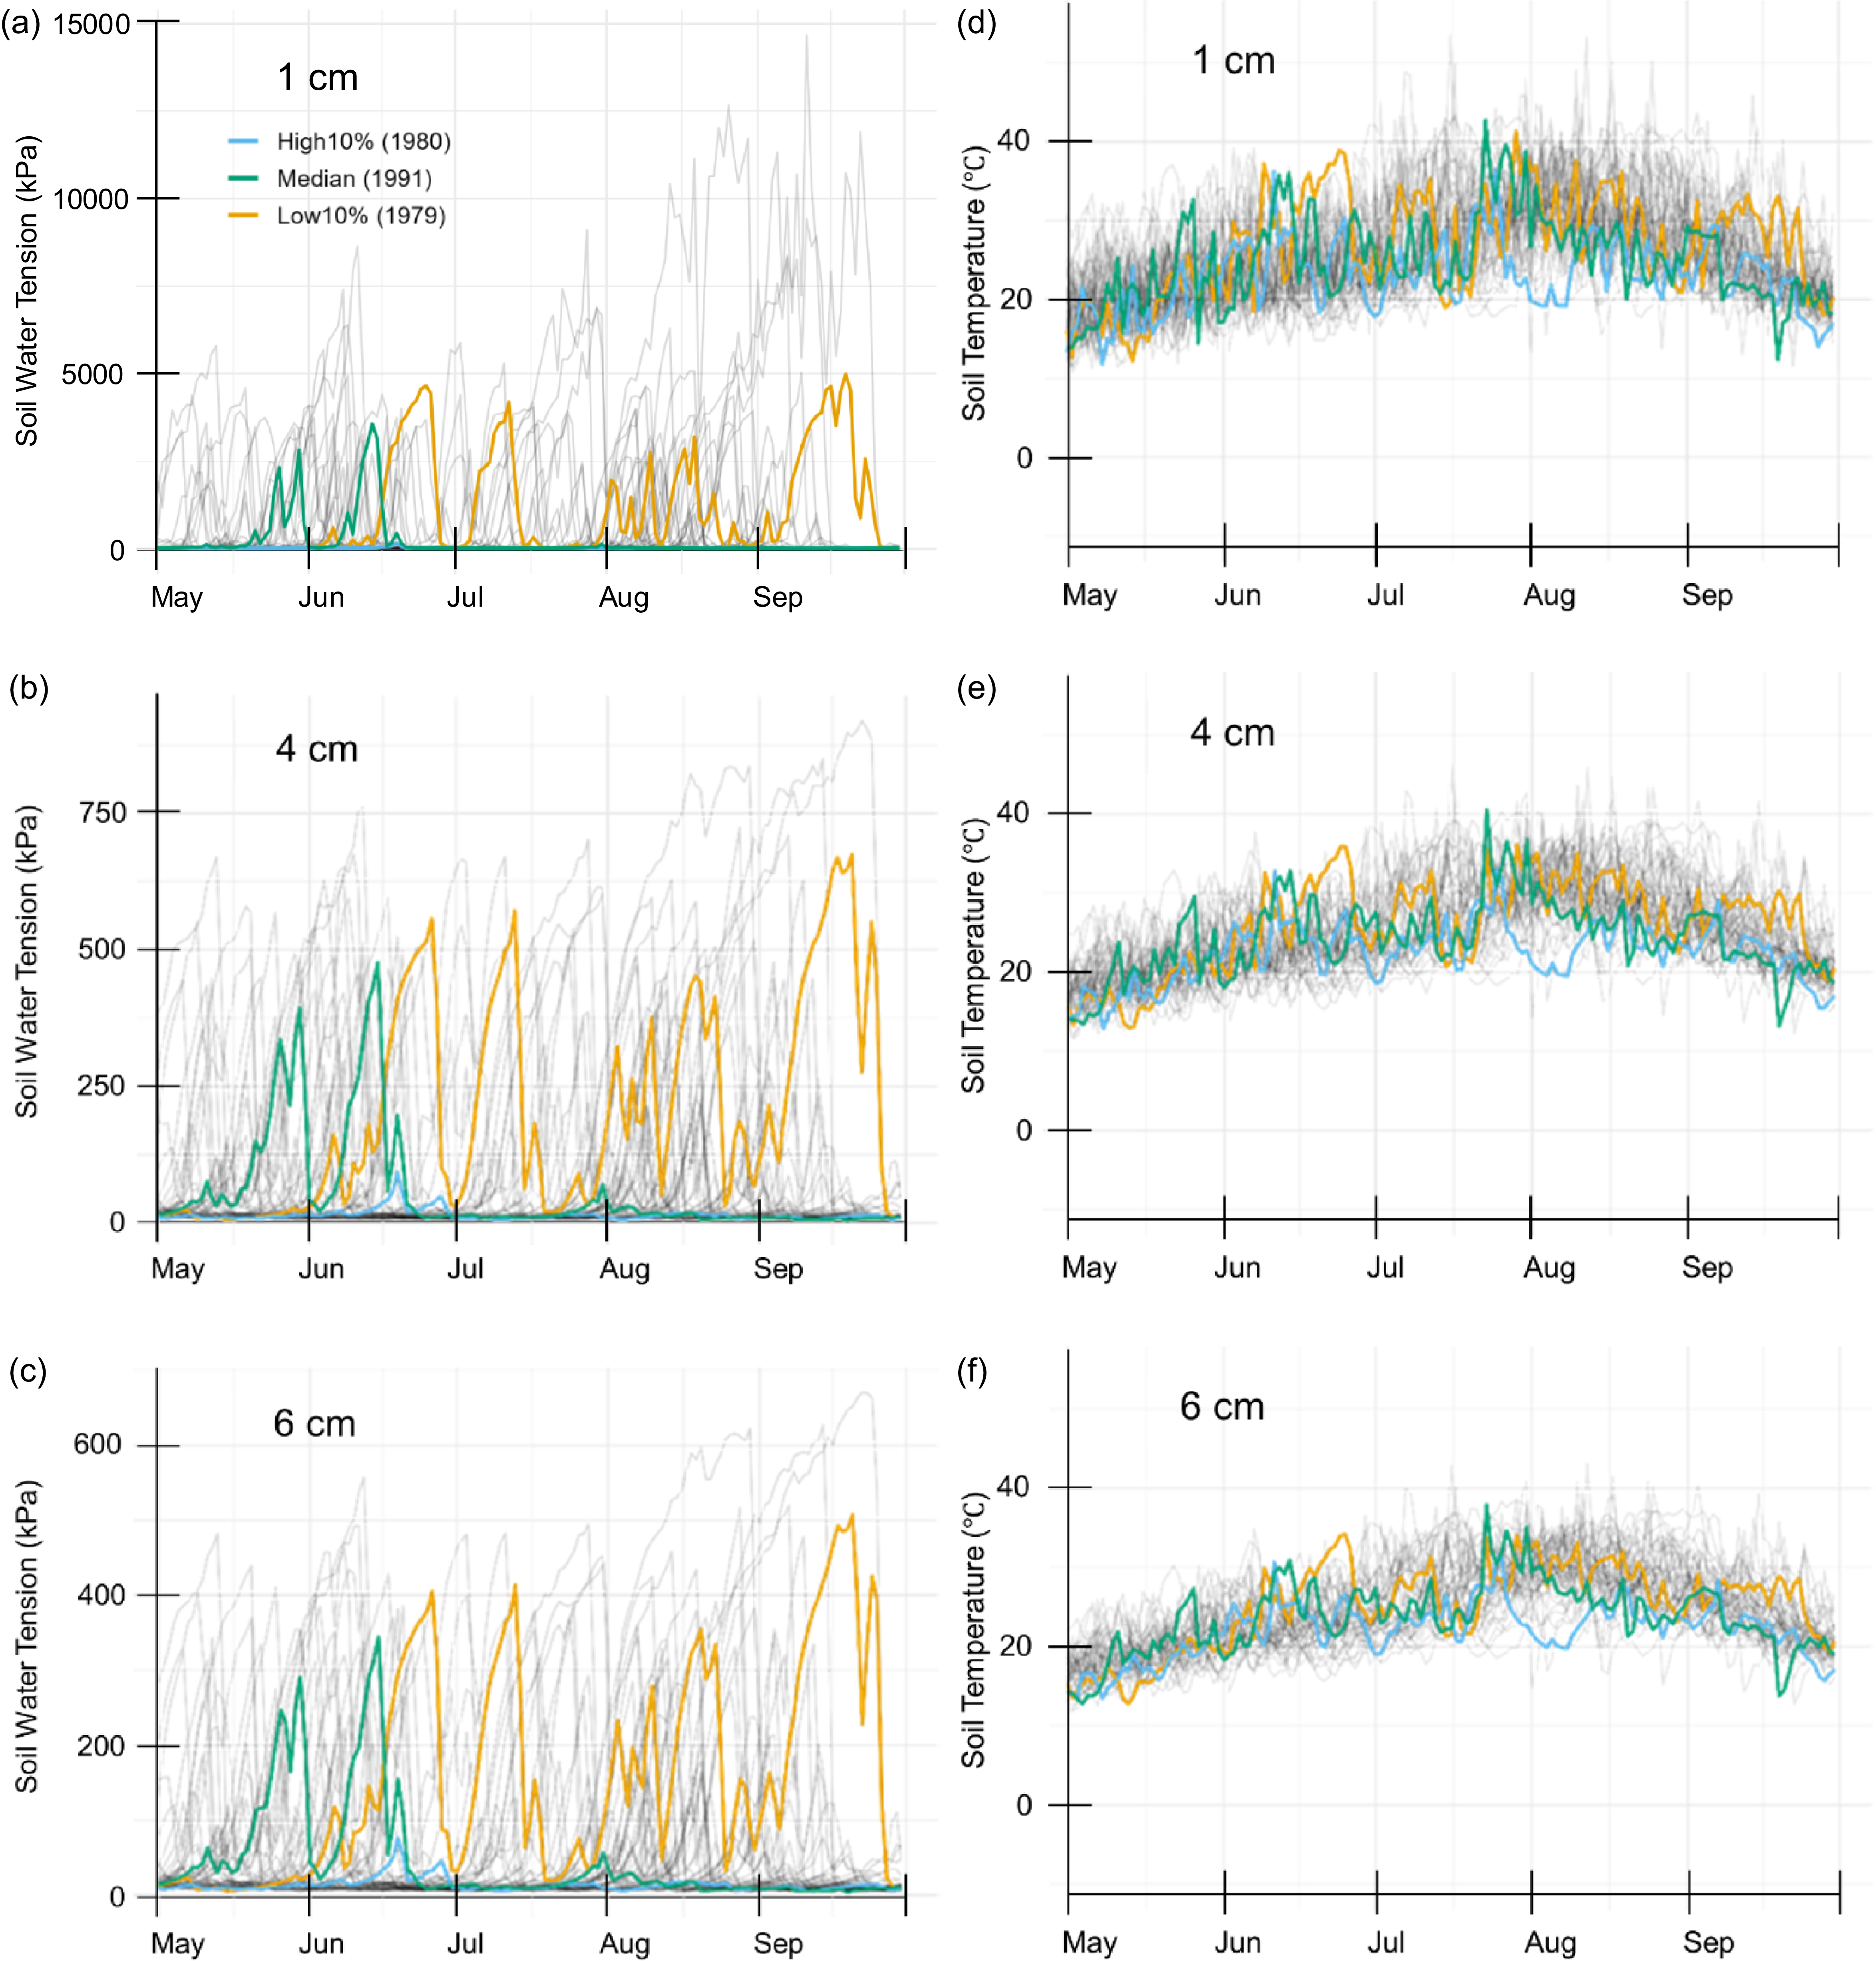
The soil water tension and soil temperature simulated by HYDRUS-1D are shown in Figure 3 and Figures S1 and S2. In wet years, simulated soil water tension remained near field capacity at all depths. On the other hand, in drier years, it greatly exceeded 1.5 MPa, which is the general permanent wilting point, at a depth of 1 cm during dry spells. At 4 and 6 cm sowing depths, the soil was much moister and the simulated soil water tension value was less than 800 kPa even during dry spells. The timings, lengths and numbers of dry spells were not consistent throughout the years. Day-to-day fluctuations were larger at a depth of 1 cm than in deeper layers.
Daily means of (a–c) soil water tension and (d–f) soil temperature simulated by HYDRUS-1D over the 48-year period (1977–2024) at (a, d) 1 cm, (b, e) 4 cm and (c, f) 6 cm depths. Years with the upper (high) 10th percentile (1980 as a representative for wet years), median (1991 as a representative) and the lower 10th percentile (1979 as a representative for dry years) values of mean soil water potential at 1 cm depth are highlighted.

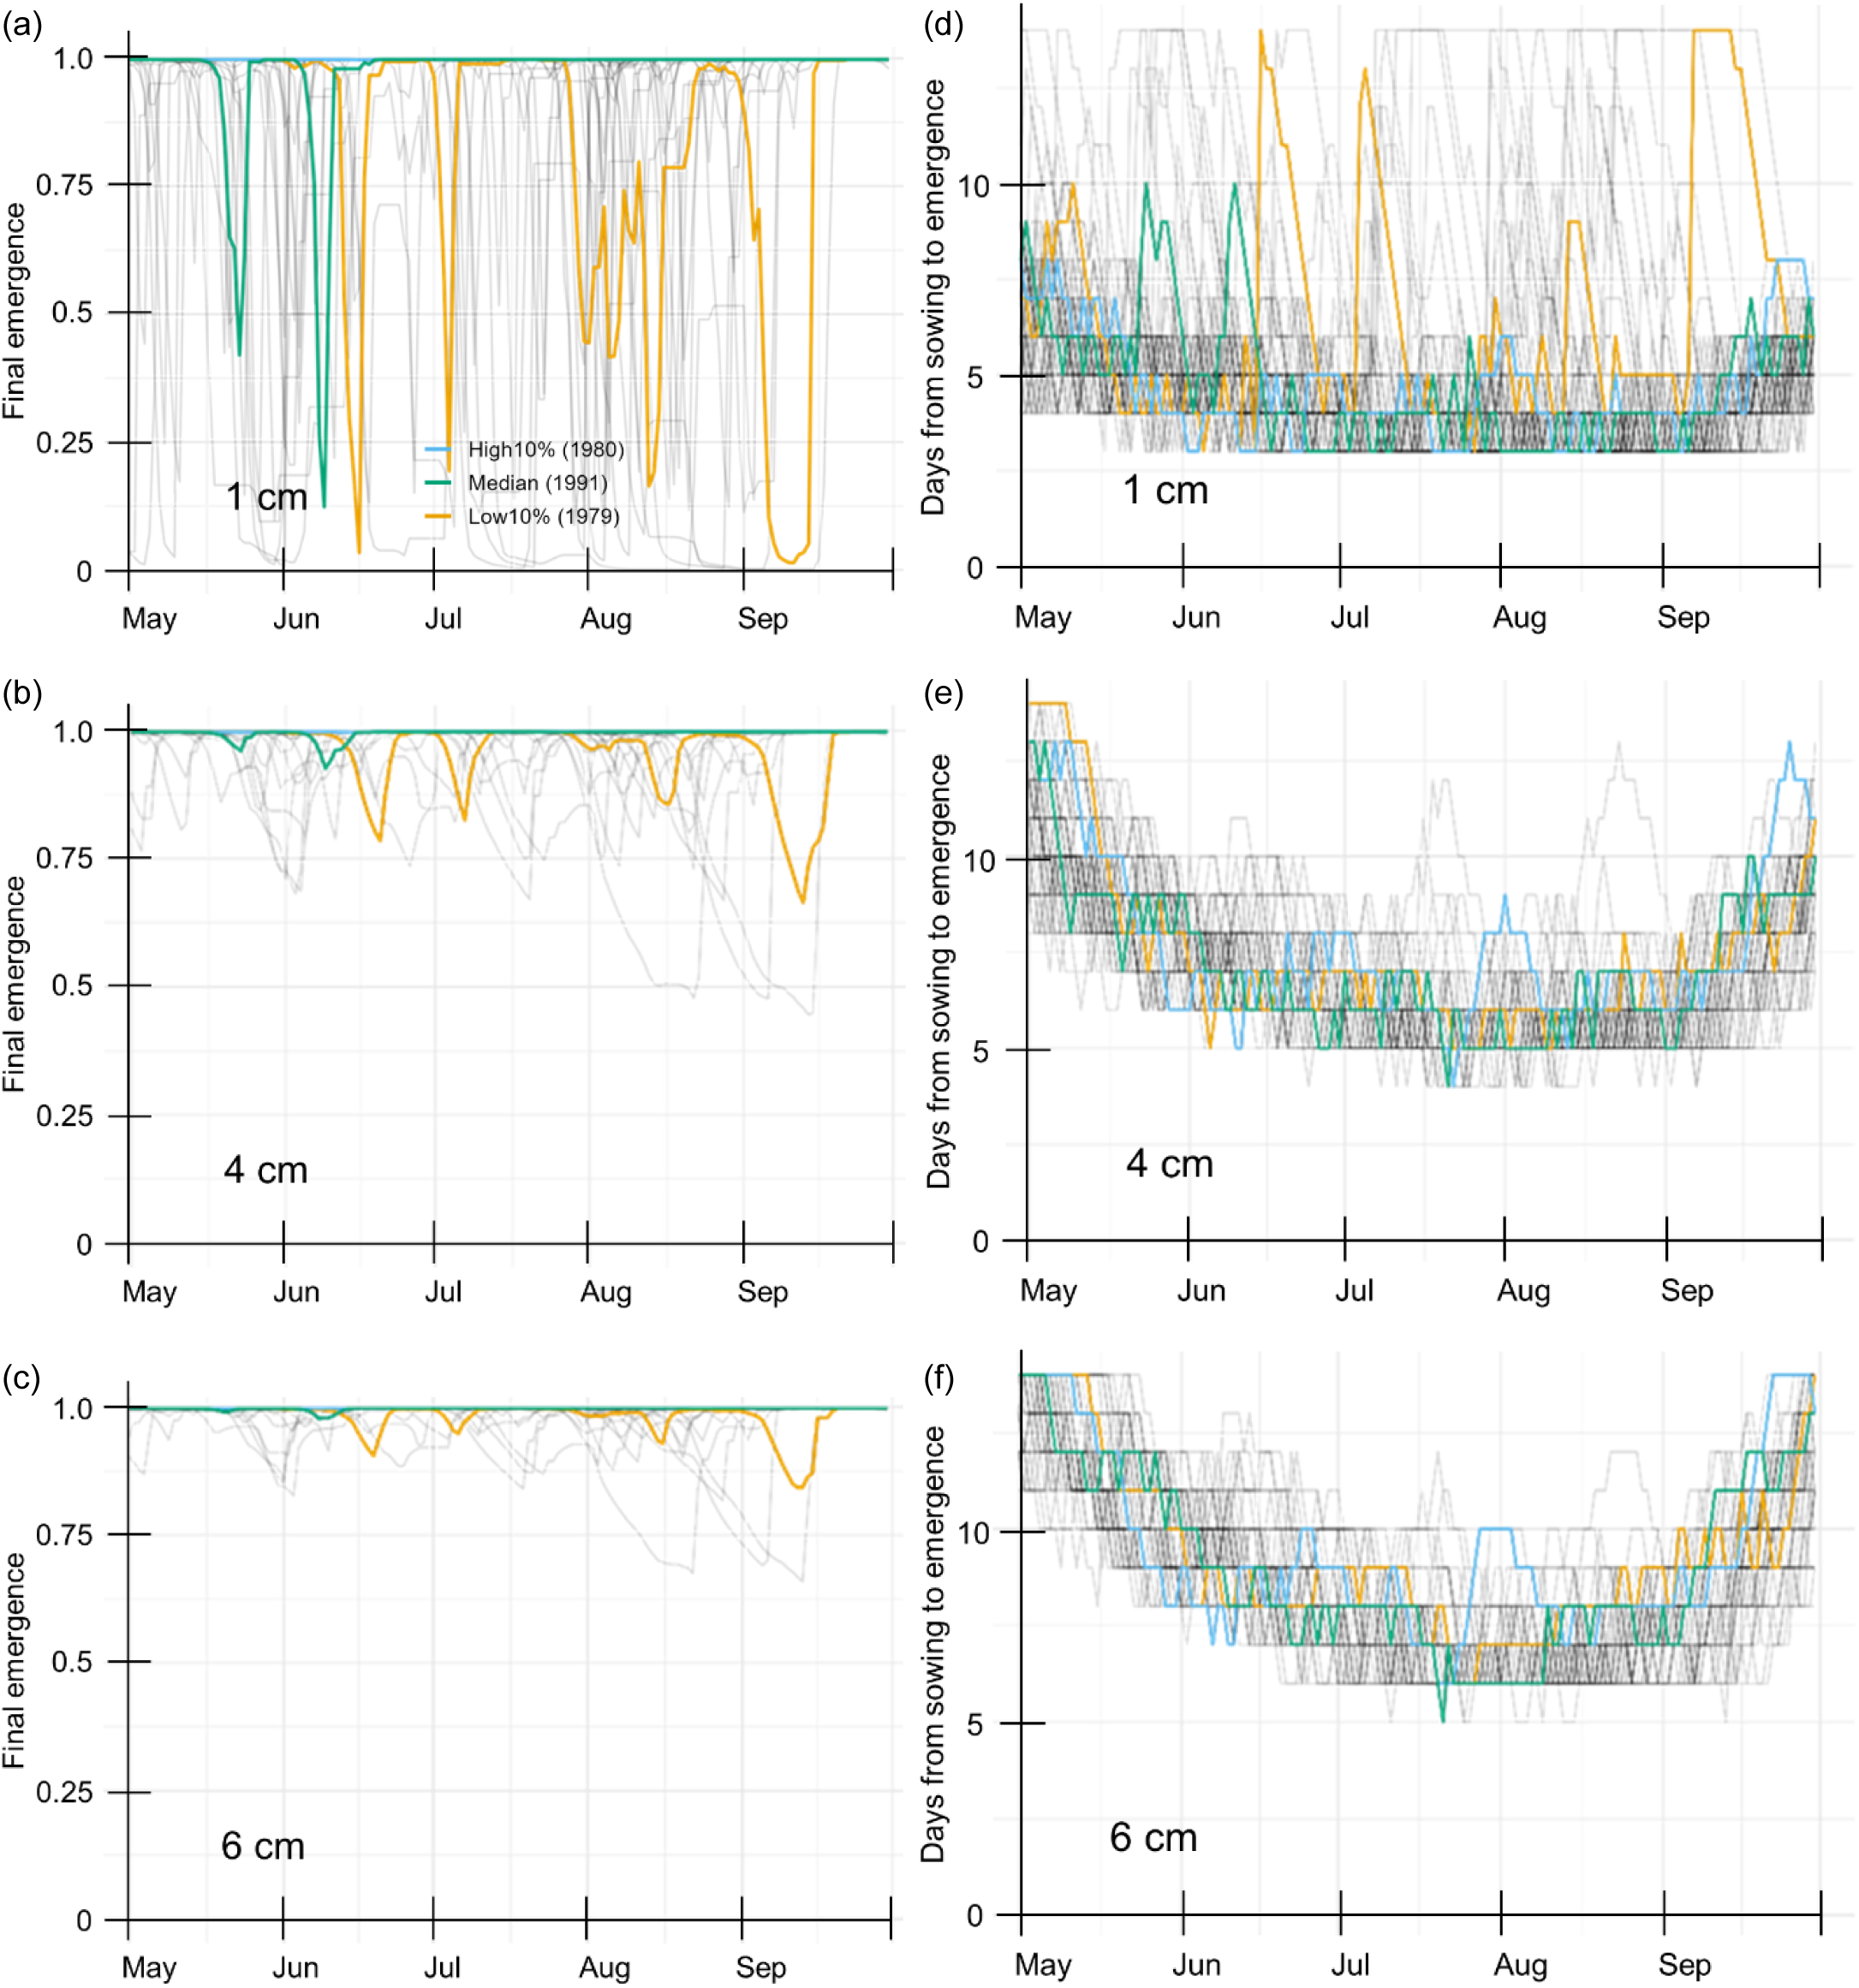
The simulated final emergence and days from sowing to emergence by the emergence models are shown in Figure 4 and Figures S3 and S4. The overall distributions showed that deeper sowing led to higher final emergence and longer emergence duration (Tables 1 and 2, Figure S5). The simulated final emergence was highest in September and lowest in August (Figure S5). This tendency was larger with shallow sowing than with deep sowing (Table 1). The simulated days from sowing to emergence, on the other hand, were shortest in July and August and longest in May. The differences between months were slightly larger with deeper sowing than with shallow sowing (Table 2). In wet years, the simulated final emergence was higher than 0.99 at all sowing depths (Figure 4). However, in dry years, final emergence with sowing at 1 cm decreased in some periods and was sometimes lower than 0.5. With deeper sowing, such low final emergence values were simulated less frequently and the decreased emergence was smaller.
Simulated (a–c) final emergence and (d–f) days to emergence over the 48-year period (1977–2024) at (a, d) 1 cm, (b, e) 4 cm and (c, f) 6 cm sowing depths. Years with the upper (high) 10th percentile (1980 as a representative for wet years), median (1991 as a representative) and the lower 10th percentile (1979 as a representative for dry years) values of mean soil water potential at 1 cm depth are highlighted.

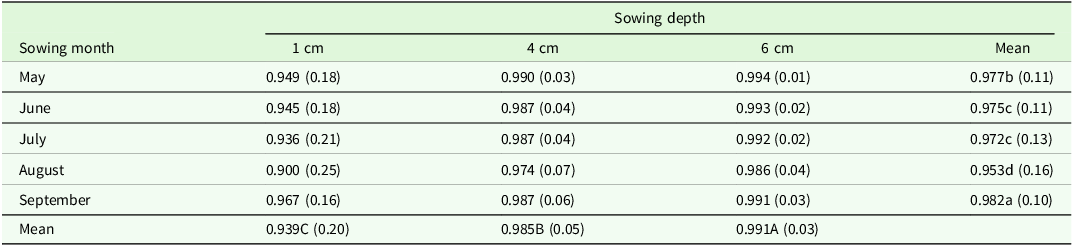
Rice final emergence (ratio of emerged plants per sown seeds) simulated with the model platform, averaged by sowing depth and sowing month

Different letters indicate significant differences at P < 0.05 in Kolmogorov–Smirnov test with Bonferroni correction.
Numbers in parentheses are standard errors.
Means and standard errors (in parentheses) of simulated days from sowing to emergence by sowing depth and sowing month
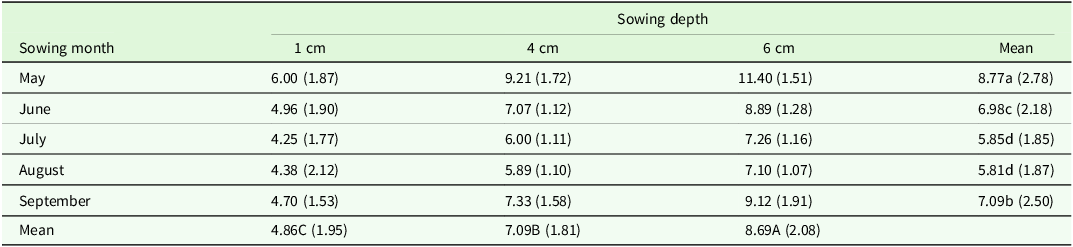
Different letters indicate significant differences at P < 0.05 in Kolmogorov–Smirnov test with Bonferroni correction.
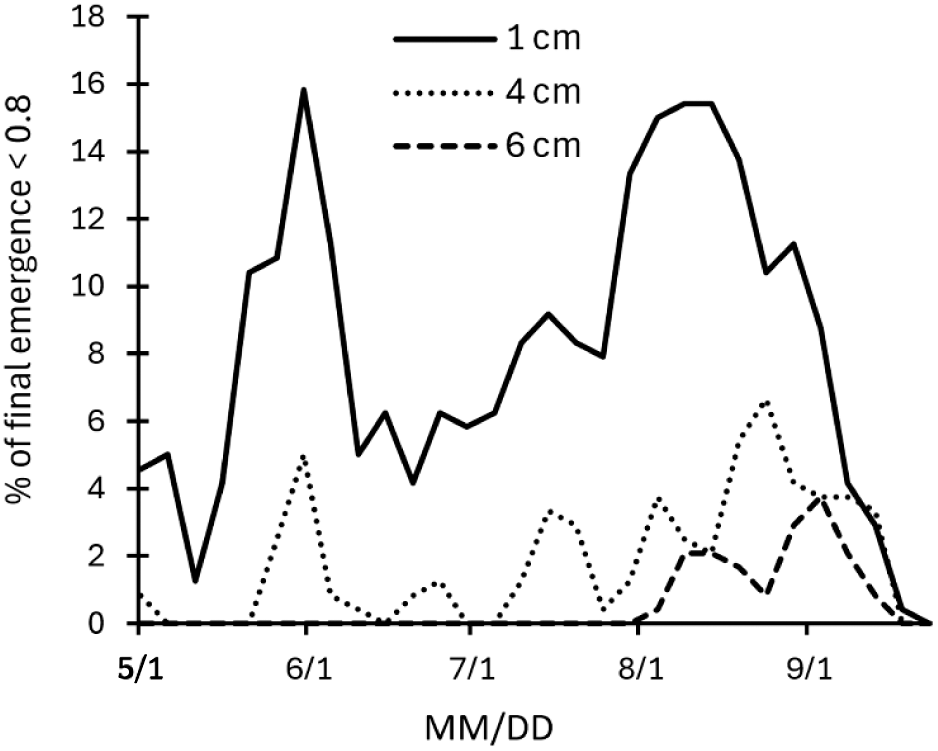
Figure 5 shows the percentage of years during the study period in which the simulated final emergence was less than 0.8 for 5-day periods during the growing season. The probability was much higher with shallow sowing than with deep sowing for most sowing dates. With sowing at 1 cm, the probability reached more than 15 % for sowing in early June and in August, but was always less than 10 % with sowing at 4 cm and less than 5 % for sowing at 6 cm. The probability averaged 7.9 % for sowing at 1 cm, 1.8 % at 4 cm and 0.5 % at 6 cm.
Probability of the simulated final emergence of <0.8 at different sowing depths (1, 4 and 6 cm) for each 5-day sowing window between May 1 and September 27 (150 days, 30 periods) over the 48-year period (1977–2024). MM/DD; Month/Day.

Discussion
Our validation of the model that predicts the final rate of emergence of sown seeds (Figure 2) suggests that the modelling accuracy was lower than those of other models for wheat, sugar beet or 20 weed species (R 2 > 0.75 or RMSE < 0.1, Benvenuti et al., Reference Benvenuti, Macchia and Miele2001; Dürr et al., Reference Dürr, Aubertot, Richard, Dubrulle, Duval and Boiffin2001; Zhao et al., Reference Zhao, Wang, Kirkegaard and Rebetzke2022). Given that the standard deviations of measured final emergence values in our study were larger than 0.2 in some treatments (data not shown), we considered the RMSE value acceptable.
The overall model successfully combined the soil model, rice final emergence model and emergence date model, allowing a scenario analysis to compare the long-term risk of poor crop establishment at different sowing depths. We used HYDRUS-1D as the soil model for its ability to simulate the current environment, which is best represented by a dual-porosity function (Kato et al., Reference Kato, Nishimura, Imoto and Miyazaki2011). This part of the model can be replaced by other soil models such as the internal soil modules of ORYZA v3 or DSSAT if their accuracy in the target environment is good enough to meet specific objectives (Li et al., Reference Li, Angeles, Marcaida, Manalo, Manalili, Radanielson and Mohanty2017; Sau et al., Reference Sau, Boote, Bostick, Jones and Mínguez2004). We defined the soil moisture input value for the final emergence model as the 6-day minimum geometric mean from sowing to emergence and the maximum period from sowing to emergence as 14 days to best represent the effects of drought on rice emergence at the environment of a target site and to meet the objective of predicting a risk of poor emergence. These values can be modified according to the characteristics of target environments and study objectives. For example, in cooler environments, the emergence of direct-seeded rice can take much longer than 14 days and still produce a good harvest (Hamasaki and Nemoto, Reference Hamasaki and Nemoto2020).
Current rice growth models such as ORYZA v3 and CERES give no or insufficient simulation on the stage from sowing to emergence (Li et al., Reference Li, Angeles, Marcaida, Manalo, Manalili, Radanielson and Mohanty2017; Singh et al., Reference Singh, Ritchie and Godwin1993). Our models can provide this simulation, since they can take daily weather data as inputs, give the final emergence and emergence date as outputs and then pass these values to the general rice growth models as inputs (Figure 1). This combination will allow seamless simulation of rice growth under dry direct seeding from sowing to maturity in a manner that’s well suited to specific conditions for rice. The combination is likely to improve the simulation accuracy of overall rice growth compared with the assumption of a perfect stand with near 100 % emergence, especially when early-season droughts or inappropriate sowing depths reduce crop establishment. The robustness and effectiveness of the combined modelling system should be tested in future studies at other sites with different environmental and soil conditions.
Although we focused on one representative environment in Japan and used only one rice cultivar, our proposed model can potentially be applied in other environments with different cultivars. Doing so would require soil models with validated parameters and further validation of the emergence models in the other environments. Similarly, further parameterization and validation would be needed to include other cultivars in the model. The final emergence of the cultivar Rc420 was not lowered by sowing at 4 or 6 cm (Table 1), since this cultivar has moderate tolerance to deep sowing (Kanno et al., Reference Kanno, Garcia, Suralta, Corales, Bueno, Banayo, Sta. Cruz, Kumar and Kato2023). If cultivars with lower tolerance were used, a depth of 4 or 6 cm could lower their final emergence, and the benefit from deep sowing would then be smaller than the results here. With proper validation and combination with suitable models of subsequent growth, our model can be used for large-scale simulation studies using GIS to assess sites in terms of their suitability for direct-seeded rice. The model can also potentially assess the effectiveness of modifying sowing depth to adapt to climate change if robust projections of future rainfall patterns are available.
The results of our scenario analysis showed that deep sowing at depths of 4 or 6 cm can reduce the risk of poor emergence relative to sowing at 1 cm at our study site (Figure 4). We attribute this to the much moister soil in deeper layers even during surface drought (Figure 3). We have previously shown that sowing at a depth of 4 to 5 cm improves final emergence and advances the emergence date under a surface drought (Kanno et al., Reference Kanno, Kumar and Kato2025, Reference Kanno, Kumar and Kato2026), and the model here extended these findings to a greater depth, to a wider range of sowing dates and to climatic data from a large number of years. Our results also show that the annual variations of surface soil moisture are huge compared with those of soil temperature, leading to large annual variations in final emergence or days from sowing to emergence, especially with shallow sowing (Figures 3 and 4). This suggests that it will be difficult for farmers to predict rice emergence in each year before sowing. The risk information provided here can support their decisions, although integration of climate forecast data with the new model should be explored in future studies to provide more specific and timely information before sowing (Ohno et al., Reference Ohno, Sasaki, Ohara and Nakazono2016; Saha et al., Reference Saha, Moorthi, Wu, Wang, Nadiga, Tripp, Behringer, Hou, Chuang, Iredell, Ek, Meng, Yang, Mendez, Van Den Dool, Zhang, Wang, Chen and Becker2014).
To provide information on the risk of crop failure in direct-seeded rice regions around the world, similar assessments should be conducted in other locations using the current model. If different cultivars or environments are involved, it will be necessary to first identify the genetic parameters of the cultivars to allow parameterization of rice emergence models. This will require germination and emergence experiments, preferably in the target environment or one with a similar soil. We plan to conduct a sensitivity analysis to identify the most important genetic parameters that should be experimentally determined. Second, soil parameters must also be determined. Here, we used soil parameters that had been directly determined from field experiments as inputs into HYDRUS-1D for both water and heat movement. However, the simulated soil temperature varied much less annually than soil moisture, suggesting that it will be less important to simulate this variable daily. In addition, soil hydraulic parameters can be estimated from a dataset of relatively few factors such as soil texture, bulk density and organic carbon content by using the pedotransfer functions that are already incorporated into HYDRUS or ORYZA v3 (Šimůnek et al., Reference Šimůnek, Genuchten and Šejna2016; Li et al., Reference Li, Angeles, Marcaida, Manalo, Manalili, Radanielson and Mohanty2017). Such a minimum set of soil parameters is available in a global database (Poggio et al., Reference Poggio, De Sousa, Batjes, Heuvelink, Kempen, Ribeiro and Rossiter2021). Lastly, daily weather data are needed as inputs and, where not available from local sources, can be acquired from global databases such as NASA POWER (https://power.larc.nasa.gov/data-access-viewer/) or CHIRPS (https://www.chc.ucsb.edu/data/chirps). These soil or weather databases will allow easier application of the current model to wider environments, although the prediction accuracy should be tested before large-scale application. However, it should be noted that our model does not simulate the effect of submergence on rice emergence. Since the soil in this study is silty loam, we have not encountered prolonged waterlogging events on unpuddled soils. On heavy clay soils or where the groundwater table is shallow, subsurface soil may keep submerged by extreme rainfall. In such a situation, ‘anaerobic germination tolerance (Kretzschmar et al., Reference Kretzschmar, Pelayo, Trijatmiko, Gabunada, Alam, Jimenez, Mendioro, Slamet-Loedin, Sreenivasulu, Bailey-Serres, Ismail, Mackill and Septiningsih2015)’ may also play a pivotal role in rice emergence under deep sowing, which awaits future investigation.
Conclusions
We developed a novel process-based model to predict final emergence and days from sowing to emergence for dry direct-seeded rice using daily weather data and sowing depth as inputs. We achieved this by combining the HYDRUS soil model, a rice final emergence model and a rice emergence date model. The framework effectively simulated germination and emergence, thereby revealing that deep sowing at 4 or 6 cm can reduce the risk of poor crop establishment caused by surface drought compared with sowing at 1 cm in the long run. Although its applicability to other cultivars or environments must still be tested, our model is a promising tool to assess the risk of crop failure of direct-seeded rice in drought-prone environments and to fill the gap in simulations from sowing to emergence in existing rice growth models to improve simulation of direct-seeded rice.
Supplementary material
The supplementary material for this article can be found at https://doi.org/10.1017/S0021859626100677.
Acknowledgements
We are grateful to Professor Taku Nishimura (Graduate School of Agricultural and Life Sciences, the University of Tokyo) for his advice on soil simulations. We thank R. Soga, H. Teshima and K. Ichikawa (Institute for Sustainable Agro-ecosystem Services, the University of Tokyo) for their technical assistance.
Author contributions
NK and YK conceived and designed the study. NK conducted data gathering, modelling and simulation. NK, AR, TL, VK and YK wrote and revised the article. All the authors read and approved the final manuscript.
Funding statement
This work was supported in part by the Japan Society for the Promotion of Science (JSPS) via Grant-in-Aid for Scientific Research (no. 22KK0083) and Grand-in-Aid for JSPS Fellows (no. 24KJ0619).
Competing interests
The authors declare that they have no known competing financial interests or personal relationships that could have appeared to influence the work reported in this paper.


 Open access