





Danish Lay Summary
I denne undersøgelse har vi set på, hvordan personer kommer tilbage i arbejde eller uddannelse, efter de er startet i medicinsk behandling for skizofreni. Formålet er at forstå, om antipsykotisk medicin øger eller mindsker deres mulighed for at vende tilbage til arbejde eller uddannelse. Resultaterne peger på et udviklingsforløb, som kan forklares i tre faser:
-
• De første 2 år har en person i medicinsk behandling 9% lavere sandsynlighed for at være i arbejde eller uddannelse, sammenlignet med perioder hvor personen er uden behandling.
-
• Efter 2–5 år bliver forskellen mindre (omkring 5%). Medicinen forsinker stadig tilbagevenden til arbejdsmarkedet eller uddannelse, men i mindre grad end før.
-
• Efter 5–10 år vender billedet. Her ses en tendens til, at flere som får medicinsk behandling er i arbejde eller uddannelse. Effekten er lille, men den går i en positiv retning.
På kort sigt kan antipsykotisk medicin begrænse muligheden for arbejde eller uddannelse. På længere sigt kan medicinen give den stabilitet, der gør det lettere at fastholde eller vende tilbage til arbejde eller uddannelse.
Introduction
Schizophrenia spectrum disorders (SSDs) profoundly disrupt employment and social functioning. Despite antipsychotic medications being effective for symptom control, only 32.5% of individuals with first-episode psychosis maintain competitive employment (i.e. open-market paid work or formal education) long-term (Ajnakina et al., Reference Ajnakina, Stubbs, Francis, Gaughran, David, Murray and Lally2021), though rates vary considerably across countries and healthcare systems, from below 10% to over 30% depending on welfare context and labor market structure (Holm et al., Reference Holm, Taipale, Tanskanen, Tiihonen and Mittendorfer-Rutz2021; Marwaha & Johnson, Reference Marwaha and Johnson2004). Current guidelines recommend continuous maintenance antipsychotic therapy based on strong evidence that discontinuation increases relapse risk (Keepers et al., Reference Keepers, Fochtmann, Anzia, Benjamin, Lyness, Mojtabai and Hong2020; Leucht et al., Reference Leucht, Tardy, Komossa, Heres, Kissling, Salanti and Davis2012). However, this recommendation prioritizes symptomatic stability over functional outcomes, and clinicians must weigh relapse prevention against potential adverse effects that could impair work capacity (Cornblatt et al., Reference Cornblatt, Carrion, Addington, Seidman, Walker, Cannon and Lencz2011). Recent trials suggest dose reduction strategies may yield comparable or superior long-term functional outcomes despite higher initial relapse rates (Moncrieff et al., Reference Moncrieff, Crellin, Stansfeld, Cooper, Marston, Freemantle and Jha2023; Wunderink et al., Reference Wunderink, Nieboer, Wiersma, Sytema and Nienhuis2013).
This study builds on Stürup et al. (Reference Stürup, Nordentoft, Jimenez-Solem, Osler, Davy, Christensen and Hjorthøj2023), who examined antipsychotic patterns and employment outcomes in first-episode schizophrenia using discrete exposure windows (years 2–5) and outcomes at year 6. Stürup et al. (Reference Stürup, Nordentoft, Jimenez-Solem, Osler, Davy, Christensen and Hjorthøj2023) found that individuals who discontinued antipsychotics had higher odds of employment compared with continuous users. We extend this work using a rigorous methodological triangulation approach. We contrast a within-subject design (which controls for all time-invariant genetics and history) against a standard between-subject competing risks analysis. This dual approach enables us to test whether findings from standard observational models hold up when strictly controlling for unmeasured confounding factors, such as illness severity and premorbid cognitive capacity, which are typically prevalent in psychiatric epidemiology.
Methods
Study design and setting
A protocol with a statistical analysis plan was uploaded to medRxiv on October 2, 2025 (Twumasi et al., Reference Twumasi, Lange, Hjorthøj, Howes, Gronemann, Nordentoft and Osler2025). Exploratory analysis and preprocessing were carried out before protocol posting. All inferential statistics and survival analysis were completed after the preregistration was accepted on October 3, 2025. Our only departure from the protocol was the decision to include all individuals rather than restrict to 18+. This was decided because the result of productive engagement encompasses both employment and education, making the age restriction to 18+ unnecessary and potentially biasing against cases onset in adolescents.
We conducted a nationwide, register-based cohort study using a within-subject design in Denmark. Denmark’s tax-funded welfare system ensures universal healthcare access and broad social support, with active labor market policies providing subsidized vocational training (Pedersen et al., Reference Pedersen, Olsen, Vernal, Rydborg, Gasse and Mors2025) and workplace accommodations for individuals with mental health conditions. The Danish Civil Registration System assigns a unique personal identification number (CPR number) to every resident, enabling unambiguous individual-level linkage across all national registers with complete follow-up and no possibility of opting out (Nordfalk & Hoeyer, Reference Nordfalk and Hoeyer2017), thereby limiting selection bias.
Data sources
Data were drawn from multiple validated national registers. The Danish National Patient Register (Lynge et al., Reference Lynge, Sandegaard and Rebolj2011; Plana-Ripoll et al., Reference Plana-Ripoll, Liu, Köhler-Forsberg, Sørensen and Momen2025) was used to identify the study cohort and all psychiatric diagnoses. Antipsychotic medication use was ascertained from the Danish National Prescription Register (NPR) (Pottegård et al., Reference Pottegård, Schmidt, Wallach-Kildemoes, Sørensen, Hallas and Schmidt2017), which contains detailed records of all prescriptions dispensed from community pharmacies since 1995. For the period from 2018 onwards, NPR data were supplemented with data from the Danish National Hospital Medicine Register (Sygehusmedicinregisteret, SMR) (Andersen et al., Reference Andersen, Jensen and Petersen2024), which records medications administered during hospital stays. Information on labor market status was obtained from the Danish Register for Evaluation and Marginalization (DREAM) ( Hjollund et al., Reference Hjollund, Larsen and Andersen2007), which contains weekly data on all public transfer payments (e.g. sickness benefits, unemployment benefits, and disability pension). The DREAM register’s unique weekly granularity in capturing benefit receipt, combined with Denmark’s comprehensive national health registers and universal Central Person Register (CPR) number linkage system, creates a unique opportunity to examine the longitudinal association between medication patterns and labor market outcomes in schizophrenia spectrum disorders.
Data availability and guidelines
This study used Danish register data provided by Statistics Denmark. Access to data can be granted for approved research projects. All microdata were handled according to guidelines to prevent identification, including rounding counts. No additional data are publicly available.
Study population
The source population included all individuals residing in Denmark who received a first-time diagnosis of a nonaffective psychotic disorder (ICD-10 codes F20-F29). The date of the first registered F20-F29 diagnosis was defined as the cohort entry date.
To ensure complete temporal alignment between medication exposure and employment data, we restricted the cohort to individuals with index diagnosis dates between January 1, 1998, and December 31, 2023, reflecting the period for which relevant DREAM labor market affiliation data were available for this project.
Individuals were excluded if they died or emigrated within 2 years of cohort entry. This 2-year exclusion filter removed 1,000 patients (1.52% of the cohort). Community pharmacy records (NPR) do not capture medications administered during inpatient stays, or free medication offered to patients with recent onset schizophrenia (Jensen et al. Reference Jensen, Andersen, Jimenez-Solem and Lund2020), which could lead to exposure misclassification bias in our main sample. Therefore, a further subgroup analysis on SMR data, which includes the first 2 years of prescriptions for members of the cohort first diagnosed after 2018, was completed.
Study variables
Antipsychotic exposure
The primary exposure was antipsychotic medication use, modeled as a time-varying variable. For the period 1998–2017, exposure was based on filled prescriptions in the NPR (ATC code N05A, excluding lithium N05AN01). For the 2018–2023 sensitivity analysis, exposure was based on an integrated record of NPR prescriptions and SMR in-hospital prescriptions (Andersen et al., Reference Andersen, Jensen and Petersen2024).
We calculated medication exposure duration for each prescription using Tiihonen’s methodology (Tiihonen et al., Reference Tiihonen, Haukka, Taylor, Haddad, Patel and Korhonen2011), adapted from the original protocol used in the nationwide Finnish schizophrenia cohort study. This approach models individual prescription coverage periods based on package characteristics and Defined Daily Doses (DDDs) from the World Health Organization ATC/DDD Index 2025 (WHO, 2025).
For each prescription, exposure duration in days was calculated as:

where Volume denotes the number of packages dispensed, Unitspackage denotes the discrete count of dosage units (e.g. tablets) per package as recorded in the prescription register variable strnum, and tablets per DDD denotes the number of units required to achieve one Defined Daily Dose as specified by the WHO ATC/DDD Index. The 1.15 multiplier accounts for dosing variability and patient stockpiling behavior (Tiihonen et al., Reference Tiihonen, Haukka, Taylor, Haddad, Patel and Korhonen2011). Grace periods differed by formulation: 14 days for oral medications and 28 days for long-acting injectable (LAI) depot formulations, reflecting typical administration intervals. Calculated durations were capped at 7–180 days per prescription to exclude implausible values.
Person-weeks were classified as AP use if they fell within an active prescription coverage period, and no AP use otherwise. This duration-based approach provides more accurate exposure estimation than simple unit-counting methods, particularly for LAI formulations where package size does not reflect duration of action.
Antipsychotics were further categorized by generation: first-generation (typical) antipsychotics included ATC codes N05AA, N05AB, N05AC, N05AD, N05AF, and N05AG; second-generation (atypical) antipsychotics included N05AE, N05AH, N05AL, and N05AX. Clozapine (N05AH02) was analyzed separately, given its unique indication for treatment-resistant schizophrenia. LAI formulations were identified through product name keyword matching.
When multiple medications were dispensed concurrently within a person-week, classification prioritized clozapine, followed by LAI, then oral antipsychotics. This hierarchy reflects clinical severity: clozapine is reserved for treatment-resistant disease, LAIs are typically prescribed for patients with adherence difficulties, and oral antipsychotics represent first-line treatment. Polypharmacy was defined as concurrent use of both a first-generation and a second-generation antipsychotic within the same person-week, representing cross-class combination therapy that may indicate greater treatment complexity or illness severity. Medication switching was defined as any transition between exposed and unexposed states during follow-up, with individuals contributing person-time to both states classified as switchers.
Hospital medication data integration
For the subcohort diagnosed from 2018 onwards (N = 14,190, 30% of the total cohort), we integrated hospital pharmacy records from the SMR (Andersen et al., Reference Andersen, Jensen and Petersen2024) to eliminate exposure misclassification bias in the early post-diagnosis period. SMR data contained 1,218,821 antipsychotic prescriptions (ATC code N05A minus lithium). The SMR contained true dose strength data (99.99% complete), enabling more accurate DDD calculations using the following equation:

where the grace period = 14 days (oral) or 28 days (LAI).
Outcome measures
The primary outcome was ‘productive engagement’, a time-varying binary variable at the person-week level indicating whether an individual was engaged in competitive employment, formal education, or a vocational training program. The operationalization was based on a hierarchical classification of weekly labor market affiliation, with specific codes from the DREAM used to define each state (see Supplementary Table 1 for full details).
Covariates
The within-subject design controlled for all time-invariant confounders. The analysis adjusted for two key time-varying covariates that were updated at each person-week observation: age and recent hospital discharge. Finally, a baseline time-invariant covariate, gender (legal sex represented by CPR number), was also included in all models. Time-varying covariate adjustment was implemented using the counting process formulation of Cox proportional hazards regression models (in the following termed ‘Cox models’) within a person-week panel data structure. Each individual contributed multiple observations (one per week of follow-up), with covariate values updated at each time point. The models used within-person stratification, which conditions on the individual-level baseline hazards and effectively controls for all time-invariant unmeasured confounders (equivalent to a fixed-effects approach).
Statistical analysis
We employed methodological triangulation (Lawlor et al., Reference Lawlor, Tilling and Davey Smith2017) using multiple analytical approaches with different assumptions to allow us to attempt to understand potential associations beyond what a single method could offer. This strategy addresses the fundamental challenge that all observational pharmacoepidemiologic analyses are vulnerable to unmeasured confounding, with different methods susceptible to different biases. By examining whether associations persist across methods with non-overlapping assumptions. Our triangulation strategy combined: (1) within-subject stratified Cox models controlling for time-invariant confounding through self-comparison, (2) time-stratified analyses characterizing temporal heterogeneity in medication effects, (3) lagged exposure analyses addressing reverse causation and delayed effects, and (4) Fine–Gray competing risks models (Fine & Gray, Reference Fine and Gray1999) accounting for mortality and emigration as competing events.
Primary analysis: Within-subject stratified Cox models
The primary analysis was restricted to 50,440 individuals who contributed person-time to at least two different antipsychotic exposure categories (i.e. ‘switchers’), enabling within-subject comparisons. We used stratified Cox models to estimate hazard ratios (HRs) and 95% confidence intervals (CIs) for the association between changes in antipsychotic exposure status and productive engagement transitions. In this model, each individual serves as their own control, comparing rates of productive engagement during medication-exposed versus unexposed weeks within the same person. This design eliminates confounding from all time-invariant factors, including genetics, childhood adversity, baseline cognitive ability, and premorbid functioning.
This within-subject design requires patients to have variation in medication status during follow-up; 15,190 individuals (23.14%) with invariant medication patterns were excluded from Cox models but retained for descriptive analyses. Nonswitchers could represent clinically distinct subgroups (severe treatment-adherent patients versus treatment-refusing individuals), with exclusion potentially limiting generalizability to patients with stable medication patterns.
Time-stratified analysis
The proportional hazards assumption underlying Cox models requires that hazard ratios remain constant over follow-up time. We assessed this assumption using Schoenfeld (Reference Schoenfeld1982) residual tests for all models. In register-based studies of this magnitude, Schoenfeld tests typically reject the null hypothesis of proportional hazards even with minor deviations, due to the substantial statistical power afforded by large sample sizes. We therefore treated statistically significant violations as an indication of potentially meaningful temporal heterogeneity warranting further investigation through time-stratified analyses, rather than as evidence that Cox models are fundamentally unsuitable.
We computed time-stratified Cox models as the analytical approach when PH violations were detected. The 10-year follow-up was divided into three clinically meaningful periods from the first diagnosis date (index date): 0–2 years (acute/early recovery phase), 2–5 years (consolidation phase), and 5+ years (long-term maintenance phase). Separate Cox models were fitted within each stratum, allowing hazard ratios to vary across periods while maintaining within-person control for time-invariant confounding. This approach provides period-specific effect estimates characterizing how medication-employment associations evolve across the recovery trajectory.
Secondary analysis: Fine–Gray competing risks (between-subject)
To provide a prognostic benchmark comparable to standard observational literature, we employed Fine–Gray subdistribution hazard models (Austin & Fine, Reference Austin and Fine2017; Fine & Gray, Reference Fine and Gray1999). Critically, unlike the primary within-subject Cox models, the Fine–Gray analysis was a between-subject design using baseline exposure (medication status at first diagnosis) and baseline covariates (age, gender), treating death and emigration as competing events that preclude productive engagement. This model estimates the cumulative probability of employment for the full cohort (N = 65,630) but does not control for unmeasured time-invariant confounding or treatment switching; these are vulnerabilities that the within-subject Cox model design eliminates. We interpreted discrepancies between these models through the lens of causal hierarchy: the within-subject Cox model was prioritized for etiological inference due to its superior control for unmeasured confounding, while the Fine–Gray model served as a ‘real-world’ prognostic reference reflecting the combined impact of treatment assignment, adherence patterns, and selection bias inherent in standard population comparisons. Importantly, subdistribution hazard ratios from the Fine–Gray model do not possess a simple rate-ratio interpretation analogous to cause-specific hazard ratios (Andersen et al., Reference Andersen, Geskus, Witte and Putter2012); they reflect the relative ordering of cumulative incidence curves rather than a traditional epidemiological rate.
Sensitivity analyses
For the 2018+ subcohort with hospital pharmacy data availability (N = 14,190), we compared employment outcomes under three medication exposure definitions: (1) community pharmacy only, (2) hospital pharmacy only, and (3) combined community and hospital coverage. This quantifies exposure misclassification bias magnitude from incomplete medication ascertainment during hospitalization periods when community pharmacy records underestimate treatment intensity.
We examined effect heterogeneity across 8 dimensions (27 strata total): gender, age at diagnosis, geographic region, diagnosis subtype, medication adherence, hospitalization type (inpatient/outpatient/emergency), and SMR data availability (pre-2018 vs 2018+).
Model specifications
Six Cox models were fitted to examine different aspects of antipsychotic medication effects on productive engagement. Models 1 and 2 constituted the primary analyses; Models 3–6 were prespecified exploratory analyses. Model 1 examined any antipsychotic use versus no use, adjusting for age, recent hospital discharge, and gender. Model 2 assessed antipsychotic polypharmacy versus monotherapy or no treatment, with the same covariate adjustment. Model 3 evaluated a four-level medication-type classification (No AP, Clozapine, LAI, and Oral AP) incorporating time-varying covariates for age and recent discharge status. Model 4 tested a dose – response relationship using total exposure days (0–7 days per week) restricted to person-weeks with antipsychotic use. Model 5 attempted to fit a time-varying coefficient model (Therneau et al., Reference Therneau, Crowson and Atkinson2017), allowing the effect of antipsychotic use to vary with log-transformed follow-up time; this model failed to converge due to the scale of the dataset. We therefore fitted an interaction model testing whether medication effects differed during the acute post-discharge period versus stable community residence.
To examine delayed medication effects and address potential reverse causation, we conducted lagged exposure analyses with 6-, 12-, and 24-month delays between exposure measurement and outcome assessment. By allowing time between exposure and outcome windows, these analyses reduce the risk that employment status influences medication adherence rather than vice versa, while testing the hypothesis that medication effects on employment emerge gradually over extended treatment periods.
The secondary Fine–Gray analysis (described above) estimated subdistribution hazard ratios (SHRs) for comparison with the primary within-subject Cox models.
To characterize treatment complexity, we mapped all medication switches using Sankey flow diagrams, identifying transitions between medication types (first-generation only, second-generation only, clozapine, polypharmacy, and no AP use).
Multiple testing correction
(Benjamini & Hochberg, Reference Benjamini and Hochberg1995) false discovery rate correction at the 5% threshold was applied to exploratory subgroup and sensitivity analyses examining effect heterogeneity across clinical and demographic strata.
Software
Data preparation was carried out in SAS (version 9.4) and Stata (version 18). Analysis was carried out using R version 4.5.1, with packages survival (Therneau, Reference Therneau2024), survminer (Kassambara et al., Reference Kassambara, Kosinski and Biecek2021), on secure Statistics Denmark servers.
Ethics
The study was approved by the Regional Data Protection Agency (P-2020-88). The authors assert that all procedures contributing to this work comply with the ethical standards of the relevant national and institutional committees on human experimentation and with the Helsinki Declaration of 1975, as revised in 2008.
Results
Study cohort and follow-up
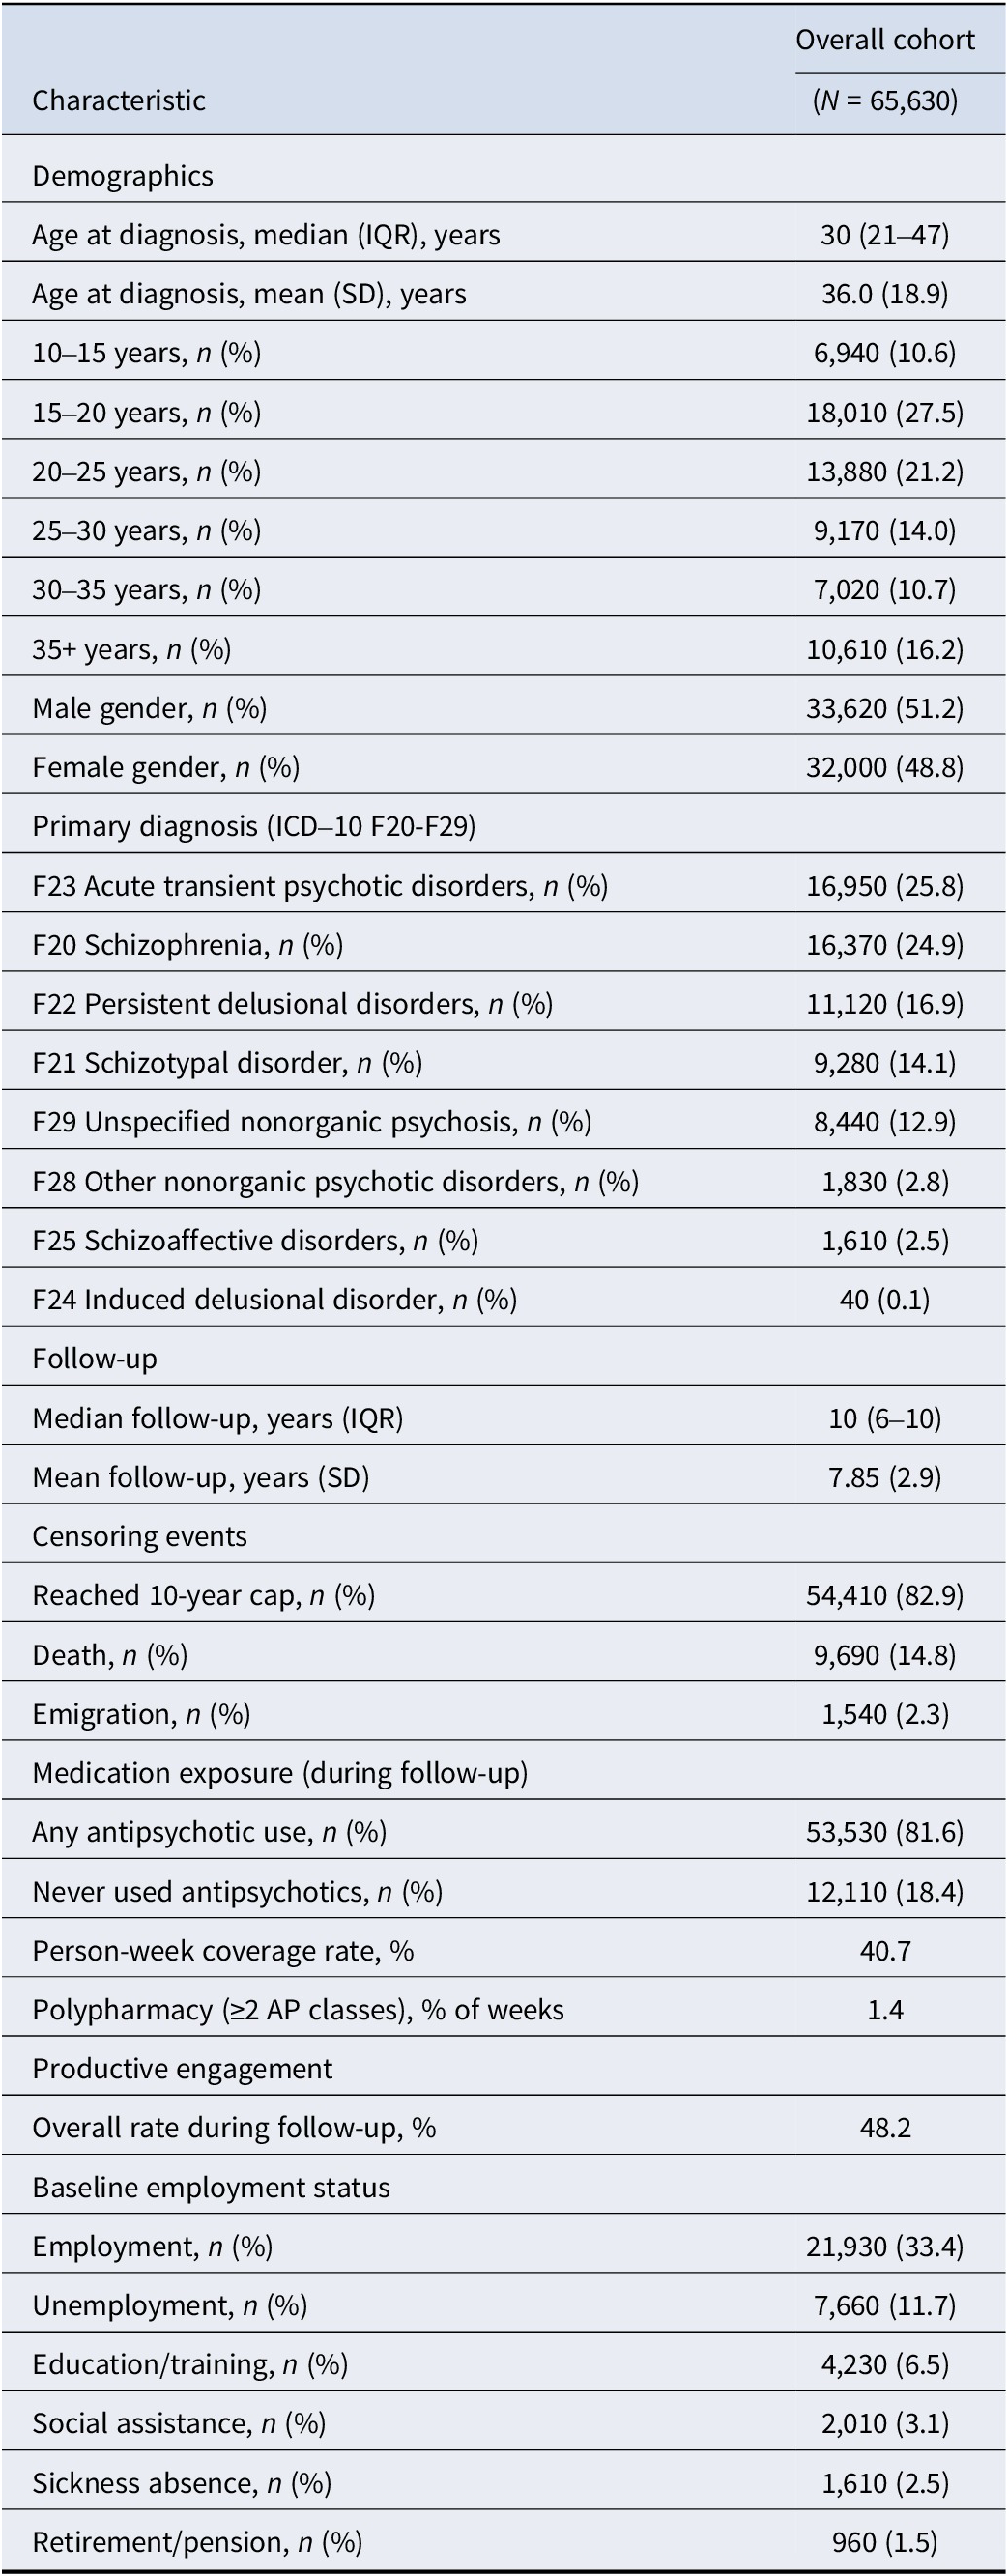
The final analytic cohort comprised 65,630 individuals with incident schizophrenia spectrum disorders, contributing 26.9 million person-weeks of observation over a maximum analytical follow-up of 10 years (median 10.00 years, IQR: 6–10 years). By design, all estimates are representative of individuals who survived and did not emigrate during the first 2 years following diagnosis. Baseline characteristics are described in Table 1. The cohort was predominantly male (51.2%), with a median age of 30 years at first diagnosis. Notably, 82.9% reached the maximum 10-year follow-up, 81.6% received at least one antipsychotic prescription during follow-up, and 76.9% (n = 50,440) were classified as medication switchers eligible for within-subject Cox models.
Baseline employment status at diagnosis (33.4% employed), while the 48.2% productive engagement rate represents the longitudinal proportion across all person-weeks during follow-up, reflecting cumulative engagement over time rather than point prevalence at cohort entry

Table 1. Long description
From the top, the table lists characteristics for the overall cohort of 65,630. Demographics: median age at diagnosis is 30 years (I Q R 21 to 47), mean 36.0 years (S D 18.9). Age groups: 10 to 15 years 6,940 (10.6 percent), 15 to 20 years 18,010 (27.5 percent), 20 to 25 years 13,880 (21.2 percent), 25 to 30 years 9,170 (14.0 percent), 30 to 35 years 7,020 (10.7 percent), 35 plus years 10,610 (16.2 percent). Gender: male 33,620 (51.2 percent), female 32,000 (48.8 percent). Primary diagnosis: F23 acute transient psychotic disorders 16,950 (25.8 percent), F20 schizophrenia 16,370 (24.9 percent), F22 persistent delusional disorders 11,120 (16.9 percent), F21 schizotypal disorder 9,280 (14.1 percent), F29 unspecified nonorganic psychosis 8,440 (12.9 percent), F28 other nonorganic psychotic disorders 1,830 (2.8 percent), F25 schizoaffective disorders 1,610 (2.5 percent), F24 induced delusional disorder 40 (0.1 percent). Follow-up: median 10 years (I Q R 6 to 10), mean 7.85 years (S D 2.9). Censoring events: reached 10-year cap 54,410 (82.9 percent), death 9,690 (14.8 percent), emigration 1,540 (2.3 percent). Medication exposure: any antipsychotic use 53,530 (81.6 percent), never used antipsychotics 12,110 (18.4 percent), person-week coverage rate 40.7 percent, polypharmacy at least 2 antipsychotic classes 1.4 percent of weeks. Productive engagement: overall rate during follow-up 48.2 percent. Baseline employment status: employment 21,930 (33.4 percent), unemployment 7,660 (11.7 percent), education or training 4,230 (6.5 percent), social assistance 2,010 (3.1 percent), sickness absence 1,610 (2.5 percent), retirement or pension 960 (1.5 percent).
Censoring flow patterns are visualized in Supplementary Figure 1.
Primary analysis (within-subject Cox models)
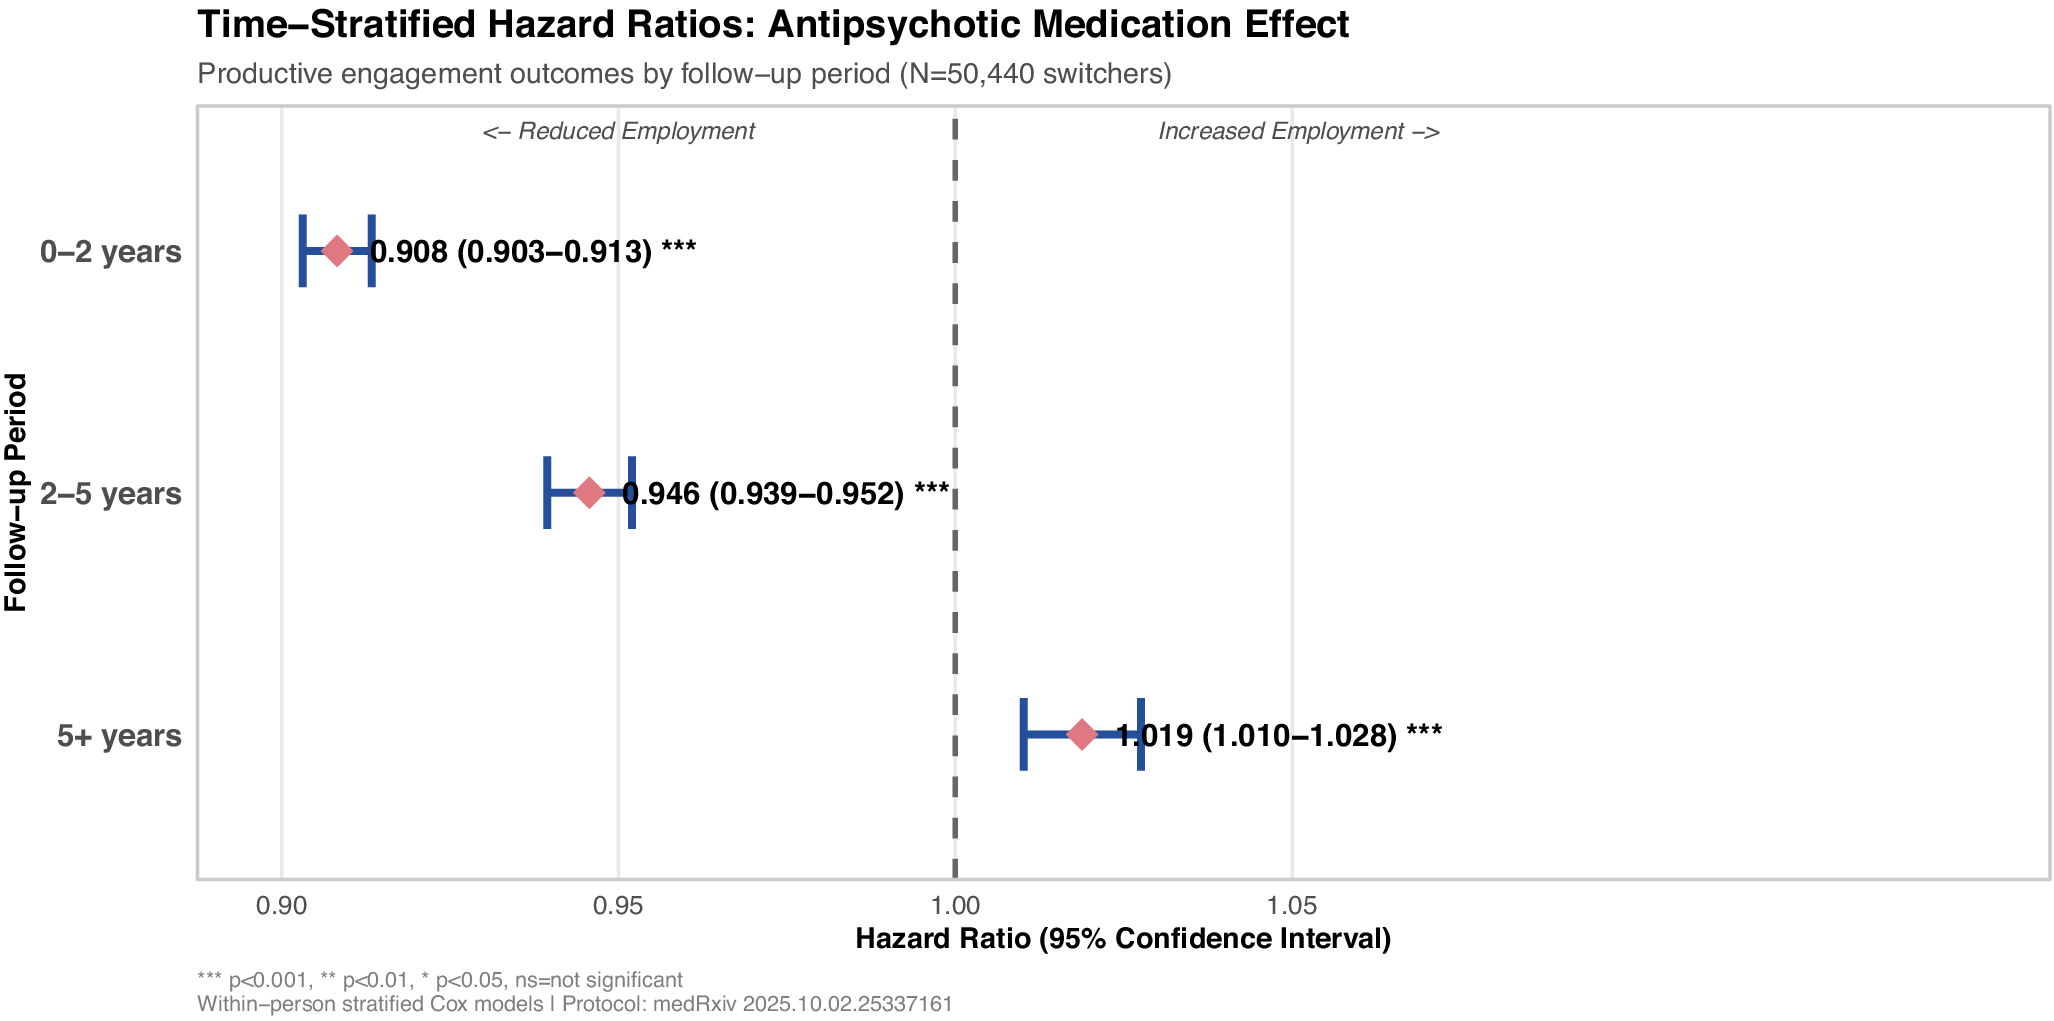
Time-stratified within-subject Cox models revealed distinct phase-specific effects on productive engagement (Figure 3). Schoenfeld residual tests indicated proportional hazards violations across all models (all p < 0.001), confirming temporal heterogeneity that warranted period-specific estimation.
In the acute phase (0–2 years, 3.1 million person-week events), antipsychotic use was associated with a 9% reduction in the rate of productive engagement (HR = 0.908, 95% CI: 0.903–0.913). This negative association persisted but attenuated during the consolidation phase (2–5 years, 3.5 million events: HR = 0.946, 95% CI: 0.939–0.952). Crucially, in the long-term maintenance phase (5+ years, 3.2 million events), the direction of effect reversed, with medication showing a modest positive association with employment (HR = 1.019, 95% CI: 1.010–1.028).
These within-subject estimates compare medication-exposed versus unexposed person-weeks within the same individual, thereby controlling for all time-invariant confounders, including genetics, premorbid functioning, and baseline illness severity. The J-shaped pattern: early negative associations reversing to late positive associations, represents the principal within-subject finding of this study.
Secondary analysis (Fine–Gray competing risks)
The between-subject Fine–Gray analysis, using baseline medication exposure (at first diagnosis) and adjusting only for age and gender, yielded a null result (SHR = 1.002, 95% CI: 0.988–1.015). This suggests that, when viewing the population as static groups defined at diagnosis, the ‘treated’ and ‘untreated’ cohorts achieved similar cumulative productive engagement probabilities (Andersen et al., Reference Andersen, Geskus, Witte and Putter2012).
However, given the minimal covariate adjustment compared to the within-subject Cox models, this null finding likely reflects the cancellation of opposing forces: the drug’s stage-specific pharmacological effects masked by confounding by indication, where more severely ill patients are selectively prescribed antipsychotics. Over a 10-year follow-up, 38,160 individuals (69.1%) achieved productive engagement at least once, 11,730 (21.2%) remained alive but never engaged, and 550 (1.0%) experienced competing events (death or emigration).
The divergence between the within-subject Cox findings (which revealed phase-specific HRs ranging from 0.908 to 1.019) and the Fine–Gray result (SHR = 1.002) should be interpreted cautiously, as these models estimate fundamentally different quantities (Andersen et al., Reference Andersen, Geskus, Witte and Putter2012): the Cox model yields cause-specific rate ratios among those at risk, whereas the subdistribution hazard ratio reflects the ordering of cumulative incidence curves and lacks a simple rate-ratio interpretation. Nonetheless, the contrast underscores that between-subject comparisons using baseline exposure cannot resolve the stage-specific dynamics that emerge from within-subject longitudinal designs.
Exploratory subgroup analyses
The following exploratory analyses further characterize temporal patterns; these patterns should be interpreted as hypothesis-generating.
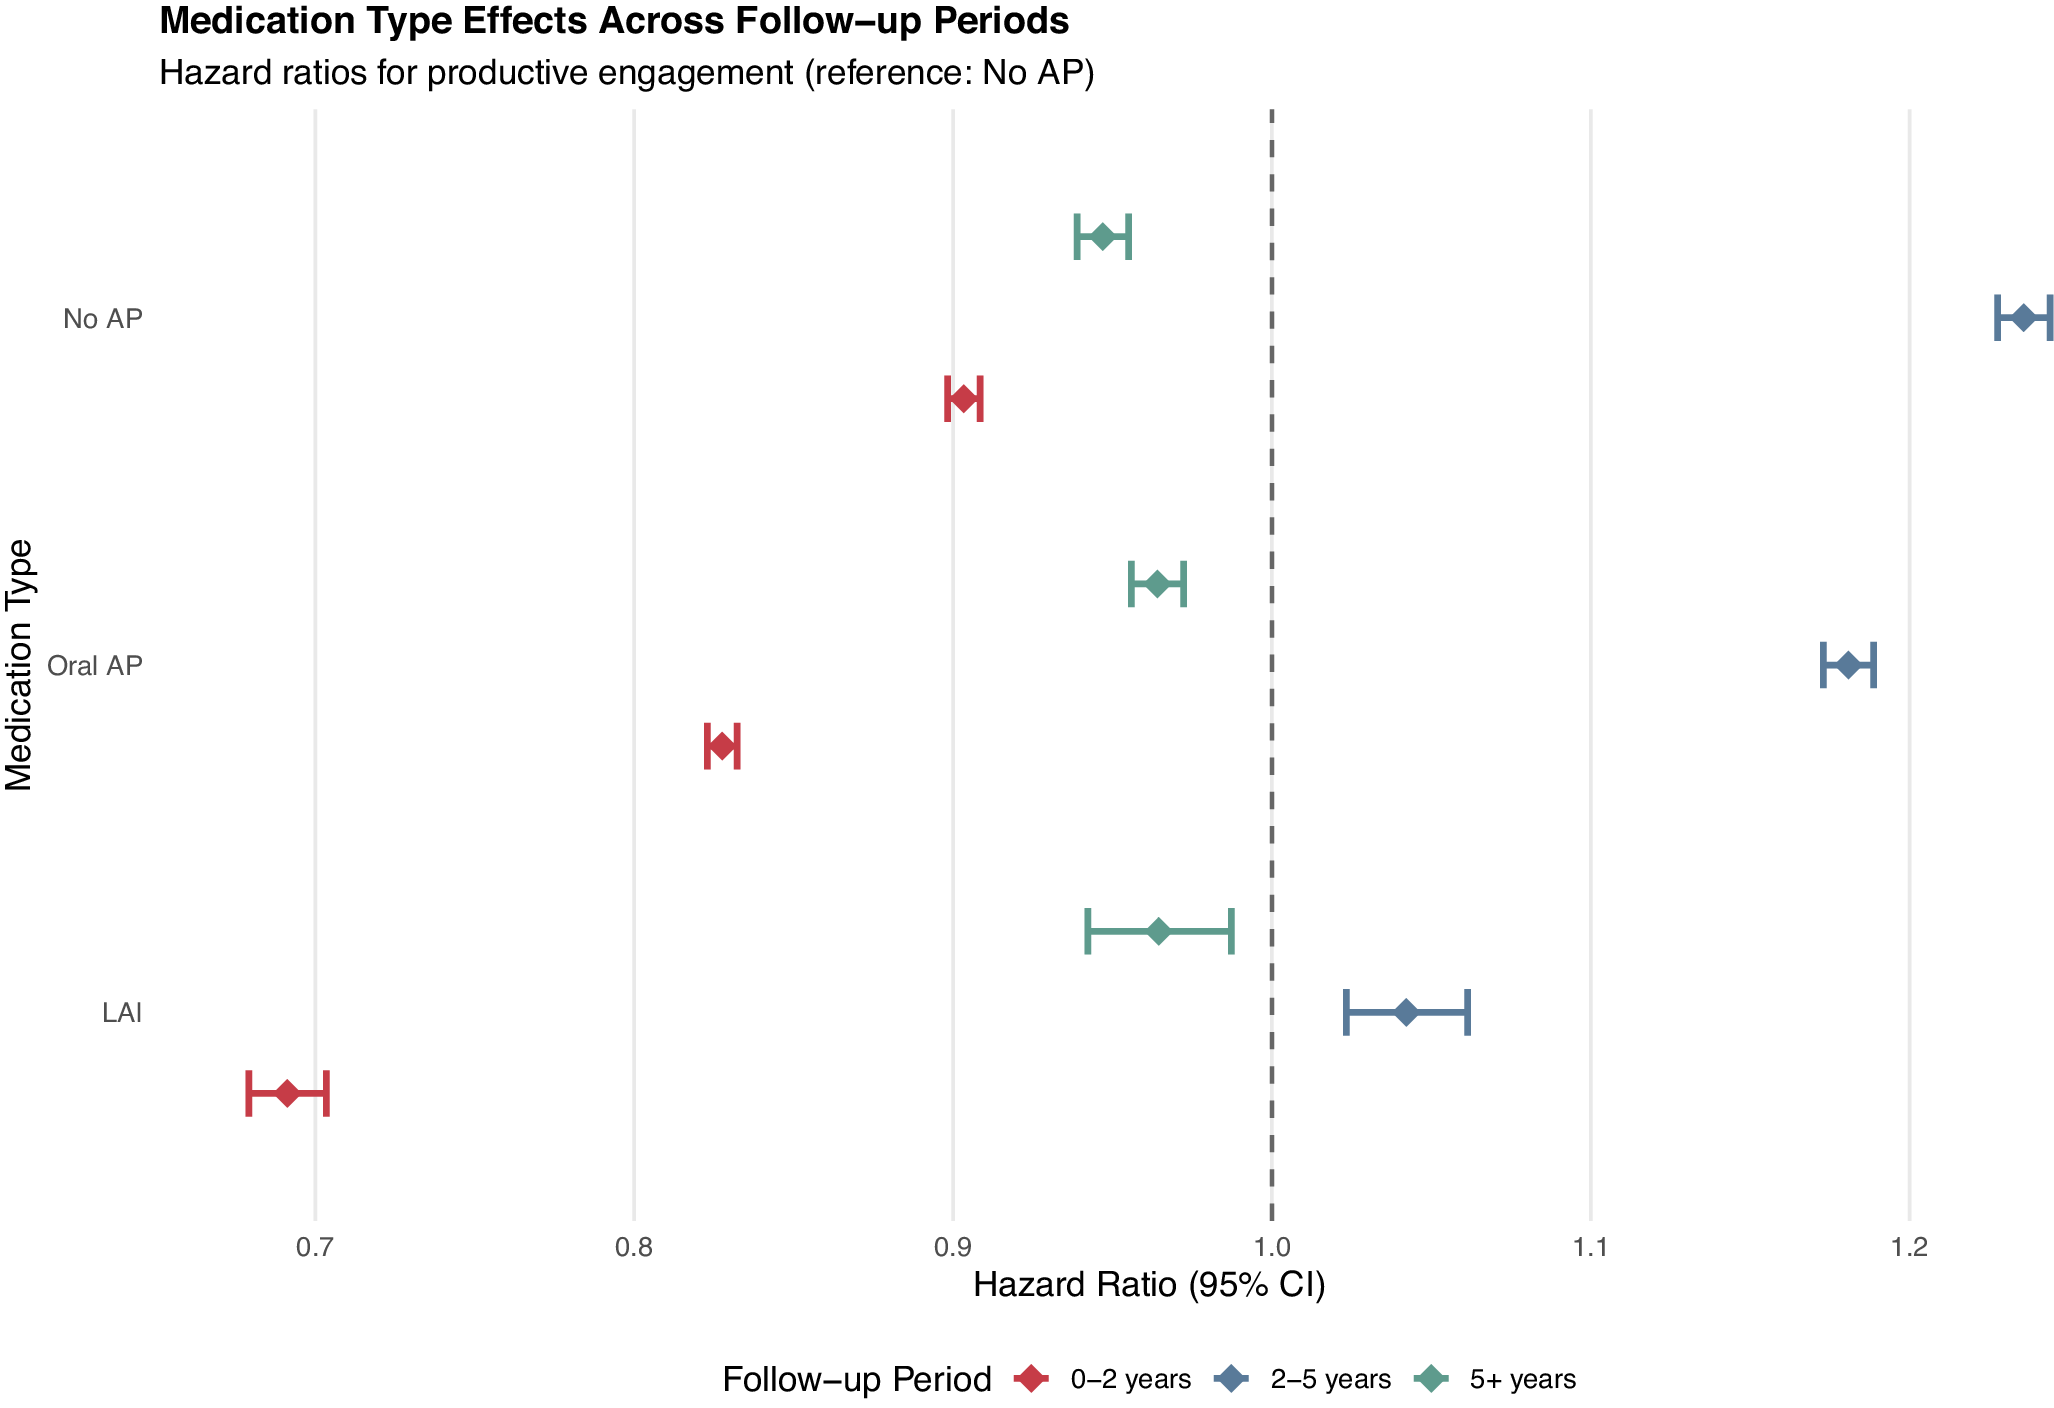
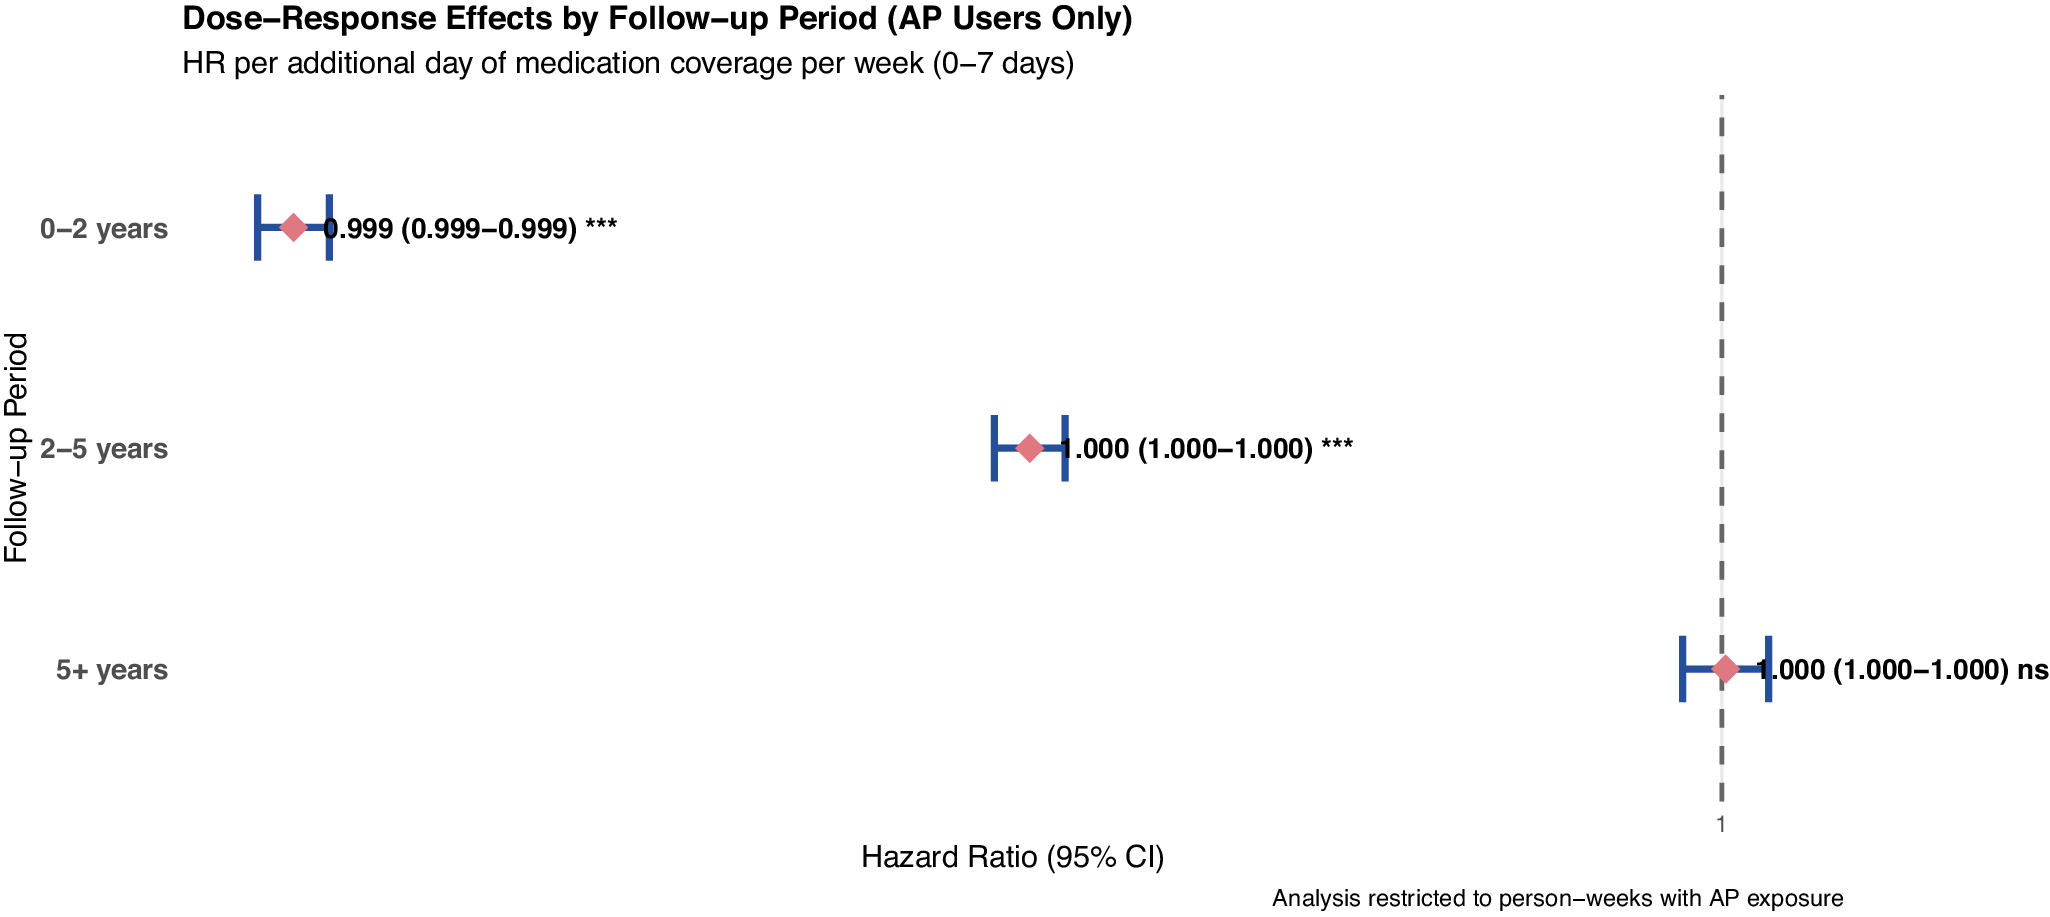
Cox model results are presented across four forest plots: Figure 1 (medication types by period), Figure 2 (dose – response), Figure 3 (time-stratified overall effects), and Figure 4 (lagged exposure). Each forest plot displays hazard ratios with 95% confidence intervals, with the vertical dashed line at HR = 1.0 indicating no effect.
Medication type effects vary dramatically across follow-up periods (within-subject analysis). Hazard ratios from within-person stratified Cox models comparing medication-exposed versus unexposed person-weeks within the same individual.

Figure 1. Long description
The plot has medication type on the y-axis with three categories from top to bottom: No A P, Oral A P, L A I. The x-axis is hazard ratio, labeled Hazard Ratio 95 percent confidence interval, ranging from 0.7 to 1.2, with a dashed vertical line at 1.0. Each medication type has three colored error bars representing follow-up periods: red for 0 to 2 years, blue for 2 to 5 years, green for 5 plus years. For No A P, the red bar is centered at about 0.9, blue at about 1.15, green at about 1.05. For Oral A P, red is at about 0.85, blue at about 1.05, green at about 0.95. For L A I, red is at about 0.72, blue at about 0.92, green at about 0.87. Error bars indicate 95 percent confidence intervals. The lowest hazard ratios are seen for L A I in the 0 to 2 year period, while the highest are for No A P in the 2 to 5 year period. The legend at the bottom identifies colors for each follow-up period.
Dose – response analysis reveals minimal incremental effects of medication coverage intensity.

Figure 2. Long description
The horizontal line graph plots hazard ratio with 95 percent confidence intervals for three follow-up periods. At the top, 0 to 2 years shows a hazard ratio of 0.999 with confidence interval 0.999 to 0.999, marked with three asterisks. The middle, 2 to 5 years, shows a hazard ratio of 1.000 with confidence interval 1.000 to 1.000, also with three asterisks. At the bottom, 5 plus years, the hazard ratio is 1.000 with confidence interval 1.000 to 1.000, labeled as not significant. All points are close to the vertical dashed line at hazard ratio one. The x axis is labeled hazard ratio, 95 percent confidence interval. The y axis is labeled follow-up period. The analysis is restricted to person-weeks with A P exposure.
Time-stratified hazard ratios reveal temporal heterogeneity (within-subject stratified analysis). Each patient serves as their own control, eliminating time-invariant confounding.

Figure 3. Long description
The graph has follow-up period on the y-axis with three intervals: 0 to 2 years at the top, 2 to 5 years in the middle, and 5 plus years at the bottom. The x-axis is labeled hazard ratio (95 percent confidence interval), ranging from 0.90 to 1.05, with a vertical dashed line at 1.00 dividing reduced employment (left) from increased employment (right). For 0 to 2 years, a blue horizontal error bar is centered at 0.908 with a confidence interval from 0.903 to 0.913, marked with three asterisks. For 2 to 5 years, the error bar is centered at 0.946 with a confidence interval from 0.939 to 0.952, also with three asterisks. For 5 plus years, the error bar is centered at 1.019 with a confidence interval from 1.010 to 1.028, again with three asterisks. All points are shown as pink diamonds. Statistical significance is indicated by asterisks, with three asterisks denoting p less than 0.001. The legend at the bottom clarifies significance levels. The title states time-stratified hazard ratios for antipsychotic medication effect, and the subtitle notes productive engagement outcomes by follow-up period for 50,440 switchers. The analysis uses within-person stratified Cox models.
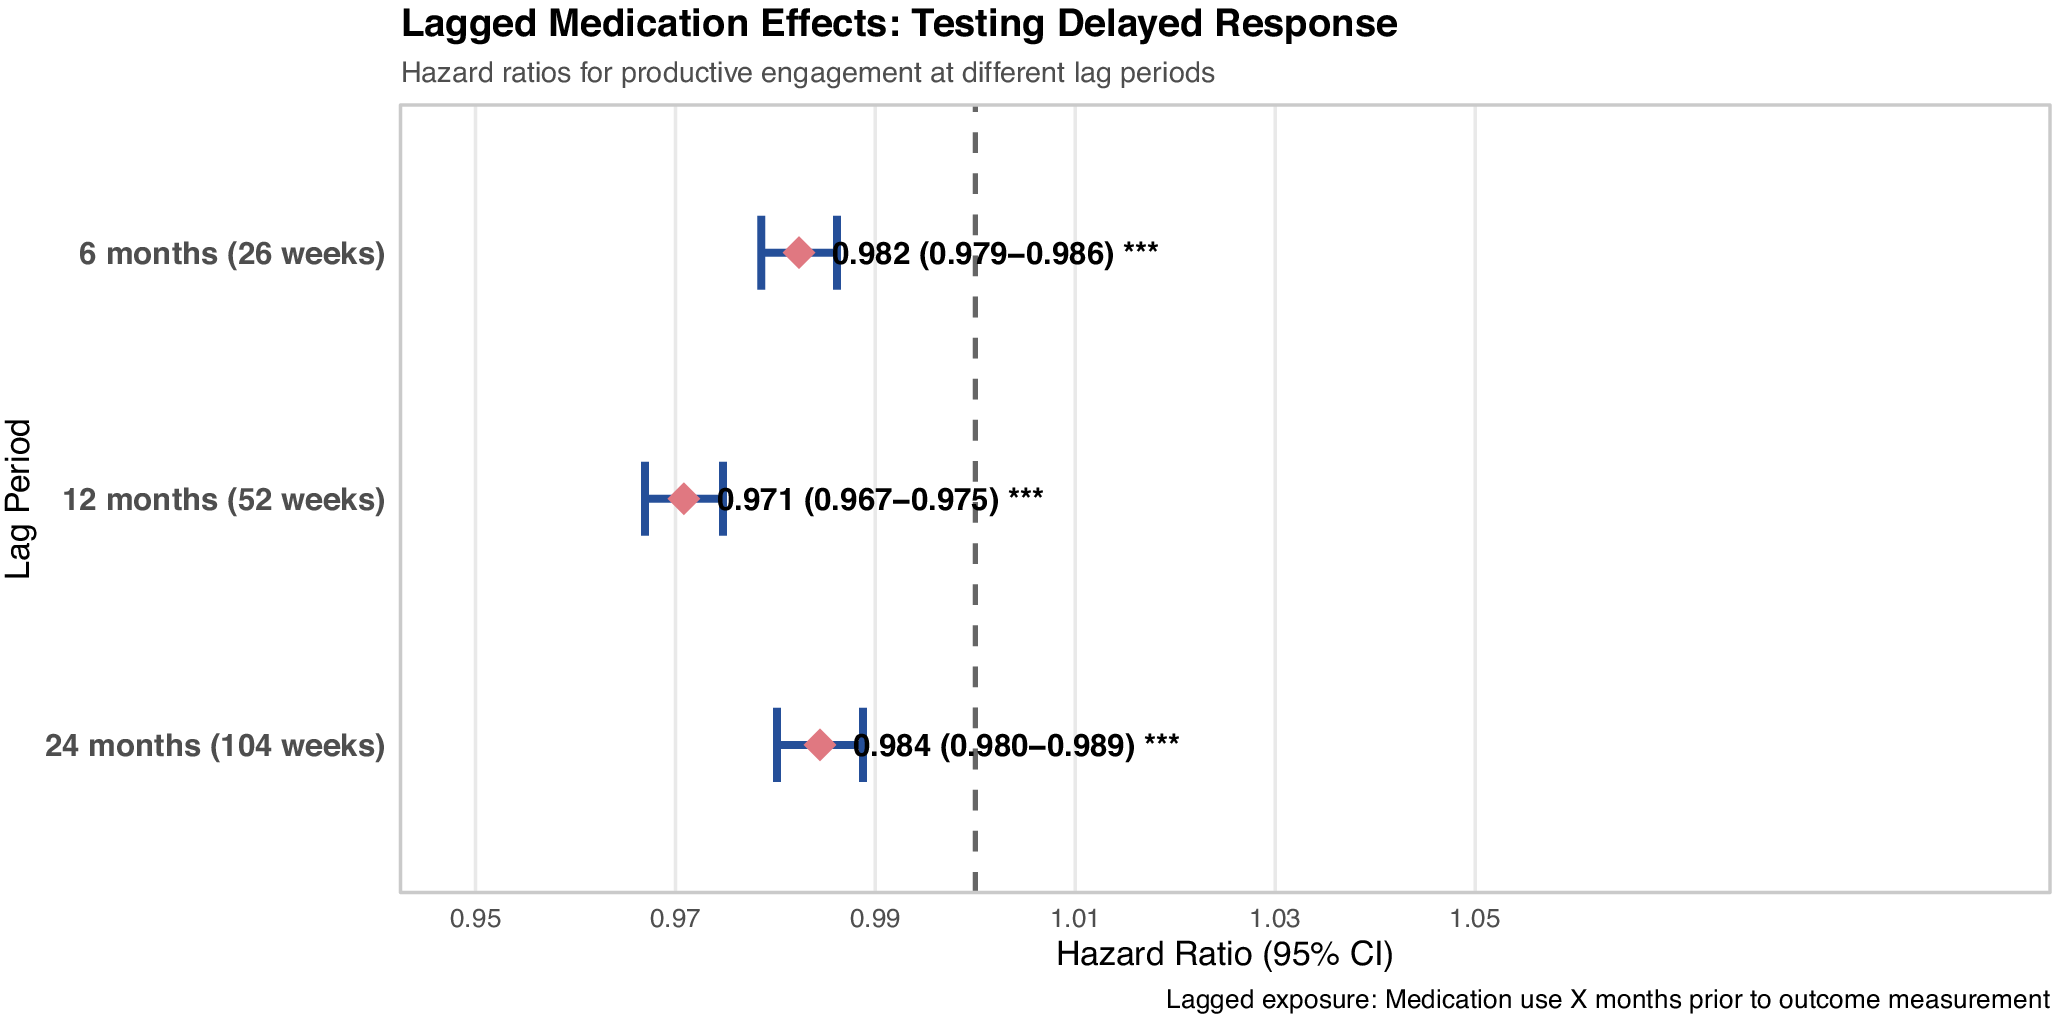
Lagged exposure analysis reveals persistent negative associations (within-subject analysis). Negative associations persist across 6-, 12-, and 24-month lag periods, suggesting findings are not fully explained by reverse causation.

Figure 4. Long description
The plot displays three horizontal error bars aligned vertically by lag period. At the top, 6 months (26 weeks) shows a hazard ratio of 0.982 with a 95 percent confidence interval from 0.979 to 0.986, marked with three asterisks. In the middle, 12 months (52 weeks) shows a hazard ratio of 0.971 with a 95 percent confidence interval from 0.967 to 0.975, also with three asterisks. At the bottom, 24 months (104 weeks) shows a hazard ratio of 0.984 with a 95 percent confidence interval from 0.980 to 0.989, again with three asterisks. All error bars are positioned to the left of the vertical dashed line at hazard ratio one, indicating persistent negative associations across all lag periods. The x axis is labeled Hazard Ratio (95 percent C I) and ranges from 0.95 to 1.05. The y axis is labeled Lag Period and lists the three time points. A note at the bottom right explains that lagged exposure refers to medication use x months prior to outcome measurement.
Medication-type effects exhibited temporal heterogeneity (Figure 1). During the acute phase (0–2 years), long-acting injectables showed the strongest negative associations (LAI: HR = 0.691, 95% CI: 0.679–0.705), while clozapine (HR = 0.903, 95% CI: 0.880–0.927) and oral antipsychotics (HR = 0.828, 95% CI: 0.823–0.832) showed intermediate effects. All three medication types reversed to positive associations during consolidation (2–5 years), with clozapine showing the strongest positive association (HR = 1.236, 95% CI: 1.210–1.261). The late phase (5+ years) showed a second reversal to modest negative associations across all formulations (HRs = 0.947–0.964).
Dose–response analyses among person-weeks with antipsychotic exposure revealed essentially null findings across all temporal periods (Figure 2). Hazard ratios per additional day of weekly coverage ranged from 0.989 to 1.000 across periods (95% CIs extremely tight due to sample sizes exceeding 2–4 million person-weeks per period), with no clinically meaningful dose–response gradient. The absence of dose–response effects suggests that medication presence matters more than coverage intensity for employment outcomes, consistent with threshold effects rather than linear dose–response relationships. Note that these dose – response analyses were restricted to person-weeks with antipsychotic exposure, examining intensity effects within treated periods; this does not contradict differential effects between medication categories or between exposed versus unexposed states observed in time-stratified models.
Medication exposure patterns
Using Tiihonen methodology, antipsychotic coverage was observed in 40.65% of all person-weeks, with second-generation agents predominating (32.41%).
Sensitivity analysis 1: Lagged exposure effects
Lagged exposure analyses testing temporal delays between medication exposure and employment outcomes revealed consistent negative associations across all delay periods, though with temporal attenuation, suggesting medication – employment relationships evolve with treatment duration (Figure 4). At a 6-month lag (13.9 million person-weeks), medication exposure 6 months prior associated with modest reduced engagement (HR = 0.982, 95% CI: 0.979–0.986). The 12-month lag demonstrated the weakest association (HR = 0.971, 95% CI: 0.967–0.975). At a 24-month lag, the association remained negative but attenuated to the 6-month level (HR = 0.984, 95% CI: 0.980–0.989, 16.0 million person-weeks).
The weakest association at a 12-month lag aligns with time-stratified findings that medication-employment associations attenuate gradually over the 2–5 year consolidation period. The persistence of negative associations across all lag periods argues against reverse causation (unemployment triggering medication initiation) and is consistent with delayed medication effects that attenuate gradually as functional recovery trajectories unfold.
SMR hospital medication integration: Quantifying exposure misclassification bias
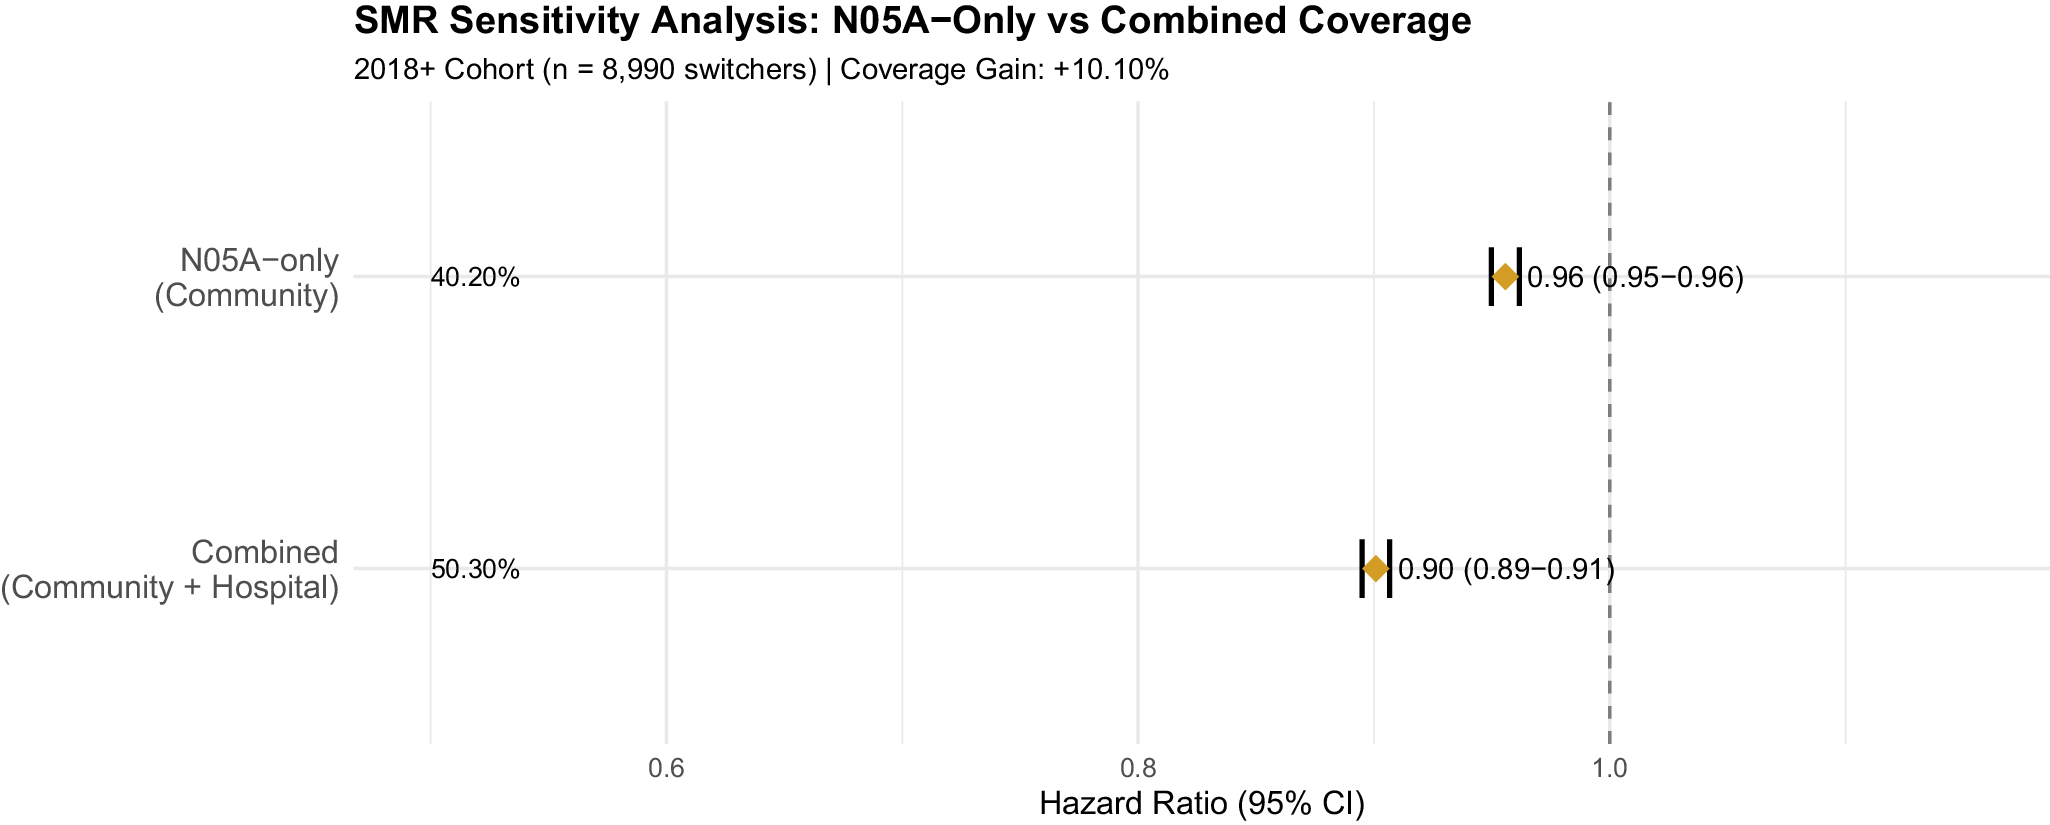
For the 2018+ subcohort with hospital pharmacy data availability (N = 14,190), integration of Sygehusmedicinregisteret (SMR) records with community prescriptions substantially reduced exposure misclassification bias. Community pharmacy coverage alone captured 26.69% of person-weeks (1,173,836 weeks), while SMR hospital pharmacy captured an additional 14.94% (657,012 weeks). Combined community and SMR coverage reached 33.25% (1,465,012 weeks), yielding an absolute coverage gain of 6.56% (291,176 person-weeks) and a relative increase of 24.6%. Notably, 291,176 weeks (44.3% of SMR coverage, 6.56% of all 2018+ person-weeks) had SMR-only coverage with no concurrent community dispensing, representing medication exposure periods that would have been misclassified as unexposed under community pharmacy data alone, particularly during early post-diagnosis hospitalization periods.
Cox models comparing exposure definitions quantified the resulting bias. Community-only methodology yielded HR = 0.96 (95% CI: 0.95–0.96), while combined community and SMR methodology strengthened the association to HR = 0.90 (95% CI: 0.89–0.91), demonstrating 6.09% exposure misclassification bias (HR ratio: 0.96/0.90 = 1.067). Relying solely on community pharmacy records systematically underestimates medication-employment associations by failing to capture hospital-administered medications during acute treatment episodes. SMR integration eliminates this bias for the 2018+ cohort, providing complete medication ascertainment across hospital and community settings (Figure 5).
SMR hospital medication integration reveals 6.09% exposure misclassification bias.

Figure 5. Long description
At the top, the Competing Risks panel shows a single red horizontal error bar for AP Use (Fine–Gray), centered near 1.00 on the x-axis, with wide confidence intervals. In the middle, the Lagged Effects panel displays three blue horizontal error bars for 6 months, 12 months, and 24 months, all clustered left of 1.00, with overlapping confidence intervals. At the bottom, the Time-Stratified panel presents three green horizontal error bars for 0–2 years, 2–5 years, and 5+ years. The 0–2 years and 2–5 years intervals are left of 1.00, while the 5+ years interval is centered at 1.00. The x-axis is labeled Hazard Ratio / Subdistribution Hazard Ratio (95 percent C I), ranging from 0.90 to 1.00. A vertical dashed line marks the null value at 1.00. All error bars represent 95 percent confidence intervals. The sample size is N equals 50,440 switchers.
This bias is particularly relevant for the early post-diagnosis period when hospitalization rates are highest. For pharmacoepidemiologic studies of psychotic disorders, these findings demonstrate that community pharmacy data alone systematically underestimate medication exposure, biasing effect estimates toward the null.
Overall Cox models (supplementary materials)
Overall pooled Cox models (HR = 1.08 for AP use, HR = 0.70 for polypharmacy) are provided in S2 but should be interpreted with caution. Severe proportional hazards violations (p < 0.0001) indicate these estimates mask temporal heterogeneity, averaging across periods with divergent effects (0–2 yr: HR = 0.908, 2–5 yr: HR = 0.946, 5 + yr: HR = 1.019). Given these violations, the polypharmacy estimate (HR = 0.70) should not be interpreted as a stable treatment effect; time-stratified analyses provide more reliable period-specific estimates.
Medication switching patterns
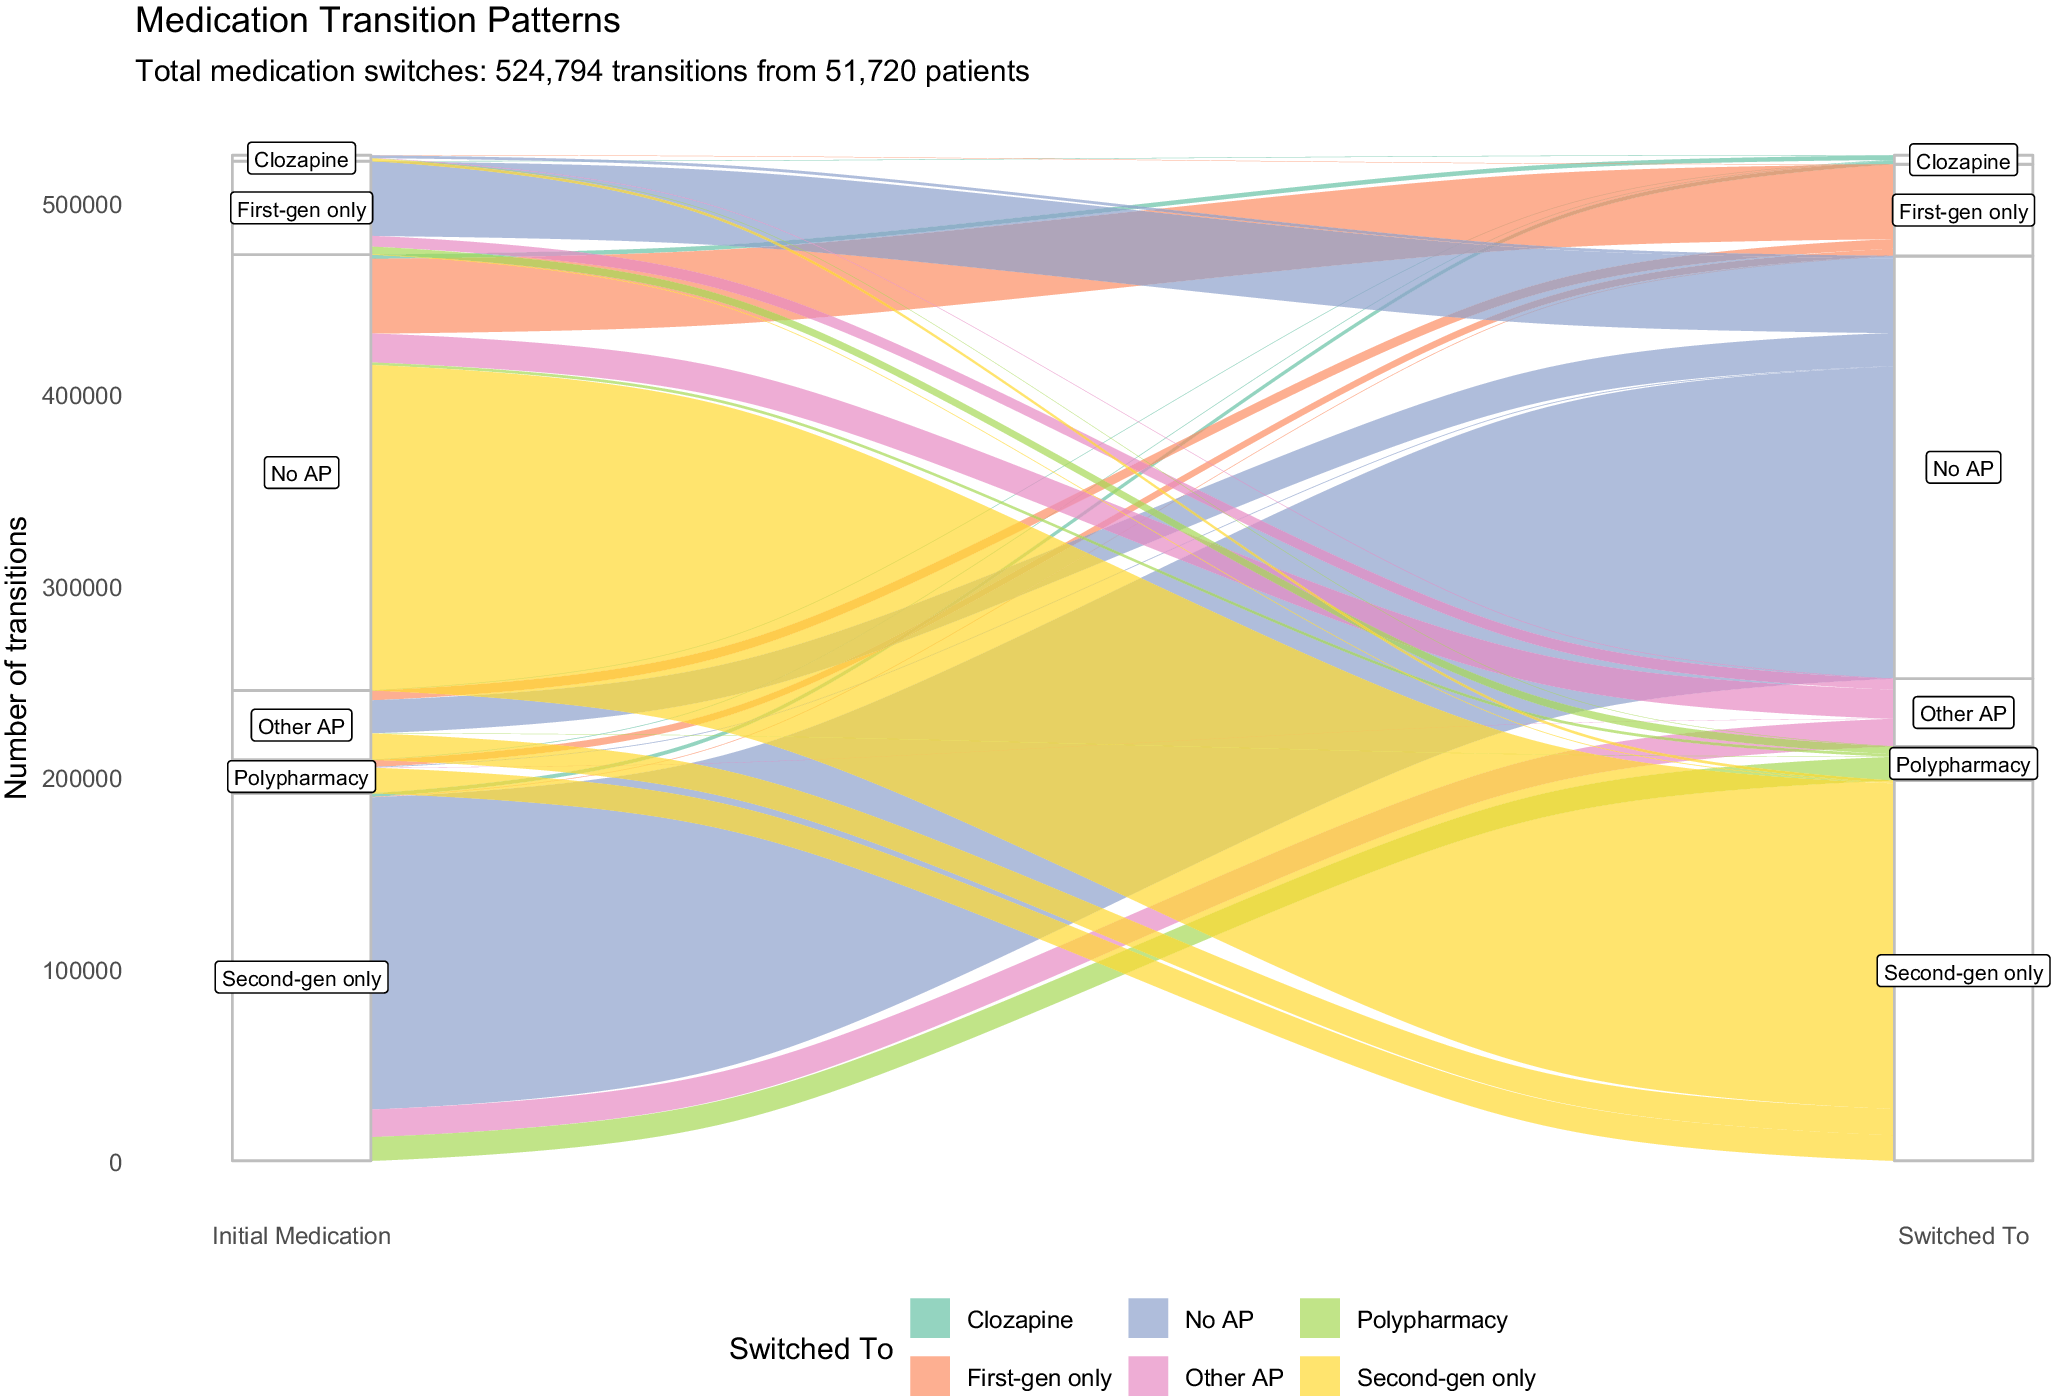
Among the 51,720 individuals who made medication category transitions during follow-up, treatment trajectories revealed substantial heterogeneity (Figure 6). The majority of transitions occurred between second-generation antipsychotics (68% of all transitions). Discontinuation events accounted for 22% of all transitions, with patients moving from medicated to unmedicated states. Notably, 8.2% of the cohort received clozapine during follow-up, representing a treatment change for individuals with treatment-resistant schizophrenia.
Sankey diagram showing medication switching patterns among switchers (n = 50,440). Flow width proportional to the number of transitions. Medication categories: first-generation only, second-generation only, clozapine, polypharmacy, and no AP use.

Figure 6. Long description
From left to right, initial medication categories are clozapine, first-generation only, no A P, other A P, polypharmacy, and second-generation only. The right side lists the same categories as switched-to options. The largest yellow flow starts at second-generation only on the left and continues to second-generation only on the right, indicating this is the most common transition. The next largest blue flow moves from second-generation only to no A P. Other notable flows include polypharmacy to polypharmacy (green), first-generation only to first-generation only (orange), and smaller flows between all other categories. Each flow is color-coded: clozapine is teal, first-generation only is orange, no A P is blue, polypharmacy is green, other A P is pink, and second-generation only is yellow. The y-axis is labeled number of transitions, ranging from zero to over 500,000. The legend at the bottom matches colors to medication categories.
Discussion
Principal findings
In this nationwide cohort of 65,630 individuals with schizophrenia spectrum disorders, we demonstrate that the impact of antipsychotic medication on vocational recovery is stage-dependent. Using a within-subject design, we found that medication was associated with reduced productive engagement during the acute phase (0–2 years: HR = 0.908, 95% CI: 0.903–0.913) and the consolidation phase (2–5 years: HR = 0.946, 95% CI: 0.939–0.952), before reversing to a small positive association in the long-term maintenance phase (5+ years: HR = 1.019, 95% CI: 1.010–1.028). While the late-phase HR of 1.019 is extremely small in magnitude, its clinical relevance could be offered in two features: first, applied across millions of person-weeks in a population-level analysis, even small effect sizes translate to meaningful differences in cumulative employment outcomes; second, the pattern, which is a reversal from negative to positive association is more informative than a small single point estimate, suggesting a potential shift in the medication – employment relationship over the recovery trajectory. The between-subject Fine–Gray competing risks analysis yielded an SHR of 1.002, suggesting equivalent cumulative engagement probabilities for baseline-treated and untreated groups. However, the subdistribution hazard ratio does not possess a simple rate-ratio interpretation analogous to the cause-specific hazard ratios from our Cox models (Andersen et al., Reference Andersen, Geskus, Witte and Putter2012), and these two quantities should not be directly compared. The discrepancy between models reflects three overlapping factors: first, the Fine–Gray SHR and the cause-specific HR estimate fundamentally different statistical quantities; second, the between-subject design is vulnerable to confounding by indication, where patients with more severe baseline illness are selectively prescribed antipsychotics; and third, the baseline exposure definition cannot capture treatment switching over follow-up. Together, these factors highlight the necessity of within-subject designs for etiological inference regarding medication – employment associations.
The hierarchy of evidence: Why within-subject models matter
The divergence between our primary (within-subject) and secondary (between-subject) analyses offers an important methodological lesson. The Fine–Gray model yielded an SHR near unity, which might superficially suggest no treatment – outcome association. However, as Andersen et al. (Reference Andersen, Geskus, Witte and Putter2012) demonstrate, the subdistribution hazard ratio reflects the ordering of cumulative incidence curves, but its numerical value does not possess a simple epidemiological interpretation. More fundamentally, the between-subject design is vulnerable to confounding by indication: patients with more severe illness are selectively prescribed antipsychotics, and this selection bias attenuates observed associations.
By contrast, our within-subject Cox model eliminates time-invariant confounding by comparing each patient to themselves during ‘on’ and ‘off’ medication periods. The emergence of phase-specific associations (negative in early years, positive in late years) from this more rigorous design demonstrates that averaged between-subject estimates can obscure clinically meaningful temporal heterogeneity. We conclude that for etiological questions in schizophrenia, where unmeasured confounding is pervasive, within-subject designs should be prioritized over standard cohort comparisons (Andersen et al., Reference Andersen, Geskus, Witte and Putter2012; Hernán, Reference Hernán2010; Lau et al., Reference Lau, Cole and Gange2017; Wolbers et al., Reference Wolbers, Koller, Witteman and Steyerberg2009).
Clinical implications: A stage-specific approach
The biphasic trajectory observed in our primary analysis – an initial inverse relationship between treatment and employment followed by long-term stabilization – challenges the static nature of current treatment guidelines. While current protocols rightly prioritize relapse prevention, our data indicate that for the first 5 years of illness, this symptomatic control comes at a functional cost. The negative association observed during the ‘consolidation’ phase (years 2–5; HR = 0.946) suggests that once the acute psychotic crisis has resolved, the iatrogenic burden of treatment, potentially manifesting as sedation, cognitive dulling, or secondary negative symptoms, may act as a ‘functional ceiling’ that actively suppresses vocational reintegration.
This finding isolates the consolidation phase as a critical period of vulnerability where pharmacotherapy alone is insufficient. Consequently, clinical practice should consider moving beyond a predominantly pharmacological approach during these intermediate years. Vocational rehabilitation should be indicated not merely as a social adjunct, but as a necessary clinical complement to the medication-associated functional dampening identified in this window. The reversal to a protective association in the maintenance phase (5+ years; HR = 1.019) validates the necessity of long-term antipsychotic coverage for chronic stability, but it implies that the path to this stability requires active management of the initial functional trade-off. We propose a stage-matched clinical model: intensive functional scaffolding and dose optimization should be front-loaded into the 2–5 year post-diagnosis window to bridge the gap between symptomatic remission and the long-term protective benefits of maintenance treatment.
The differential findings across medication categories warrant cautious interpretation. The strong negative acute-phase association for LAIs (HR = 0.691) likely reflects selection bias: LAIs are preferentially prescribed to patients with adherence difficulties, who may have more severe illness and poorer baseline functioning. The positive consolidation-phase association for clozapine (HR = 1.236) may similarly reflect treatment-resistant patients achieving clinical stabilization rather than a direct pharmacological effect on employment. These category-specific patterns should be interpreted as reflecting the clinical context of prescribing rather than as direct comparisons of medication efficacy for employment outcomes.
Comparison with prior studies
Our within-subject findings contrast with prior work. Solmi et al. (Reference Solmi, Taipale, Holm, Tanskanen, Mittendorfer-Rutz, Correll and Tiihonen2022) found antipsychotic treatment associated with 30–50% lower risk of work disability (HR ≈ 0.65) in Swedish patients with first-episode nonaffective psychosis, with long-acting injectables showing strongest protective associations. Similarly, Matsuzaki et al. (Reference Matsuzaki, Hatano, Iwata, Saito and Yamada2023) reported higher employment during clozapine treatment using a mirror-image design. Holm et al. (Reference Holm, Taipale, Tanskanen, Tiihonen and Mittendorfer-Rutz2021) documented low baseline employment rates (24% for schizophrenia) in Nordic populations, consistent with our 33.4% at diagnosis. Our more granular time-stratified approach reveals that these averaged effects may obscure important temporal heterogeneity: medication effects vary substantially across the recovery trajectory.
Lagged exposure analyses
Building upon this premise, it is necessary to explore the potential clinical mechanisms underlying these delayed functional effects. The observation that negative associations persist even when the measurement of exposure is separated from the outcome by up to 2 years implies that the functional consequences of antipsychotic treatment manifest over a prolonged timeline. From a clinical perspective, this delayed impact may reflect the cumulative and compounding burden of medication side effects, such as persistent sedation, cognitive dulling, or the emergence of secondary negative symptoms. These negative factors can gradually erode a patient’s capacity to maintain competitive employment or educational commitments, acting as a persistent functional ceiling even after acute psychotic symptoms have been successfully managed.
However, a balanced interpretation requires acknowledging that lagged models cannot completely disentangle pharmacological effects from the underlying trajectory of the illness. It remains plausible that patients who consistently require antipsychotic medication over a protracted 2-year period represent a distinct subgroup suffering from a more severe or enduring form of the disorder. Under this interpretation, the persistent negative associations observed in our lagged models might still partially capture the chronic, disabling nature of the schizophrenia spectrum itself, rather than reflecting an exclusively iatrogenic pharmacological cost. Therefore, while the lagged exposure framework robustly challenges the hypothesis that acute contemporaneous relapse is the sole driver of vocational loss, the delayed effects we observe most likely represent a complex interaction between the prolonged pharmacological burden of maintenance treatment and the inherent long-term functional decline associated with persistent psychiatric morbidity.
Strengths and limitations
Our study’s primary strength is the integration of SMR hospital pharmacy data (correcting 6.1% exposure misclassification) combined with the statistical power of 26.9 million person-weeks and a rigorous within-subject design that controls for all time-invariant confounders.
The major limitation of the Fine–Gray analysis was its inability to accommodate time-varying covariates or within-subject stratification, rendering it a descriptive rather than causal tool in this context. The Fine– Gray model should therefore be interpreted as providing a prognostic, population-level benchmark rather than an estimate of causal effect.
A key concern in this study is reverse causation and time-varying confounding. While the within-subject design controls for time-invariant confounders, it cannot adjust for time-varying symptom fluctuations. For example, a relapse may simultaneously trigger both job loss and medication restart, creating a spurious negative association between medication and employment. Similarly, ‘healthy discontinuer’ bias (Sommer et al., Reference Sommer, Beer, Gangadin, Haan, Veling and Beveren2025) may operate: patients who discontinue medication and remain employed may represent a less severely ill subgroup, inflating apparent negative medication effects. Our lagged exposure sensitivity analyses (Figure 4) partially mitigate this concern, as negative associations persisted across 6, 12, and 24-month lag periods, arguing against reverse causation as the sole explanation. The persistence of effects across progressively longer lag windows suggests a genuine delayed association rather than an artifact of simultaneous relapse and treatment change.
Confounding by indication is partially addressed by the within-subject design, which eliminates between-person severity differences. However, within-person confounding remains possible: periods of medication use may coincide with periods of greater illness severity. The 5–10 year protective effect of medication may partly reflect illness stabilization, treatment optimization, accumulated patient insight into medication management, and stronger therapeutic alliance with clinicians, rather than a purely pharmacological mechanism.
The DREAM employment classification may misclassify ambiguous situations, including subsidized employment (fleksjob), parental leave, and informal work arrangements. This nondifferential misclassification would be expected to bias effect estimates toward the null (Copeland et al., Reference Copeland, Checkoway, McMichael and Holbrook1977; Dosemeci et al., Reference Dosemeci, Wacholder and Lubin1990), suggesting our estimates may understate the true magnitude of medication – employment associations.
The F20–F29 diagnostic spectrum encompasses substantial clinical heterogeneity. Initial register-based diagnoses may be revised upon further clinical assessment, introducing potential diagnostic misclassification. Patients who were never medicated during follow-up may represent a less severe subgroup (e.g. individuals with brief psychotic episodes who recovered without pharmacotherapy), and their exclusion from within-subject models limits generalizability to patients with stable medication patterns.
Finally, Denmark’s universal healthcare system, comprehensive social welfare provisions, and active labor market policies may limit generalizability to healthcare systems with less extensive support structures.
Conclusion
Antipsychotic medication is neither purely beneficial nor purely harmful for functional outcomes; its impact evolves with the stage of illness. While standard cohort analyses may suggest a ‘null’ effect, rigorous within-subject modeling reveals a transient trade-off: early-phase treatment serves as a stabilizer that may temporarily constrain vocational capacity before supporting long-term maintenance. Clinical practice should move toward stage-matched rehabilitation, with a specific focus on supporting employment during the ‘consolidation’ years (2–5 post-diagnosis) when the tension between symptom control and functional recovery is most acute.
Supplementary material
The supplementary material for this article can be found at http://doi.org/10.1017/S0033291726104693.
Acknowledgments
The authors would like to thank Mathilde Werborg Birkholm and Aleksander Søltoft-Jensen for helping with coding. The authors would also like to thank Janne Petersen for making them part of the team. The authors would like to thank the three anonymous peer reviewers whose comments helped improve this article. The authors would like to express sincere gratitude to each of the 65,630 people whose data were analyzed for this project. This research was made possible by Danmarks Nationalbank.
Author contribution
Conceptualization: RT, ODH, ML, MN, and MO. Data curation: MO and FHG. Formal analysis: RT, MO, and CH. Methodology: RT, FHG, ODH, ML, MN, and MO. Software: RT, FHG, and MO. Supervision: MO. Validation: MO and FHG. Visualization: RT. Writing – original draft: RT. Writing – review and editing: RT, FHG, CH, ODH, ML, MN, and MO. RT, FHG, CH, MN, and MO had access to the data.
Funding statement
No funding directly supported this research; however, Danmarks Nationalbank funded the research visit that made this collaboration possible. ODH’s salary was funded by Medical Research Council-UK (MC_U120097115; MR/W005557/1 and MR/V013734/1), UKRI (no. 10039412), EU (no. 101028661 and 101026235), Margaret Temple, King’s Challenge Fund, and Wellcome Trust (no. 094849/Z/10/Z; 227867/Z/23/Z) grants to ODH, and the National Institute for Health and Care Research (NIHR) Biomedical Research Centre at South London and Maudsley NHS Foundation Trust and King’s College London. The views expressed are those of the authors and not necessarily those of the NIHR or the Department of Health.
Competing interests
FHG, CH, ML, MN, and MO declare no conflicts of interest. ODH has received research funding from and/or participated in advisory/speaker meetings organized by Abbvie, Alkermes, Angellini, Autifony, Biogen, BMS (Karuna), Boehringer-Ingelheim, Clinicalink, Delix, Eli Lilly, Elysium, EMPartners, Heptares, Global Medical Education, Invicro, Janssen, Karuna, Lundbeck, Merck, Neumora, Neurocrine, Ono, Ontrack/Pangea, Otsuka, Sunovion, Teva, Recordati, Roche, Rovi, and Viatris/Mylan. ODH was previously a part-time employee of Lundbeck A/S. ODH has a patent for the use of dopaminergic imaging. Neither ODH nor his family has holdings/a financial stake in any pharmaceutical company. RT owns a small amount of shares in the Legal & General Global Health & Pharmaceuticals Index Trust ISIN: GB00B0CNH387. The views expressed are those of the author(s) and not necessarily those of the NIHR or the Department of Health.
Declaration of Generative AI and AI-assisted technologies in the writing process
During the preparation of this work, the authors used Claude Opus 4.6 (Anthropic, San Francisco, CA) to edit and plan the manuscript. After using this tool, the authors reviewed and edited the content as needed and take full responsibility for the content of the published article.


 Open access

