


1. INTRODUCTION
The current status of Hindu-Kush Karakoram Himalaya (HKKH) glaciers varies across the region from equilibrium or even slight mass gain in Karakoram in recent years (Hewitt, Reference Hewitt2005; Gardelle and others, Reference Gardelle, Berthier, Arnaud and Kääb2013) to rapid shrinkage and downwasting in the Himalayas (Bolch and others, Reference Bolch2012; Yao and others, Reference Yao2012). Interpreting this contrasted signal in terms of climate is challenging because meteorological observations at glacier elevations are difficult and thus, only recent and sparse (Fowler and Archer, Reference Fowler and Archer2006; Dimri and Dash, Reference Dimri and Dash2012). Uncertainties concerning the evolution of HKKH glaciers and their relationship with regional climate are mainly attributed to a lack of observations of glacier and climate-forcing variables (Barry, Reference Barry2012; Pepin and others, Reference Pepin2015).
Over the last decade, Mount Everest and its region in Nepal, central Himalaya, have drawn the attention of a growing number of scientists, such as glaciologists, high-mountain hydrologists and climatologists, because of its symbolic significance as the highest mountain on Earth and large socio-economic impacts on tourism and water supply. In this region of investigation, four different studies using remote-sensing techniques reported a mass loss over the last decades: region-wide mass balance (MB) of −0.32 ± 0.08 m w.e. a−1 from 1970 to 2007, over a 62 km2 glacierized area including Khumbu Glacier originating on Mount Everest (Bolch and others, Reference Bolch, Pieczonka and Benn2011); −0.40 ± 0.25 m w.e. a−1 from 1992 to 2008, over a 183 km2 glacierized area including the previous study area (Nuimura and others, Reference Nuimura, Fujita, Yamaguchi and Sharma2012); −0.26 ± 0.14 m w.e. a−1 from 2000 to 2010, over a 1461 km2 glacierized area comprising previous study areas (Gardelle and others, Reference Gardelle, Berthier, Arnaud and Kääb2013); and −0.52 ± 0.22 m w.e. a−1 from 2000 to 2015 for 32 glaciers (total area of 707 km2) across the Everest region (King and others, Reference King, Quincey, Carrivick and Rowan2017).
In addition, an extensive ground-based glacio-meteorological monitoring program has been undertaken in the upper part of the Dudh Koshi basin located south of Mount Everest. There, Mera, Pokalde and the distinct debris-free West Changri Nup and debris-covered North Changri Nup glaciers have been monitored since 2007, 2009 and 2010, respectively. Previously, Wagnon and others (Reference Wagnon2013) observed a larger mass loss of the low-maximum-elevation Pokalde Glacier between 2009 and 2012 than that of Mera Glacier, which has a large high-altitude accumulation area. Based on extensive field work conducted from November 2011 to November 2015, Vincent and others (Reference Vincent2016) quantified a 1.8 m w.e. a−1 reduction of area-averaged ablation between 5240 and 5525 m a.s.l. on the debris-covered North Changri Nup Glacier due to the presence of an insulating debris cover over its tongue.
Salerno and others (Reference Salerno2015) performed an extensive analysis of all meteorological records available since 1994 above 2660 m a.s.l. in the southern flanks of Mount Everest. They reported a significant temperature increase only during the post-monsoon, and a year round strong precipitation decrease, potentially responsible for the observed glacial downwasting. Current glacier melting is accompanied by the formation and the expansion of many supraglacial and proglacial lakes in the region (Gardelle and others, Reference Gardelle, Arnaud and Berthier2011), increasing the risk of glacial lake outburst floods (Somos-Valenzuela and others, Reference Somos-Valenzuela2014).
Recent predictions of glacier change in the Everest region by 2100 vary widely. On the one hand, Shea and others (Reference Shea, Immerzeel, Wagnon, Vincent and Bajracharya2015a) predict losses of up to 80% of glacier ice based on the application of a MB and ice redistribution model fed by reanalysis meteorological data calibrated on current in situ observations. On the other hand, Rowan and others (Reference Rowan, Egholm, Quincey and Glasser2015) only assess an 8–10% loss over the same period with a dynamic model of the evolution of debris-covered glaciers prescribed by varying equilibrium line altitude (ELA) over time. These large uncertainties in predictions of glacier change reflect the limited availability of in situ data to validate such predictions as well as our incomplete understanding of the mountain glacier processes and boundary conditions. In particular, the vertical shift of the ELA over time and the magnitude and spatial distribution of precipitation are among the largest unknowns in high mountain hydrology (Ragettli and Pellicciotti, Reference Ragettli and Pellicciotti2012; Immerzeel and others, Reference Immerzeel, Wanders, Lutz, Shea and Bierkens2015). Thus, in situ measurements are necessary and timely to better understand the current state of the glaciers to constrain glaciological and hydrological models in order to predict their future evolution based on climatic scenarios.
The main objectives of this study are to: (i) present results from extensive MB measurements performed on debris-free Mera, Pokalde and West Changri Nup glaciers in the Everest region since 2007, and (ii) identify the drivers explaining the MB differences between these glaciers using previously unpublished meteorological data recorded at the glacier elevations. A special focus will be directed to the West Changri Nup Glacier whose measuring network is described for the first time. In addition, new data are presented from the Mera and Pokalde glaciers for 2012–15 to extend the MB time series previously reported until 2012 by Wagnon and others (Reference Wagnon2013). We will also compare glacier-wide glaciological MB of West Changri Nup Glacier with geodetic MBs derived from satellite DEMs so as to identify possible biases.
2. STUDY AREA
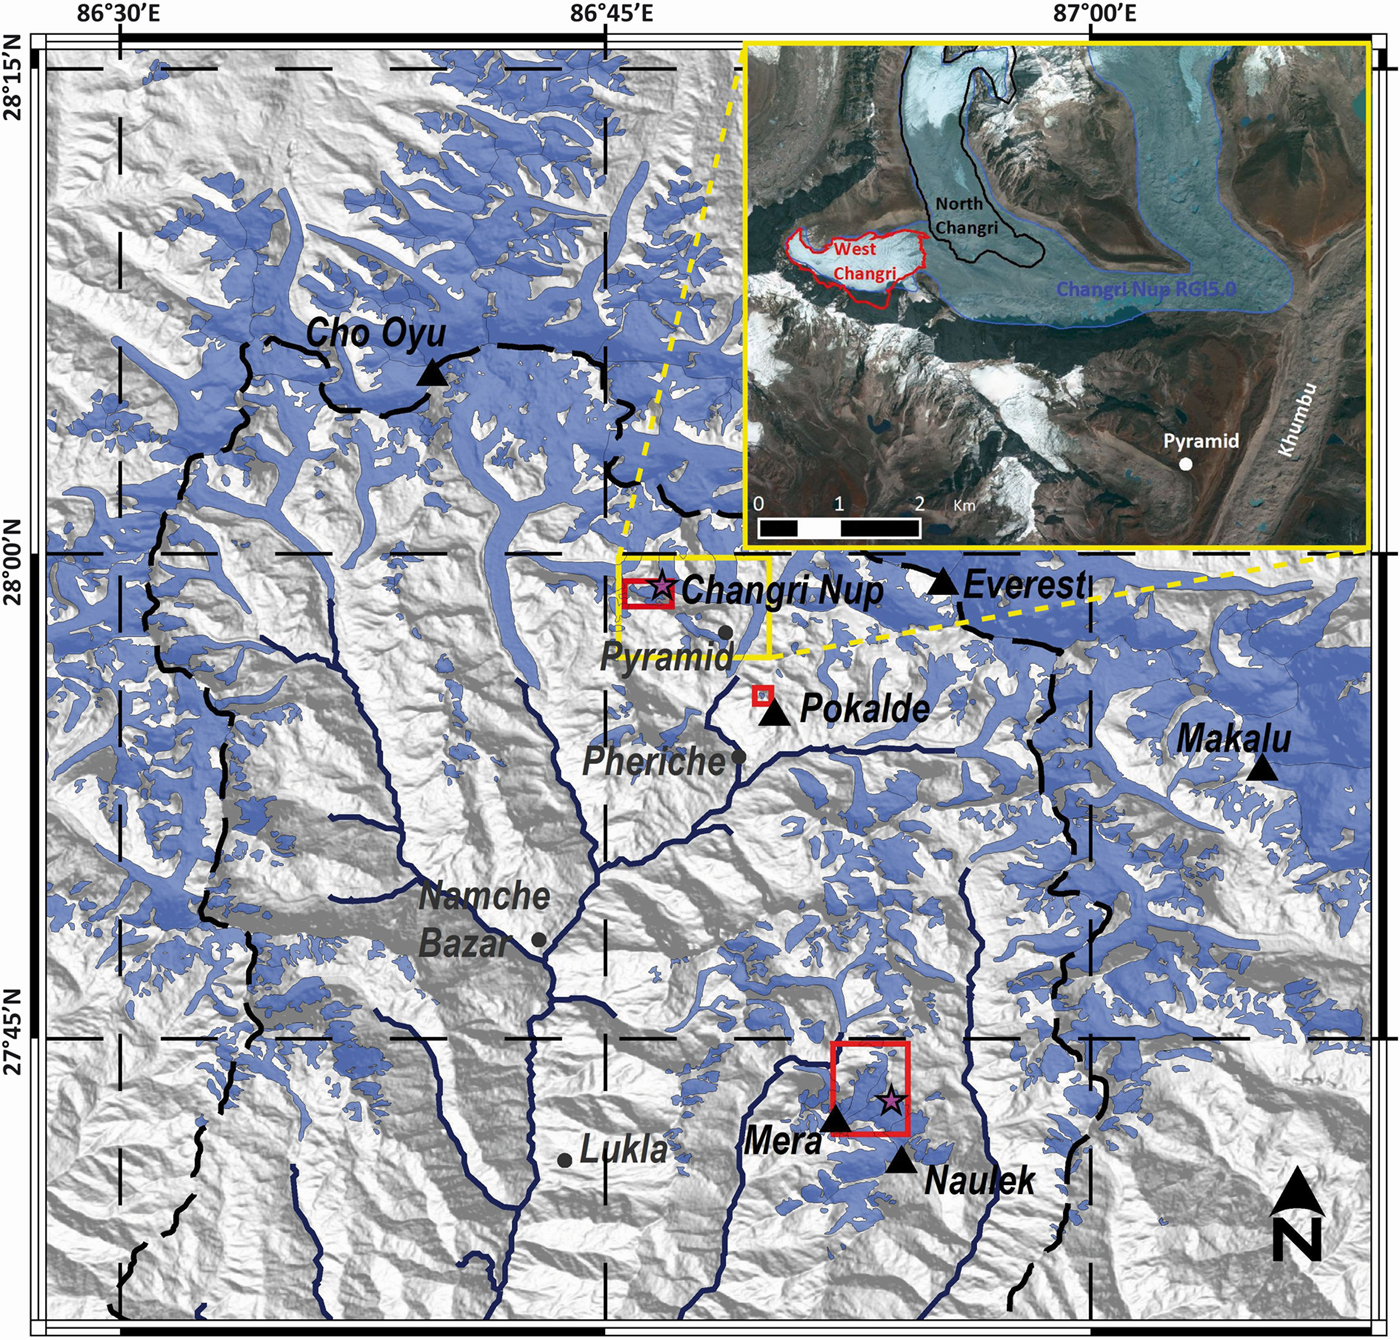
The three debris-free glaciers are located in the Dudh Koshi basin in the northeastern part of Nepal, central Himalaya (Fig. 1; Table 1). They are summer-accumulation glaciers and influenced by the Indian monsoon (Ageta and Higuchi, Reference Ageta and Higuchi1984; Wagnon and others, Reference Wagnon2013).
Map of the Dudh Koshi basin, Khumbu area where Changri Nup, Pokalde and Mera Glaciers are located (inside the red squares). Pyramid meteorological station, major settlements and main summits are indicated by dots and triangles, respectively. Glacierized areas from the Randolph Glacier Inventory v5.0 (Pfeffer and others, Reference Pfeffer2014) are represented in blue. Dark blue lines represent river networks in the basin. Purple stars locate automatic weather stations on Changri Nup and Mera Glaciers. The inset shows the limits of debris-free west (red line) and debris-covered north (black line) Changri Nup Glaciers, which are two disconnected glaciers contrary to what is shown in the Randolph Glacier Inventory v5.0. (blue semitransparent area and blue outline).
Characteristics of the three monitored debris-free glaciers located in the Everest area
* Weighted with surface areas.
** Data source: Wagnon and others (Reference Wagnon2013) until 2012, this study: 2012–2015.
West Changri Nup Glacier (28.0°N; 86.8°E) is a small, partly avalanche-fed glacier located in the Khumbu valley, in the Sagarmatha National Park. This northeast-oriented glacier is disconnected from the neighboring debris-covered North Changri Nup Glacier (Fig. 1) and it has been monitored since 30 October 2010 (Fig. 2). Its area was 0.92 km2 in 2013, with an elevation range between 5330 and 5690 m a.s.l. From now on, in this study, West Changri Nup Glacier will be referred as Changri Nup Glacier.
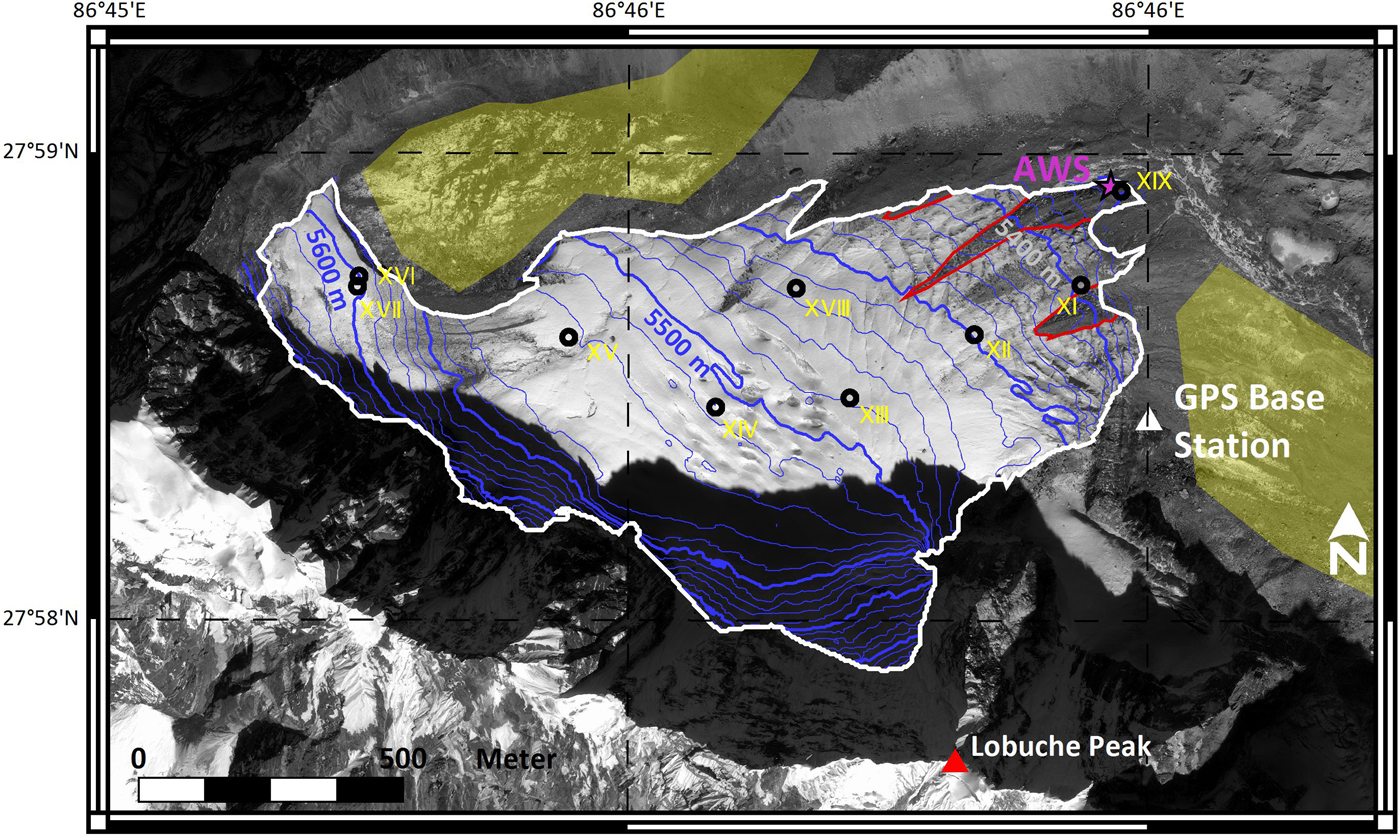
Map of Changri Nup Glacier, showing the network of ablation/accumulation stakes (black circles, numbered from XI to XIX), GPS Base station (white triangle) and AWS (red star). Debris covered areas are delineated with red lines. Background: Pleiades-1A image of 22 November 2015. The flat and stable areas used for vertical registration of the DEMs are shaded in yellow.
Pokalde Glacier (27.9°N, 86.8°E; 0.1 km2) is also situated in the Khumbu valley, ~8 km southeast from Changri Nup Glacier. This small north-oriented glacier flows from 5690 to 5430 m a.s.l., and has been monitored since 20 November 2009.
Mera Glacier (27.7°N, 86.9°E, 5.1 km2 in 2012) is located ~30 km south of Changri Nup Glacier straddling Hinku valley and Hunku valley, and has been monitored since 17 November 2007. From the summit at 6420 m a.s.l., the glacier flows north and divides into two main branches at 5800 m a.s.l. The main branch (Mera branch) flows north and then west down to its snout at 4940 m a.s.l., while the second branch (Naulek branch) is northeast oriented with its lowest elevation at 5260 m a.s.l. Details about Changri Nup, Mera and Pokalde glaciers are presented in Table 1. Additional details of the latter two glaciers are available in Wagnon and others (Reference Wagnon2013).
3. DATA AND METHODOLOGY
3.1. Meteorological data
An automatic weather station (AWS) has been operating at 5360 m a.s.l. at the surface of a small debris-covered area (0.03 km2) on the otherwise debris-free Changri Nup Glacier (Fig. 2) since 30 October 2010. In addition, precipitation has been recorded from an all-weather precipitation gauge at Pyramid (5035 m a.s.l.) with a Geonor sensor using a weighing device suitable to measure liquid and solid precipitation since 6 December 2012. Table 2 provides a list of the sensors with their specifications as well as the total time gaps in the record. Precipitation data have been corrected for potential undercatch following the method by Lejeune and others (Reference Lejeune2007) as a function of wind speed and precipitation phase (liquid or solid) depending on the air temperature. This correction is significant and results in an 18% increase of the total amount of precipitation originally measured with the precipitation gauge between 6 December 2012 and 30 November 2015 (1799 mm w.e. instead of 1522 mm w.e. over this 3-year period).
List of different sensors with their specificity, installed on the Changri Nup AWS (5360 m a.s.l.), precipitation gauge installed at Pyramid (5035 m a.s.l.) and ultrasonic ranger installed on the Naulek AWS
Measuring frequency = 30 s, records = half-hourly values.
* The height of sensors has varied along the measuring period depending on ablation/accumulation (maximum changes of ±1 m).
Additionally, monthly precipitation data at Pyramid have been reconstructed for the time period between November 2010 and November 2012 by applying a linear regression between monthly precipitation recorded at Pyramid by a tipping bucket usually used for rainfall measurements and by the Geonor gauge (r 2 = 0.70, n = 22 months from December 2012 to April 2015 with some gaps for the tipping bucket record; see Fig. S1).
In this study, we also use data from an ultrasonic ranger (Campbell SR50A) measuring snow depth or snow/ice ablation installed on an AWS at 5360 m a.s.l. on 27 November 2012 at the surface of the Naulek branch of Mera Glacier (Fig. 1).
3.2. Glacier-wide MB from the glaciological method
MB measurements of Changri Nup Glacier have been carried out since October 2010, using nine bamboo stakes regularly replaced at their original locations and installed up to 10 m deep. The stakes were located on the clean ice with an exception of the stake XIX installed close to the AWS on the small debris-covered part of this otherwise debris-free glacier (Fig. 2). Measurements have been performed at least twice but up to six times a year depending on the weather conditions and access to the glacier. Annual MB values were calculated from the measurements from a post-monsoon (generally October–November or sometimes beginning of December) to the post-monsoon of the following year, consistent with other in situ glacier MB series from the Everest region (Wagnon and others, Reference Wagnon2013).
Temporal emergence differences of the stakes allowed us to obtain the point MB. In MB calculations, ice density was assumed to be 900 kg m−3 and in the presence of snow, its density is taken equal to the mean value (370 kg m−3) of snow densities measured on Mera Glacier below 5600 m a.s.l. (Wagnon and others, Reference Wagnon2013). Since this debris-covered area of the Changri Nup Glacier is only 3.3% of the total area (Fig. 2), the stake XIX inserted at this location was discarded from the MB calculations, i.e. the debris cover has been ignored for these calculations.
The hypsometry of Changri Nup Glacier was extracted from a DEM derived from Pléiades stereo images of 29 November 2013. Without ground control point (GCP) in 2013 (no DGPS survey in 2013), the DEM was ‘floating’ above the true surface (glacierized and not) and needed to be vertically adjusted. This vertical shift (+6.3 m; SD of 0.57 m) was assessed as the median difference between the original Pleiades DEM and 58 DGPS points that were located along survey profiles and at stake locations on the glacier and measured in December 2012. Thus, the adjusted DEM and hypsography represent the glacier surface in December 2012 and was considered unchanged over the short 2010–15 study period. The glacier outline was manually delineated on satellite images, based on visual inspection and on our field experience.
The annual glacier-wide MB, B a, is calculated according to:
 $$B_{\rm a} = \displaystyle{1 \over S}\vint_{\rm s} b_{\rm a} {\rm d}s\;({\hbox{in m w.e. a}}^{ - 1} ) $$
where, b a is the point surface MB obtained from the corresponding stake readings and S is the glacier area. MB was obtained for every 10 m altitudinal range using a single linear fit of all available in situ point MB measurements vs elevation (Fountain and Vecchia, Reference Fountain and Vecchia1999) (see Section 4.3.1). Every 10 m altitudinal range area was then multiplied by its corresponding MB, then cumulated over all altitude ranges and finally divided by the glacier area S to get the glacier-wide MB. Each year, ELA is deduced as the altitude at which the regression line b a as a function of altitude crosses the zero MB-value, and the slope of this regression line gives the vertical gradient of MB (db/dz).
In this study, the time series of annual values of B a, ELA, accumulation area ratio (AAR) and db/dz for Mera and Pokalde Glaciers were extended by 3 years of observations in 2012–15 (Wagnon and others, Reference Wagnon2013), with similar methods resulting in a total of 8 and 6 years observation periods, respectively. Mera Glacier has the longest continuous annual MB series of any glacier in Nepal.
Accuracy of B a depends on all potential sources of errors related to either the measurements themselves (ice/snow density, stake height determination, liquid-water content of the snow, snow depth) and the sampling network (i.e. density and representativeness of the stake network) as well as the quality of the hypsometry. Thus, the error attributed to B a measured by the glaciological method for Changri Nup Glacier is estimated following Thibert and others (Reference Thibert, Blanc, Vincent and Eckert2008). An average error of ±0.27 m w.e. a−1 is obtained for Changri Nup Glacier, which is similar to Mera and Pokalde Glaciers, i.e. ±0.28 m w.e. a−1 defined by Wagnon and others (Reference Wagnon2013).
3.3. Glacier-wide MB from the geodetic method
The geodetic MBs of Changri Nup Glacier were computed using DEMs derived from two satellite stereo acquisitions in 2009 and 2015. First, the 2015 DEM was derived from a triplet of Pléiades images acquired on 22 November 2015. They were georeferenced using one GCP measured in the field with a DGPS in November 2015. The ground resolution of each image was 0.5 m and the base-to-height ratios were 0.10 (front/nadir), 0.26 (back/nadir) and 0.36 (front/back). The 2009 DEM was then derived from two SPOT5 images acquired on 28 October and 4 November 2009 using five GCPs extracted from the Pléiades 2015 DEM and its corresponding orthoimage (0.5 m resolution). The ground resolution of SPOT5 images was 2.5 m and the base-to-height ratio was 0.45. All DEMs were calculated using the commercial software PCI Geomatica. Output resolution was set to 6 m for all the DEMs.
The glacier outlines were manually delimited from the 2009 and 2015 orthoimages. The area uncertainty was calculated as the product of the pixel size of the orthoimage used for delineation (0.5 m for Pléiades image and 2.5 m for SPOT5 image) and the glacier perimeter (Granshaw and Fountain, Reference Granshaw and Fountain2006).
The 2009 DEM was horizontally co-registered to the 2015 DEM by minimizing the aspect dependency of the elevation difference on stable terrain (Nuth and Kääb, Reference Nuth and Kääb2011). To do so, we excluded the off-glacier pixels using a regional inventory (Gardelle and others, Reference Gardelle, Berthier, Arnaud and Kääb2013) and pixels for which the absolute elevation differences were larger than three times the normalized median absolute deviation. To check the consistency of the horizontal co-registration, we also realigned the 2009 DEM using an extra DEM derived from Pléiades images acquired in November 2013 (see online Supplementary Tables S1 and S2). We finally subtracted the median elevation difference on stable zones near the glacier to the entire elevation difference map (1.1 km2, partly visible on Fig. 2).
Due to shadows on large parts of the glacier, we obtained reliable elevation differences for 77% of the glacier surface. The shadowed areas were manually excluded (Fig. S2b). Therefore, we used a hypsometry of the glacier, which was derived from the 2013 DEM and manual extension of the contours to weigh the elevation differences retrieved for each 10 m elevation band, thus following a standard hypsometric approach (Paul and others, Reference Paul2015). We assumed a conversion factor from volume to mass (ρ CONV) of 850 kg m−3 (Huss, Reference Huss2013).
The uncertainty of the glacier-wide MB (σ MB) was calculated using two different methods and the maximum of the two was used as our preferred, more conservative, estimate. The first estimate (σ MB1) was a formal uncertainty based on the standard principle of error propagation (Berthier and others, Reference Berthier2007; Magnússon and others, Reference Magnússon, Muñoz-CoboBelart, Pálsson, Ágústsson and Crochet2016), whereas the second estimate (σ MB2) was empirical and took advantage of the availability of three maps of elevation difference for 2009–13, 2013–15 and 2009–15.
σ MB1: The uncertainty of the 2009–15 elevation difference was assessed from the statistical distribution of the elevation differences over stable terrain (Rolstad and others, Reference Rolstad, Haug and Denby2009; Magnússon and others, Reference Magnússon, Muñoz-CoboBelart, Pálsson, Ágústsson and Crochet2016). The SD of elevation differences on stable ground (σ STABLE) was 3.2 m. The decorrelation length estimated from the semivariogram was ~50 m, which gave 386 independent pixels for the entire glacier (n GLA) and 432 independent pixels on the stable zone (n STABLE). We also assumed that the error was five times higher in the voids of the DEM (Berthier and others, Reference Berthier2014). We therefore multiplied the error on mean elevation change on glacier (σ STABLE/n GLA) by five and by the proportion of voids (σ VOIDS/n GLA). The total uncertainty for the glacier elevation difference was obtained as the sum of three independent error sources: the uncertainty of the median elevation difference on stable zones, the standard error on the mean elevation change on glacier and an estimate of the error due to voids in the DEM. By summing these three terms quadratically, we obtained a total uncertainty σ dh:
 $$\eqalign{& \sigma_{\rm dh} = \cr & \sqrt {(\sigma _{{\rm STABLE}} /n_{{\rm STABLE}} )^2 \!+\! (\sigma _{{\rm STABLE}} /n_{{\rm GLA}} )^2 \!+\! 5\displaystyle{{n_{{\rm VOIDS}}} \over {n_{{\rm GLA}}}} \!\left( \!{\displaystyle{{\sigma _{{\rm STABLE}}} \over {n_{{\rm GLA}}}}} \right)^{2}}.}$$
The uncertainty of the conversion factor from volume to mass (σ CONV) was 60 kg m−3 (Huss, Reference Huss2013).
As these two main sources of uncertainty (σ dh and σ CONV) were independent, the uncertainty of MB σ MB was calculated as:
 $$\sigma _{{\rm MB}} = \displaystyle{{\sqrt {(\rho _{{\rm CONV}} \sigma _{{\rm dh}} )^2 + \; ({\rm dh}_{{\rm TOT}} \sigma _{{\rm CONV}} )^2}} \over {\Delta t}}$$
where dhTOT was the mean elevation difference and Δt the time between two acquisitions. We found an uncertainty of 0.13 m w.e. a−1 for glacier-wide MB (σ MB1).
σ MB2: If the 2009, 2013 and 2015 DEMs were perfectly 3-D co-registered, the sum of the 2009–13 and 2013–15 glacier volume changes should equal the 2009–15 volume changes. Practically this was not the case, and the volume difference, divided by the mean glacier area, could be used as an empirical estimate of our uncertainty of the elevation difference (Paul and others, 2015). This elevation error (1.42 m) was combined with the 6-year time difference and the uncertainty of the conversion factor from volume to mass to calculate a MB uncertainty (σ MB2) of 0.20 m w.e. a−1. The latter value was larger than σ MB1 and thus used as our best estimate for the geodetic MB uncertainty.
Thus, our formal uncertainty, σ MB1, likely underestimated the true uncertainty (Table S2), a result in agreement with a recent study using ASTER DEMs (Berthier and others, Reference Berthier, Cabot, Vincent and Six2016). This was likely due to the fact that the formal uncertainty calculation relied on the strong assumption that the two pixels separated by the decorrelation length were totally independent, and therefore, the spatially varying biases in DEMs at larger scale were not taken into account.
4. RESULTS
4.1. Climatic conditions
Figure 3 displays the monthly temporal variations in precipitation recorded at Pyramid (5035 m a.s.l.) and air temperature (T air), incoming shortwave and longwave radiation (SWin and LWin, respectively), wind speed (u) and relative humidity (RH) recorded at the Changri Nup AWS (5360 m a.s.l.) between November 2010 and November 2015. To facilitate an interannual comparison, we divided the year into four seasons: winter (December–February), pre-monsoon (March–May), summer or monsoon (June–September) and post-monsoon (October–November) as previously defined by Bonasoni and others (Reference Bonasoni2010) and Khatiwada and others (Reference Khatiwada, Panthi, Shrestha and Nepal2016). A summary of the annual and seasonal values of all the meteorological variables listed above is presented in Table S3.
Local meteorological conditions at the Changri Nup AWS (5360 m a.s.l.) except the precipitation at Pyramid (5035 m a.s.l.) from November 2010 to November 2015. SWin and LWin are shortwave and longwave radiation, respectively, u is wind speed and RH is relative humidity. Mild blue and pink-shaded areas represent winter and summer periods, respectively, and thus, areas that are not shaded represent post-monsoon and pre-monsoon. T and P stand for the annual (1 December to 30 November) mean air temperature and the cumulated precipitation recorded for 5 years from 2010 to 2015.
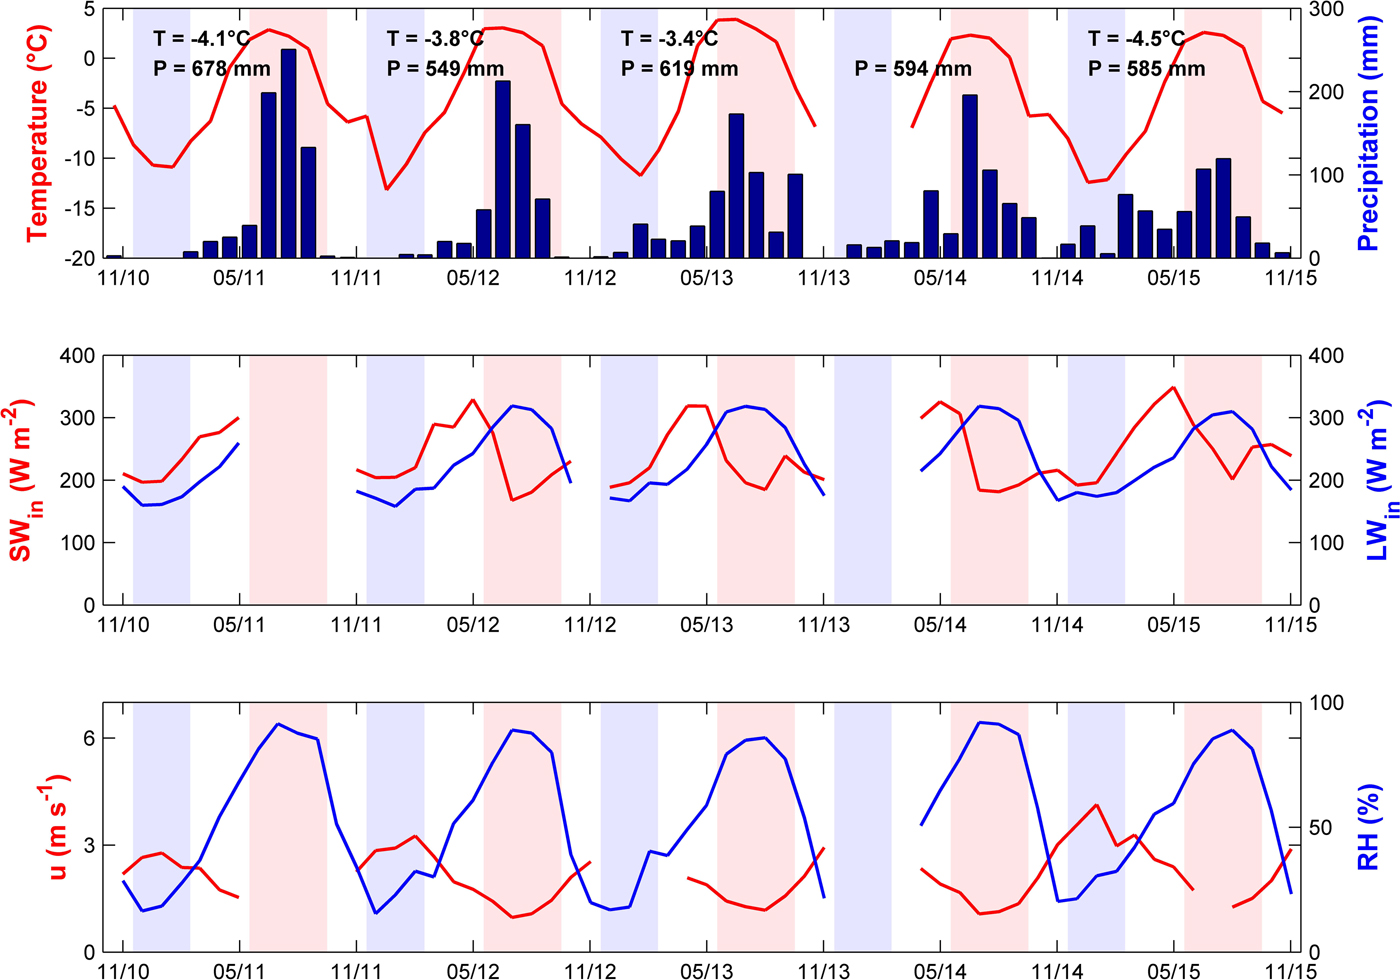
In summer, the Indian monsoon originating from the Bay of Bengal brings large amounts of humid air travelling north or northwest, colliding with the orographic barrier, and thus triggering intense convection and in turn heavy rainfalls. In the inner part of the Everest range, at Changri Nup and Pyramid sites, this intense convection activity is materialized as a constantly humid, warm and low-wind-speed summer (Fig. 3 and Table S3). On average, 74% of the total precipitation falls during the monsoon, a period when air temperature at 5360 m a.s.l. remains above the freezing point (T air = 2.0°C on average for all the monsoons from 2010 to 2015, and the monsoon sum of positive air temperature ∑T air+ = 275.1°C (JJAS), corresponding to 93% of the annual sum; Table S3), RH is constantly very high (84%) with air being often saturated, incoming longwave radiation is high (296 W m−2) due to the presence of frequent and thick convective clouds, and the wind speed is low (1.4 m s−1). At night at the Changri Nup AWS site, we observe a katabatic wind from west-southwest (W-SW) (N250°) and during the day, an up-valley breeze comes from east-southeast (N120°). In winter, the overall monsoon-related circulation weakens allowing the westerly upper tropospheric synoptic-scale waves, dry over Nepal, to be dominant (Wang, Reference Wang2006). Consequently, the air is very dry and cold (RH = 24% and T air = −10.2°C on average for all winters 2010–15, with almost no daily air temperature above the freezing point), precipitation is almost absent (29 mm w.e.), incoming longwave radiation is extremely low (173 W m−2) because the high-elevation cold atmosphere is free of clouds, and wind, almost always coming from W-SW, is stronger (3.1 m s−1) at the Changri Nup and Pyramid sites (Table S3).
In between these contrasting seasons, there is competition between both the circulation systems, the monsoon and the westerlies, resulting in two transition seasons. Pre-monsoon is characterized by a progressive onset of the monsoon, with a regular increase in T air, RH, LWin and precipitation while wind speed slowly decreases (Shea and others, Reference Shea2015b). Incoming shortwave radiation is maximal during the pre-monsoon (304 W m−2 on average for all pre-monsoons 2010–15; Table S3) and even higher than in summer because the cloud cover is not thick enough to significantly hinder SWin as it is the case during the monsoon (Adhikari, Reference Adhikari2012). In contrast, post-monsoon starts immediately after the sharp end of the monsoon (rapid transition from wet to dry conditions) and is characterized by conditions warmer but otherwise similar to winter, i.e. dry air, low precipitation and strengthening of western winds (Shea and others, Reference Shea2015b) (Fig. 3).
Irregularly, typhoons hit the highlands of Nepal bringing significant amounts of precipitation and snowfalls within a few days. The probability of the occurrence of such storms is the highest in October–November. They are created in the southeast part of Bay of Bengal between 8°N and 14°N and travel long distances northwest before turning northeast (Mishra and Panigrahi, Reference Mishra and Panigrahi2014). The last very severe cyclonic storms that hit Nepal were typhoons Phailin and Hudhud that brought intense snowfalls in the highlands with 85 mm w.e. recorded at Pyramid from 13 October 12:00 to 15 October 15:00 local time (LT), 2013 and 39 mm w.e. from 13 October 13:00 to 15 October 8:00 LT, 2014, respectively. Such very severe storms are episodic, but there is no consistency in periods of recurrence, and similar very severe storms were observed previously in November 1995 and October 1999 (Mishra and Panigrahi, Reference Mishra and Panigrahi2014). Typhoon Phailin was very active in eastern Nepal and accounted for 14% of the annual cumulative precipitation recorded at Pyramid from November 2012 to October 2013 (619 mm w.e.) in only 51 h (Fig. 3 and Table S3). Although wetter than the Everest region, the Langtang valley (~120 km west) was similarly impacted with 130 mm of precipitation recorded at Kyanging station (3862 m a.s.l.) from 13 to 15 October 2013 (14% of the annual amount) (Shea and others, Reference Shea2015b). In contrast, typhoon Hudhud was more powerful in central Nepal, where it was responsible for a human disaster: more than 50 people died in 2 days in Annapurna and Manaslu regions due to sudden snowfalls and avalanches. However, its effects were largely attenuated in the Everest region, and it only accounted for 6% of the 2013/14 annual cumulative precipitation at Pyramid (594 mm w.e.). The total monsoonal precipitation (June–September) accounted for 63% and 67% of the annual totals in 2012/13 and 2013/14, respectively, rising to 72% and 71% if excluding typhoons Phailin and Hudhud.
Although no typhoon hit Nepal during the post-monsoon 2015, the monsoonal precipitation only accounted for 57% of the 2014/15 annual precipitation. This unusual distribution of precipitation was due to unusually wet winter and pre-monsoon in 2015. Indeed, from January to March 2015, active westerly depressions regularly brought large amounts of snow in the highlands of Nepal. Following this wet winter, local convection was able to mobilize moisture available at the surface or in the lower atmosphere with increasing incoming shortwave radiation and air temperature resulting in significant amounts of precipitation in the mountains during the pre-monsoon, especially in April 2015 (Fig. 3).
Compared with the last 3 years of our study period, there were extremely contrasted seasons with more than 90% of the annual precipitation falling during the monsoon in the years 2010/11 and 2011/12 (Table S3). However, it is important to keep in mind that precipitation between November 2010 and November 2012 was reconstructed from a Pyramid precipitation record using a tipping bucket known to systematically undercatch solid precipitation (Fig. S1), especially in a windy environment. Consequently, it is likely that non-monsoon precipitation has been underestimated leading to an overestimation of the share of monsoon precipitation in the annual total.
Looking at interannual variability of the meteorological variables (Table S3), 2010/11 was a cold year, with maximal annual precipitation. The year 2011/12 was a dry year, with still an above-average humid monsoon. The year 2012/13 was the warmest year of our study period, characterized by a very high sum of daily positive temperature. The year 2014/15 was the coldest year with the highest shortwave radiation of our study period, but with low precipitation, especially during the monsoon, which was extremely weak in terms of precipitation.
4.2. South-to-north horizontal gradient of precipitation
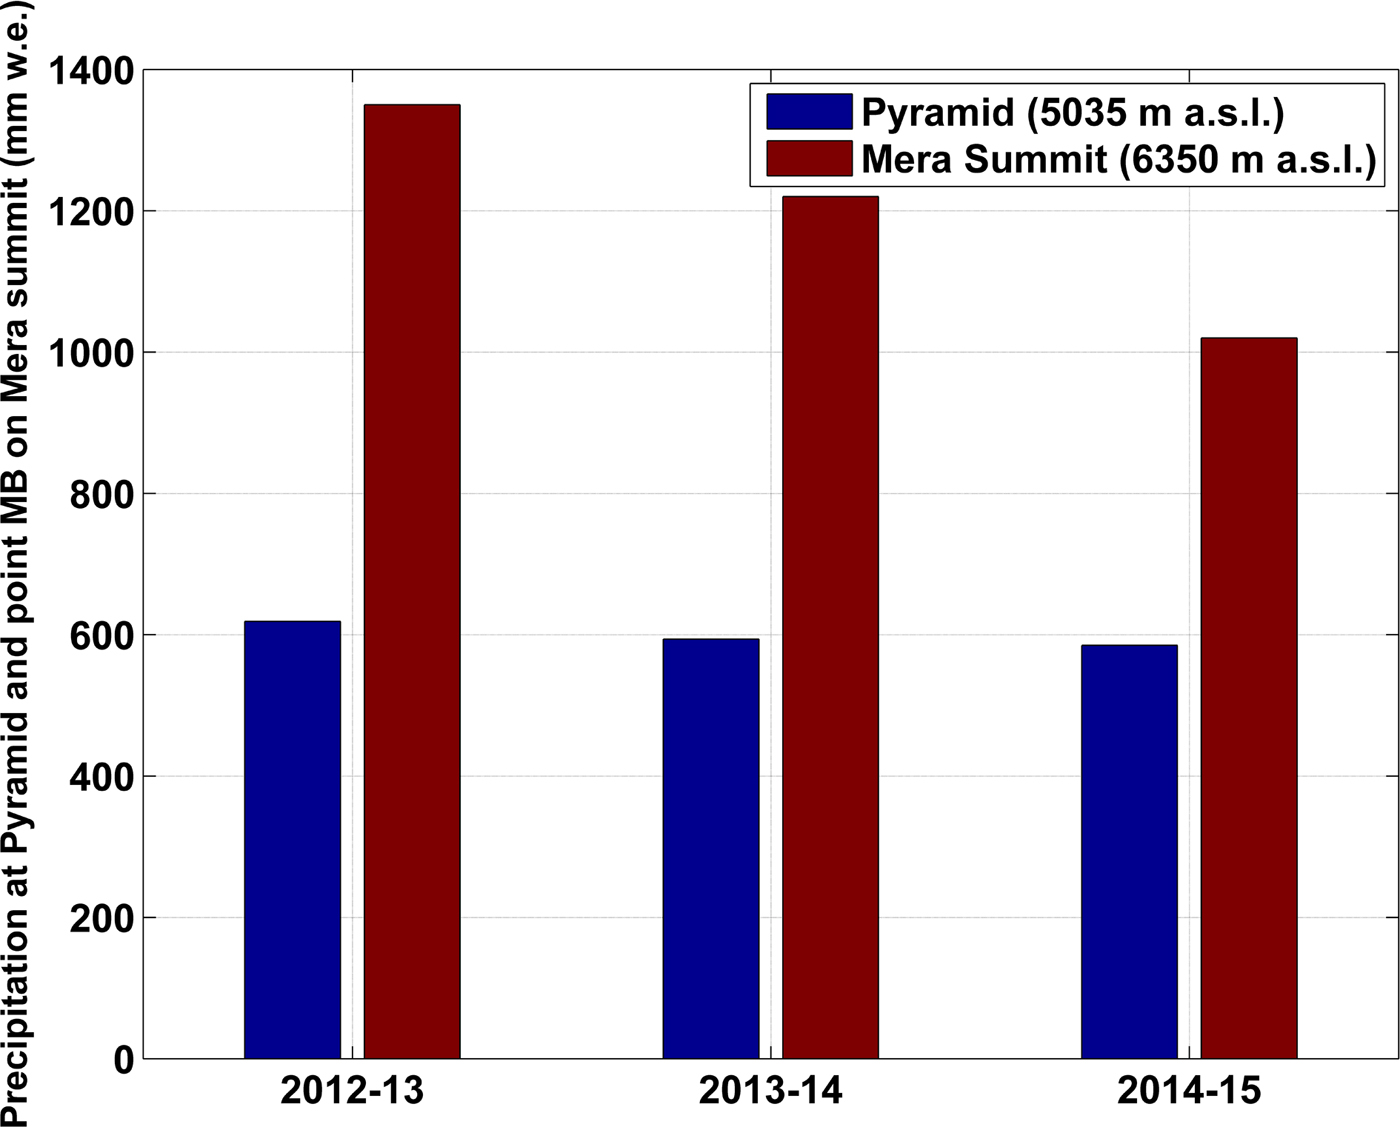
A consequence of the monsoonal orographic rain is a strong horizontal south-to-north gradient of precipitation across the range from its rain-drenched southern flank to the semiarid Tibetan Plateau (Bookhagen and Burbank, Reference Bookhagen and Burbank2006; Collier and Immerzeel, Reference Collier and Immerzeel2015). Our measurements allow a first-order quantification of this precipitation gradient over the Everest region. Figure 4 compares the annual precipitation recorded at Pyramid (5035 m a.s.l.) for the period 2012–15 with the annual or summer point MB recorded at the highest elevation site on Mera Glacier in an elevation of 6350 m a.s.l., located 29 km south of Pyramid. This site is close to Mera summit and due to its exposed location at a very high altitude, it is submitted to extremely reduced melting but significant ablation through wind erosion mainly during windy seasons (i.e. all seasons except monsoon; Wagnon and others, Reference Wagnon2013). Consequently, the lower limit of the total annual accumulation at this site can be estimated from whichever is greater in a certain year, either the summer point MB (measured usually from April to December) or the annual point MB (measured usually from December to December). This annual or seasonal maximum point MB recorded at 6350 m a.s.l. can thus be considered as the lower limit of the annual precipitation falling on Mera Glacier as it excludes any ablation processes that may have taken place between the measurements. Here, we intentionally limit our analysis to a 3-year period to avoid using less reliable reconstructed values of Geonor precipitation at Pyramid (before December 2012). On average over the 3 years, there is at least a 50% depletion of precipitation between Mera summit and Pyramid (Fig. 4), corresponding to a south-to-north gradient of precipitation of −21 mm km−1 or a −2% km−1. We do not account for any vertical gradient of precipitation between 5035 and 6350 m a.s.l., for the first-order estimation of this horizontal south-to-north gradient. Indeed, above 2500 m a.s.l. in the Everest region, Salerno and others (Reference Salerno2015) observed that precipitation exponentially decreases with elevation and their Figure 5a suggests that there is no strong vertical gradient of precipitation above 5000 m a.s.l. However, the true horizontal gradient is likely to be even higher than the gradient estimated in this study, because our method only allows approaching a lower limit for precipitation at Mera summit, and because we are considering a zero vertical gradient of precipitation between 5035 and 6350 m a.s.l., although it is probably slightly negative.
Comparison between the annual precipitation (blue histograms) recorded at Pyramid (5035 m a.s.l.) and the lower limit of annual accumulation falling at 6350 m a.s.l. on Mera Glacier (red histograms) assessed as the maximum value between summer and annual point MB measured at this site. 2012/13, 2013/14 and 2014/15 correspond to measurements performed at Mera summit for the periods 21 April 2013–20 November 2013, 02 April 2014–10 December 2014 and 10 December 2014–09 December 2015, respectively.
4.3. Mass balance
4.3.1. Annual and cumulative glacier-wide MBs of Changri Nup, Pokalde and Mera Glaciers
The annual glacier-wide MBs B a of Changri Nup, Pokalde and Mera Glaciers since October 2010, November 2009 and November 2007 are presented in Table 3. The annual point MBs as a function of altitude derived from the field measurements for the period 2010–15 are shown in Figure 5. The measurements on Mera Glacier before 2010 are available in Figure 5 in Wagnon and others (Reference Wagnon2013). Figure 6 shows the annual and cumulative MBs for these three glaciers.
First four panels: annual (2010–12, 2012/13, 2013/14 and 2014/15; (a–d), respectively) point MB (triangles, squares and dots) as a function of altitude on Pokalde (green), Changri Nup (red) and Mera (blue) glaciers. Dark and light blue correspond to measurements on Mera and Naulek branches of the Mera Glacier, respectively. The stakes were covered by snow and not visible on Pokalde and Changri Nup Glaciers in autumn 2011, and thus, the b a measured for 2010–12 was divided by 2 to obtain the annual mean for that period, and displayed in (a). The linear regression lines are also shown (red, green, dark blue and light blue lines for Changri Nup (CN), Pokalde (P), Mera (M) and Naulek (N), respectively) with their respective r 2 (over the ablation area), used to derive the annual glacier-wide mass-balance B a and mass-balance gradient over the ablation areas (note that in 2012/13 and 2013/14 on Mera and Naulek branches, the 2007–15 mean gradients are displayed because of a lack of visible stakes). These lines extend over the entire elevation range of each glacier. (e) Hypsometry of the three glaciers showing 10 m band areas.
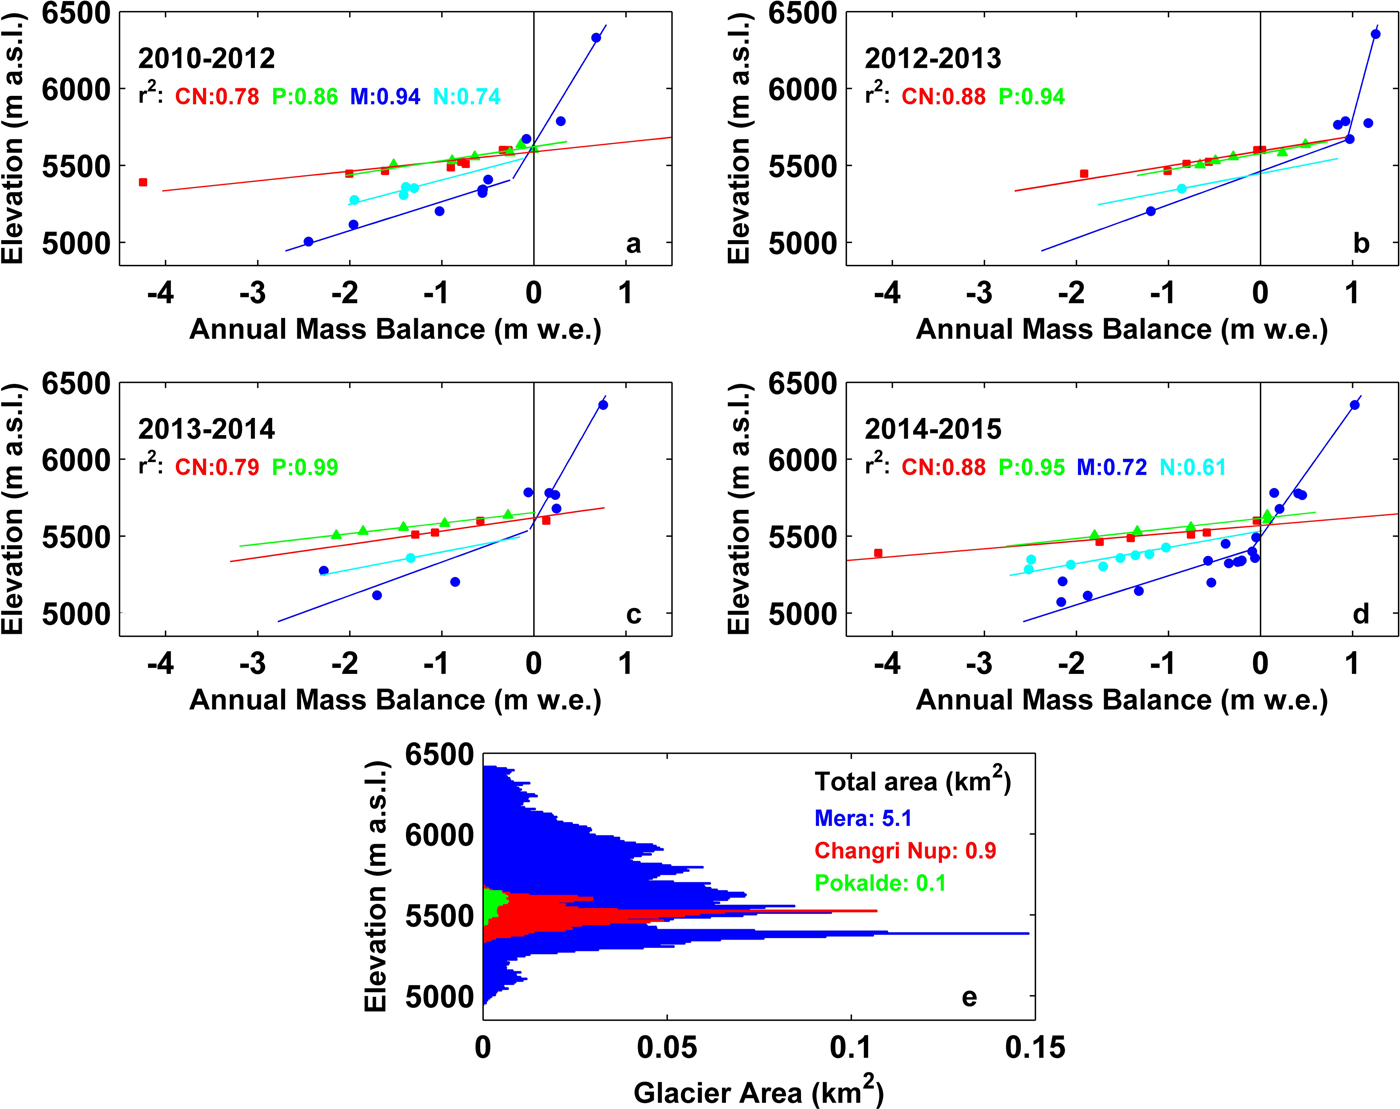
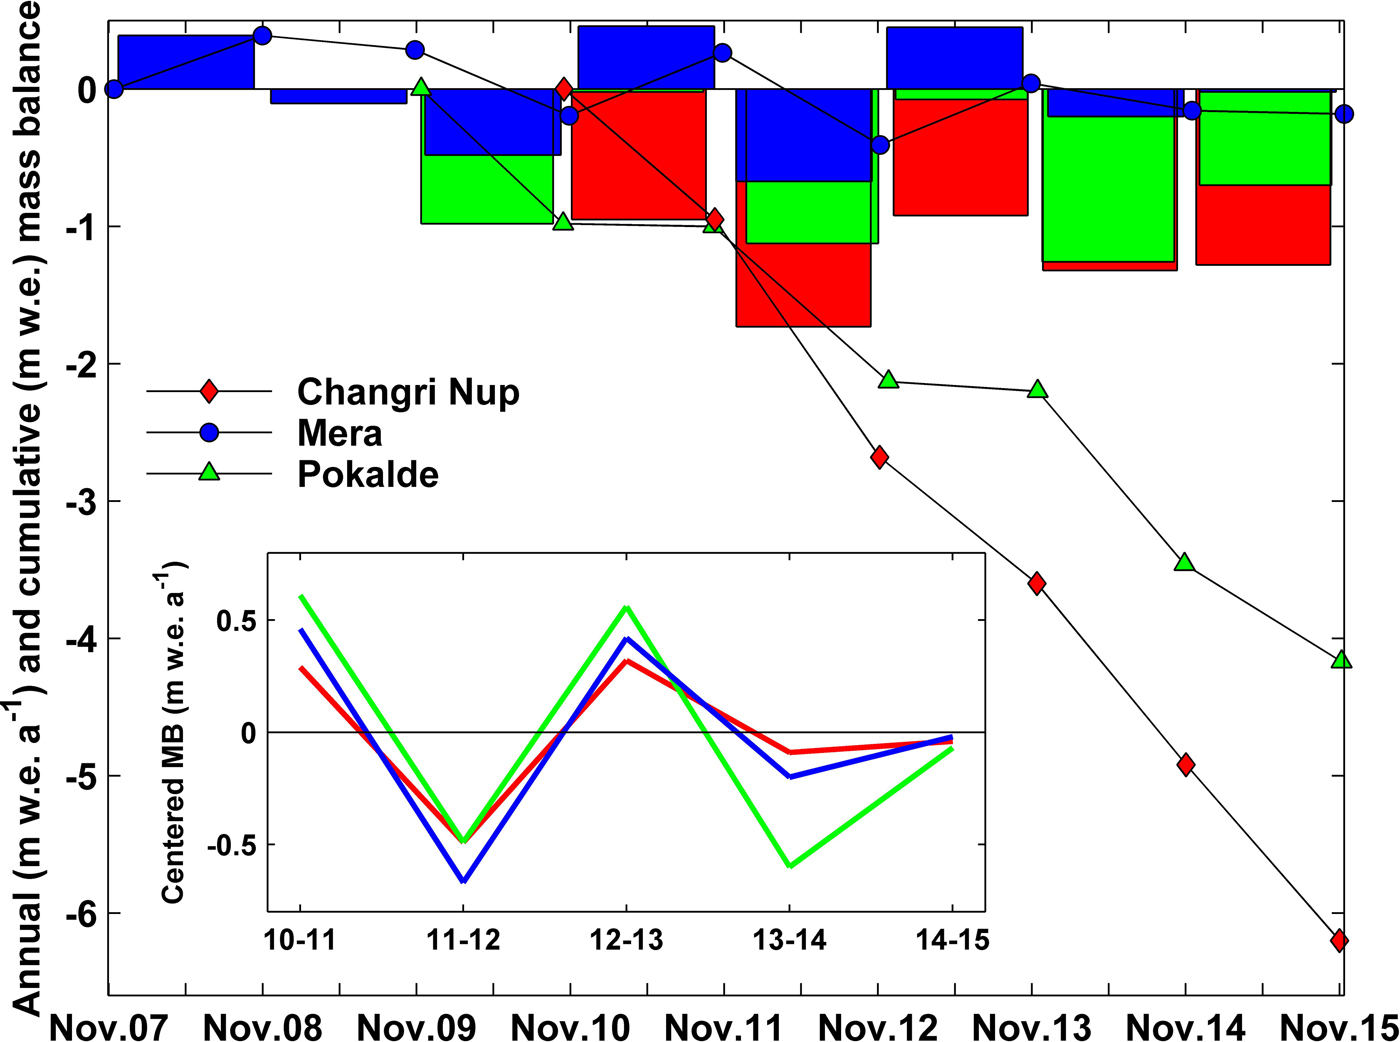
Annual (histograms) and cumulative (line with dots) MBs of Mera (blue), Pokalde (green) and Changri Nup (red) glaciers, respectively. The inset shows the annual centered MB (i.e. annual B a – 2010–15 mean B a) for every glacier, over the period 2010–15.
B a, ELA, AAR and MB gradients db/dz for Mera, Pokalde and Changri Nup Glaciers
On Mera Glacier, MB gradients are distinguished between Mera and Naulek branches (referred as Mera and Naulek subscripts) (Wagnon and others, Reference Wagnon2013). The mean and SD for every variable, and the annual centered MBs (annual centered B a = annual B a – mean value of B a over 2010–15; the mean B a for Pokalde and Mera Glaciers are −0.63 m w.e. a−1 and 0.00 m w.e. a−1 for Pokalde and Mera Glaciers, respectively) are also shown.
a Due to the lack of measurements in October 2011 where heavy snow falls had covered the stakes, 2010/11 and 2011/12 B a was obtained from the 2010–12 MB (B a (2010–12) = B a (2010/11) + B a (2011/12) = −2.68 m w.e; and applying a regression equation between the Changri Nup and Mera annual centered MBs between 2012 and 2015 (r 2 = 0.97).
b Mean value over the two-year 2010–12 period.
c Calculated by the difference between 2010–12 and 2011/12 glacier-wide MBs [B a (2010/11) = B a (2010–12) – B a (2011/12)], due to a lack of measurements in October 2011. The 2010–12 MB has been calculated following the method described in Section 3.2.
d Applying a 2007–15 mean gradient because not enough stakes were visible.
Changri Nup Glacier had the most negative MB of all three studied glaciers (mean B a = −1.24 ± 0.27 m w.e. a−1 for 2010–15), with a cumulative mass loss of −6.21 m w.e. compared with −0.02 and −3.15 m w.e. for Mera and Pokalde Glaciers, respectively, between October 2010 and November 2015 (Table 3). The mass budget of Mera Glacier was balanced during 2007–15 (mean B a = −0.03 ± 0.28 m w.e. a−1), while Pokalde Glacier was losing mass (mean B a = −0.69 ± 0.28 m w.e. a−1) from 2009 to 2015 (Table 3).
The annual centered MBs (i.e. annual B a – mean B a from 2010 to 2015 for every glacier) show relatively similar values. Thus, interannual MB fluctuations are similar between all three glaciers, regardless of their size, and location inside the mountain range (Table 3; Fig. 6) indicating that the MB of these three glaciers responds to a common regional climate signal. Such consistency has already been observed for Mera and Pokalde glaciers (Wagnon and others, Reference Wagnon2013) and for some glaciers located in the European Alps (Huss and others, Reference Huss, Hock, Bauder and Funk2010; Vincent and others, Reference Vincent2017).
4.3.2. Geodetic MB of Changri Nup Glacier
The mean surface elevation change of Changri Nup Glacier between 2009 and 2015 was −7.91 m, corresponding to a glacier-wide MB of −1.11 ± 0.20 m w.e. a−1 (considering 850 kg m−3 as the density assumption suggested by Huss (Reference Huss2013) and 6.06 years as the exact time interval between 1 November 2009 and 22 November 2015). This geodetic MB for 2009–15 is in good agreement with the field-based MB (−1.11 ± 0.20 vs −1.24 ± 0.27 m w.e. a−1). We note that they cover slightly different periods (2009–15 vs 2010–15), and are therefore not directly comparable.
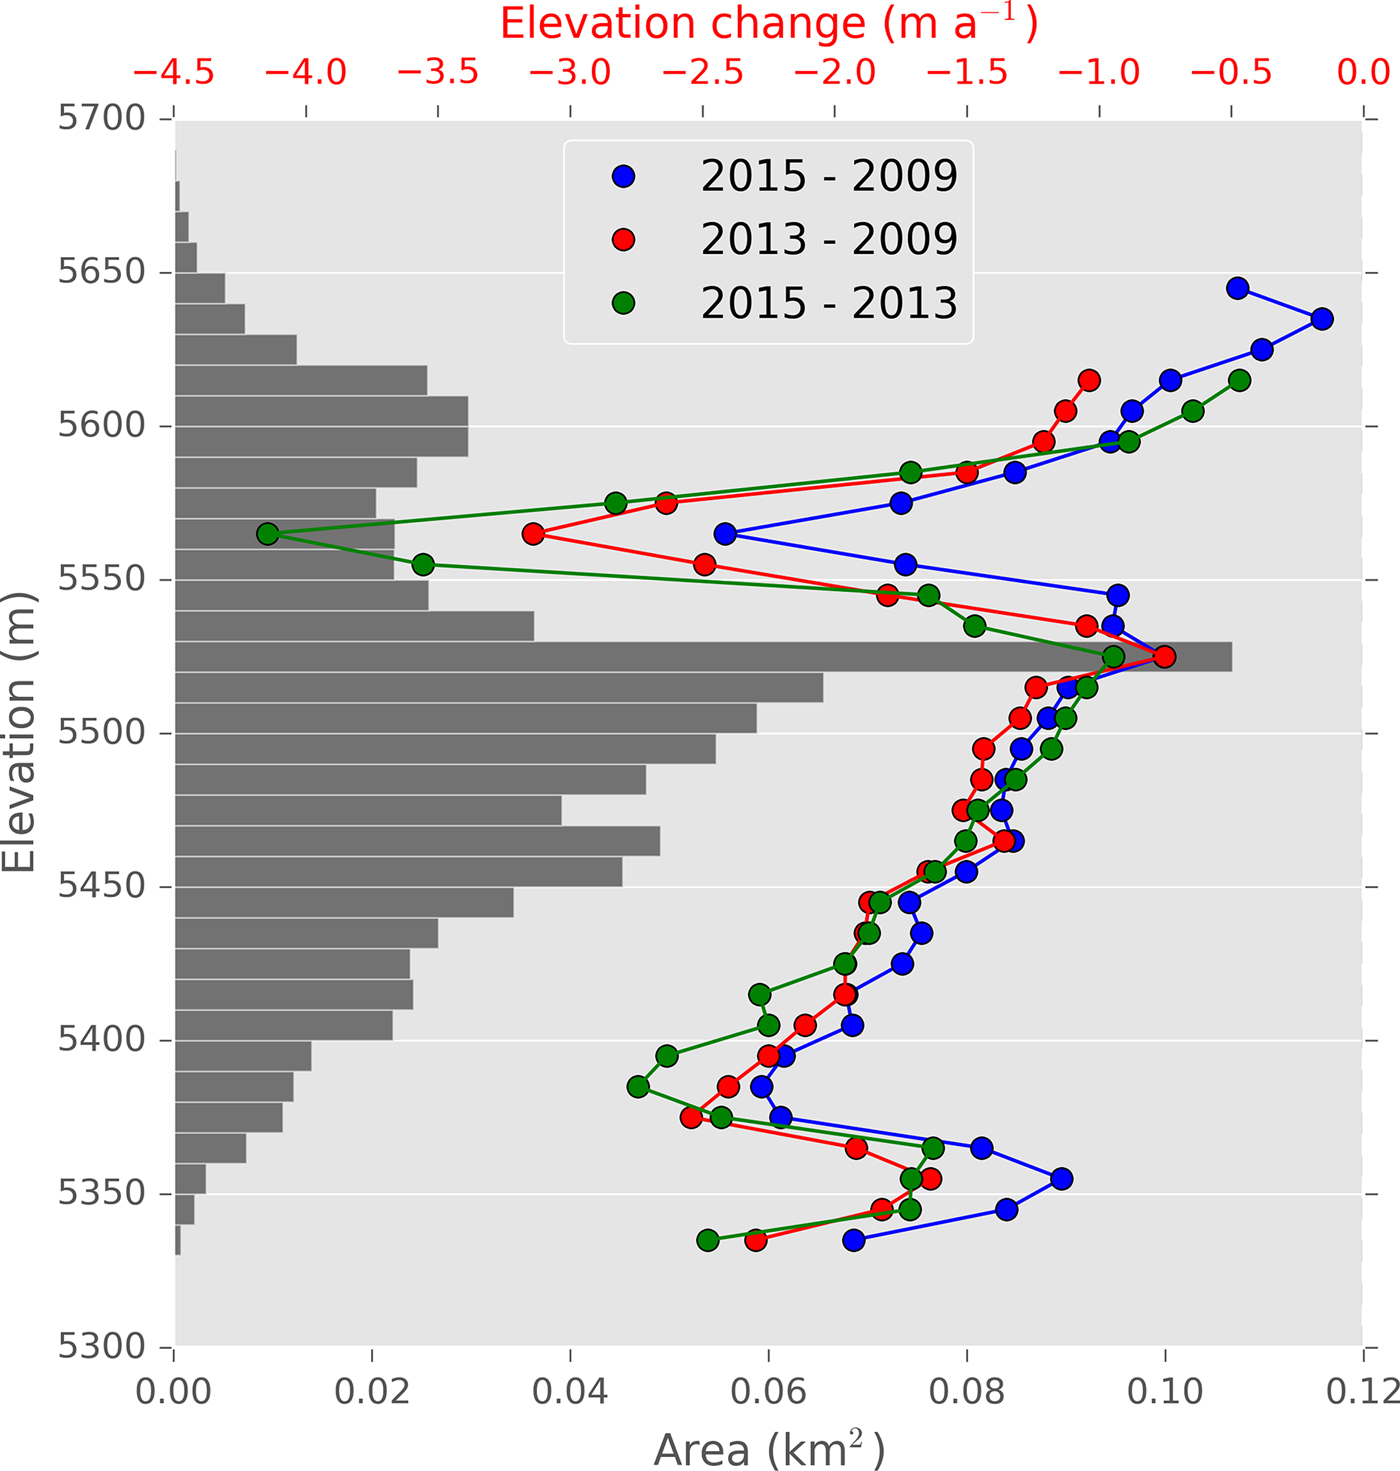
The area of the glacier was 0.96 ± 0.01 and 0.89 ± 0.003 km2 in 2009 and 2015, respectively. Higher thinning rates are observed in the lower part of the glacier (Fig. 7). The surprisingly high thinning rate ~5570 m a.s.l. (thinning rate of ~3 m a−1 or more) is a robust feature also visible during the other two periods (2009–13 and 2013–15, Fig. 7). This high thinning rate is mainly due to a retreat of an ice cliff (Fig. S2). There are unexpectedly less negative thinning rates below 5370 m a.s.l. compared with those observed immediately above this altitude. They are likely due to the insulating effect of the debris cover on the lowermost part of the otherwise debris-free glacier (Fig. 2).
Hypsometry and elevation change as a function of elevation of Changri Nup Glacier for the periods 2009–13, 2009–15 and 2013–15.
The good agreement between in situ and geodetic MB is promising and suggests that the present field measuring network is able to properly capture the spatial variability of the MB (Zemp and others, Reference Zemp2013). Nevertheless, we must keep in mind that both methods do not accurately sample some parts of the glacier. Such areas are, for example the retreating cliff at 5570 m a.s.l. (Fig. S2) responsible for the strong thinning rate observed in Figure 7 and the areas located immediately below the north-facing steep cliffs originating from the west-east Lobuche ridge (Fig. 1 and Fig. S2), and potentially threatened by avalanches (no stakes in this area and voids in the DEM). As a consequence, we cannot completely rule out the possibility that the glaciological glacier-wide MB of Changri Nup Glacier might be slightly biased, due to a poor estimation of the ablation at 5570 m a.s.l. and of the accumulation in these avalanche-fed areas.
4.3.3. Vertical MB gradients
The mean vertical MB gradient of 1.47 m w.e. (100 m)−1 a−1 of Changri Nup Glacier is close to that observed on Pokalde Glacier (1.37 m w.e. (100 m)−1 a−1) and much steeper than those of Mera or Naulek branches (0.46 and 0.87 m w.e. (100 m)−1 a−1, respectively) (Fig. 5). A striking feature for Changri Nup Glacier is the large interannual variability of this gradient (SD of 0.38 m w.e. (100 m)−1 a−1), with an extremely steep gradient (1.98 m w.e. (100 m)−1 a−1) in 2014/15 (Table 3).
We can separate these glaciers into two categories: Naulek and Mera branches of the Mera Glacier on one side, and the Pokalde and Changri Nup Glaciers on the other side. Within each category, no significant or systematic difference of MB as a function of elevation is observed (Fig. 5 and Fig. S3c for the pair Mera–Naulek, Fig. S3d for the pair Changri Nup–Pokalde). However, when we compare a glacier from one category to a glacier of the other category, we observe a rather similar point MB close to the ELA, but a significantly increasing mass loss with decreasing altitude for Changri Nup and Pokalde glaciers compared with Mera and Naulek branches, with a difference at the snout sometimes higher than 3 m w.e. a−1 (Fig. 5 and Fig. S3a, b, e, f).
4.3.4. ELA and AAR
The ELAs for Changri Nup and Pokalde glaciers are roughly similar, with mean values from 2012 to 2015 as high as 5594 and 5615 m a.s.l., respectively (Table 3). Over the same 3-year period, Mera Glacier has a lower ELA equal to 5480 m a.s.l. in agreement with its reported balanced conditions. The mean AARs highlight more differences between these three glaciers over the 2012–15 period (AAR = 0.12, 0.24 and 0.68 for Changri Nup, Pokalde and Mera Glaciers, respectively; Table 3). The accumulation areas of the small Changri Nup and Pokalde glaciers are indeed very limited compared with their total areas. This is even more pronounced for Changri Nup Glacier, which has a mean AAR half of that of Pokalde Glacier, although the total area of the former is nine times larger than that of the latter for a similar maximum elevation (5690 m a.s.l.). This means that the ablation area is comparably larger on Changri Nup than on Pokalde Glacier, and the entire glacier is reduced to an ablation area (AAR almost equal to 0; Table 3) in some years, for example in 2013/14.
4.3.5. Seasonal MB
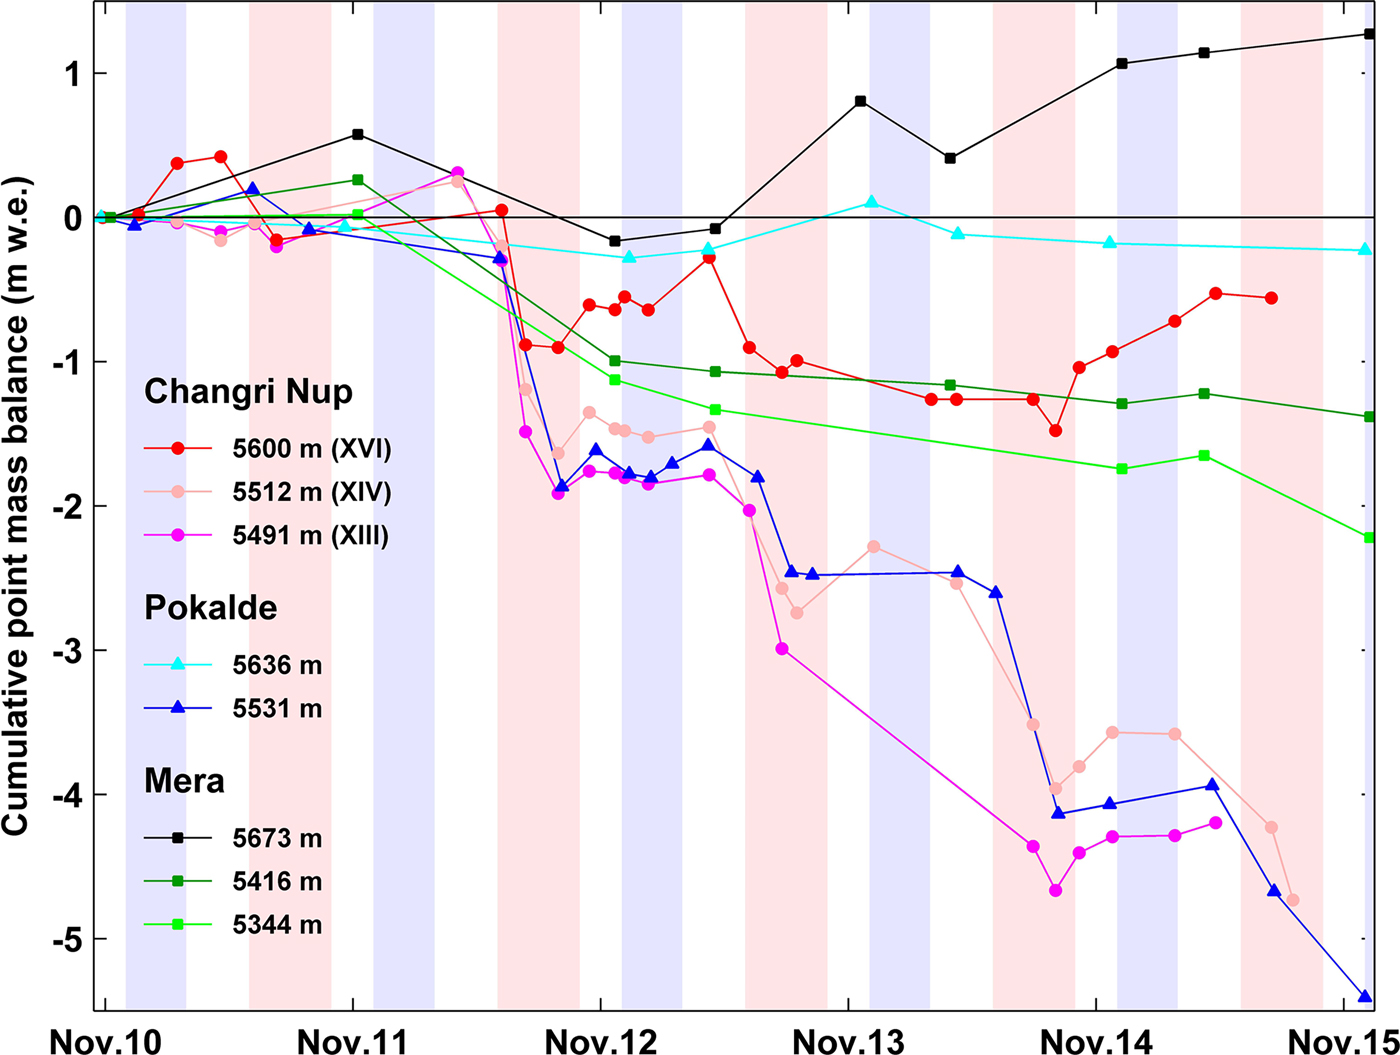
Figure 8 shows the cumulative point MB recorded at some stakes located between 5344 and 5673 m a.s.l. on Changri Nup, Pokalde and Mera glaciers between October 2010 and December 2015. Winter is usually characterized by dry air and much reduced precipitation explaining why accumulation is insignificant or at most small like during the relatively wet winter 2015 (Table S3; Fig. 8). On high-altitude areas and slopes exposed to strong winds (i.e. stakes at 5673 and 5636 m a.s.l. on Mera and Pokalde glaciers, respectively, Fig. 8), melting is very limited due to mostly negative snow/ice temperatures, but surface erosion and sublimation can be high enough in winter to be responsible for a non-negligible ablation, e.g. in winters 2011/12 or 2013/14 (Fig. 8) as already observed by Wagnon and others (Reference Wagnon2013). Remobilized snow is likely sublimated in the atmosphere; therefore, wind erosion is an efficient ablation process on wind-exposed surfaces, especially in post-monsoon, winter and pre-monsoon. On Changri Nup Glacier, this effect is much reduced because this glacier is located in a wind-protected environment surrounded by high ridges of the surrounding summits above 6000 m a.s.l. (e.g. Lobuche peak, Fig. 2). Overall, point winter MB is close to zero at all elevations suggesting that summer is the key season controlling the annual MB of Nepalese glaciers. Indeed, during this season, these glaciers experience maximal ablation in their lower areas and simultaneously important accumulation in their upper part (e.g. Mera Glacier, Fig. 8), which is why they are often called ‘summer-accumulation-type glaciers’ (Ageta and Higuchi, Reference Ageta and Higuchi1984). Below 5600 m a.s.l., ablation is strong and prevails over accumulation during monsoon (i.e. summer). As already indicated in Section 4.3.3., Mera Glacier has a different behavior from the other two glaciers, losing much less mass at similar elevations in the ablation zone (Fig. 8).
Cumulative point MB recorded at different stakes on Changri Nup (lines with dots), Pokalde (lines with triangles) and Mera (lines with squares) glaciers between October 2010 and December 2015. In legend are the stake elevations and the names of the Changri Nup stakes (Fig. 2). Blue and pink-shaded areas highlight the winter (DJF) and summer seasons (JJAS), respectively.
5. DISCUSSION
5.1. Comparing the vertical gradients of MB of the three monitored glaciers
The gradient db/dz is an important quantity to characterize the climatic setting of a glacier, and is usually steeper for glaciers with a large mass turnover typical for wet climates, and reduced for glaciers located in drier and colder regions (Oerlemans, Reference Oerlemans2001). Overall, the vertical MB gradient is mainly controlled by the decrease of air temperature with elevation, the vertical gradient of accumulation (depending on the precipitation gradient and phase) and the vertical changes of albedo (with the resulting influence on the absorption of incoming shortwave radiation) (Oerlemans and Hoogendoorn, Reference Oerlemans and Hoogendoorn1989). Kuhn (Reference Kuhn1979) showed that this gradient decreases proportionally to the duration of the ablation season from maximum in the tropics (>2 m w.e. (100 m)−1 a−1) (Rabatel and others, Reference Rabatel2013) to minimum in dry climates (0.3 m w.e. (100 m)−1 a−1) with typical values of 0.6–0.9 m w.e. (100 m)−1 a−1 observed in the Alps (Zemp and others, Reference Zemp, Hoezle and Haeberli2009), in Scandinavia (Rasmussen, Reference Rasmussen2004) or in Western Himalaya (Azam and others, Reference Azam2016).
Here, we observe an unusual pattern where Mera Glacier, although located in a wetter climate (Fig. 4), has a vertical MB gradient that is less steep than that of the Pokalde or Changri Nup glaciers. The latter have steep gradients close to those of tropical glaciers (Table 3), although their ablation season does not exceed half a year. Indeed, Pokalde and Changri Nup glaciers have more negative point MB than Mera Glacier at similar altitudes below the ELA (Fig. 5 and Fig. S3). This difference of point MB between glaciers cannot be explained by a difference in the duration of the ablation season or in temperature lapse rate, nor by a difference in incoming shortwave radiation, which are most likely rather similar on the three glaciers given that they are all north oriented and located not far away from each other (~30 km). However, it may be due to either increased snow accumulation or reduced ablation on the Mera Glacier ablation zone during the monsoon. Since the climate over this glacier is much wetter than in the inner part of the range (see Section 4.2), both effects are likely. Indeed, over the course of the monsoon, even though it sometimes rains up to the ELA (Wagnon and others, Reference Wagnon2013), the snow cover over the ablation zone is likely to be thicker on Mera Glacier than on the other glaciers where bare ice is exposed for longer time periods and at higher altitudes. As a consequence, the MB over the ablation zone of Mera Glacier is less negative than over those of Pokalde or Changri Nup glaciers because there is more accumulation, and the ablation is reduced mainly due to the albedo feedback on the shortwave radiation. In addition, due to their comparatively small areas, the ablation over Pokalde and Changri Nup Glaciers is likely enhanced by the longwave radiation emitted by the surrounding ice-free environment (dark rocks), which can have surface temperatures above 0°C.
5.2. A contrasted pattern of glacier-wide MB over the Everest region
Over the last 5 years (2010–15), the rate of mass loss of the three monitored glaciers located in different parts of the same Everest region (Fig. 1) varies strongly from balanced conditions for Mera Glacier to extremely rapid mass wastage for Changri Nup Glacier (Table 3; Fig. 6). The observed MB differences cannot be explained by the aspect (all three glaciers are facing northwest to northeast), nor by the slope (Pokalde Glacier is much steeper than the other two glaciers but its mass loss is intermediate), nor by the debris cover (all are almost entirely debris free) (Table 1). They cannot be explained either by the glacier size because Changri Nup Glacier, whose area is intermediate, exhibits the largest mass loss. The different glacier elevation ranges (Table 1) and hypsometry curves (Fig. 5) and in particular, the area of the glacier located at the highest elevations is more likely explanatory factors. Indeed low-maximum-elevation glaciers, such as Pokalde or Changri Nup Glacier, experience ablation over the entire surface area with low-albedo bare ice exposed to their highest elevations and the accumulation zone reduced almost to zero in some years (Table 3). These glaciers are imbalanced with the present climate as their accumulation area is too reduced to regenerate the glacier (Pelto, Reference Pelto2010), and the albedo feedback on MB is strong leading to extremely negative MBs. On the other hand, Mera Glacier is located high enough to always accumulate snow, even during exceptional years when the ELA migrates to very high elevations (e.g. ELA = 5800 m a.s.l. for Mera Glacier in 2011/12; Table 3), explaining why this glacier never experiences extremely negative annual mean MBs.
Pokalde and Changri Nup glaciers exhibit a similar maximum elevation (5690 m a.s.l.) and their ELAs are also at similar altitudes, but Changri Nup Glacier extends to lower elevations and thus has a wider ablation area than Pokalde Glacier (as confirmed by its lower AAR of 0.12 vs 0.24 for Pokalde Glacier) explaining why it proportionally loses more mass. Consequently, it is even more imbalanced with the present climate.
Beyond these considerations regarding glacier characteristics and geometry, the main reason why Mera Glacier is losing mass more slowly than Pokalde and Changri Nup glaciers comes from their very different vertical gradients of the point MB (see Section 4.3.1, Fig. 5 and Fig. S3). Indeed, if we apply the mean Mera db/dz (0.46 m w.e. (100 m)−1 a−1) to Pokalde and Changri Nup glaciers from their measured ELAs (Table 3) for the period 2012–15 (periods with annual values available for the three glaciers), their glacier-wide MBs would become less negative by 0.45 and 0.76 m w.e. a−1, respectively, i.e. ~2/3 of the B a for both glaciers.
The reason for the observed difference in MB gradients is unclear but could be related to a difference in accumulation (see Section 5.1). Pokalde and Changri Nup glaciers are located in a local climate at least twice as dry as that of Mera Glacier (Fig. 4). Consequently, they are experiencing less snowfall, therefore less accumulation and simultaneously an enhanced ablation via the albedo feedback. Pokalde and Changri Nup glaciers are thus losing more rapidly mass than if they had less steep vertical MB gradients.
In addition, precipitation trends recorded over the last two to three decades are potentially different between the dry inner part of the mountain range where Salerno and others (Reference Salerno2015) observed a sharp decreasing trend at high elevation, and the southern foothills of the Dudh Koshi basin where no significant precipitation trend is observed (Nepal, Reference Nepal2016). This would lead to a progressive steepening of the horizontal south-to-north precipitation gradient in time and contribute to the contrasted pattern observed in glacier-wide MB over the Everest region.
The large glacier-wide MB spatial variability observed over relatively short distances (from a few to some tens of km) makes the assessment of the region-wide MB difficult when using exclusively field-based measurements conducted on a very limited number of glaciers, especially when the region is submitted to strong horizontal climatic gradients as in the Everest region. Thus, averaging scattered and sporadic in situ MB measurements, over an entire region or even a whole mountain range must be done with great caution, and even then, the resulting region-wide MB is likely not representative of the given region or mountain range. This has been already pointed out in the Himalayas, where MB compilations from in situ data are known to be negatively biased probably because, for practical reasons, the monitored glaciers are usually small in size and found at low elevations (Pokalde, Changri Nup or AX010 glaciers) (Fujita and Nuimura, Reference Fujita and Nuimura2011; Gardner and others, Reference Gardner2013; Wagnon and others, Reference Wagnon2013). Assessing region-wide MB using geodetic techniques that are evaluated with the field-based measurements is thus more reliable and recommended.
5.3. Meteorological variables and MB
We compare the annual glacier-wide MBs of the three monitored glaciers (Table 3) and the annual or monsoonal meteorological variables (Table S3) to explore the relationship between the MB and the local meteorology. To facilitate this comparison, the correlation matrices between these variables are given in Table S4. This analysis is strictly qualitative because of the short data series (5 years) preventing the correlations from being significant. At annual scale, B a of every glacier is first related with the precipitation and second with the RH and the longwave radiation. Unexpectedly, B a is barely related with air temperature but slightly better with the sum of positive daily temperature. When comparing the annual glacier-wide MBs with the monsoonal meteorological variables, the relationship becomes weaker with precipitation, and effectively improves with the air temperature or the incoming longwave radiation.
This qualitative analysis is consistent with the fact that MB depends on the ablation and the accumulation and has already been discussed based on detailed energy-balance studies conducted on glaciers located in other monsoon-affected regions of Asia, for example in the western Himalaya (Azam and others, Reference Azam2014) and the Tibetan Plateau (Mölg and others, Reference Mölg, Maussion, Yang and Scherer2012; Zhang and others, Reference Zhang2013). On the one hand, melting is controlled by the incoming longwave radiation, especially during the melting season usually spanning from April to the end of September. On the other hand, precipitation has a strong impact on the glacier-wide MB because in its solid form it is responsible for the accumulation, but also because it has a strong feedback on the shortwave radiation budget through albedo. The specific surface MB of the glaciers is therefore sensitive to the precipitation. Nevertheless, our present qualitative analysis needs to be complemented by an energy-balance approach to quantify the importance of each surface energy flux, and in turn the corresponding key meteorological variables controlling the MB of the glaciers and their vertical MB gradients.
5.4. Impact of typhoons on the MB of glaciers
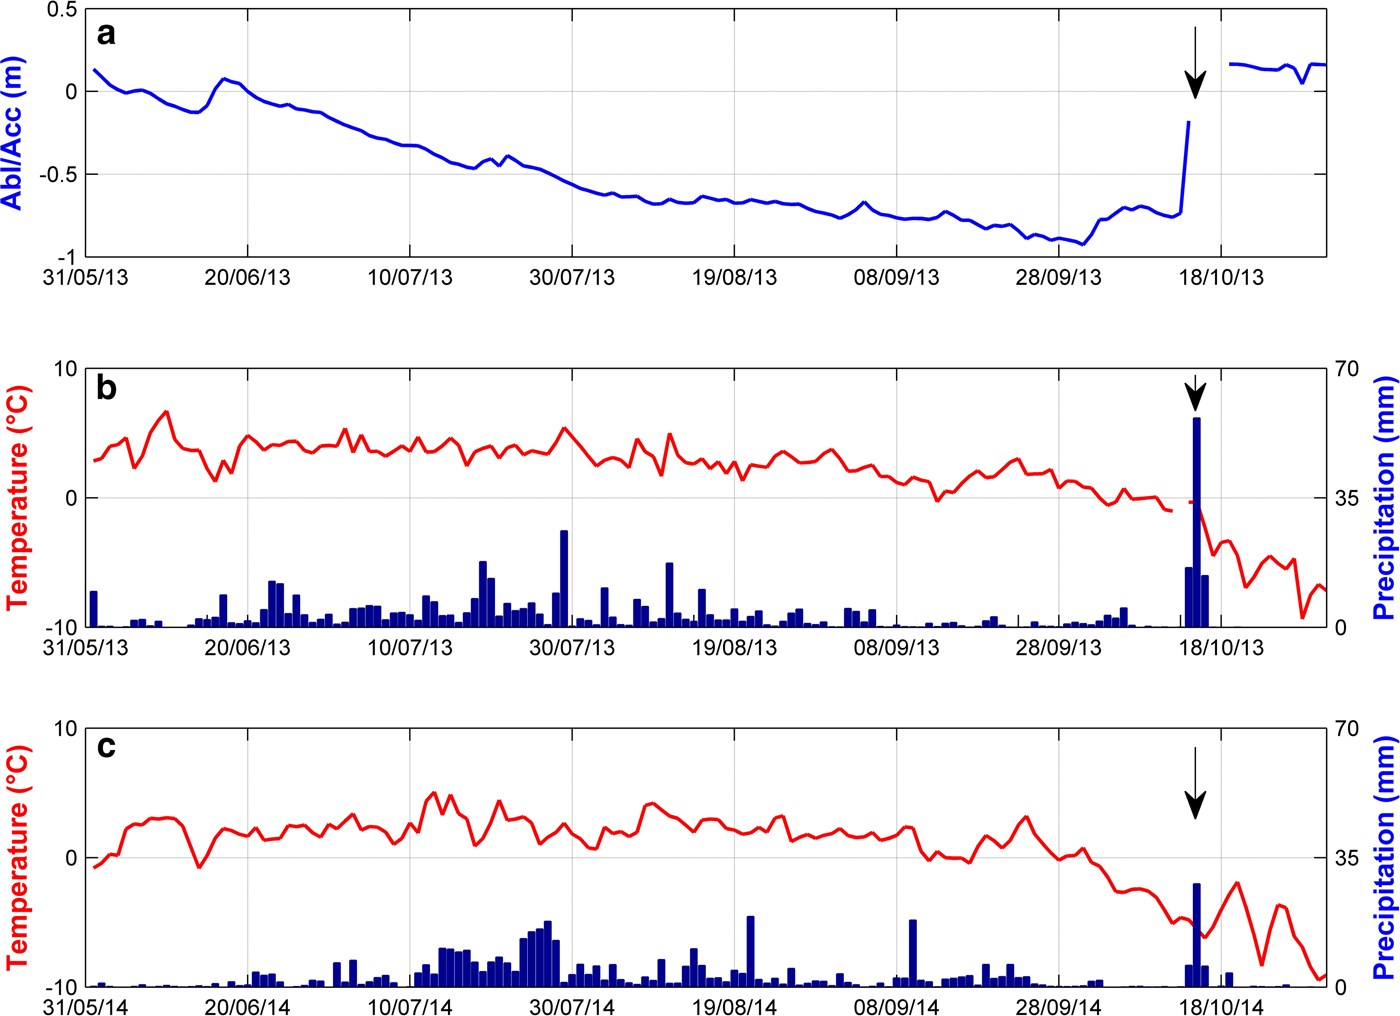
Figure 9 shows daily air temperature at the Changri Nup AWS and daily precipitation amounts at Pyramid from 1 June to 31 October for both of the years 2013 and 2014. Typhoon Phailin was responsible for a strong accumulation of snow at the Naulek AWS (5360 m a.s.l.) on Mera Glacier (1 m of snow in 48 h, from 13 October, 14:00 to 15 October 2013, 14:00 LT) followed by a strong drop in air temperature (Fig. 9). During our post-monsoon field trip from 14 to 23 November 2013, this typhoon-snow layer was easily recognizable in the field (clean thin round grains) and was gradually thicker with elevation from 0.8–1 m in the ablation area (density = 300 kg m−3) to 1–1.2 m at 5800 m a.s.l. (density = 300 kg m−3) and 1.5 m at the top of the glacier at 6350 m a.s.l. (density = 260 kg m−3). This allowed us to calculate the glacier-wide MB for 2012/13 with and without this snow layer (0.42 and 0.09 ± 0.28 m w.e., respectively). A similar analysis was not possible in 2014 because the snow layer deposited by typhoon Hudhud was hard to recognize, and this typhoon had a very limited impact on our study area anyway (Fig. 9). Typhoon Phailin had a similar but attenuated impact on Changri Nup and Pokalde Glaciers. On average, we measured a 0.6 m snow layer (density = 250 kg m−3) covering both glaciers during our 2–4 December 2013 field trip corresponding to a +0.15 m w.e. of the annual B a. It resulted in one of the least negative annual-specific MB of both glaciers, and one of the most positive B a on Mera Glacier (Table 3). The effect of such a rather short event (2 days) was thus sensitive on 2012/13 B a, and also on the following winter and pre-monsoon 2014. Indeed, the typhoon snow cover was sufficiently thick on the glaciers and on their surrounding moraines above ~5000 m a.s.l. to last over the whole winter and potentially delay the onset of the melting in the following pre-monsoon (Shea and others, Reference Shea2015b).
(a) Daily cumulated snow accumulation (positive) or ablation (negative) in m of snow or ice measured at the Naulek AWS (5360 m a.s.l.) from 1 June to 31 October 2013 (record not available in 2014). (b, c) Daily air temperature (red line) at the Changri Nup AWS and precipitation at Pyramid (blue histograms) from 1 June to 31 October for 2013 and 2014, respectively. The arrows indicate typhoon Phailin (13–15 October 2013) and Hudhud (13–15 October 2014).
6. CONCLUSIONS
Three debris-free glaciers of various sizes have been monitored for the last 5–8 years (2007–15) in the Everest region, central Himalaya. Their glacier-wide MBs, measured using the glaciological method, reveal a contrasted pattern. Mera Glacier (5.1 km2 in 2012) is located in the southern part of the region and its mass budget has been balanced over the last 5–8 years, whereas Pokalde (0.1 km2 in 2011) and Changri Nup glaciers (0.92 km2 in 2013), ~30 km further north in the drier inner part of the range, have been losing mass rapidly with a B a of −0.69 ± 0.28 m w.e. a−1 (2009–15) and −1.24 ± 0.27 m w.e. a−1 (2010–15), respectively. Even though the glacier area of Changri Nup Glacier does not exceed 1 km2, we were able to derive a 2009–15 glacier-wide MB with an uncertainty of 0.20 m w.e. a−1 by applying the geodetic method to 2009 SPOT5 and 2015 Pléiades satellite stereo images. We found a good agreement between the geodetic 2009–15 glacier-wide MB and the glaciological 2010–15 glacier-wide MB suggesting that our MB network is appropriate. However, due to some voids in DEMs in some avalanche-fed areas and considering that some fast retreating cliffs are not accounted for in the glaciological MB, we cannot totally rule out the possibility that glaciological MB might be slightly biased. Nevertheless, it is clear that this glacier loses mass extremely rapidly.
A comparison between the annual glacier-wide MBs and the annual or monsoonal meteorological variables recorded on Changri Nup Glacier and in its vicinity shows that there is a large sensitivity of the glacier MB to incoming longwave radiation and precipitation, especially when occasional severe cyclonic storms originating from the Bay of Bengal hit the highlands of Nepal. However, no detailed energy-balance study has been conducted so far and it is required to provide an accurate quantification of the climatic sensitivity of these summer-accumulation glaciers.
This contrasted pattern of MB over rather short distances (~30 km) is probably explained by two facts. On the one hand, it is related to the low maximum elevation of Pokalde and Changri Nup glaciers, both culminating at 5690 m a.s.l., an altitude frequently almost reached by the ELA. Due to their geometric characteristics, these glaciers have been far from steady state over the last years. On the other hand, the point MB observed at similar altitudes is very different between Mera Glacier and these two other glaciers. If we apply the vertical MB gradient observed at Mera Glacier to the other glaciers, the observed difference in glacier-wide MB between Mera and Changri Nup/Pokalde glaciers would be reduced by two-thirds. Given that the aspects of these glaciers are similar and that no significant differences in air temperature lapse rate or incoming radiation are expected over such short distances, one can conclude that the difference in glacier-wide MB is potentially driven by the strong horizontal across-range gradient in annual precipitation (steeper than −21 mm km−1 corresponding to −2% km−1). It leads to highly different vertical gradients of MB with point MBs of Mera Glacier significantly less negative below the ELA than those of the other two glaciers. In conclusion, glaciers located in the inner and leeward part of the range, submitted to an arid climate with a trend toward even drier conditions, are less balanced with the present climate than glaciers located in frontal position relatively to the monsoon influx, on the windward side of the range and receiving large amounts of precipitation, stable over time. Long-term observations of the glacier MB and the local meteorology combined with MB modeling are still needed to quantify the local and regional temperature and precipitation trends and their consequences on the glacier MB.
SUPPLEMENTARY MATERIAL
The supplementary material for this article can be found at https://doi.org/10.1017/jog.2017.30.
ACKNOWLEDGEMENTS
This work, based on a tremendous amount of fieldwork, would not have been possible without the help of Pyramid staff, porters, technicians, students and friends who are sincerely acknowledged here. We cannot list everybody, but people will recognize themselves. Three anonymous reviewers significantly contributed to improve this manuscript and are greatly acknowledged here. This work has been supported by the French Service d'Observation GLACIOCLIM, the French National Research Agency (ANR) through ANR-09-CEP-005-01-PAPRIKA, ANR-13-SENV-0005-04/05-PRESHINE, and has been supported by a grant from Labex OSUG@2020 (Investissements d'avenir – ANR10 LABX56). This study was carried out within the framework of the Ev-K2-CNR Project in collaboration with the Nepal Academy of Science and Technology as foreseen by the Memorandum of Understanding between Nepal and Italy, and thanks to contributions from the Italian National Research Council, the Italian Ministry of Education, University and Research and the Italian Ministry of Foreign Affairs. E.B. acknowledges support from the French Space Agency (CNES) through the TOSCA Top Glaciers project. SPOT5 HRG and Pléiades images were obtained thanks to the CNES ISIS program. The International Centre for Integrated Mountain Development is funded in part by the governments of Afghanistan, Bangladesh, Bhutan, China, India, Myanmar, Nepal and Pakistan. The views expressed are those of the authors and do not necessarily reflect their organizations or funding institutions.


 Open access