


Introduction
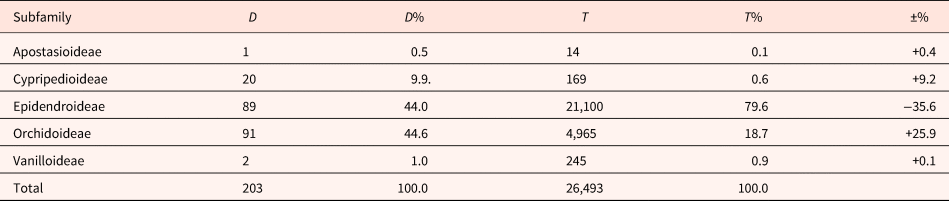
Orchidaceae is one of the most diverse flowering plant families globally, boasting approximately 750 genera and an estimated 26,470–28,237 species (Christenhusz et al., Reference Christenhusz, Fay and Chase2017; Govaerts et al., Reference Govaerts, Hind, Lindon, Chase, Baker, Lewis, Vorontsova, Nicolson and Willis2017). Evolutionarily, it stands as one old angiosperm family with its appearance estimated at around 100–120 mya (Givnish et al., Reference Givnish, Spalink, Ames, Lyon, Hunter, Zuluaga, Iies, Clements, Arroyo, Leebens-Mack, Endara, Kriebel, Neubig, Whitten, Williams and Cameron2015). Orchids can be found on almost every continent, except for the poles, and Sahara and Great Victoria deserts (Christenhusz et al., Reference Christenhusz, Fay and Chase2017). The orchid family is classified into five subfamilies, with Epidendroideae and Orchidoideae being the largest, comprising 21,100 and 4965 species, respectively. Vanilloideae, Cypripedioideae and Apostasioideae are represented by 245, 169 and just 14 species, respectively (Christenhusz et al., Reference Christenhusz, Fay and Chase2017).
Orchids have captured the interest of scientists and plant enthusiasts for over four centuries, owing to their vast variety in flower morphology and unique life history, such as deceptive pollination and mandatory symbiosis with a fungus for germination under natural conditions (Arditti, Reference Arditti1984; Micheneau et al., Reference Micheneau, Johnson and Fay2009; Schiff, Reference Schiff and Schiff2017).
The successful germination and development of orchids in vitro were initially described in the 20th century. Noël Bernard pioneered symbiotic methods in the first decade, followed by Lewis Knudson's introduction of asymbiotic methods in the second decade (Bernard, Reference Bernard1909; Knudson, Reference Knudson1921). Orchid species remain among the most challenging to propagate successfully from seeds. Knudson's experiments in the early 1920s revealed that for the successful asymbiotic seed germination and further development of most orchids, a minimum external carbon source is required. This necessity is attributed to the initial mandatory fully mycoheterotrophic stage of, presumably, all orchid species in field conditions (Bernard, Reference Bernard1899; Rasmussen, Reference Rasmussen1995; Merckx, Reference Merckx2013).
The asymbiotic germination process of orchid species exhibits high heterogeneity in terms of final germination (FG) success. Some species have been reported to readily germinate in distilled water (or water agar) without any carbon source, although their development is halted at the rhizoid stage before reaching the protocorm stage (Rasmussen, Reference Rasmussen1995; Oikonomidis et al., Reference Oikonomidis, Koutsovoulou and Thanos2020; Diantina et al., Reference Diantina, Kartikaningrum, McCormick, Millner, McGill, Pritchard and Mardarajan2023). The majority of orchid species require complex media for successful asymbiotic germination. However, for several, especially terrestrial species (e.g. Cephalanthera spp.), asymbiotic germination of mature seeds has been so far proven unsuccessful (Rasmussen, Reference Rasmussen1995; Yamazaki and Miyoshi, Reference Yamazaki and Miyoshi2006; Zhang et al., Reference Zhang, Li, Chen, Guo and Lee2020). The intricacy and heterogeneity observed in orchid seed germination in the lab may mirror the complexity of requirements for successful orchid seed germination and seedling establishment in nature, particularly under symbiotic conditions (Rasmussen, Reference Rasmussen1995; Rasmussen et al., Reference Rasmussen, Dixon, Jersákova and Těšitelová2015).
Orchid seeds, characterized by their microscopic sizes, were not observed until the 16th century. Official references to orchid seeds emerged in the literature in the mid-18th century, notably in the works of Conrad Gessner and Georg Everhard Rumphius (Kull and Arditti, Reference Kull and Arditti2002). Orchid seeds typically comprise a spindled-shaped, thin seed coat (testa) that encompasses the underdeveloped embryo. The embryos lack endosperm, cotyledons and a radicle, although a few exceptions, such as Bletilla striata, exhibit rudimentary cotyledons (Arditti, Reference Arditti1967). In certain cases, as in the genera Cephalanthera and Epipactis, another tight cell layer that encloses the embryo, known as the carapace, is also present (Veyret, Reference Veyret1969; Lee and Yeung, Reference Lee and Yeung2023). Ranging in size (longest dimension) between 150 and 6000 μm, with the majority falling between 300 and 800 μm, orchid seeds rank among the smallest in the plant kingdom (Movray and Kores, Reference Movray and Kores1995; Baskin and Baskin, Reference Baskin and Baskin2014).
Orchid seeds exhibit significant variation in terms of relative seed and embryo dimensions, testa cell morphology and colouration. Numerous orchid seed characteristics have been suggested to hold taxonomic importance for infrageneric identifications (Akçin et al., Reference Akçin, Ozdener and Akçin2009; Gamarra et al., Reference Gamarra, Ortúñez, Sanz, Esparza, Galán, Nimis and Vignes2010). Concerning seed and embryo dimensions, it has been proposed that the relative increase of air space inside the seed (with the embryo occupying a relatively smaller volume) is positively correlated with flotation time. This correlation suggests a potential adaptation to anemochory in orchid species, supported by both morphological and phylogenetic data (Diantina et al., Reference Diantina, McGill, Millner, Nadarajan, Pritchard and McCormick2020; Fan et al., Reference Fan, Chomicki, Hao, Liu, Xiong, Renner, Gao and Huang2020). The smaller size of seeds and embryos and the increased air space within the seed – a trait common among all mycoheterotrophic plants – have been considered a ‘consequence’ (or a ‘prerequisite’) of the transition from an autotrophic to a partially or fully mycoheterotrophic lifestyle (Leake, Reference Leake1994; Eriksson and Kainulainen, Reference Eriksson and Kainulainen2011). All these are also prevalent in the Orchidaceae family, which, notably, embraces a significant proportion of the fully mycoheterotrophic plants known today, accounting to 215 out of a total of 535 species (Merckx, Reference Merckx2013).
In a previous study on the genus Dendrobium (Prasongsom et al., Reference Prasongsom, Thammasiri, Pritchard and Thammasiri2016, Reference Prasongsom, Thammasiri and Pritchard2022), it was emphasized that the small size of seed alone is insufficient for categorizing a species into the sensu lato morphological or morphophysiological dormancy classes, according to Baskin and Baskin's (Reference Baskin and Baskin2014) definition. Consistent with these findings, our team has also observed variations in the germination behaviour of certain orchid species in relation to their relative embryo-to-seed (E:S) size (Oikonomidis and Thanos, Reference Oikonomidis and Thanos2020). The present study explores the relationships among seed structure, germination behaviour, phylogeny and four biotic and climatic variables (mycoheterotrophy level, growth form, climatic zone and habitat shadiness). It reveals the correlation between orchid seed architecture and germination behaviour. Based on the ecological preferences of the species, we suggest that the decrease in embryo size, relative to the overall seed length, is associated with the adaptation of different orchid lineages to shaded environments and their increased dependence on fungal symbiosis.
Materials and methods
The dataset of E:S and FG values
Among the most common data available for orchids are the dimensions of the seeds. In this study, the ratio of E:S is used to investigate the relationship between seed morphology and germination behaviour of 203 orchid species across the globe. Although in previous studies (Arditti and Ghani, Reference Arditti and Ghani2000; Diantina et al., Reference Diantina, McGill, Millner, Nadarajan, Pritchard and McCormick2020; Fan et al., Reference Fan, Chomicki, Hao, Liu, Xiong, Renner, Gao and Huang2020), researchers have employed air space (the free space between the embryo and the outer testa of the seed) to investigate seed trait evolution, we have chosen to focus primarily on the study of the E:S. The calculation of air space for orchid seeds is based on the generalization of the shape of orchid seeds, and thus, slight mistakes in the values might be common.
Data for both morphology (primarily dimensions of seeds and embryos) and seed germination (FG) were collected for a total of 203 species belonging to 71 genera. This information was gathered through a comprehensive bibliographical search, including 174 species, and from the unpublished data of our lab, covering 29 species. The limiting factor for the ultimate size of the dataset was the concurrent availability of morphological data on seeds and germination behaviour for each orchid species. The final dataset, in comparison with the family, exhibits a considerable overrepresentation of Orchidoideae over Epidendroideae (see Table 1). This can be attributed to the cumulative effect of the predominant focus in orchid research on temperate species of the Northern Hemisphere, which are overrepresented by the family Orchidoideae (Wraith et al., Reference Wraith, Norman and Pickering2020). Furthermore, our own research adds to this bias by concentrating on orchids from Greece, where species in the Orchidoideae subfamily predominate. It should be noted here that the E:S ratio was calculated using mean values of embryo and seed length, measured with a stereomicroscope or microscope, and gathered from the bibliography (tabular data for 174 species). For each of the 29 species studied by our group, a 50-seed sample was used to calculate the mean E:S ratio values with the Lumenera Infinity-1 camera and software under a stereomicroscope.
Dataset breakdown by Orchidaceae subfamilies
Note:
D: Total number of species in the dataset.
D%: Percentage of species of the dataset in each subfamily.
T: Total number of species in each subfamily (Christenhusz et al., Reference Christenhusz, Fay and Chase2017).
T%: Percentage of species of the family in each subfamily.
±%: Percentage difference between species in the family and species in the dataset.
Compliant and defiant germination
Based on the final percentage of asymbiotic germination and the intensity of pre-sowing treatments, we propose a binary classification system for orchid seed germination behaviour: compliant and defiant germination. For assessing data, we used the appearance of rhizoids as a criterion for germination, following the developmental classification system of Zettler and Hofer (Reference Zettler and Hofer1998). Owing to the heterogeneity in the literature regarding the precise stage considered for germination in various orchid species, only works reporting the appearance of rhizoids were included in our database. In cases of multiple reports on the same species, we used those with the highest germination values. More specifically, we define the germination behaviour of an orchid species as defiant when either the final asymbiotic germination percentage does not exceed 40% or when a prolonged duration (>1 h) of chemical treatment is required to achieve germination higher than 40%. Thus, defiant asymbiotic germination is the case where orchid seeds do not germinate under typical lab procedures (nutrient media and pre-treatments). In summary, the species in the entire dataset can be categorized into two groups based on germination behaviour: (1) defiant (FG: 0–40%, mean = 12.8%, n = 85) and (2) compliant (FG: 45–100%, mean = 77.6%, n = 118). Regarding the second criterion (duration of chemical treatment), it is important to note that only four species with germination over 40% are classified in the defiant group, with the most extreme case being Cephalanthera rubra, which achieved 60% FG after 15 h of chemical treatment (Rasmussen, Reference Rasmussen1995). The dividing line of 40% was selected as a close approximation to half of the highest mode value (85.7%), which nearly coincides with the highest valley (38.5%). This choice is based on: (a) Hartigan's test of unimodality (P-value < 0.001) and (b) a test using the ‘multimode’ package in R with the ACR (Ameijeiras-Alonso et al., Reference Ameijeiras-Alonso, Crujeiras and Rodríguez-Casal2019) method (P-value = 0.13). In this test, three modes (1.8, 19.7, and 85.7%) and two antimodes (13.2 and 38.5%) were identified. According to our criteria, the 203 species in our dataset are divided almost equally into two groups: 118 species (58%) are classified as compliant, while 85 species (42%) are categorized as defiant. It is worth noting that in previous preliminary work (Oikonomidis and Thanos, Reference Oikonomidis and Thanos2020), in addition to the defiant and compliant groups, we proposed a third category for even easier germination, encompassing species that could readily germinate on water or water agar without any chemical treatment. However, due to the small size of this group (n = 11), we decided, in this study, to incorporate them into the compliant germination category.
Biotic and abiotic factors
For each species, we recorded data concerning their growth form, mycoheterotrophy level, climate zone and habitat type in relation to shadiness. Regarding growth form, the species fall into two categories: terrestrial and epiphytic. The data regarding growth form were gathered from three types of resources: (1) the literature, from which germination and morphological data were collected and which, in most cases, also reported the growth form of the studied orchid species, (2) the database of Plants of the World Online (POWO) and (3) personal observations, specifically in the case of European orchids. In summary, 150 species are terrestrial, while the remaining 53 species are epiphytic.
In terms of mycoheterotrophy, Orchidaceae members can be characterized by three levels: autotrophy, partial mycoheterotrophy and full mycoheterotrophy, regarding their dependence on fungal carbon and nitrogen for survival in nature. Nevertheless, mycoheterotrophy is better described as a continuum between autotrophy and full mycoheterotrophy (Merckx, Reference Merckx2013). Within the entire database used, only a small number (20 species) are fully mycoheterotrophic. The remaining species are considered partially mycoheterotrophs because unlike fully mycoheterotrophic species, cases where autotrophic orchids have been differentiated from partially mycoheterotrophic ones are infrequent in the literature, where the majority of orchid species tested fall into this broad category (Schiebold et al., Reference Schiebold, Bidartondo, Lenhard, Makiola and Gebauer2017). Therefore, the remaining species in the dataset are categorized as partially mycoheterotrophic (183 out of 203) either because they have been identified as such in previous studies or because classification data for them are not available in the literature.
A dichotomous approach was adopted for both the climate zone and habitat shadiness, with the two classes of climate zones being temperate and tropical, and for habitat shadiness being open and shaded. Species were assigned to classes based on the description of each species, along with distribution maps or accurate coordinates of populations obtained from various resources: (1) the database POWO (POWO, Reference POWO2019), (2) the World Checklist of Selected Plant Families (WCSP, Reference WCSP2020), (3) the literature acquired while gathering seed morphological and germination data and (4) the online database GBIF (Reference GBIF2020) (www.GBIF.org). Regarding shadiness data, more than two million occurrences were initially extracted from GBIF for the species of the study. From these occurrences, data reported before 2000, with missing coordinates, ambiguous species identification or spatial resolution higher than 100 m, were discarded. This resulted in a dataset of about a hundred thousand points, from which only occurrences of species with more than 50 records were retained, amounting to about 40,000 occurrences for 127 out of the 203 species (60%) in the dataset. The characterization of habitat shadiness for the study species relied mainly on the description of each species and its habitat from the available literature. Additionally, a cross-validation of shadiness was conducted for the 127 species with available occurrences. In this cross-validation, the canopy cover for the year 2000 (Hansen et al., Reference Hansen, Potavov, Moore, Hancher, Turubanova, Tyukavina, Thau, Stehman, Goetz, Loveland, Kommareddy, Egorov, Chini, Justice and Townshend2013) was utilized. The mean value of tree canopy cover for each species was calculated, and a minimum threshold of 30% was applied to distinguish species in open habitats (≤30%) from those in shaded habitats (>30%). This threshold selection aligns with previous works on canopy cover classification (Torres et al., Reference Torres, Enriquez, Skutsch and Lovett2013).
For characterizing the climate zone of each species, the Köppen-Geiger climate classification (Kottek et al., Reference Kottek, Grieser, Beck, Rudolf and Bubel2006) was employed. In determining the climate zone, distribution data were extracted from Kew databases (Plants of the World Online and World Checklist of Selected Plant Families), where maps or information about the countries in which the species can be found were available. The species in the dataset were distributed in both temperate (127/203) and tropical (76/203) climate zones.
Statistics
The germination dataset was not normally distributed; thus, non-parametric tests (e.g. Kruskal–Wallis and Mann–Whitney U test) were applied to check the statistical significance of the data exploration results concerning the effect of the four different classification variables on the morphometric characteristics of orchid seeds.
A Factor Analysis for Mixed Data (FAMD), illustrated in Fig. 3, was employed to analyse the similarity between species in the dataset, taking into account variables such as the E:S ratio, habitat shadiness, growth form, climate zone and germination type. In an additional approach, and based on the results from the rest of the analysis, we utilized a combined index comprising all the previously mentioned traits. Each trait, based on its level, was assigned a binary value of 0 or 1 for each species. By summing these values, we calculated a Trait Index (TI) ranging from a minimum of 0 to a maximum of 4. For instance, considering one of the two extremes, if an orchid species exhibits defiant germination, is typically found in shaded habitats, is terrestrial and has a distribution mainly in temperate climate regions, it is assigned a value of 4. This indicates that the species in the mycoheterotrophic end of the auto-heterotrophy continuum. Conversely, if the germination is compliant, the orchid is found in open habitats, is epiphytic and has a distribution mainly in the tropics, it is assigned a value of 0, referring to the species on the autotrophic end of the continuum. Values between 0 and 4 arise from various combinations of the parameters for each species with variable placements across the mycoheterotrophy continuum. We use the TI in order to place all different factors on a single linear scale.
A generalized linear model (GLM) (Fig. 4) with a binomial error structure and logit link, using E:S [second-degree polynomial: y = C + b 1(E:S) + b 2(E:S)²] as a predictor and germination class as the response variable, was conducted to identify the effect of seed architecture on germination behaviour. However, because this analysis does not take into consideration the duration of chemical treatment, the second factor of the germination type classification, the results might be somewhat distorted due to species that achieve high germination percentages after long chemical durations. A variable tree (Fig. 5) was created to represent the dataset. Following expert reasoning, the variables were ordered in a postulated hierarchical scale, where the first variable might affect on the subsequent ones: (1) climate zone, (2) habitat shadiness, (3) growth form and (4) germination.
Additionally, as the majority of the data were from the subfamilies Orchidoideae (91/203) and Epidendroideae (89/203), data exploration was also performed at the subfamily level for these two groups separately. For the three other subfamilies (Cypripedioideae, Vanilloideae and Apostasioideae), the small number of observations in each did not allow the exploration of the relationships between E:S and the four investigated variables.
Finally, the same data analysis was conducted with the calculated volume of the seeds based on the proposed formulas by Arditti et al. (Reference Arditti, Michaud and Healey1979), but no differences compared to E:S ratio data were observed in the final results. We also investigated potential correlations between germination behaviour and absolute seed and embryo dimensions, but no statistically significant results were observed. For brevity, these analyses are not discussed further.
For the complete family dataset, all statistical tests were performed, and the diagrams were created using R version 3.6.3 (R Development Core Team, 2005).
Results
In Fig. 1, the E:S ratio is plotted against each of the five factors: germination type (Fig. 1A), habitat shadiness (Fig. 1B), climate zone (Fig. 1C), mycoheterotrophy level (Fig. 1D) and growth form (Fig. 1E). The statistical results of the analysis are also presented in the figure. The differences in the E:S ratio between orchids exhibiting compliant germination and those with defiant germination were found to be highly statistically significant. Species with germination that is more challenging under asymbiotic conditions have a much smaller E:S ratio (median value = 0.23 ± 0.01) than those that germinate almost readily (median value = 0.38 ± 0.01). Thus, the seeds of the latter have relatively less free air space, that is the space between the outer (testa) and inner (embryo) integuments of the seed.
The relationship of E:S with germination type (A), habitat shadiness (B), climate zone (C), mycoheterotrophy level (D) and growth form (E) for a dataset of 203 members of the family Orchidaceae (see Table 1). The yellow dot inside each viol-boxplot corresponds to the mean of the group (m). The test statistics [loge(W Mann–Whitney)], P-value (P), effect size (r), its confidence interval (CI95%), and the total number (n obs) of observations are shown on the top of each diagram. The number of observations in each category is displayed beneath the group name on the x-axis.
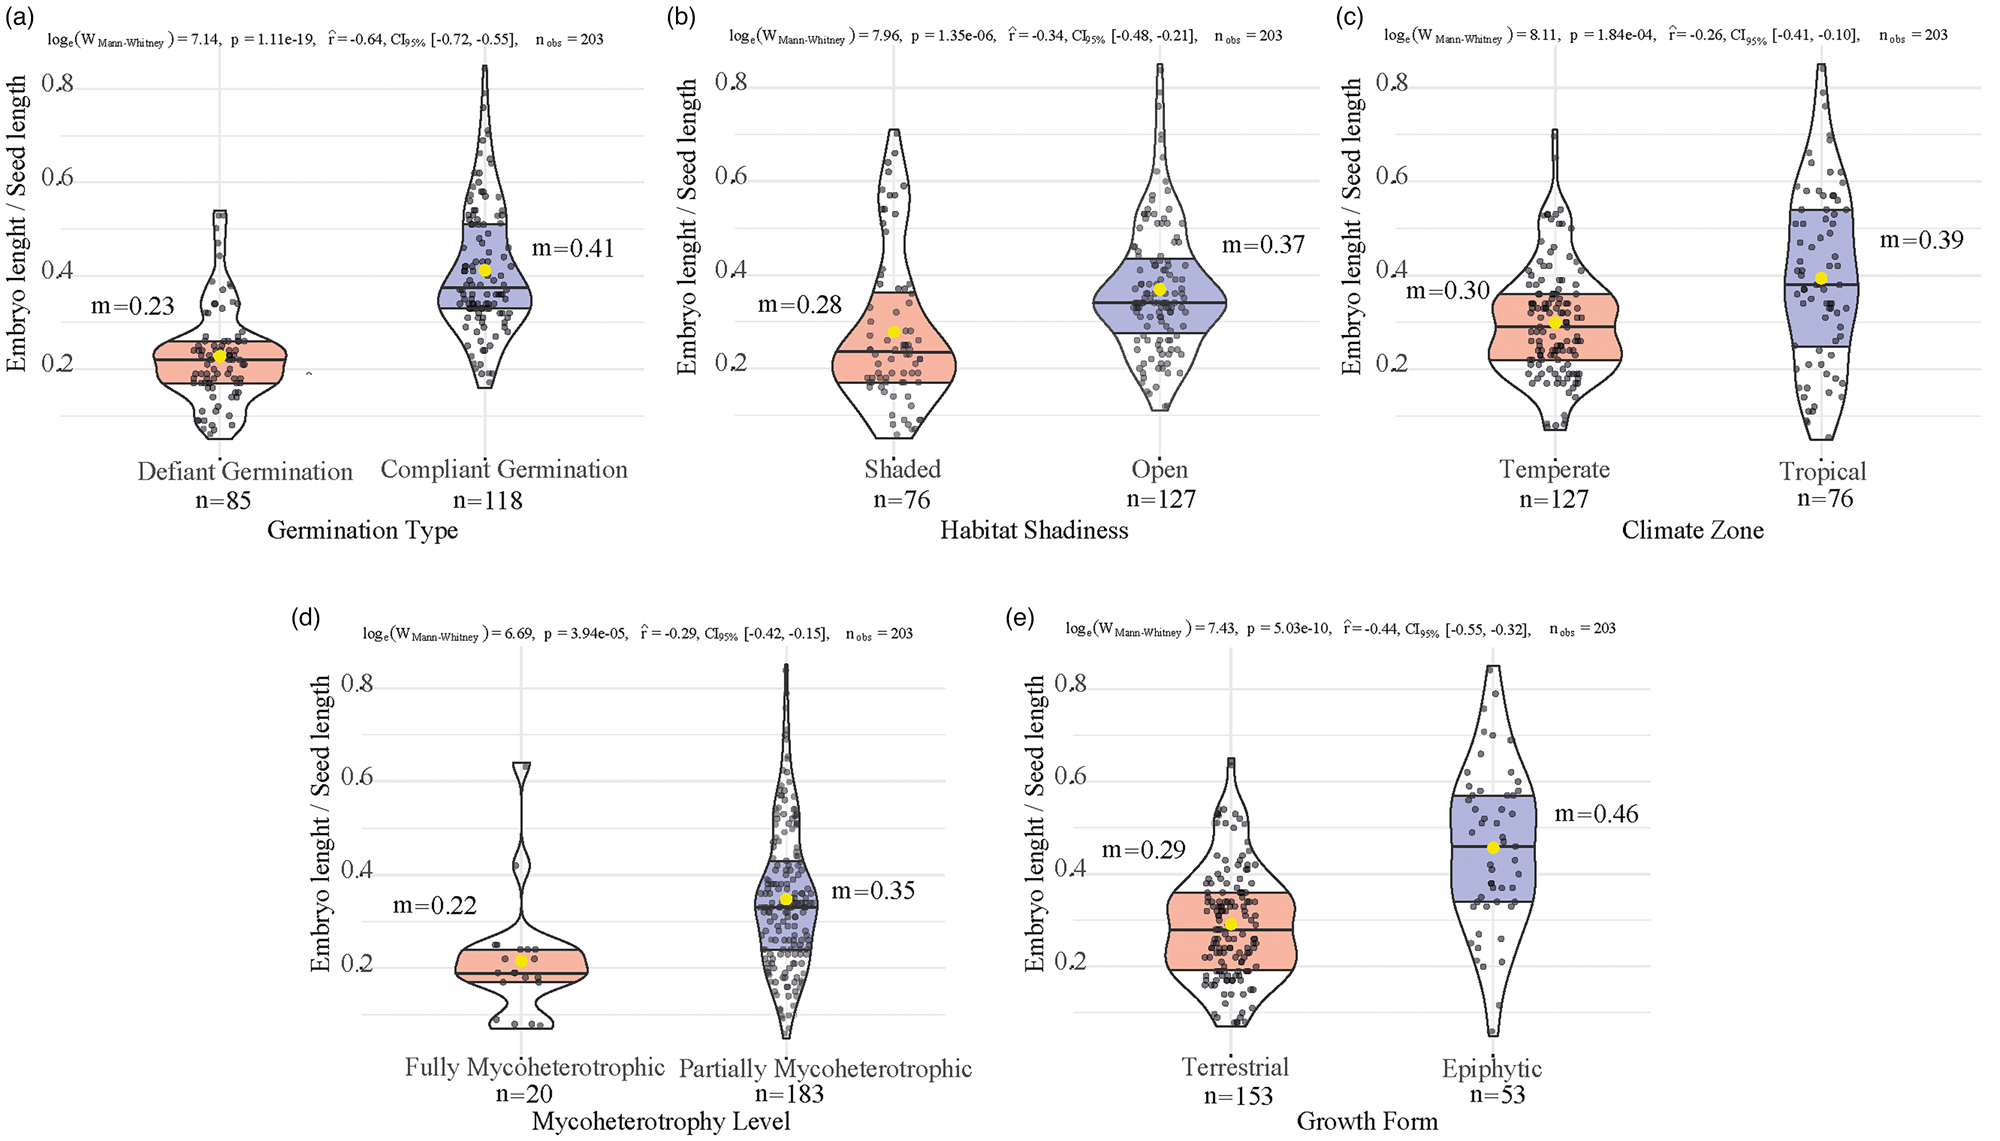
Orchid species typically growing in shaded habitats also exhibit a smaller E:S ratio (median value = 0.24 ± 0.01) compared to those in open habitats (median value = 0.34 ± 0.01). These differences are also found to be highly statistically significant. Similarly, the differences in the E:S for orchids found in temperate (median value = 0.29 ± 0.01) and tropical (median value = 0.38 ± 0.03) climates are also highly statistically significant. It is clear that the smaller E:S, and thus, the larger free air space, can be found in temperate orchid species. Additionally, a significant difference was observed between orchids with terrestrial growth form (median value = 0.29 ± 0.01) and those with epiphytic habit (median value = 0.46 ± 0.02). Interestingly, the E:S of the fully mycoheterotrophic orchids (median value = 0.19 ± 0.02) was also found to be much smaller than those that were either partially mycoheterotrophic or autotrophic (median value = 0.34 ± 0.01).
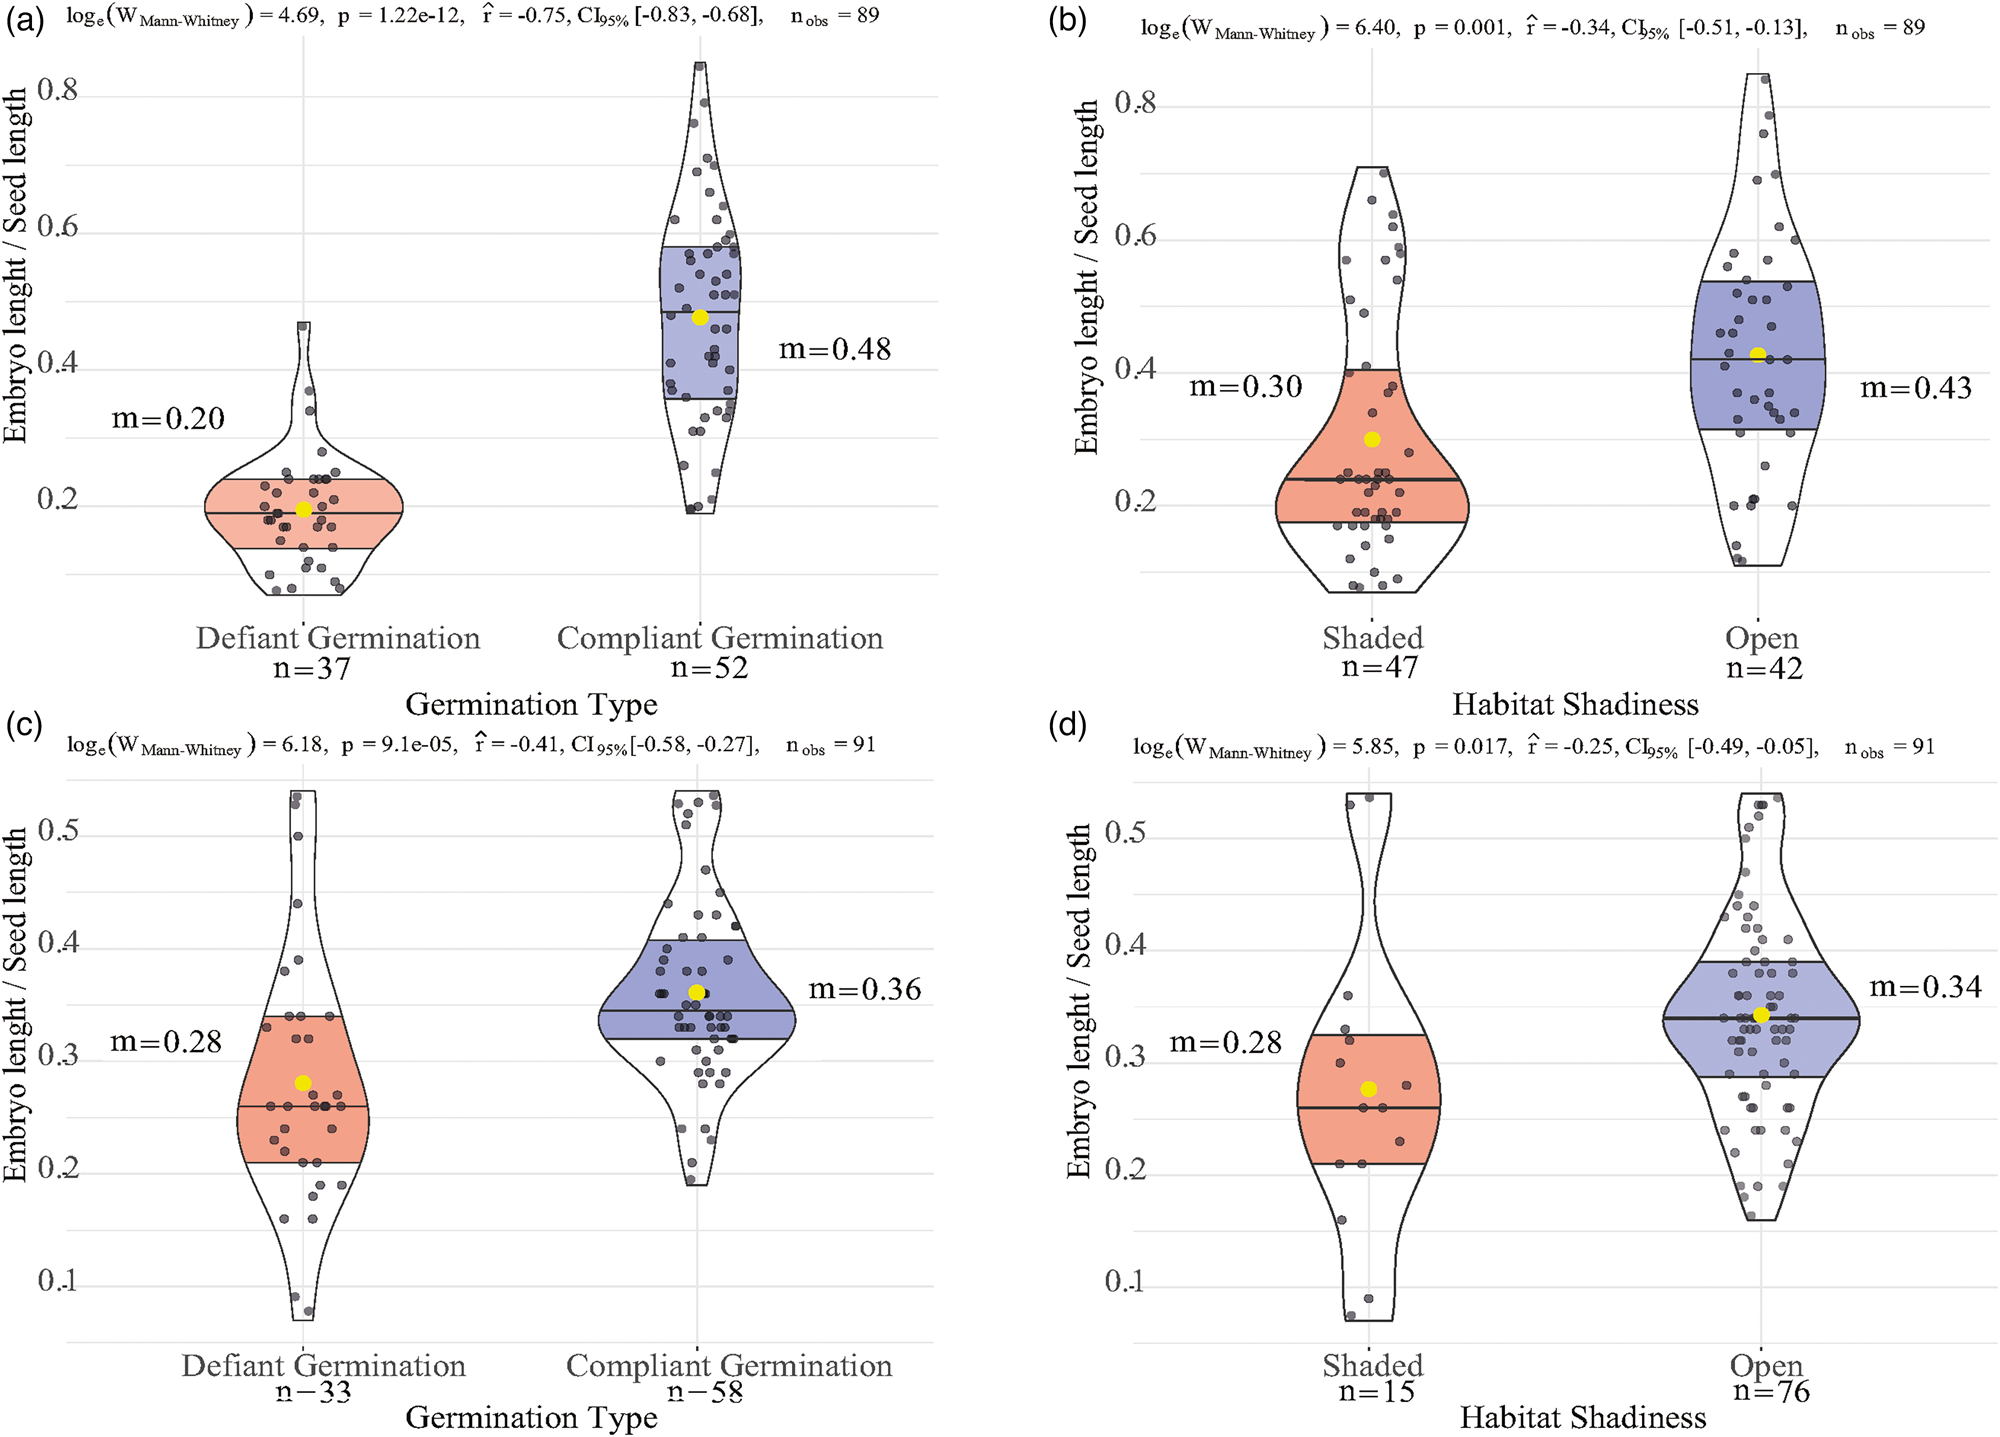
The relationship between E:S and germination type, as well as between E:S and habitat shadiness for the Epidendroideae (Fig. 2A, B, respectively) and Orchidoideae (Fig. 2C, D, respectively) subfamilies, is illustrated in Fig. 2. These relationships follow the same pattern as the rest of the Orchidaceae family. In both Orchidoideae and Epidendroideae, the E:S differences between germination types exhibit highly statistically significant differences, with median values of 0.21 ± 0.01 (defiant germination) and 0.47 ± 0.02 (compliant germination) for Epidendroideae and 0.29 ± 0.01 (defiant germination) and 0.33 ± 0.01 (compliant germination) for Orchidoideae. Regarding habitat shadiness, the differences in statistical significance for Epidendroideae are higher than those for Orchidoideae, with median values of 0.24 ± 0.02 (shaded) and 0.42 ± 0.03 (open) for Epidendroideae and 0.29 ± 0.03 (shaded) and 0.34 ± 0.01 (open) for Orchidoideae.
The relationship of E:S with germination type and habitat shadiness is depicted separately for the subfamilies Epidendroideae (A, B) and Orchidoideae (C, D). The yellow dot inside each viol-boxplot corresponds to the mean of the group (m). The test statistics [loge(W Mann–Whitney)], P-value (P), effect size (r), its confidence interval (CI95%), and the number (n obs) of observations are shown on the top of each diagram.
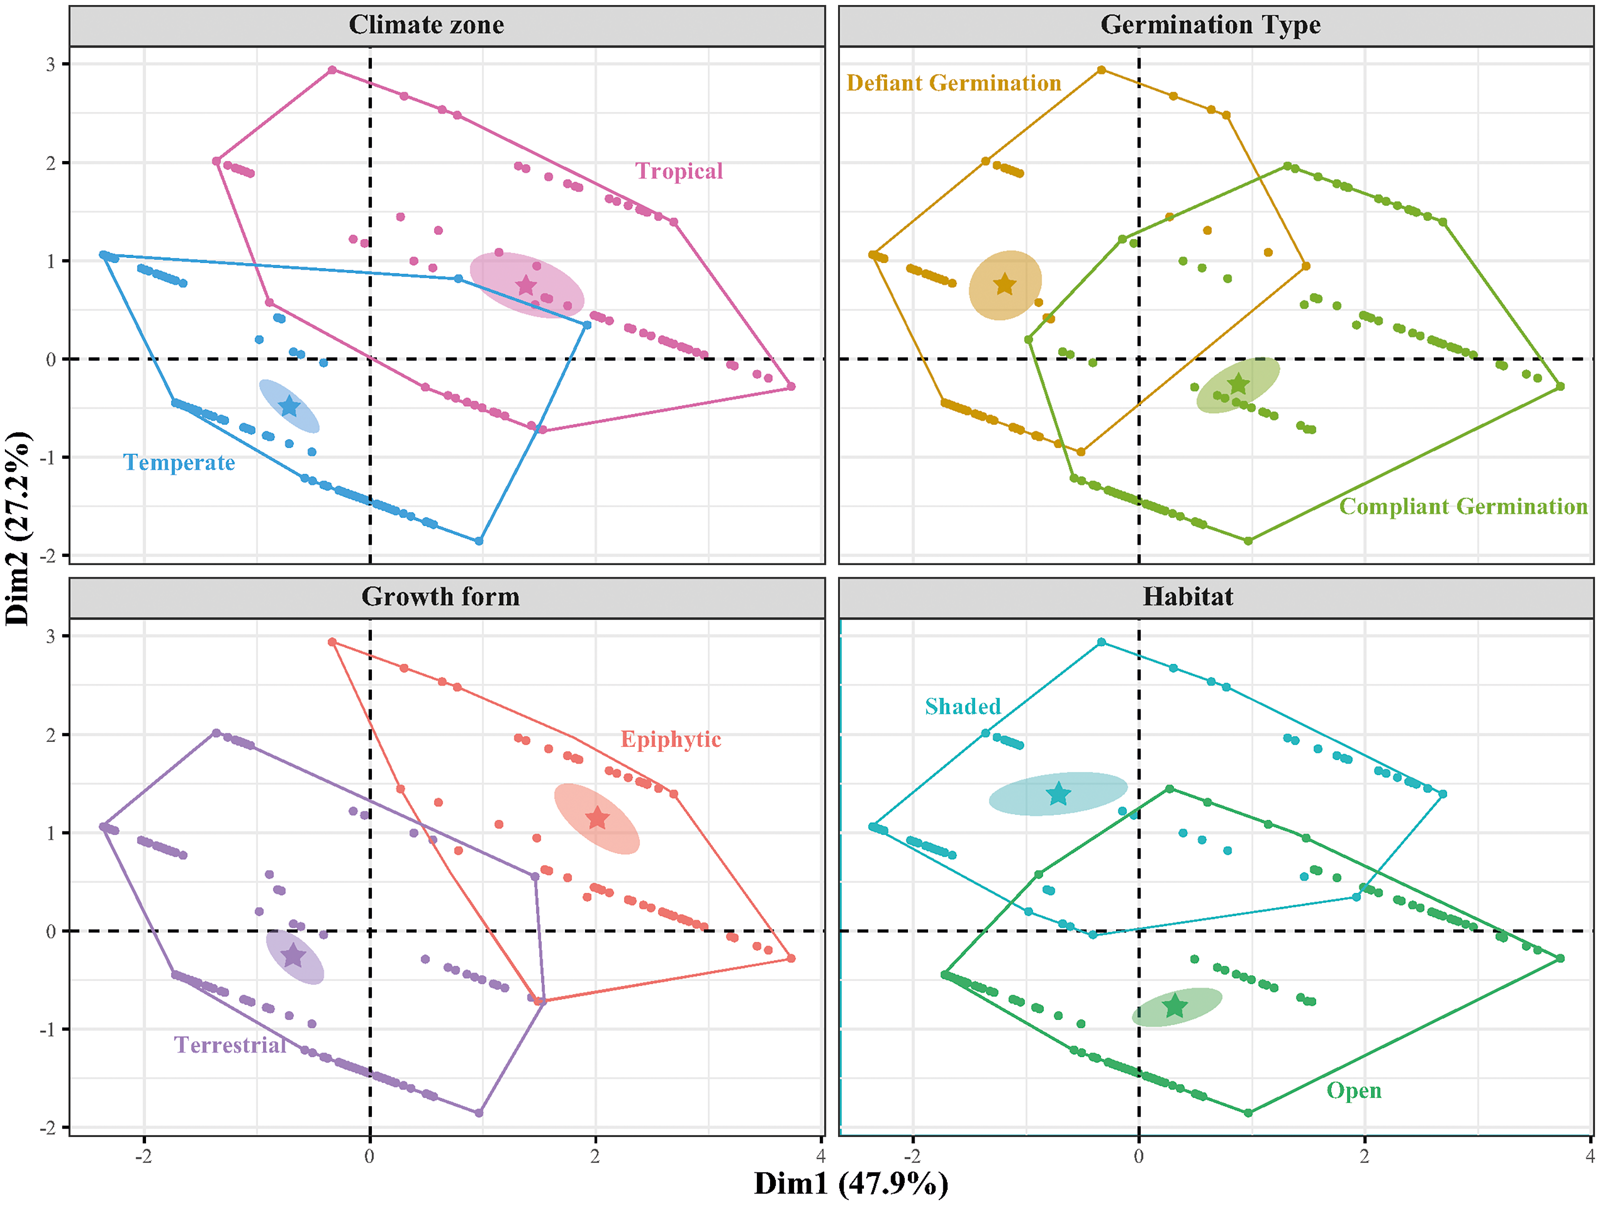
The factor maps of the FAMD analysis (Fig. 3) reveal two expected clusters, those of climate zone and growth form. Additionally, there is clustering between species found in shaded or open habitats and those exhibiting defiant or compliant germination, respectively. In the latter case, small overlaps of the clusters are present, presumably due to other factors affecting germination behaviour not considered in the present study. The first and second dimensions of the FAMD factor maps explain 75.1% of the variance in the dataset.
FAMD factor maps, obtained through the factor analysis for mixed data approach (FAMD analysis), depict the clustering patterns of the 203 species in the dataset based on the five variables studied (E:S, germination type, habitat shadiness, growth form and climate zone). Each factor map corresponds to the clustering pattern of the species based on one of the four categorical variables in the dataset. For each variable in the corresponding factor map, the convex hull and the 95% confidence interval ellipse are presented, with the group mean at its centre.
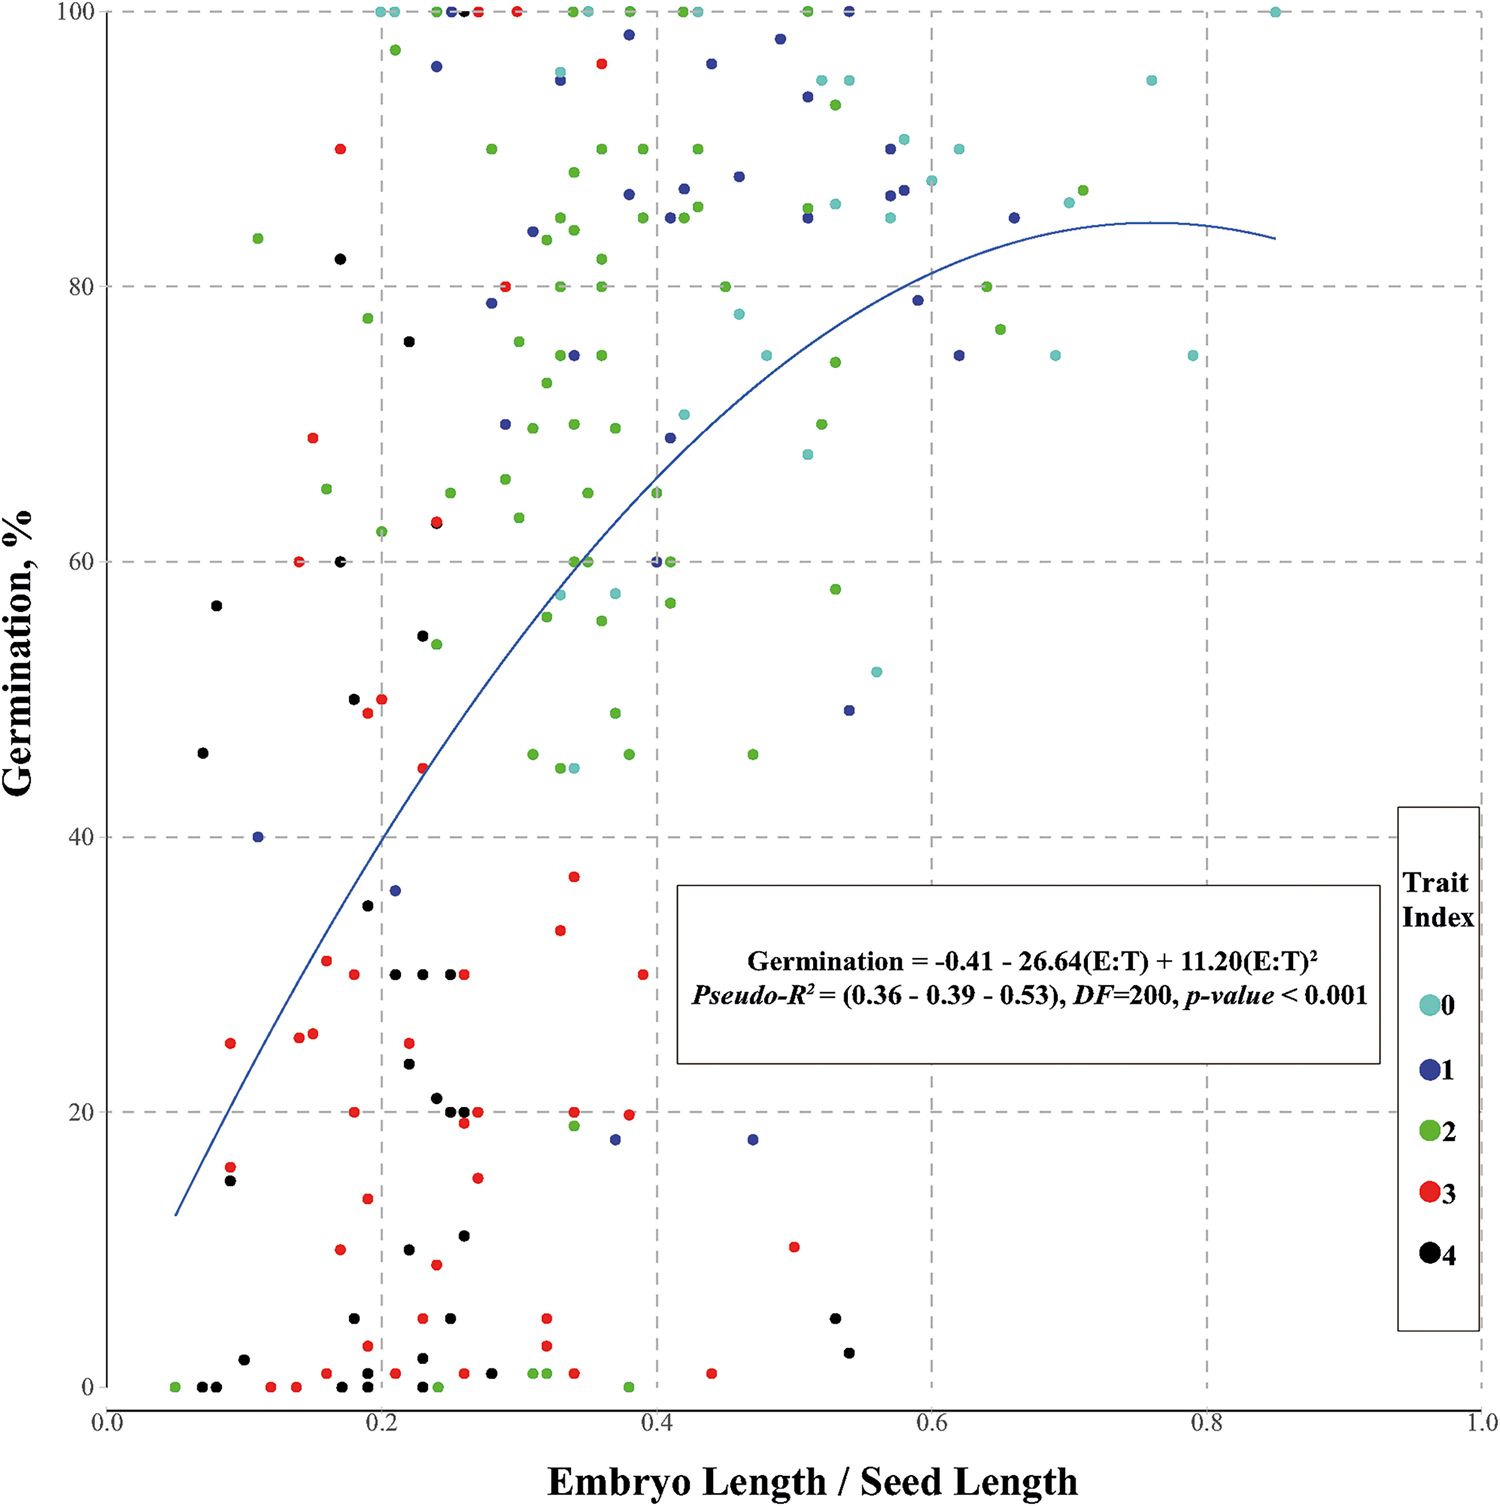
The GLM analysis reveals a relationship between E:S and FG percentage (Fig. 4) with a range of pseudo-R 2 = 0.36–0.53.
The relationship between E:S and FG percentage is accompanied by the best-fitted second-degree polynomial curve. The colour of the dots represents the ‘trait index’ as shown in the legend (for the explanation of the TI values, see Materials and Methods). The equation of the GLM regression is also shown in the inset box, along with the three pseudo-R 2 values, which correspond to (1) McFadden, (2) Cox and Snell, and (3) Nagelkerke, respectively.
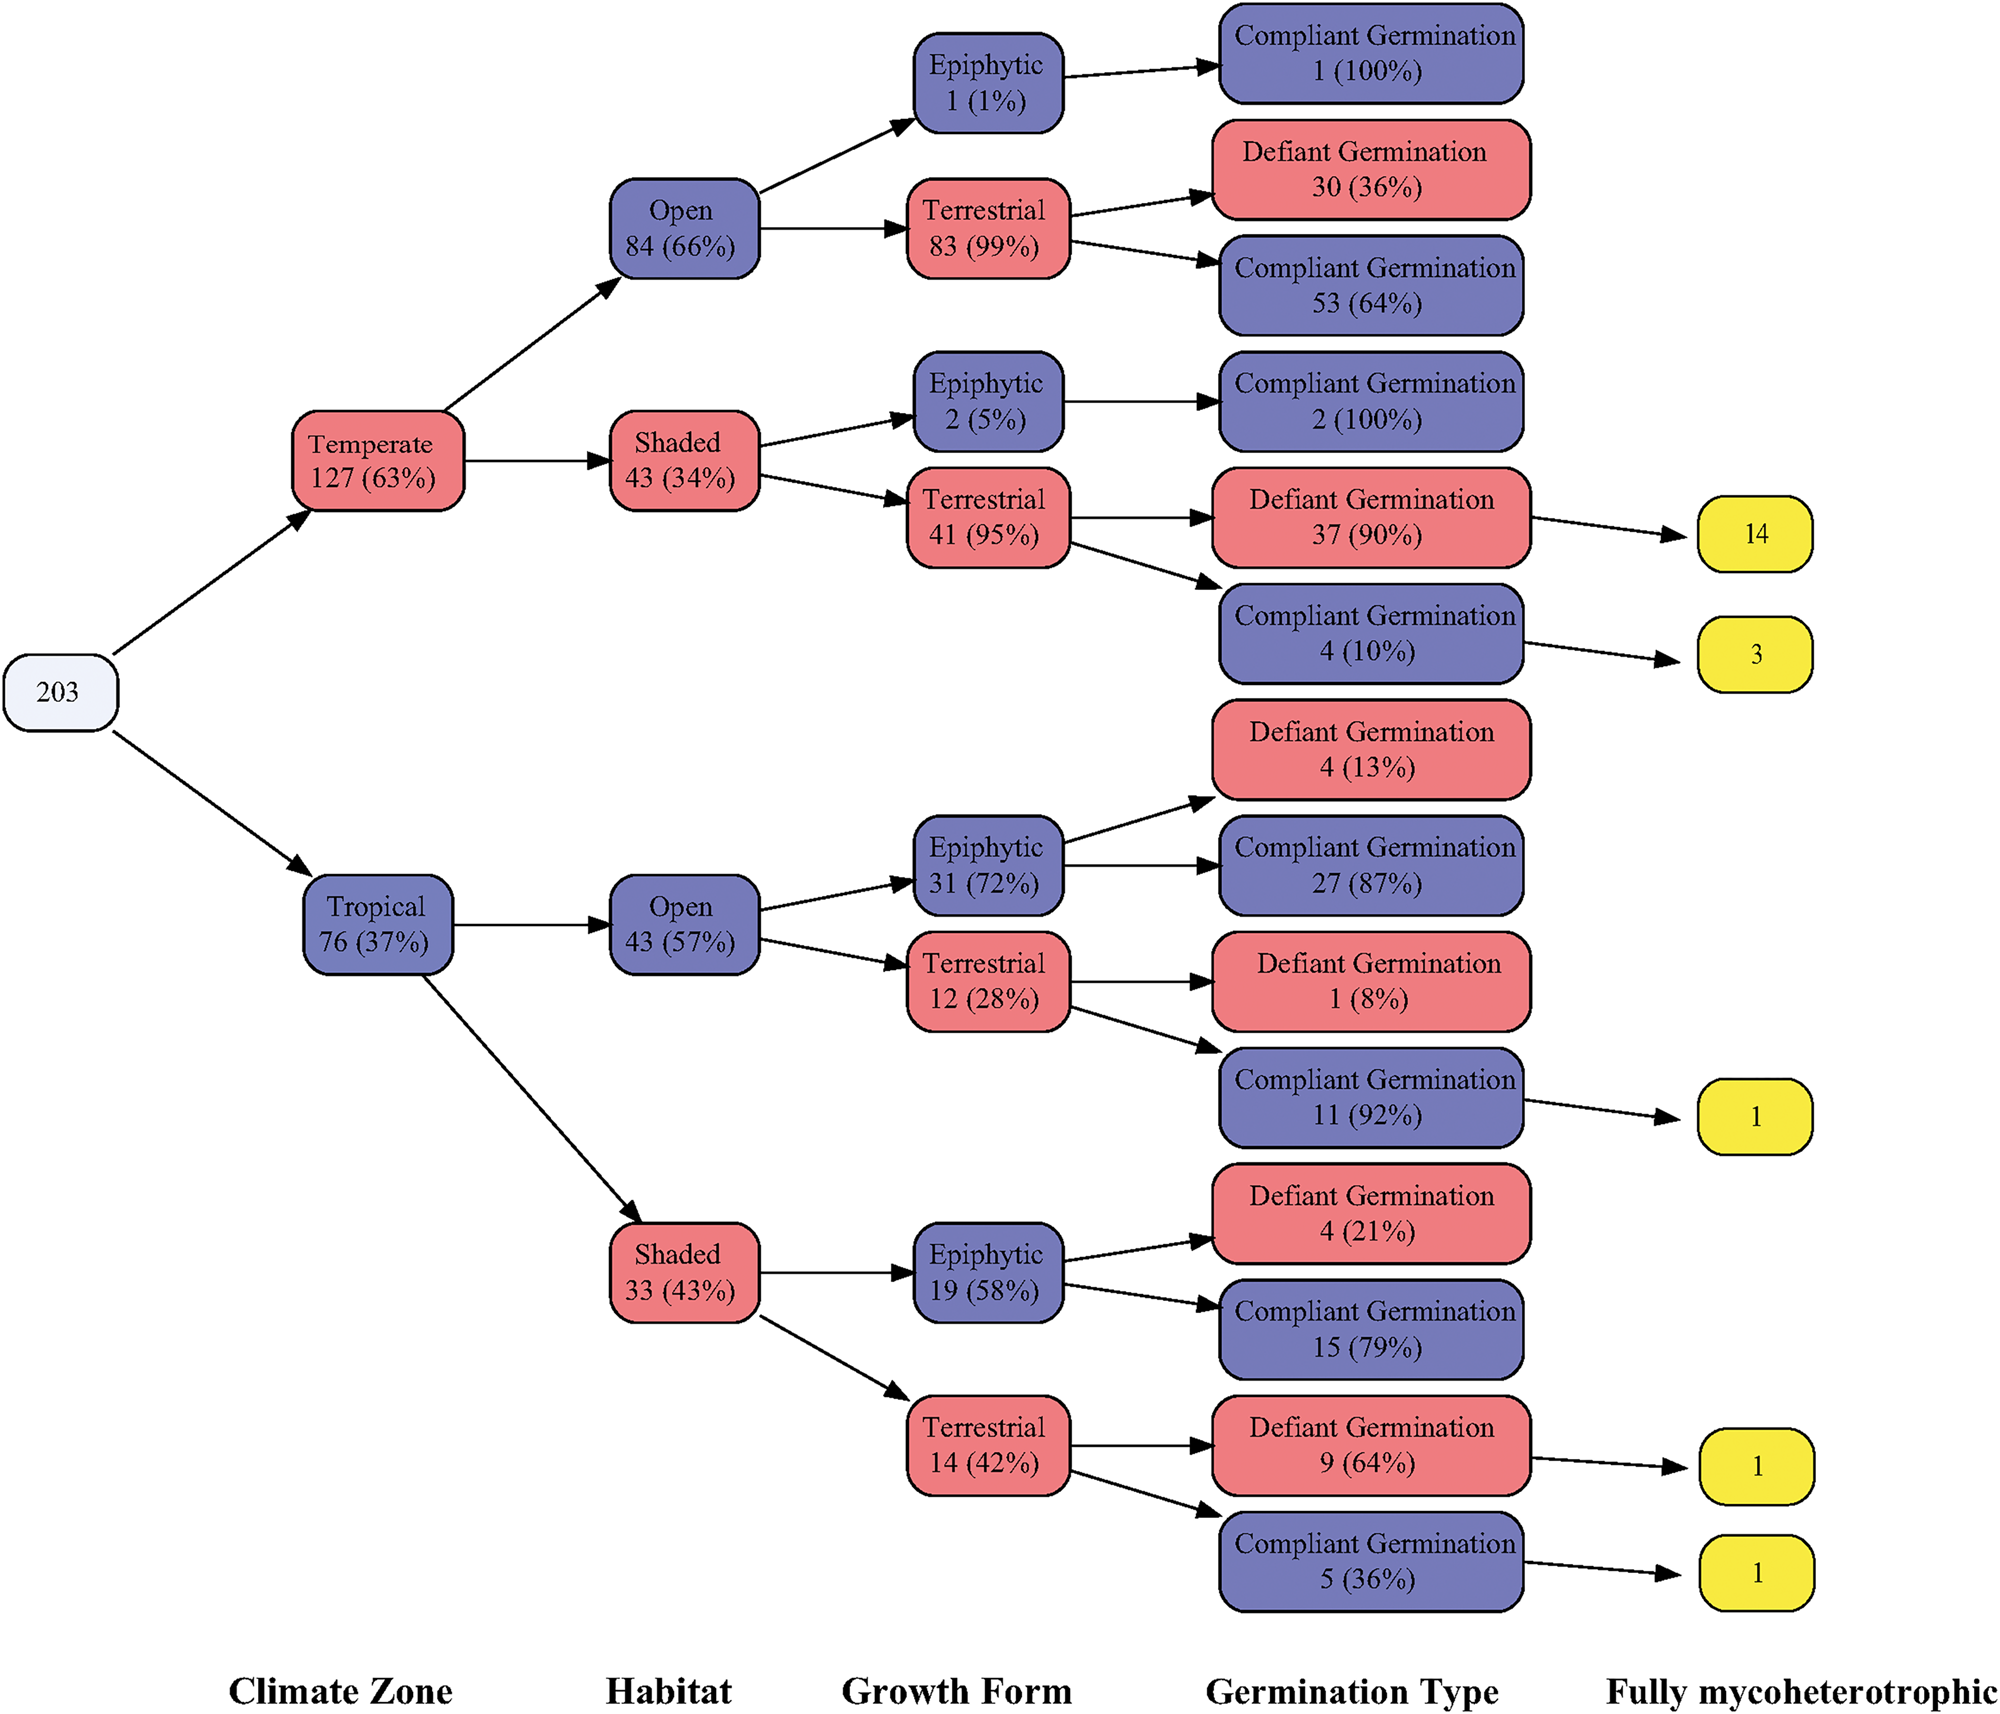
Finally, from the structured variable tree (Fig. 5), we can observe four main patterns, encompassing 72% of the total observations. These patterns include orchids that can be found: (1) in tropical climates, in relatively open habitats as epiphytes, exhibiting compliant germination (13% of the observations), (2) in temperate climates, in open habitats as terrestrial species, exhibiting defiant germination (15% of the observations), (3) in temperate climates, in shaded habitats as terrestrial species, exhibiting defiant germination (18% of the observations), and (4) in temperate climates, in open habitats as terrestrial species, exhibiting compliant germination (26% of the observations).
Variable tree representing the complete dataset of the study. In each box, the number of observations, the percentage in the group and the level of the dividing factor are presented. The root of the tree represents the number of observations in the entire dataset. The name of the dividing factor for each step of the tree is also presented at the base of the graph.
Discussion
The major finding of this study is a statistically robust correlation between the E:S ratio and germination behaviour within the Orchidaceae family. This correlation holds not only for the entire family but also when considering the two largest subfamilies, Orchidoideae and Epidendroideae, analysed as independent datasets. In simpler terms, species exhibiting larger embryos (relative to seed size) tend to display comparatively facile (compliant) germination, contrasting with those possessing larger air spaces (exhibiting defiant germination).
Similarly, to previous assertions based on investigations of Dendrobium species (Prasongsom et al., Reference Prasongsom, Thammasiri, Pritchard and Thammasiri2016, Reference Prasongsom, Thammasiri and Pritchard2022), it is becoming evident that not all Orchidaceae seeds should be ranked (based on their minute size) within the sensu lato morphological or morphophysiological dormancy classes (Forbis et al., Reference Forbis, Floyd and Queiroz2002; Baskin and Baskin, Reference Baskin and Baskin2014). This study elucidates that the orchids with smaller E:S ratios, consequently featuring relatively larger air spaces within their seeds, are more inclined to pertain to one of the aforementioned dormancy classes. This inclination is attributed to their defiant germination characteristics, thereby offering a nuanced perspective on the relationship between the E:S ratio and the dormancy type within the Orchidaceae family. On the other hand, species with higher E:S ratios may exhibit non-dormant seeds. For instance, Anacamptis sancta has been observed to rapidly produce protocorms within a few days of sowing (Oikonomidis and Thanos, Reference Oikonomidis and Thanos2021).
In the Orchidaceae family, as well as in the Orchidoideae and Epidendroideae subfamilies, the E:S ratio is observed to be smaller in species inhabiting temperate regions worldwide, as well as in the terrestrial life form, when compared to their tropical and epiphytic counterparts, similar observations were also made in previous works (Tsutsumi et al., Reference Tsutsumi, Yukawa, Lee, Lee and Kato2007; Collier et al., Reference Collier, Fisher, Gribbins, Yoder and Zettler2023). Previous research has illustrated that temperate terrestrial orchid species exhibit a greater need for complex pre-treatments and germination media in contrast to tropical epiphytic counterparts (Rasmussen, Reference Rasmussen1995; Diantina et al., Reference Diantina, Kartikaningrum, McCormick, Millner, McGill, Pritchard and Mardarajan2023). This disparity is commonly interpreted on the basis of the wider mycorrhizal compatibility and the simpler nutritional requirements shown by epiphytic orchids (Teixeira, Reference Teixeira2013; Rasmussen et al., Reference Rasmussen, Dixon, Jersákova and Těšitelová2015). The reduction in embryo size, as evidenced by general observations on mycoheterotrophic plants by Leake (Reference Leake1994), and the substantial, secondary, decrease in the E:S ratio observed in the present study, align with the prevailing concept of increased nutritional demands in temperate terrestrial orchids.
It is noteworthy that the fully mycoheterotrophic species exhibit the smallest E:S ratios among the species in the dataset. The preponderance of these orchids is found within the subfamily Epidendroideae, which is unsurprising given that out of the 215 fully mycoheterotrophic species in the Orchidaceae family, 155 belong to Epidendroideae. Notably, within this subfamily, multiple instances of secondary returns to terrestrial life forms have been documented (Chomicki et al., Reference Chomicki, Bidel, Ming, Coiro, Zhang, Wang, Baissac, Allemand and Renner2015; Fan et al., Reference Fan, Chomicki, Hao, Liu, Xiong, Renner, Gao and Huang2020).
Considering both the extremely low values of E:S in fully mycoheterotrophic orchids and the overall trend of lower E:S values in shaded habitats compared to open ones, it is postulated that a reduction in E:S during the family's evolution accompanied the shift of several orchid lineages from open to deeply shaded niches. This transition was the potential result of the shift of these species towards the fully mycoheterotrophic end of the autotrophy-mycoheterotrophy continuum. The seeds of these orchids fall into the defiant germination category, posing significant challenges for successful germination. In numerous cases for such species, germination was not attainable under in vitro culture (Rasmussen, Reference Rasmussen1995). Hence, these seeds are classified, by many researchers, as deeply dormant, belonging to either the morphological or the morphophysiological class (Rasmussen, Reference Rasmussen1995; Baskin and Baskin, Reference Baskin and Baskin2014). In nature, the co-occurrence of a compatible symbiont plays a crucial role in breaking seed dormancy by scarifying the water-impermeable carapace and providing nutrition for germination (Rasmussen, Reference Rasmussen1995).
In prior studies, it has been proposed that the larger air space in seeds is an adaptation to anemochory (Arditti and Ghani, Reference Arditti and Ghani2000; Diantina et al., Reference Diantina, McGill, Millner, Nadarajan, Pritchard and McCormick2020; Fan et al., Reference Fan, Chomicki, Hao, Liu, Xiong, Renner, Gao and Huang2020). Additionally, it has been suggested that the secondary return to terrestrial habitats drove an increase in seed air space as a counterbalance to seed dispersal capability, particularly from a lower release height associated with the terrestrial habit. While a larger air space does enhance floating capability (Arditti and Ghani, Reference Arditti and Ghani2000), it should not be considered an exclusive adaptation to anemochory. The concept of absolute smaller seed size, as reported by Leake in 1994, for the majority of mycoheterotrophic species, further refined with the study of the relative seed to embryo size in the present study, supports the hypothesis of a decrease in E:S values (or increase in the relative air space) co-occurring with an increase in the dependence on fungal symbionts. Moreover, the larger air space and the corresponding longer flotation times, commonly observed in orchids of shaded habitats (both terrestrial and epiphytic), may play a crucial role in their dispersal within relatively obstructed environments such as forests, as they embark on a ‘blind quest’ for suitable fungal hosts. Furthermore, recent works support the anemochory as a derived state in the Orchidaceae (Karremans et al., Reference Karremans, Watteyn, Scaccabarozzi, Escobar and Bogarin2023) with zoochory being the primary mode of dispersal for early diverging lineages. In contrast, fungal relationships can be tracked even in the fossil record (Poinar, Reference Poinar2016), although such observations have been challenged by certain researchers (Selosse et al., Reference Selosse, Brundrett, Dearnaley, Merckx, Rasmussen, Zettler and Rasmussen2017).
While further investigations into the mycoheterotrophy level of orchids and their seed morphology are essential for elucidating the drivers of orchid seed trait evolution, we can hypothesize that shifts across the mycoheterotrophy continuum play a significant role as a driving force for orchid seed morphology. The larger air space in terrestrial orchids and those of shaded habitats should not be automatically accepted as an adaptation to anemochory, especially considering the existence of these traits in orchid groups where anemochory is less common. The decrease in E:S could, in fact, be an adaptation to the shift towards the fully mycoheterotrophic end of the continuum, where the reduced relative size of the embryo and, consequently, the resources expended per seed produced might play a crucial role. This adaptation could contribute to adult plant survival by allocating more resources to reflowering in the next season or by increasing the potential number of seeds produced per inflorescence.
In conclusion, orchid species inhabiting shaded habitats produce seeds with smaller E:S ratios (and larger air spaces) and deeper dormancy. Under in vitro asymbiotic conditions, these seeds show defiant germination behaviour, namely demonstrating poor FG and/or requiring extended chemical pre-treatments for successful germination. This pattern is also evident within the Orchidoideae and Epidendroideae subfamilies; an accumulation of data in the future might prove as well that this same pattern holds in the subfamilies Apostasioideae, Cypripedioideae and Vanilloideae. This, secondary, decrease of E:S in shaded niches following transitions of lineages from the autotrophic to the fully mycoheterotrophic edge on the mycoheterotrophy continuum, potentially signifies the increasing dependence of orchids on their symbionts, an extreme case in the reduction of seed and embryo size observed in mycoheterotrophic plants (Leake, Reference Leake1994). While this hypothesis can explain both the germination behaviour and morphometric traits of orchid seeds, it requires further testing through the examination of the morphology of seeds from additional orchid species and their corresponding position on the autotrophy-mycoheterotrophy continuum. It is crucial to approach the dominant drivers of orchid seed morphology with caution, especially concerning the shift from epiphytic to terrestrial habits. The E:S ratio (as a proxy of the relative free air space of an orchid seed) has been considered an adaptation to anemochory in many previous works, mentioned above. However, on the basis of our data, we postulate that the evolutionary modification of seed morphology in Orchidaceae (as depicted by the E:S ratio) could be predominantly driven by the increased dependence on fungal symbiosis at the germination stage. An alternative postulation could implicate both anemochory and fungal symbiosis as coevolving traits, driving the overall diversification of orchid seed morphology and germination. Further research is necessary to elucidate these relationships.
Orchids rank among the most endangered plant families, with five known extinct species and 986 out of 2013 species assessed (48%) classified in a threat category (IUCN, Reference IUCN2024). Orchids have nearly twice as many threatened species compared to the totality of all organisms assessed thus far. In the forthcoming decades, ex situ propagation will play a pivotal role in the successful conservation of orchids. However, the sheer number of orchid species, coupled with a significant count of endangered ones and the limited resources available for conservation, poses a difficult challenge in developing protocols for the ex situ propagation of orchid species for conservation purposes.
The present study suggests the important predictive value of the E:S ratio on the germination behaviour of orchid seeds, emphasizing the value of relative embryo and seed dimensions (compared to absolute ones) towards a better understanding of orchid seed biology. Recognizing patterns in orchid germination behaviour will be pivotal in successfully conserving orchids, ultimately reducing the time required to develop effective conservation protocols. In future germination investigations, it is imperative to include data on orchid germination in distilled water or water agar. Species that germinate promptly under such conditions may exhibit even higher E:S ratios compared to those in the compliant germination category of our research. However, data on germination under these conditions are scarce, particularly for epiphytic orchids. These species appear to show lesser dependence on symbiotic relationships during their early life stages, and information from these cases could contribute to a better understanding of the evolution of seed traits in Orchidaceae.
Supplementary material
The supplementary material for this article can be found at http://10.1017/S0960258524000242.
Acknowledgements
This work is submitted for publication in partial fulfilment of the requirements for the degree of Doctor of Philosophy (PhD) of S.O.
Funding statement
This research has been partially funded by a joint project between the NKUA Seed Bank (Greece) and the Millennium Seed Bank (RBG, Kew, UK) entitled: ‘Conserving the Flora of the Balkans: Native Plants of Greece’.
Competing interests
The authors declare none.
Data availability statement
The summarized dataset is available as Supplementary Material.


 Open access