





I. INTRODUCTION
Beaches from Maine to New York have been periodically analyzed for mineral content. These studies have been used to describe the area’s geology and the impact of various periods of glaciation. The Wisconsinian glaciation (Glaciers in the Northeastern U.S. – Earth@Home), ~85,000 to 11,000 years ago, covered the entire New York-New England region. In modern times, particularly unprotected open-water beaches, have been greatly influenced by strong storms and associated winds and tides. Beach and dune restoration efforts are commonplace among the coastal towns and directed by local, state, and federal governments.
Prior mineralogical analyses have studied the greater Massachusetts area (Gleba, Reference Gleba2008), Plumb Island Beach (Robertson, Reference Robertson2021) the South Shore (Benno and Brenninkmeyer, Reference Benno and Brenninkmeyer1976; Brenninkmeyer and Dillon, Reference Brenninkmeyer and Dillon1984), and the Cape Cod National Seashore (Knutsen,Reference Knutsen1980), as well as, the outer beaches of Cape Cod (Ockay and Hubert, Reference Ockay and Hubert1996). These studies can be related to similar mineralogical studies in Long Island New York (Faust, Reference Faust1963) and Southern New England (McMaster, Garrison, Reference McMaster and Garrison1966). An important literature reference that compliments this study is the publication by Brenninkmeyer and Dillon in 1984, “Rock Lithology and Glacial Transport Southeast of Boston.” They provide similar elemental analyses and mineralogical analyses for Cohasset and Scituate down to the 4th Cliff of Scituate. These towns are directly north and adjacent to Marshfield, Massachusetts, including analyses of the underlying granite bedrock which they termed the Cohasset/Westwood granites. South of Cohasset and extending to Scituate and Marshfield is an area described as “glacial cover” that is composed of deep glacial debris on top of bedrock. The elemental and mineral descriptions of Cohasset/Westwood granite, match the composition of beach sands and coastal dunes analyzed in this report, found from Humarock Beach in Scituate, south along four Marshfield Public Beaches to Duxbury Public Beach. So on a bulk basis, the sand reflects the long-term breakdown of the adjacent bedrock and contributions from river sediments from the same bedrock. This type of sand is often referred to as continental sand as described by the Georgia Department of Natural Resources webpage, Sand Department of Natural Resources Division (coastalgadnr.org), described as the weathering of granitic rock.
This study examined the mineralogy of the beaches and coastal dunes in Marshfield, MA and local area. Overall, this included six public beaches along a ~15-mile stretch of beach. The area is bound by the North River in Scituate, which is the mouth of both the North and South Rivers and Plymouth Harbor to the South. Another river system, the Green River, associated with Green Harbor located at the river’s mouth, is located in the middle. The Duxbury, Rexhame, and Brant Rock beaches have undergone restoration in recent years and the North and Green rivers have been dredged. Old Rexhame Beach provides a comparative baseline since it has not been actively restored.
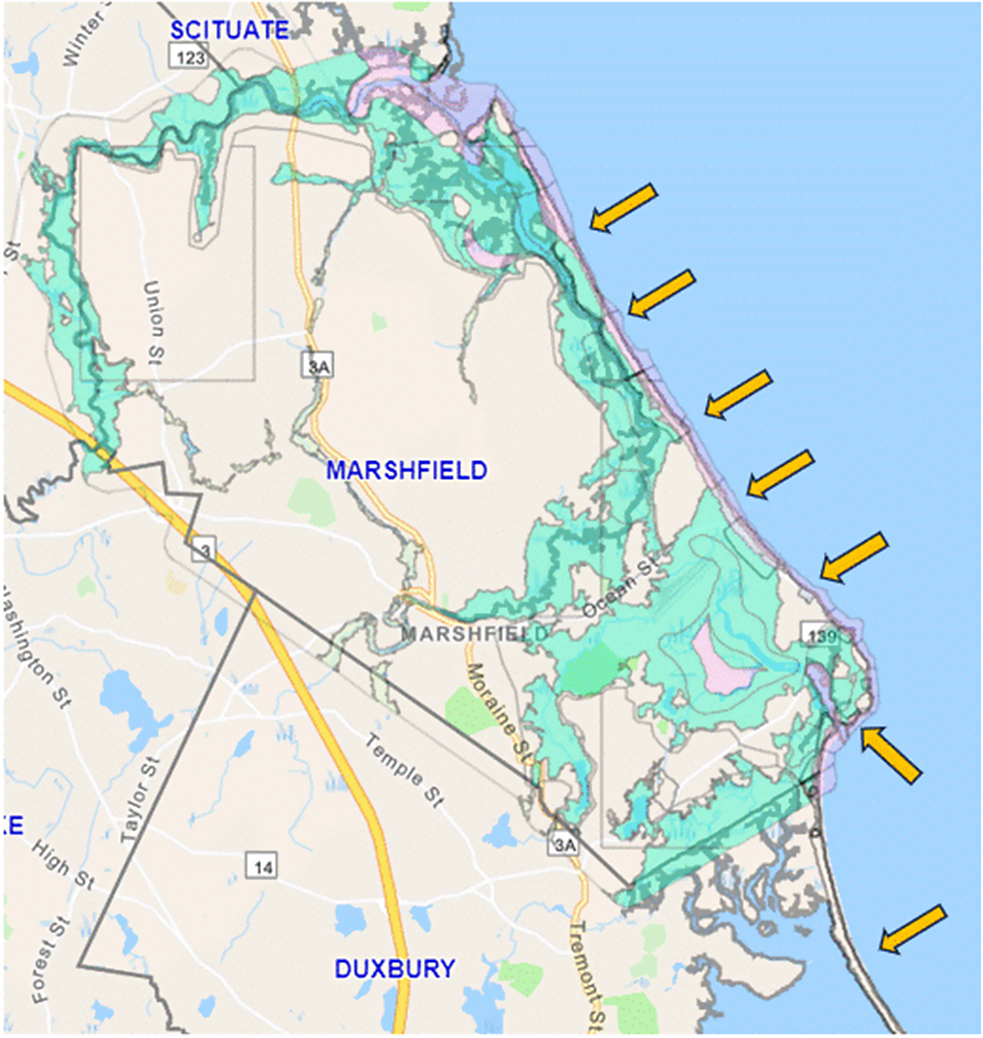
Beach restoration efforts are guided by the Marshfield Conservation Commission under guidelines and programs established by the Massachusetts Office of Coastal Zone Management (CZM). The CZM website, Massachusetts Office of Coastal Zone Management (CZM) Mass.gov provides a wealth of information on various analyses and coastal restoration programs. Several of the website analyses also document beach sand and sediment flow. This particular section of shoreline has a well-documented history since the time of the Pilgrims in the 1600s (Krussel and Galluzzo, Reference Krussel and Gulluzzo2007). Historical maps (Krussel and Bates, Reference Krussel and Bates1990) show that the coast and adjacent river systems have been changed and shaped by numerous storms in the past 400 years. Figure 1 is a map of the area of study. It shows the barrier beaches, rivers, and flood zones for Marshfield and adjacent towns, Town of Marshfield, MA: Floodmap App. In addition to the rivers, the area does have many bogs and marshes (hence Marshfield).
Map of the town of Marshfield and surrounding area showing the sampling sites denoted by arrows. Flood zones, rivers, and barrier beaches are highlighted.
One of the objectives of this study was to detail the mineralogy of the dunes and beach sands using modern analytical methods and data analysis techniques. Another objective was to look at various environmental influences on the mineralogy such as high winds (dunes), strong seas (beaches), and river flow and sedimentation, specifically in light of previous studies. A recent study (Sousa, Reference Soua2024) pointed out the influence of wind and sea on the shape of quartz crystallites and particles found in sandstones of the dunes and coastal regions of Saudi Arabia. The sandstone mineralogy in Saudi Arabia has many of the same minerals found in beach sands and dunes in this report.
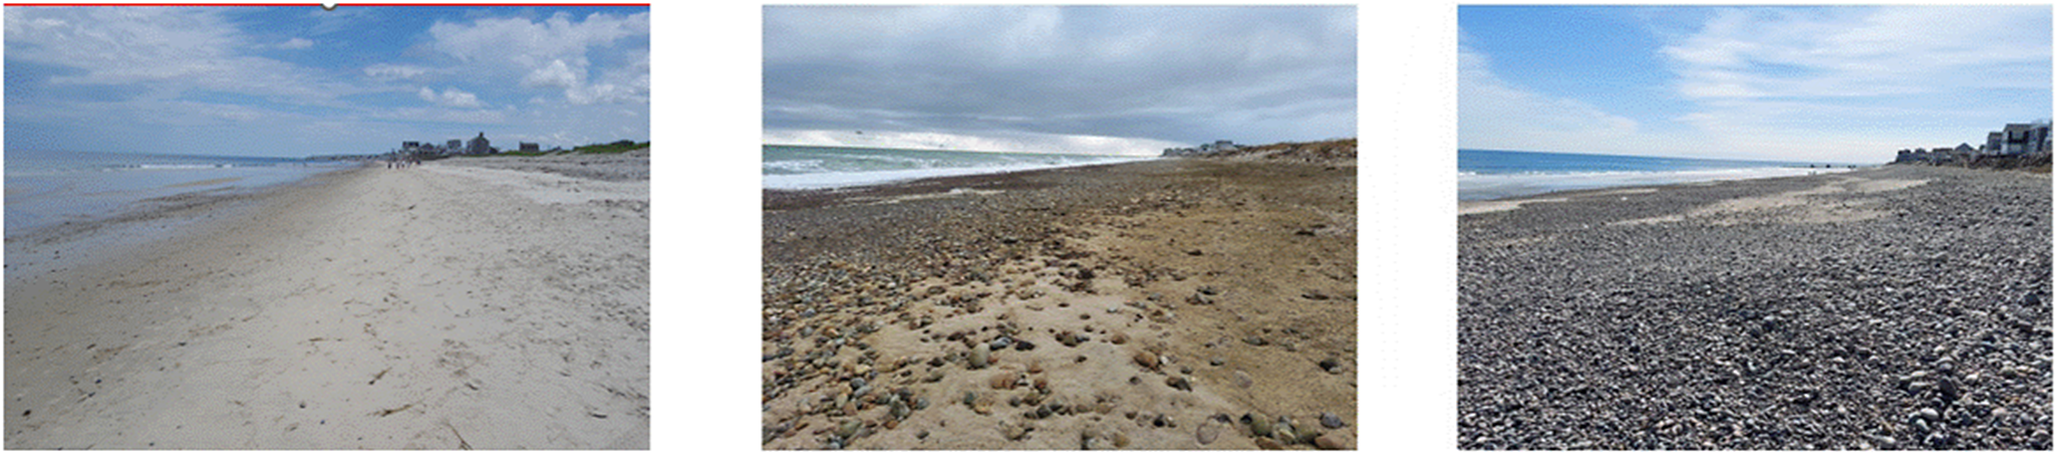
As a long-time, regular visitor to the area, the continuous sand flow and movement along the Marshfield beaches is truly impressive, particularly when one compares the summer and winter beaches or beach environment before and after a strong Northeaster (Figure 2). Sand and sediment flow movement in the South Shore have been reported in the literature. Sediment flow is clearly visible during strong storms as the normally clear water will become cloudy and extend more than a mile offshore. Aerial photographs taken from numerous sources, but most commonly beachfront real estate companies, often show sediment flow along the beach and various promontories, such as Beadles Rock, Brant Rock, 4th Cliff, and the Green Harbor River entrance.
Rexhame Beach was viewed in the summer of 2023, February, and March 2024 after multiple March storms, The beach is seen at low tide and there is normally a ~10 ft. difference in the tides. Large volumes of sand are transported each year on and off the beach.
II. EXPERIMENTAL
The author was provided access to the laboratory facilities of the International Centre for Diffraction Data (ICDD). ICDD is a non-profit scientific organization that provides educational services and the world’s largest database of X-ray patterns of minerals to the global scientific community. The author is a current member and clinic instructor, as well as the retired Executive Director.
The laboratory is equipped with an X-ray diffractometer, X-ray fluorescence spectrometer, light microscopes (1 to 1000× magnification), and specimen preparation equipment. The preparation equipment can dry and grind sand and stone samples. Sieves were utilized to provide information on particle sizes. This equipment reflects standard instrumentation used in mineralogy and geology laboratories. Each of these techniques is described separately.
A. Specimen preparation
In the following discussion, the term sample refers to the collected material while specimen refers to treated materials that are placed in an instrument.
Sand samples were collected in clear plastic screw-top sampling cups (~20 to 30 g) at the locations shown in Table I. The locations are listed from North to South. In some locations housing development extends to the beach (no dunes), in four of the locations there were dunes adjacent to the beach. A total of 28 beach and dune sand samples were collected along with 12 rocks. Multiple specimens were taken from all sample types so the total number of diffraction data sets was 77. Additional dune samples were examined from West Beach, Indiana Dunes National Park producing another 7 data sets.
Sampling locations including the type and number in parentheses.

Photographs were taken at each sampling point. At Beadles Rock, black sand samples, rocks, and 1 mm pebbles were collected to show the mineral relationships between rocks and sands. Select rocks were also analyzed from Old and New Rexhame Beach. The Green Harbor Public Beach is adjacent to the jetties defining the mouth of Green Harbor. At the time of sampling, this beach had extensive areas of colored sand, so multiple samples were taken of both “normal” and colored sand. This beach is different in that the jetty placement (~1963) helped expand the beach versus historical maps.
Typically, two or more specimens were prepared from each sample. One was analyzed for crystallite shape and size, others were analyzed for mineral identification. The analyses of quartz, feldspars, clinochlore, and mica are very challenging because of their grains’ asymmetric shapes: prismatic for quartz, and platelet for most of the other silicates. These shapes mean that orientation and granularity are very common in powdered samples. Various analytical tools were used to define the orientation and granularity and whenever possible, separate out the data sets and correct for orientation.
B. Crystallite shape and particle size
For crystallite size and orientation analyses the sands were sieved and 60–100 or 100–200 mesh fractions, 74–250 microns, and were analyzed without grinding. This was an attempt to measure oriented grains produced and shaped by their environment, versus artificially influencing the shape by grinding. This range was identified empirically, by directly comparing various mesh fractions and examining peak shapes and profiles.
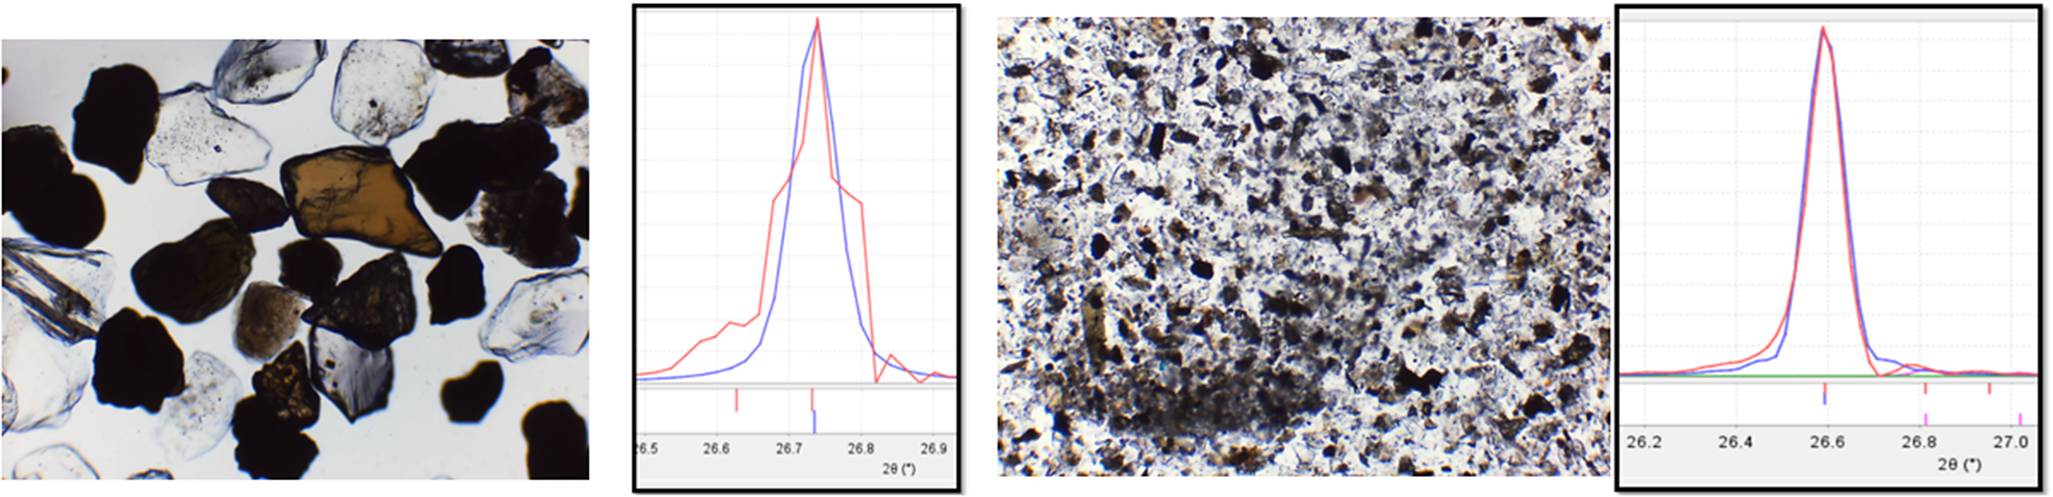
Particle fractions above 250 microns generally exhibited severe granularity in their powder diffraction patterns. In highly granular samples, the peak intensities are random and non-systematic preventing accuracy in the concentration determinations. In addition, peak profiles are often sharp multiples because of contributions from individual large grains (Figure 3). Specimens were analyzed by using March–Dollase and spherical harmonic algorithms, the algorithms helped separate out granularity from orientation effects since orientation can be mathematically corrected. In some cases, during Rietveld refinements, it was clear that the orientation functions could not correct the intensity distribution, phase individual Bragg R factors were large with large visual residuals. Both are symptomatic of granularity. Since most specimens contained a high concentration (>50 wt%) of quartz, the peak profiles and residual patterns could be examined in depth. Both March–Dollase and spherical harmonic models utilizing whole pattern fitting techniques were used in determining the pattern fit, and along with profile shapes, were used in determining whether there were sufficient particle statistics.
Two examples of specimens used for orientation analysis and quantitative phase analysis. The left pair of figures is for an unground specimen. The diffraction profile of quartz is very ragged and is indicative of granularity. The right pair of figures shows a specimen with reduced particle size, a more random orientation, and the associated smooth diffraction profile.
C. Quantitative phase analyses
Samples were ground and passed through Sieves to isolate sub-74 micron fractions that were used for quantitative phase identification. To ensure that the separation of the particle sizes did not influence the results, a whole sample was ground by hand to a uniform color. The human eye can detect 50-micron particles, so we assumed the size was similar by visual examination when grinding produced a uniform appearance without visible grains.
By the end of the study, peak profiles, profile fits and refinement factors were studied for >50 data sets as a function of sample treatment – grinding and sieving. Granularity and orientation were identified in most data sets including those ground by hand. Sieving below 325 mesh (sub 44 microns) was required to remove orientation and granularity influences from quartz. A few samples were also attrition milled and sieved below 325, which provided the best fits (that is low residuals, well-fit peak profiles). One set of samples was ground by a pneumatic hammer and then passed through 325 mesh sieves. This produced low R factors, R f below 7.0, and well-fit profiles; however, the data also showed evidence of microstrain and small amorphous content. Some pebbles and small rocks required extra effort and were placed within a stainless steel cylinder and piston, then the piston was hit with an impact hammer. Once fractured to sub mm sizes the powder could be hand ground and then sieved. Fundamentally, the refinement factors were very sensitive to granularity since the computed peak profiles cannot compensate for the raggedness brought about by diffraction from multiple large grains and unpredictable peak intensities. Several times the same specimens were reground producing better fits and lower R f factors.
Theoretically, one wants to have crystallite size below 10 microns and optimally 1 micron to ensure proper particle statistics. However, overgrinding can also cause loss of crystallinity and increase strain. Light microscopy showed that many of the sub-74-micron crystals included inclusions, defects, and crystal clusters – all of which would produce multiple crystallites per particle and improve particle statistics. Finally, the same spherical harmonic software, when applied to these heavily ground powders showed random orientation. Most powders, when ground below 44 microns, were randomly oriented.
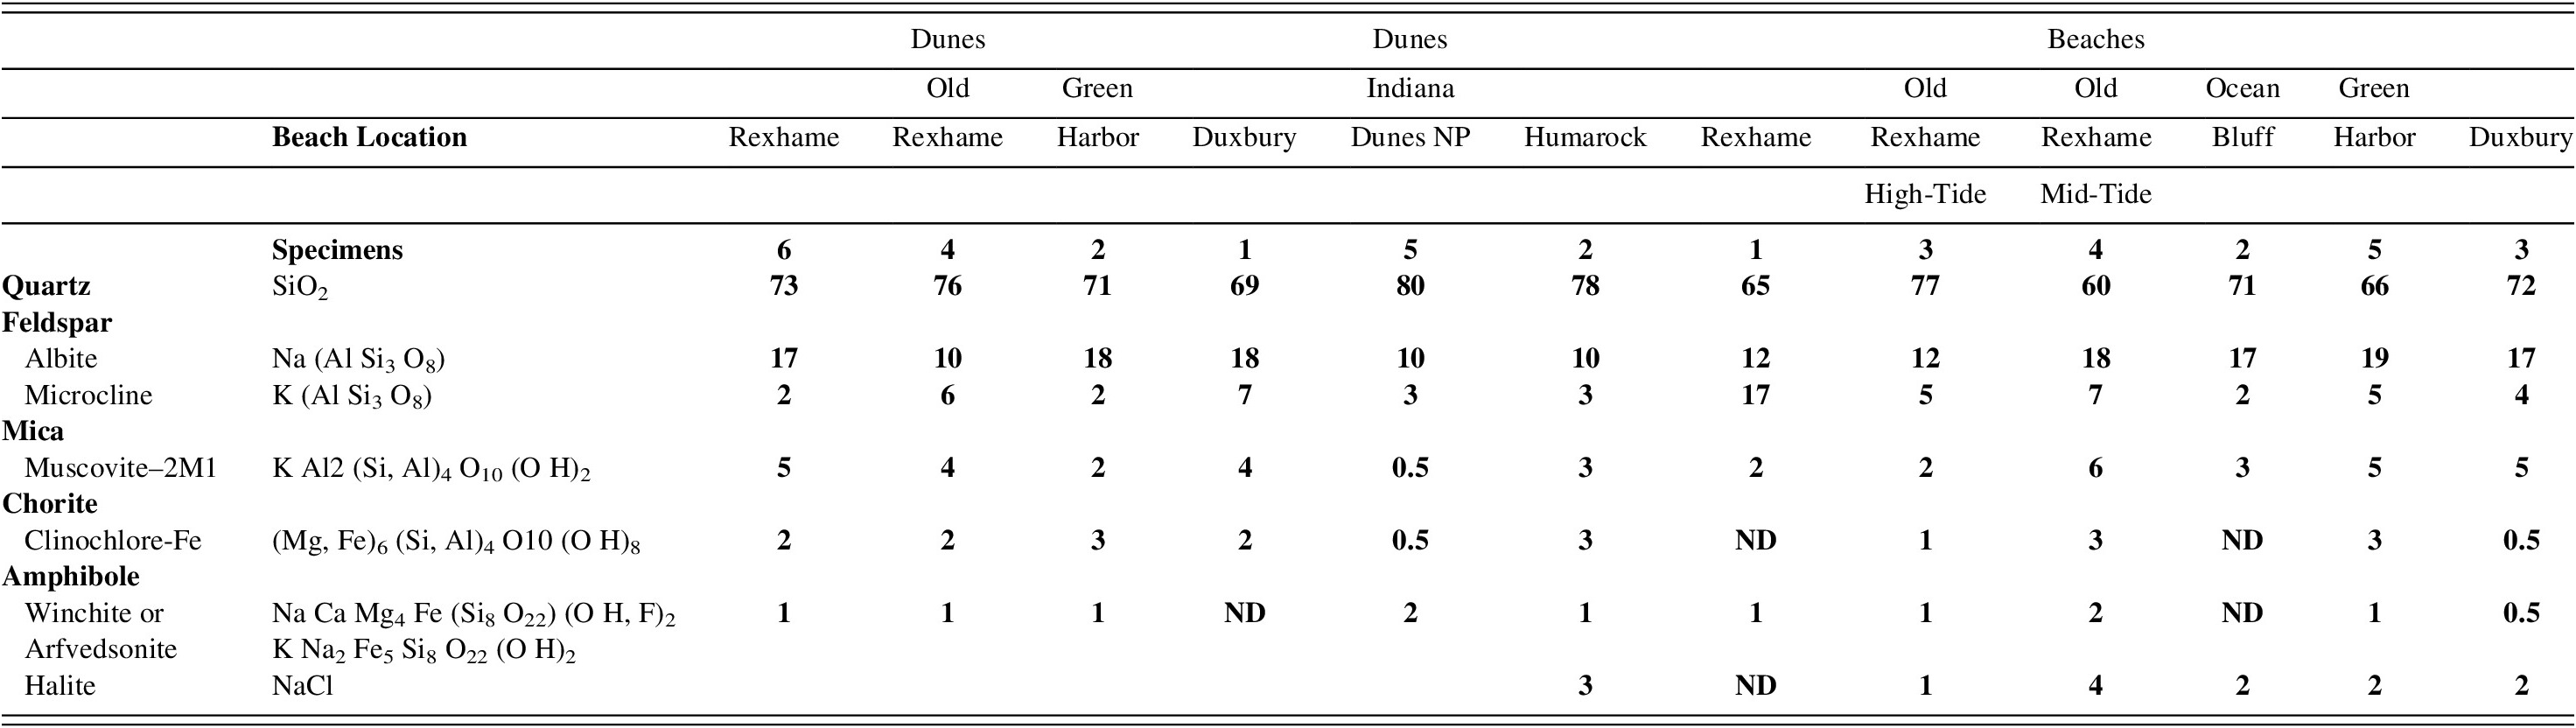
As explained in the discussion, two methods were used to separate out granularity from orientation effects. If a specimen failed these tests, and exhibited high granularity, it was not used for quantitative analysis. Overall, 38 data sets were used in the quantitative analyses shown in Table II.
Bulk compositions of dune and beach sands in weight percent. Specimens taken from the same sample were averaged. There are 38 samples represented in this table.
D. X-ray powder diffraction (XRD)
Data were collected on a Bruker D-2 benchtop diffractometer equipped with a LYNX-EYE strip detector. As described above, two types of specimens were prepared. Specimens were mounted onto a zero-background holder in a cavity approximately 1 mm deep. Data were collected with a 0.02 step size, a 0.6° incident slit, and 3 mm anti-scatter slit, with 1 s steps for a total time of 1 h from 5 to 70° 2ϴ and rotated at 15 rpm. Measurements were taken at 30 kV and 10 mA. Overall the samples were highly crystalline and typically produced data sets with a peak height maximum above 10,000 counts and noise levels under 100 counts. This practically ensured that all phases above 1 wt% were accounted for.
In a few instances, rocks were analyzed without grinding. This was usually after examination in an optical microscope indicating that the sample was finely grained. This worked, and in these rocks, phase composition was analyzed directly without specimen preparation. The rock was mounted on 2-sided tape in a deep well cavity mount. Care was taken so that the area of interest was in the focal point of the diffractometer. The intensity distribution of the as-analyzed rock matched those of a randomly oriented single crystal reference material.
What was unusual about this study is that the ICDD provides state-of-the-art data analysis software with PDF-5+ Release 2025 and JADE Pro. The compositions were analyzed by Rietveld whole pattern fitting methods that examine the atomic structures of the minerals. Crystal orientations are being measured by whole pattern multidimensional spherical harmonics. Crystallite sizes were measured for each reflection. Both the spherical harmonics and Rietveld analyses were developed for routine analyses in the last 20 years and were not widely available during most of the previously published investigations of Massachusetts beaches and coastal dunes. These applications were both available in the JADE Pro toolkit (JADE Pro, 2024).
During the course of the research, identified minerals were recorded and entered into a custom file in PDF-5+ (Kabbekodu et al., Reference Kabekkodu, Dosen and Blanton2024) The custom file eventually contained 43 mineral references including several composition variations of amphibole, feldspar, clinochlore, mica, and several types of garnet. This file was used for phase identification and quantitation by the intelligent reference intensity ratio method (Fawcett et. al. Reference Fawcett, Kabekkodu, Blanton and Blanton2021). From the most frequently identified phases, including all minerals in Table II, a custom file was developed within JADE Pro that was used primarily for quantitation by the Rietveld whole pattern fitting method (WPF). The custom file included the seven most frequently identified phases. After an initial refinement cycle where scale factors and unit cells were refined the pattern fit and residual pattern were analyzed and additional phases were added as needed (i.e., ilmenite, epidote, etc.). A block refinement with a successive cycle strategy was used as described in the analyses of cement (Fawcett et. al., Reference Fawcett, Gates-Rector, Rost and Blanton2022) and steel slags (Lyza et al. Reference Lyza, Fawcett, Page and Cook2023). Similar to cement and slags, the sand samples contained multiple phases, some overlapping, and multiple phases below 5 wt%. The procedure used encompasses careful analysis of peak profiles and residual patterns along with typical statistical measures like the goodness of fit, R f, Bragg R, and E values.
E. Optical microscopy
Microscopy images were collected using a Swift light microscope with incremental objectives of 4×, 6×, 40×, 60×, and 100×, along with a magnifying camera at 10×. The total magnification range was 40× to 1000×. A 70-micron calibration dot was used for particle size validation, which found 600× to be the appropriate magnification range to properly analyze particles sized between 1 and 10 μm. For lower magnification and larger particles, a calibrated grid was used for particle size estimation. A 40× or 60× magnification was used to image 100–200 mesh fractions that correspond to 74–149 microns. If needed, Type A microscope oil was used to aid in the dispersion of particles for samples that tended to cluster, as well as changed the reflective index, allowing for certain particles to be imaged more clearly.
E. X-ray fluorescence (XRF)
Energy dispersive XRF measurements were taken with an AmpTek Exp-2 spectrometer equipped with a microfocus tungsten tube and an AmpTek 123 SDD detector. XRF-EDS measurements were primarily performed to complement the XRD analyses. Therefore, powdered samples were analyzed that were exactly the same as those prepared for XRD analyses. The powders were packed to a 2 mm thickness. The author deliberately sacrificed the best quantitative practices (i.e., a fusion or pellet press) to sample similar sampling volumes and the same specimens as the XRD preparations. Crude quantitative measurements were made by comparing the sands to well-characterized slag samples that originated from EC Levy Co. The slags used were calcium and aluminosilicates so that rough estimates could be made on Si, Al, Ca, Cr, Ti, and Fe concentrations. For most other elements only relative counts were observed. This configuration was relatively insensitive for elements below sodium.
G. Ultraviolet (UV)
Rock samples were analyzed with UV irradiation and photographed. Several of the minerals analyzed in this study are known to be fluorescent. White, orange, and blue fluorescent minerals were observed. A UV flashlight, uvBeast, producing 385–395 nm radiation at 30 Watts was used.
H. Particle size
Particle sizes were determined using sieves with mesh sizes of 60, 100, 200, 325, and a collection plate for particles that passed 325 mesh. The sieves were USA Standard under ASTM E-11 for woven wire sieves. The beach sand samples were removed from the collection jars, placed on a watch glass, and put in a drying oven at 150°C for at least 2 h. The sands were lightly pressed using a spatula to separate clumps and then sorted via stacked sieves, weights were then recorded on a Fischer Science Education microbalance. Most dune samples were dry as received, various beach and river samples were generally damp to wet so they had various amounts of salt, which was subsequently determined by XRD. With two exceptions, salt concentrations were under 5 wt%.
III. DISCUSSION
The analytical results were divided into four sections. Section A is on dune and beach sands characterized by their compositional similarities. Section B discusses the rocks and cobble berms which are noted for variety. The differences in these two sections are directly related to sampling selection and experimental design. For most beach and dune samples, the author selected a sample that was visibly similar in size and color to those in the immediate surrounding area. For rocks, cobble, and pebble samples the author was using color and overall appearance as a guide, and deliberately examining variations, studying both common rocks and unusual rocks. In the discussion, it is denoted which ones were typical and which ones were unusual. A third section was added on colored sand. Colored sands were quite visible on dunes and numerous beach samples, they were also visible in tidal pools and areas exposed to either high wind or wave action. The fourth section describes the composition of sands from Indiana Dunes National Park which has similarities to the Marshfield sands.
A. Dune and Beach Sands
The averaged bulk (>1%) mineral composition of the Marshfield beaches and coastal dunes are very similar and similar to other reported mineralogical analyses of Massachusetts and many New England beaches. Quartz and the alkali feldspars, microcline, and albite, comprise ~90% of dune and beach samples. These are usually followed by muscovite and clinochlore, and varieties of amphibole. Fundamentally, eight minerals account for most of the sand composition, typically >95% (Table II). Relative to amphibole, the powder XRD usually matched either ferri-winchite or arfvedsonite, but not both, and the match with the highest goodness of merit for a specific specimen was reported. The amphibole was typically in low concentration making it difficult to distinguish between the two. Halite was identified in most of the beach specimens after the samples were dried. Bulk minerals that were occasionally found in the dune and beach sands included ilmenite, epidote, and kaolinite.
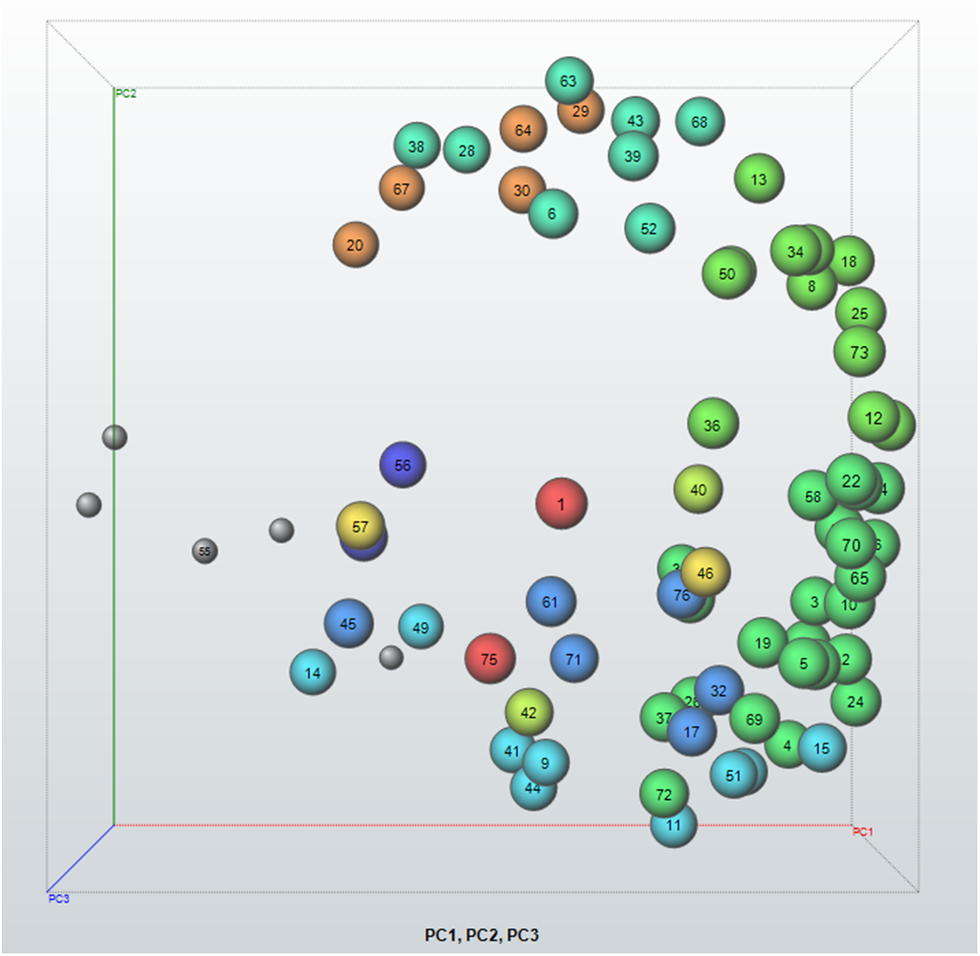
A cluster analysis was applied to all the data sets, and as expected from the mineral composition, clustered most of the beach and dune samples into similar groups (Figure 4). These cluster groups were related to composition and less to the sampling location. All clusters contained quartz but some of the clusters were separated into groups based on concentrations of albite, microcline, muscovite, and ilmenite. In Figure 4, high-concentration quartz data sets are found on the right and tend to lower concentrations on the left, along principal component axis 1. Clusters 5 and 6 in shades of green, right center of Figure 4, contain sands >80% quartz and albite, several representative samples are shown in Figure 5 along with the reference pattern of albite.
Cluster analyses of 76 data sets. The data sets contained beach and dune samples as well as composite rocks (i.e., granite, basalt, sandstone) and pebbles. The series of clusters in an arc to the right of the Figure are primarily beach and dune samples with high amounts of quartz. A quantitative phase analysis was done on every data set.
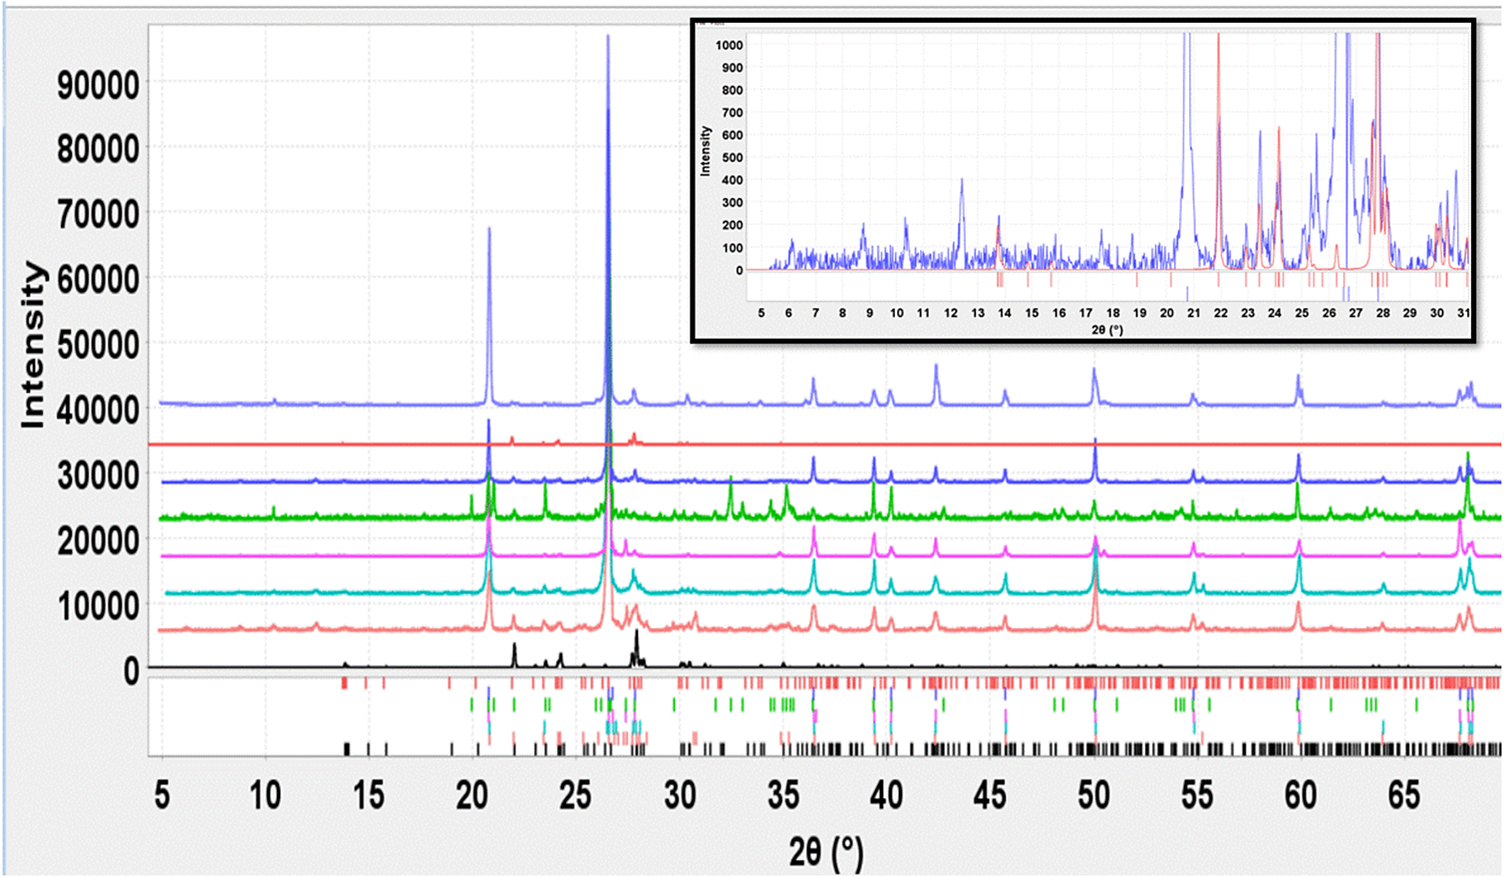
A collection of dune and beach sand data sets showing predominately quartz and albite. The insert enlarges the low-angle region of a dune specimen from Old Rexhame Beach and identifies which peaks match an albite reference PDF 04-017-1022. These are also the bottom two data sets in the main figure.
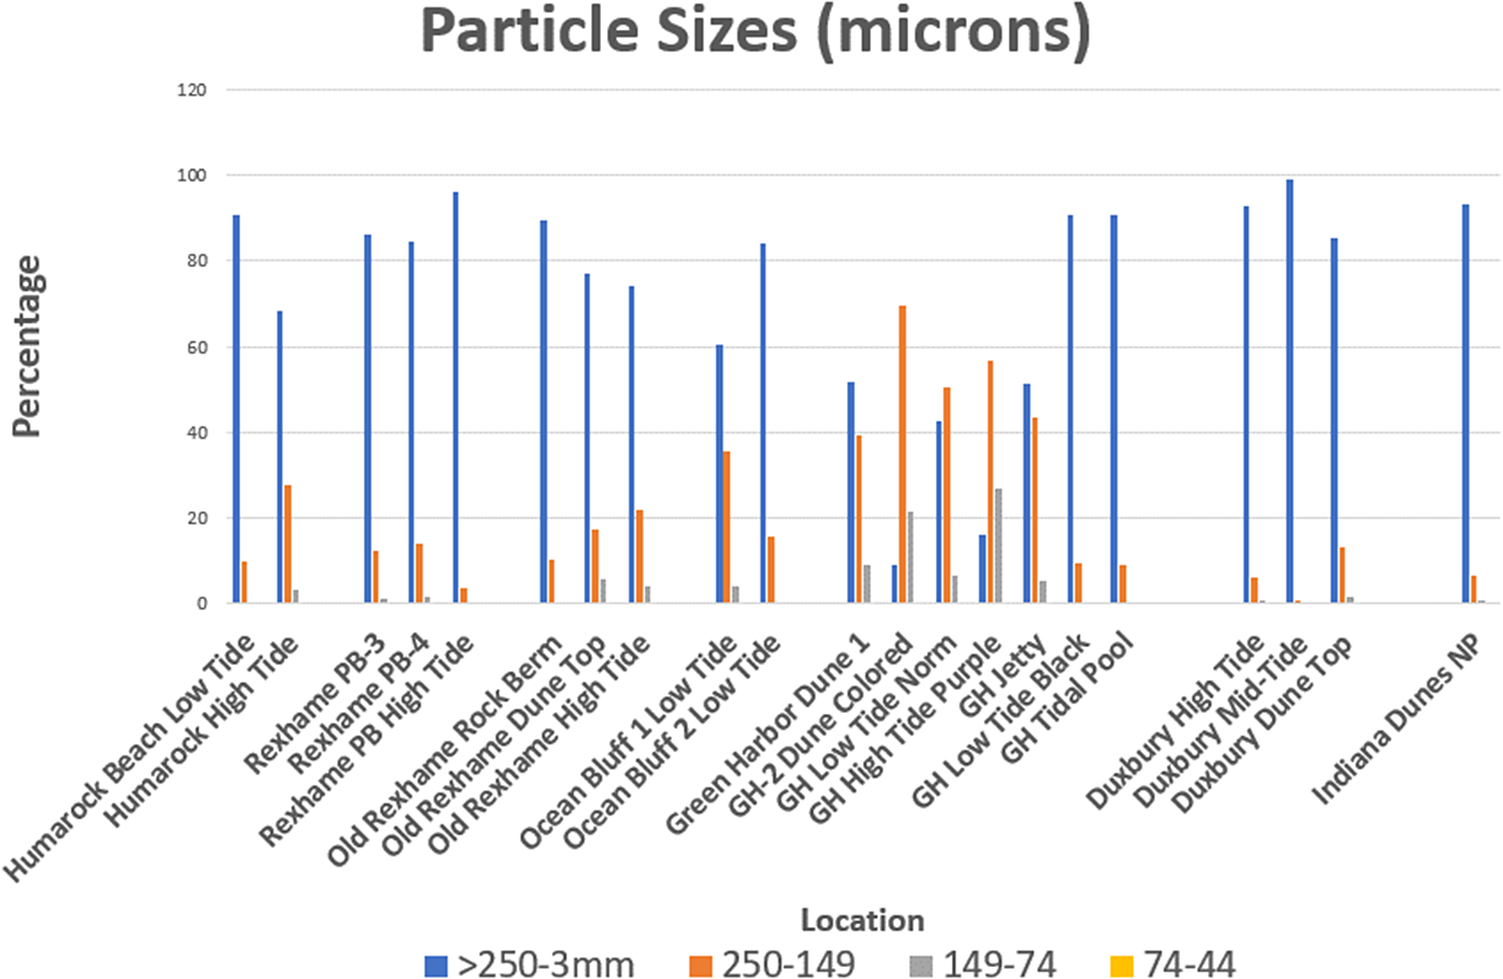
Particle size analyses of the various sands often showed expected shifts to finer distributions for the dune sand compared with the beach sands. The sands on Green Harbor Beach were very distinct with a much higher fraction of medium-fine and fine sands (under 149 microns). During the sampling period, the adjacent Green Harbor was being dredged by US Army Core of Engineers contractors (Patriot Ledger, Dredging work underway in Marshfield’s Green Harbor (patriotledger.com). The appearance of colored sands and finer particles suggest sediment flow from the harbor to the adjacent beach. In the spring of 2024, the dredging moved from the inner harbor to the adjacent harbor entrance channel. Green Harbor Beach is directly south of the channel entrance. The newspaper article has several pictures of black sediments being dredged. During one visit to Green Harbor Beach, the author observed the dredging of the adjacent harbor channel by the US Army Core of Engineers shallow draft dredge Murden.
In addition, during this same timeframe, 218,000 tons of sand was used to restore Duxbury Beach and dunes. Large power shovels dig in at Duxbury Beach and reshape the sand dunes (patriotledger.com). The sampling for this report was done in an area that was not being actively restored at that time. In this case, composition was very similar to the other beach and sand areas in Marshfield.
The particle and molecular orientation of the quartz, microcline, and albite was studied as a function of location and environment. A recent publication (Soua, Reference Soua2024) cited characteristic differences between inland, coastal dunes, and alluvial deposits in sandstones in Saudi Arabia. In this study, we used crystallite size measurements, reflection-specific crystallite size measurements, March–Dollase orientation, and spherical harmonic orientation functions. The overall particle size (Figure 6) and light microscopy were also guides so that we could look at particle and crystallite morphology. In general, the 149 to 250 micron particle size fraction was examined since the smaller size helped particle statistics, and reduced granularity effects while providing orientation data on as-received powders. This method was only partially successful as the peak profiles in some samples were ragged, indicating granularity. In this fraction, granularity was frequently observed (i.e., >50%) as evidenced by high R f values >12%.
Particle size distribution as measured by sieve fractions. ASTM standard wire mesh sieves were used to separate out the particle sizes.
Two methods were combined to separate out granularity from orientation effects. R factors were systematically recorded and orientation models were applied to all data sets. Statistically, these results were separated into three bins based on R factor >12%, 9%–12%, and 4%–8.9%. We assumed that the high R factor solutions (>12%) were influenced by granularity since granularity influences intensities in a non-systematic manner. For the remaining data sets the peak profiles, particularly of the 100 and 101 peaks of quartz (i.e., Soua’s ratio) were visually inspected to check for peak symmetry and microstrain. A ragged peak profile is the signature of granularity and approximately 25% of the data sets that passed the R factor screen, failed the peak visualization test.
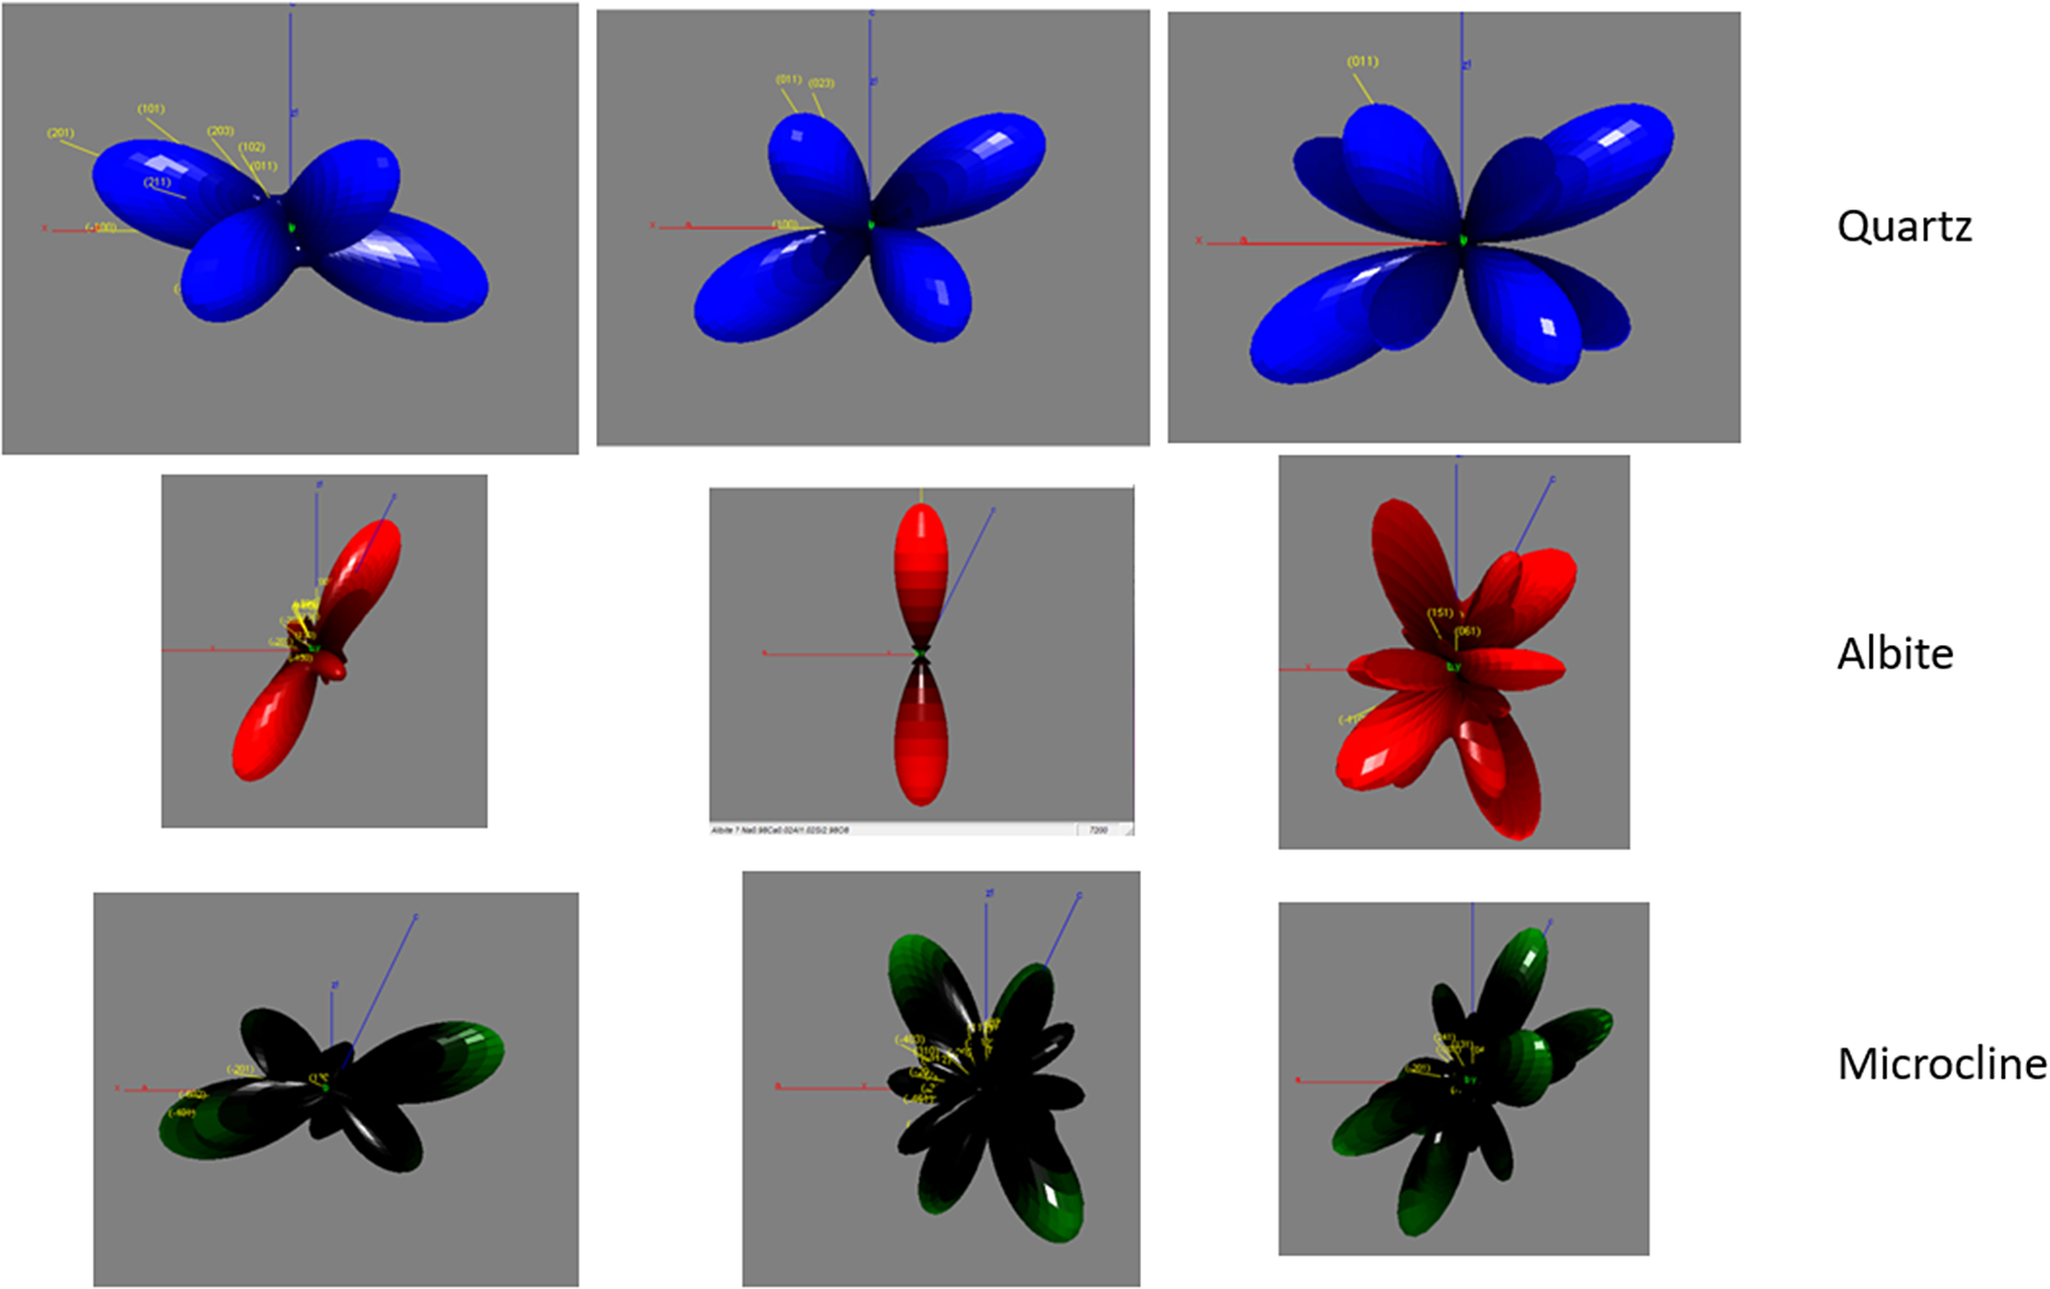
Figure 7, shows the molecular orientation as described by spherical harmonics for several representative samples. An unoriented sample would describe a sphere, and this is the representation that most often showed in ground samples passing 325 mesh (44 microns). The lobs indicate crystallographic directions. In quartz the 101 and 011 directions were prevalent and these are known to be common fracture planes (Brückner et al., Reference Brückner, Dellafant and Trepmann2024) Microcline and albite feldspars indicated direction along cleavage planes. The spherical harmonic analyses helped understand the particle morphology but also corrected the XRD data for orientation effects, allowing for accurate quantitative analyses. Multiple directional orientation modes were found for all three minerals.
Molecular orientation as determined via a spherical harmonic visualization. Several different orientations were found for each major phase, quartz, albite, and microcline.
In some patterns the sizes were directional. The orientation and crystallite size variations in quartz meant that applying the peak height ratio method used by Soua exhibited a very wide range from 0.01 to 1.45. However, once the two orientation/granularity tests were applied and one looked at the remaining data sets the ratio was in a fairly narrow range from 0.12 to 0.30. Crystallite sizes of these remaining beach and sand data sets indicated large crystallite sizes >1000 Å, for unground samples. We assumed the smaller crystallite sizes obtained in several ground samples were a result of the laboratory grinding process. Many of these ground samples showed asymmetric profiles indicative of microstrain.
While the orientation and size changes do indicate the high energies impacting the grains, there did not seem to be a discernable trend. A major difference between this work and the work by Soua is that the coastal dunes in this study were all within 100 yards of the ocean and likely influenced by both sea and wind forces.
One sample was particularly interesting. The Green Harbor Beach dunes are in a protected corner of the beach adjacent to the Green Harbor channel. This area, facing southeast, is not as exposed to the high wind Northeaster storms. Micrographs of the 149 to 74 micron fraction exhibit several near-perfect prismatic crystals of quartz. The crystallite size was >10,000 and it exhibited both 101 and 011 orientation.
B. Rocks, Pebbles, and Cobble Berms
Several of the beaches contained either rock outcroppings such as Beadles and Brant Rocks or cobble berms. The cobble berms were usually adjacent to either coastal dunes or residential building developments. Locations of several cobble berms are documented in the Marshfield Beach Management Plan (2017). The cobble berms are predominately located above the high tide marks and provide some limited storm protection. Rock outcropping also includes a variety of rocks, pebbles, and tidal pools (Figure 8). The action of strong waves and tidal flows often sorts the rocks by size.
Pebbles (1 to 3 mm) found at Beadles Rock, similar collections can be found in most area beaches. This shows the range of colors and various rock types. Most of these pebbles are conglomerates containing quartz and several mineral species. Some of the dark pebbles are red-purple when fractured and composed of albite and muscovite in combination with quartz.
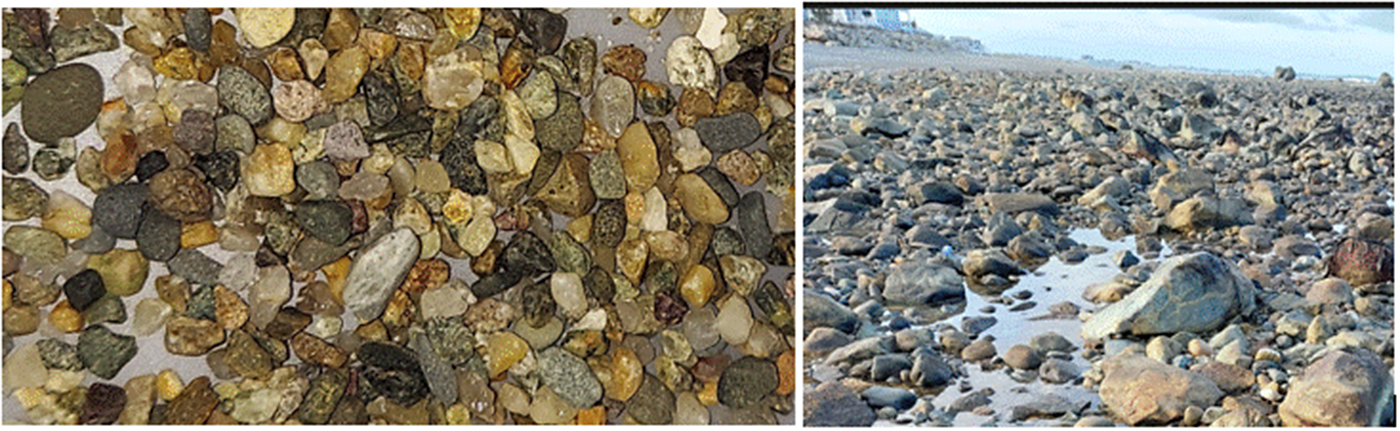
Rocks in the area are of all generic types – igneous, sedimentary, and metamorphic. This has been attributed to historic glacial movement and the river sedimentation during glacial retreat, and more recently to deteriorating cliff and rock formations. Analyses of the rocks identified several rock types by appearance and chemical composition. This included granite, schist, granodiorite, basalt, sedimentary sandstones, and gneiss. These rocks all have quartz as a major mineral (25–50 wt%) in the composite, feldspars, clinochlore, and muscovite were also common. Rocks were analyzed that contained >30 wt% of the following minerals, albite, microcline, muscovite, and clinochlore. These are the minerals that comprise the majority of beach and dune sands as shown in Table II. In addition, 29 wt% goethite (FeO(OH)) was identified in the bog ore, >25% epidote was identified in 3 samples, sand, pebbles, and green rock. Relatively pure quartz rocks and pebbles are also found. In total over 40 references and ~25 minerals were identified from this variety of rocks, including common minerals such as dolomite, kaolinite, phlogopite, and tistarite. A complete list along with PDF identification numbers is provided in the Supplementary Appendix. Most of these minerals have been identified as common sand minerals by both Mindat and the Sandatlas.
Some of the less common rocks are shown in Figure 9, and described below.
Less common rocks included bog iron ore (left), and a variety of fluorite (right).
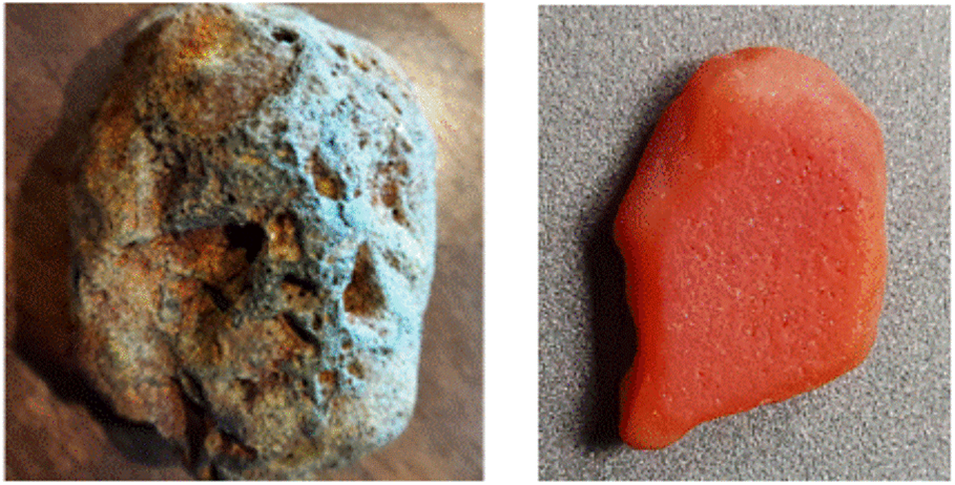
Three of the rocks analyzed were “bog iron,” the source of iron for the first foundries in colonial America. Iron Making: Smelting (U.S. National Park Service) (nps.gov) The composition and appearance of the samples match those found in several historical references and Mindat cites a shoreline location in nearby Hingham. The rocks were composed of goethite, quartz, wustite, iron, and magnetite. The visible black on the outer surface was magnetic. Bog ore has been found in many rivers and bogs in Massachusetts. This rock may be common to the area, as the author believes he has observed these rocks previously along Old Rexhame Beach.
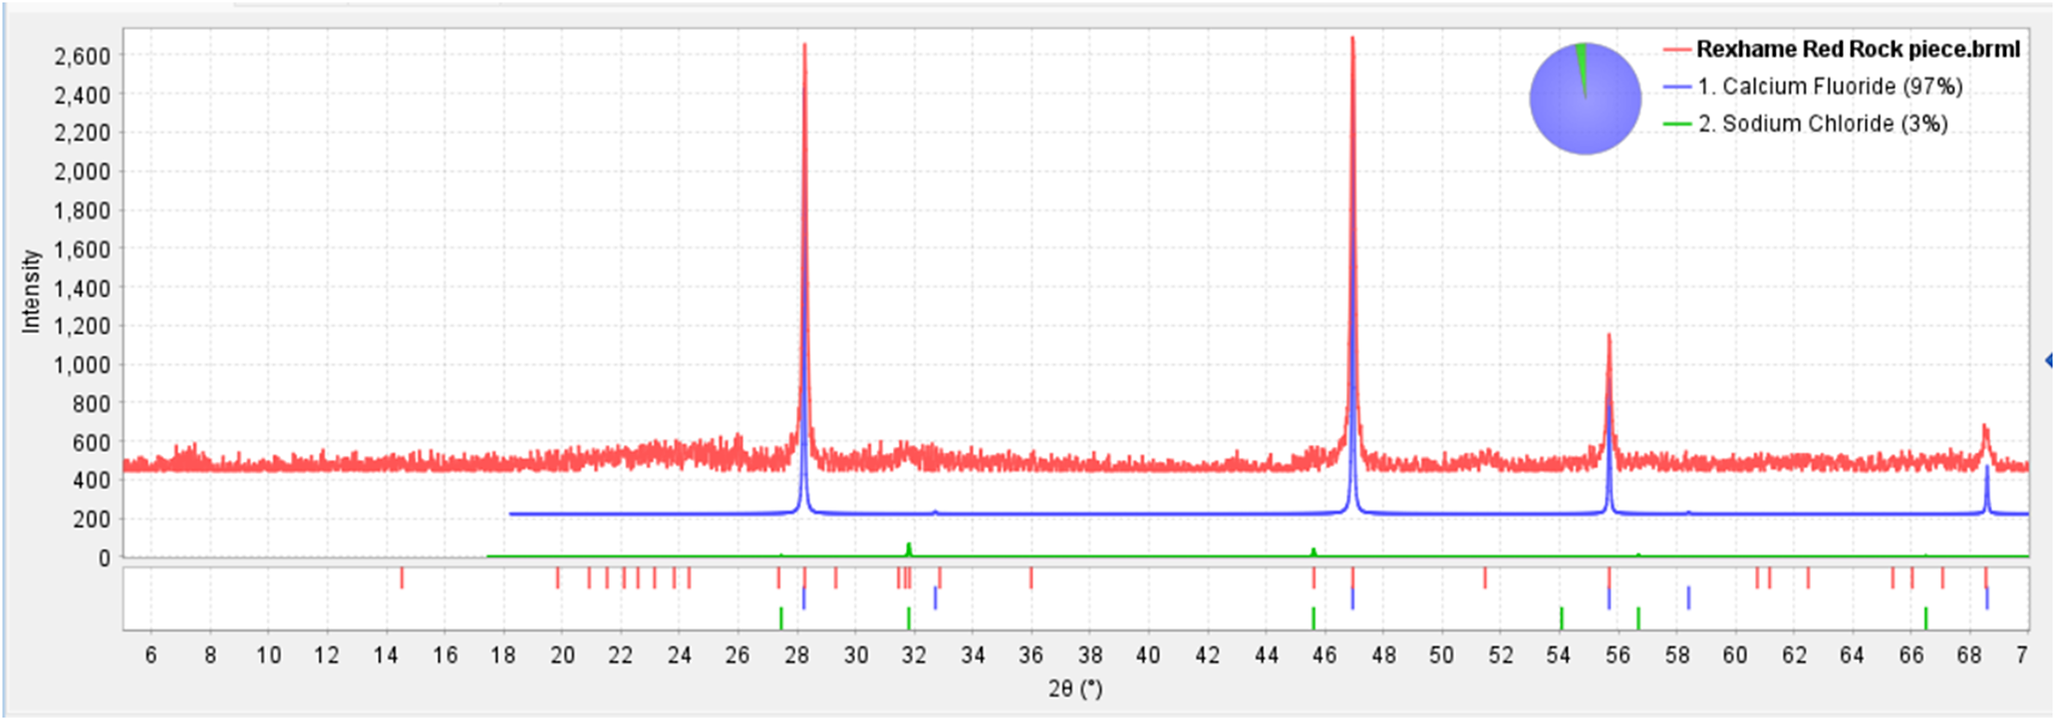
An orange-red rock was found in a tidal pool on Old Rexhame Beach. Light microscopy showed the rock to be polycrystalline, so the rock was directly mounted into the diffractometer for analysis without any preparation. The rock produced the characteristic pattern of fluorite (Figure 10), which is usually CaF2 and has a characteristic purple color. XRF analysis found three cations, Zn > Ca >> Fe so the formula would be (Zn, Ca)F2 with Fe enrichment. This explains the unusual orange-red coloration. Iron-enriched red fluorite is known, as well as, a (Zn,Ca)F4 which is described as colorless.
The powder diffraction pattern of an orange-red rock identified as a variety of fluorite.
C. Colored sands
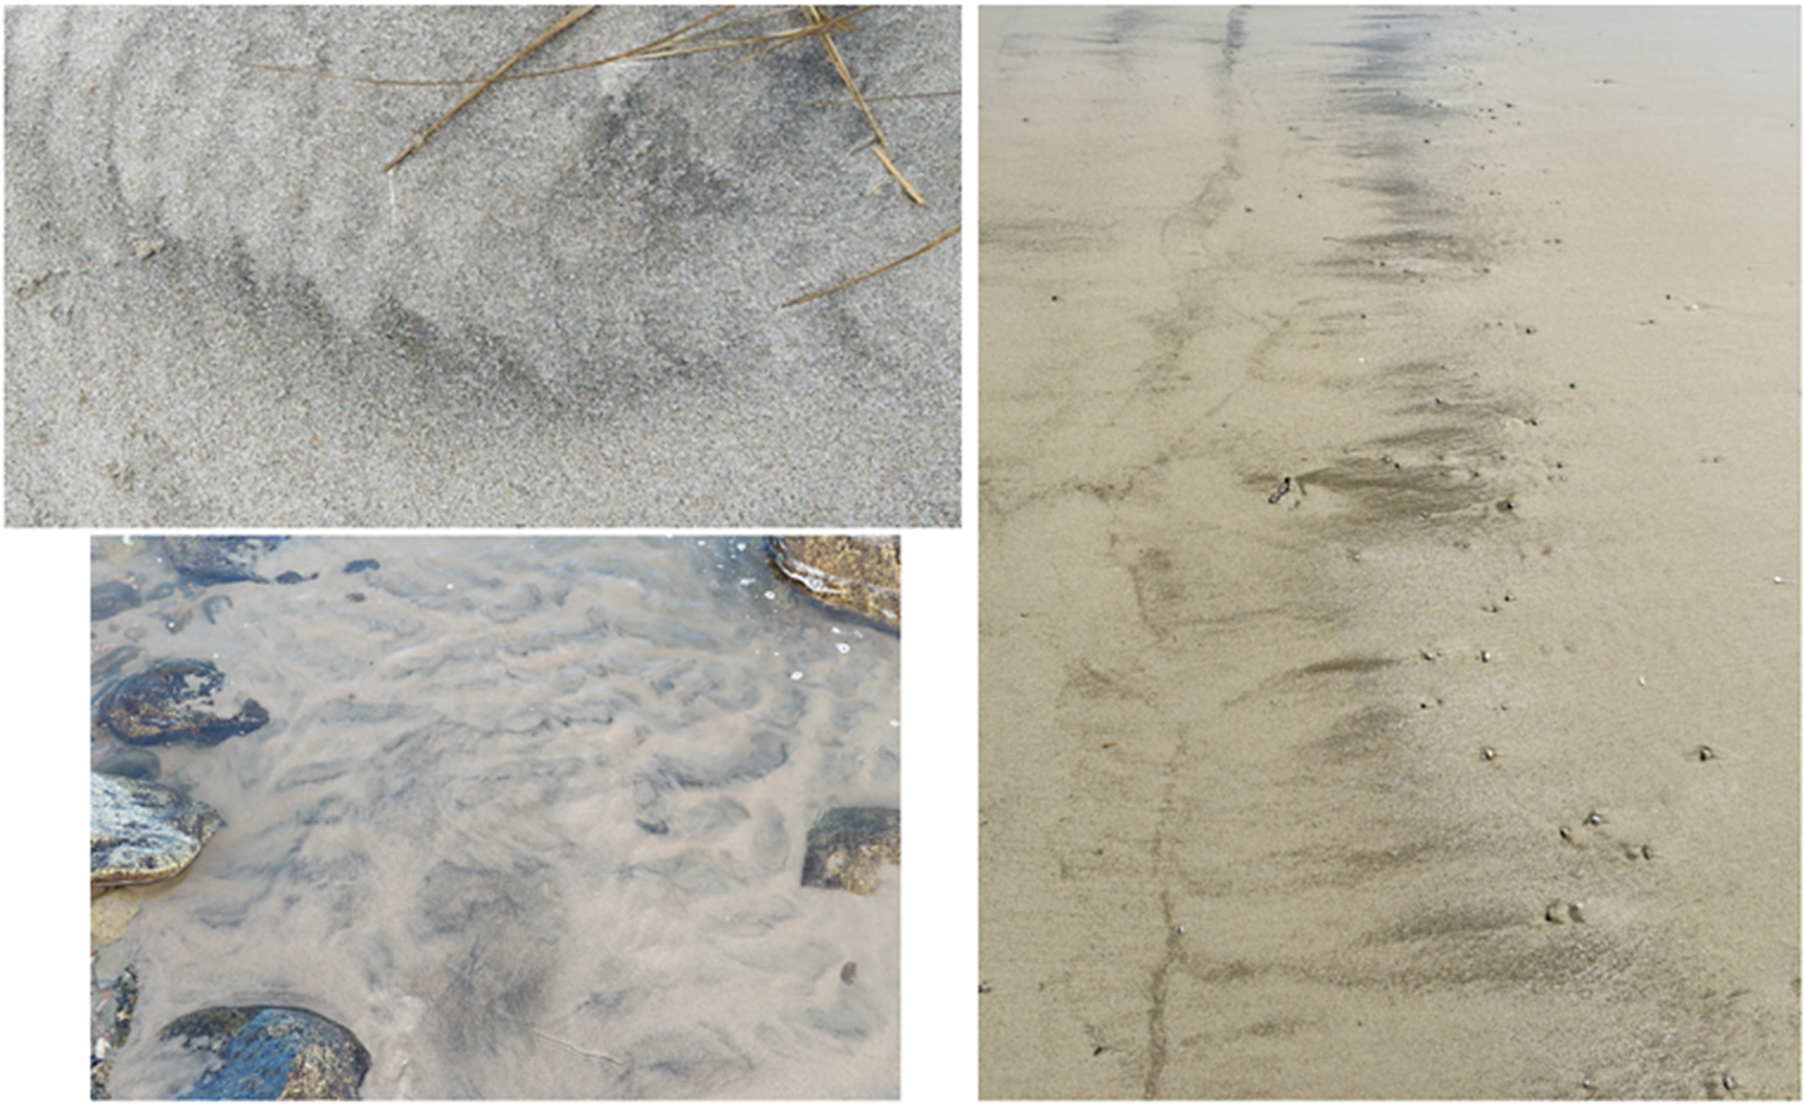
Colored sands were observed in swirling patterns on dunes, on the beaches, and in tidal pools. The action of high winds and tides concentrated various dark particles. Samples of the colored sands were taken at four different beaches, three are shown in Figure 11. It was also noticed that the dark sands were generally of smaller particle sizes and would often concentrate in the 74 to 159 micron particle size during sieving.
Clockwise from the top left, colored sand pattern in dune, on the beach, and in a tidal pool. These were taken at three different beaches.
The most common mineral in these samples was ilmenite, Fe(TiO3), and a chemically related Ti-enriched hematite (Fe0.927 Ti0.073)2O3. These minerals were black and magnetic and a magnetic separation was used to concentrate the particles for one sample. Even in the concentrates, quartz was identified as a major component, and quartz particles with inclusions were often seen in the microscope. The diffraction pattern of ilmenite in dune, beach, and tidal pools is shown in Figure 12. Ilmenite black sands are very common and have been observed on beaches, worldwide (Google images). Ilmenite is a common component of metamorphic and igneous rocks per Wikipedia.
Ilmenite (black) and quartz (green) reference patterns at the bottom compared with black sand samples from dunes, rock berm, 3 beaches, and a tidal pool. The concentrations of ilmenite ranged from 5 to 15 wt%.
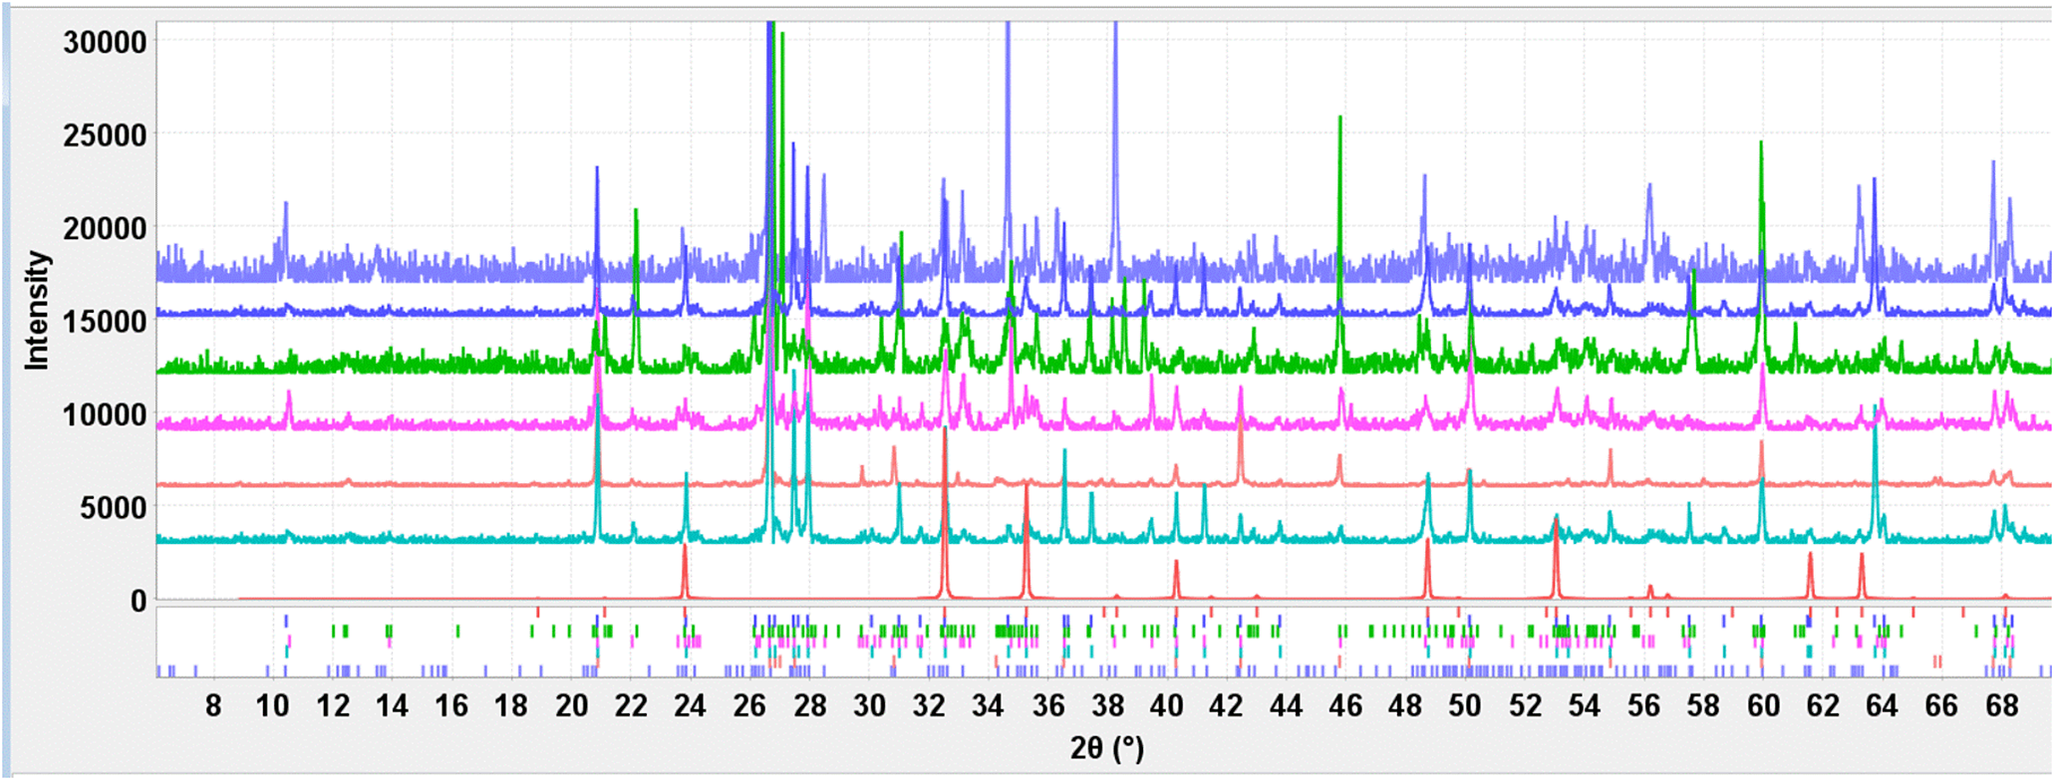
However, there were variations observed among the samples (Figure 13) and with the light microscope. Some colored sands had high concentrations of muscovite and clinochlore IIB-Fe, which are purple and black, respectively. Other black sands contained higher concentrations of the amphiboles, both ferri-winchite and arfvedsonite contain Fe. All these minerals are denser than quartz and the combination of small size and high density caused the minerals to concentrate. Signature peaks for muscovite and amphibole are also seen in select patterns between 8 and 10 degrees two-theta in Figure 12.
Photographs of ground samples. Clockwise from the top left, dune sand, beach sand, sand produced from ground red granite (albite), black sand produced from muscovite, white sand contained calcite, and other calcium-containing minerals.

At Green Harbor Beach there was extensive coloration in the sands, especially on the north side of the beach adjacent to the Green Harbor channel where the Green River mouth is located. There were colored sand areas at the dunes, high tide, and low tide regions. At the time of sampling, Green Harbor and the Harbor Channel were being actively dredged. The particle size analyses shown in Figure 6 indicated a substantial amount of fine sand when compared with other area beaches. It is speculated that the dredging was stirring up fine sediments that were carried by tidal forces onto the adjacent Green Harbor beach. The four distinct areas of coloration had different minerals accounting for the coloration and it would appear that some of these minerals were separated by the currents and tides based on their density. The high tide sands contained ilmenite, Ti-enriched hematite and the iron silicate garnet almandine, these 3 minerals have densities between 4.2 and 5.2 g/cc. The other two areas, dune and low tide, contained clinochlore and muscovite with densities from 2.85 to 2.95 g/cc.
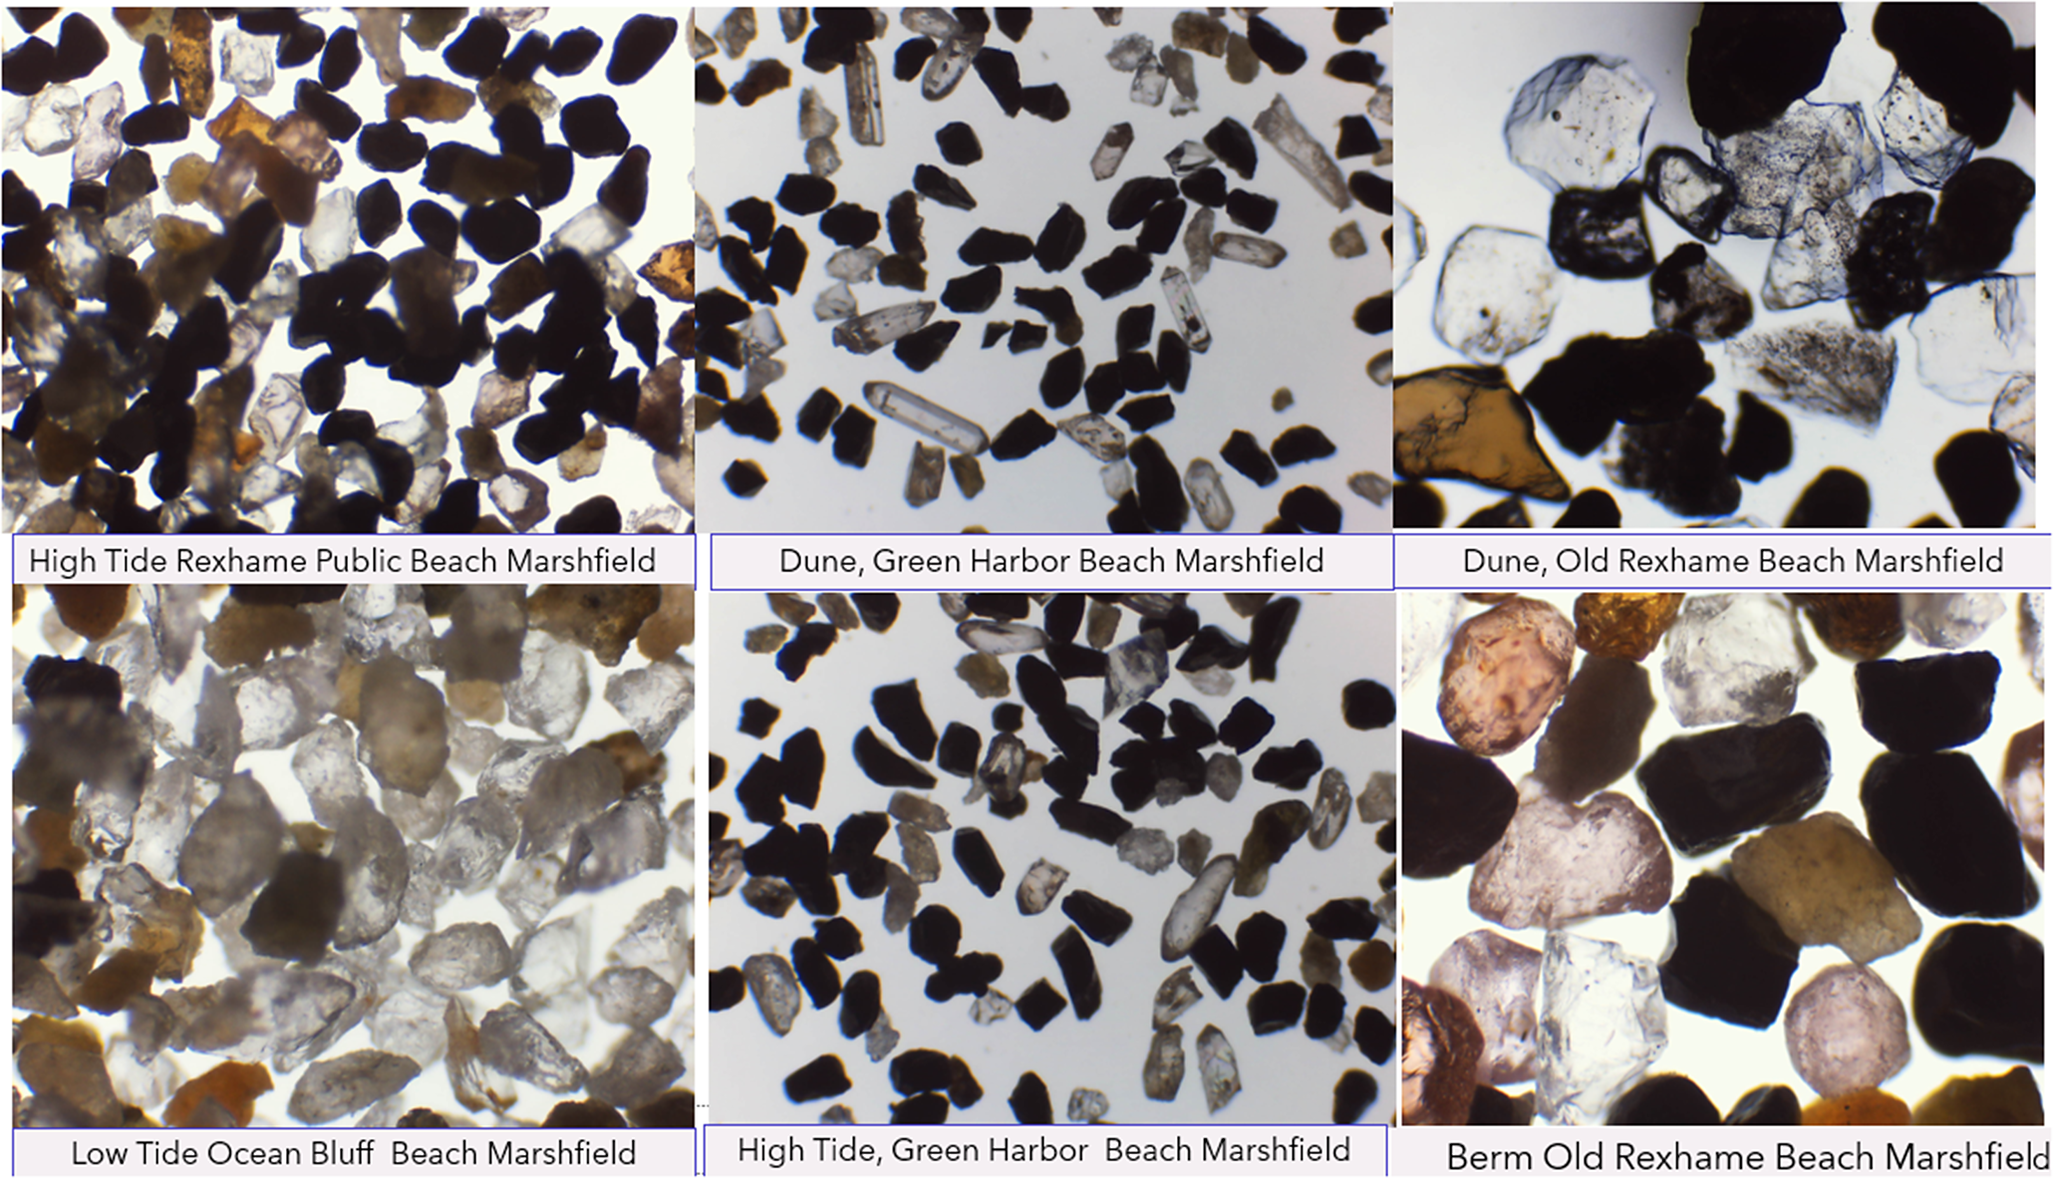
Other colors were observed microscopically (Figure 14) among the grains in unground but sieved sand samples. Greens, red, pink, and orange grains were observed. By analyzing colored rocks it was deduced these grains were probably epidote, albite, almandine, and microcline. Several of these colored sands are shown in Figure 13 and various minerals in Figure 15. The lightest colored sands have contributions from calcite, hydrocalumite, and thaumasite. Almandine-garnet has been frequently identified as a cause of pink sands on the North Shore of Boston, while two sand samples contained almandine, the most common source of red was red albite. Several samples of albite were analyzed from rocks and shown in Figure 16. The orange and tan colors were frequently microcline. It should be noted that microcline and albite can be many colors, the colors often reflecting trace elements in the composition. High-purity microcline and albite are colorless. In the Ocean Bluff sands, there were many shell fragments of calcite. Along with mineral identification by XRD most of the colored sands and associated rocks were analyzed by XRF-EDS. This identified characteristic elements such as Mn, Fe, K, and Si in muscovite, Fe and Ti in ilmenite (Figure 17), Ca, Al, and Si in epidote.
Micrographs at ~10 to 40× magnification showing sand grains of various colored sands in different locations. The pink grains on the bottom right are the garnet almandine. The grains in these photos are 74 to 149 microns.
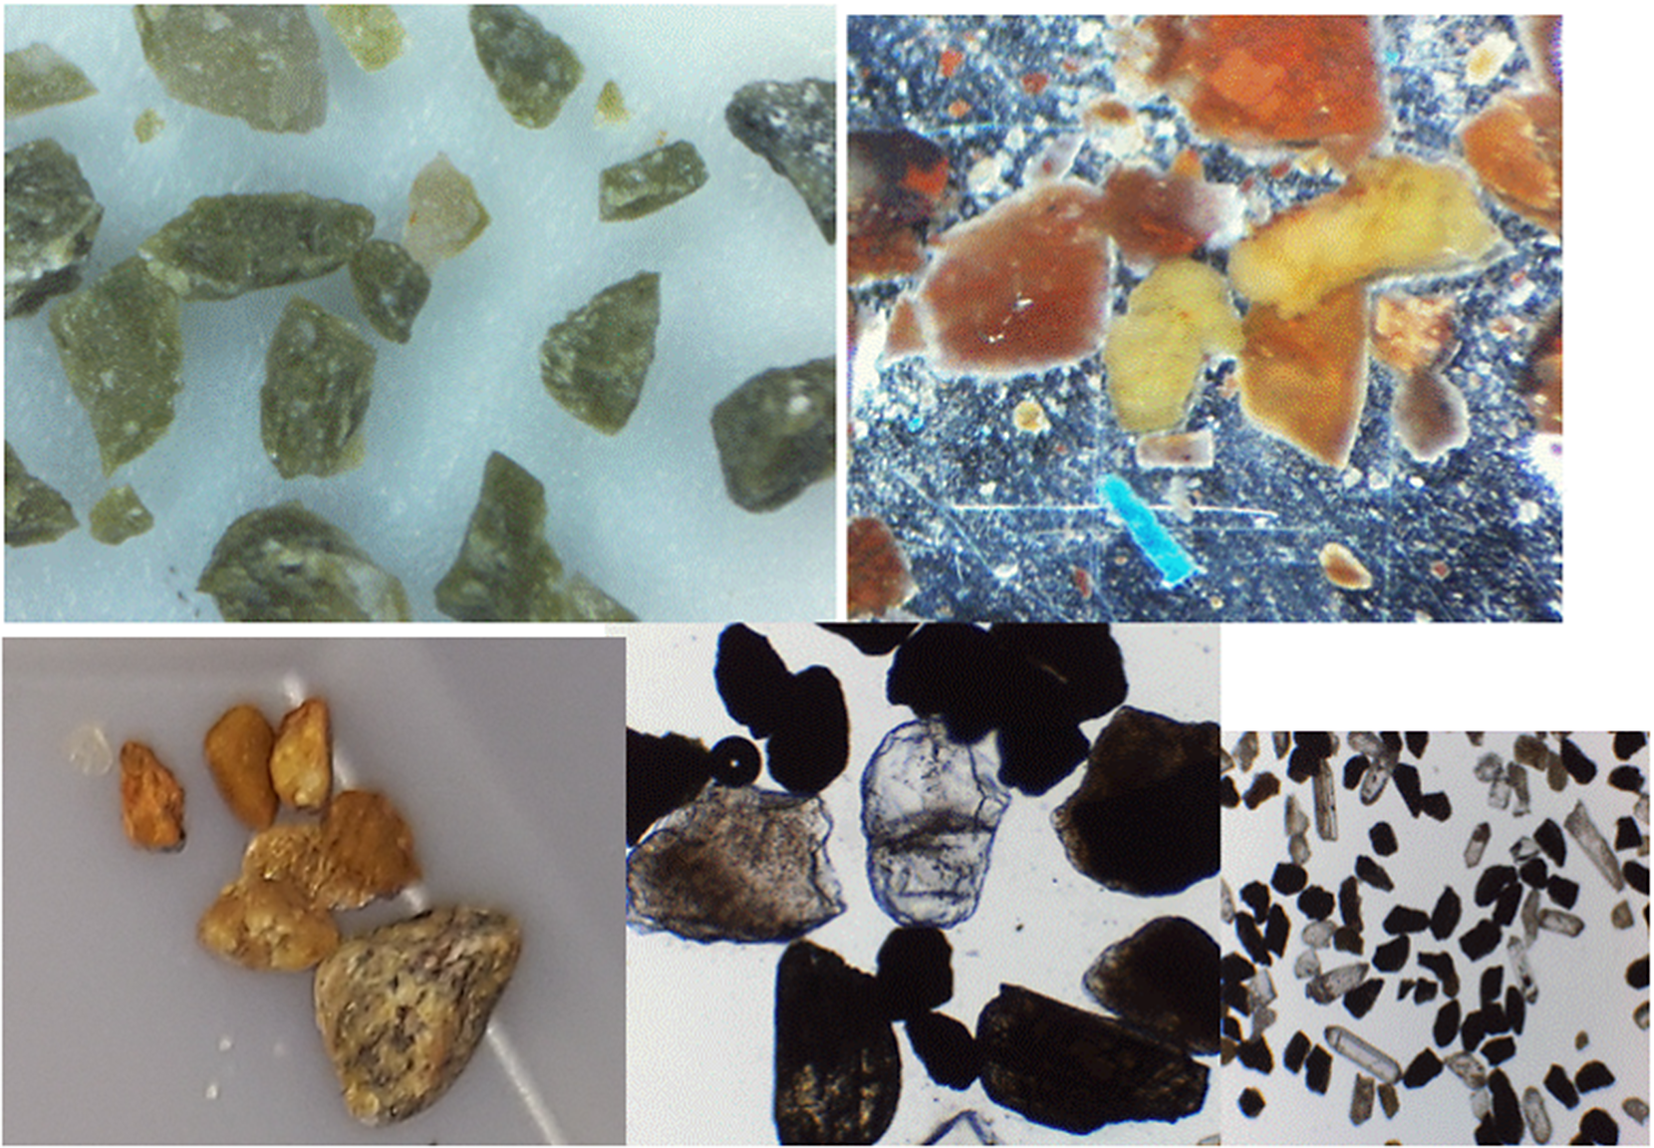
Clockwise from the top left, epidote (olive), albite (red), quartz (clear prismatic), Ilmenite (black), and microcline (light brown). The blue crystal, top right, might be a blue corundum. Albite can be several colors but a small amount of Fe makes it red. The albite and microcline (red and light brown) were common in various colored granite rocks along the shoreline.
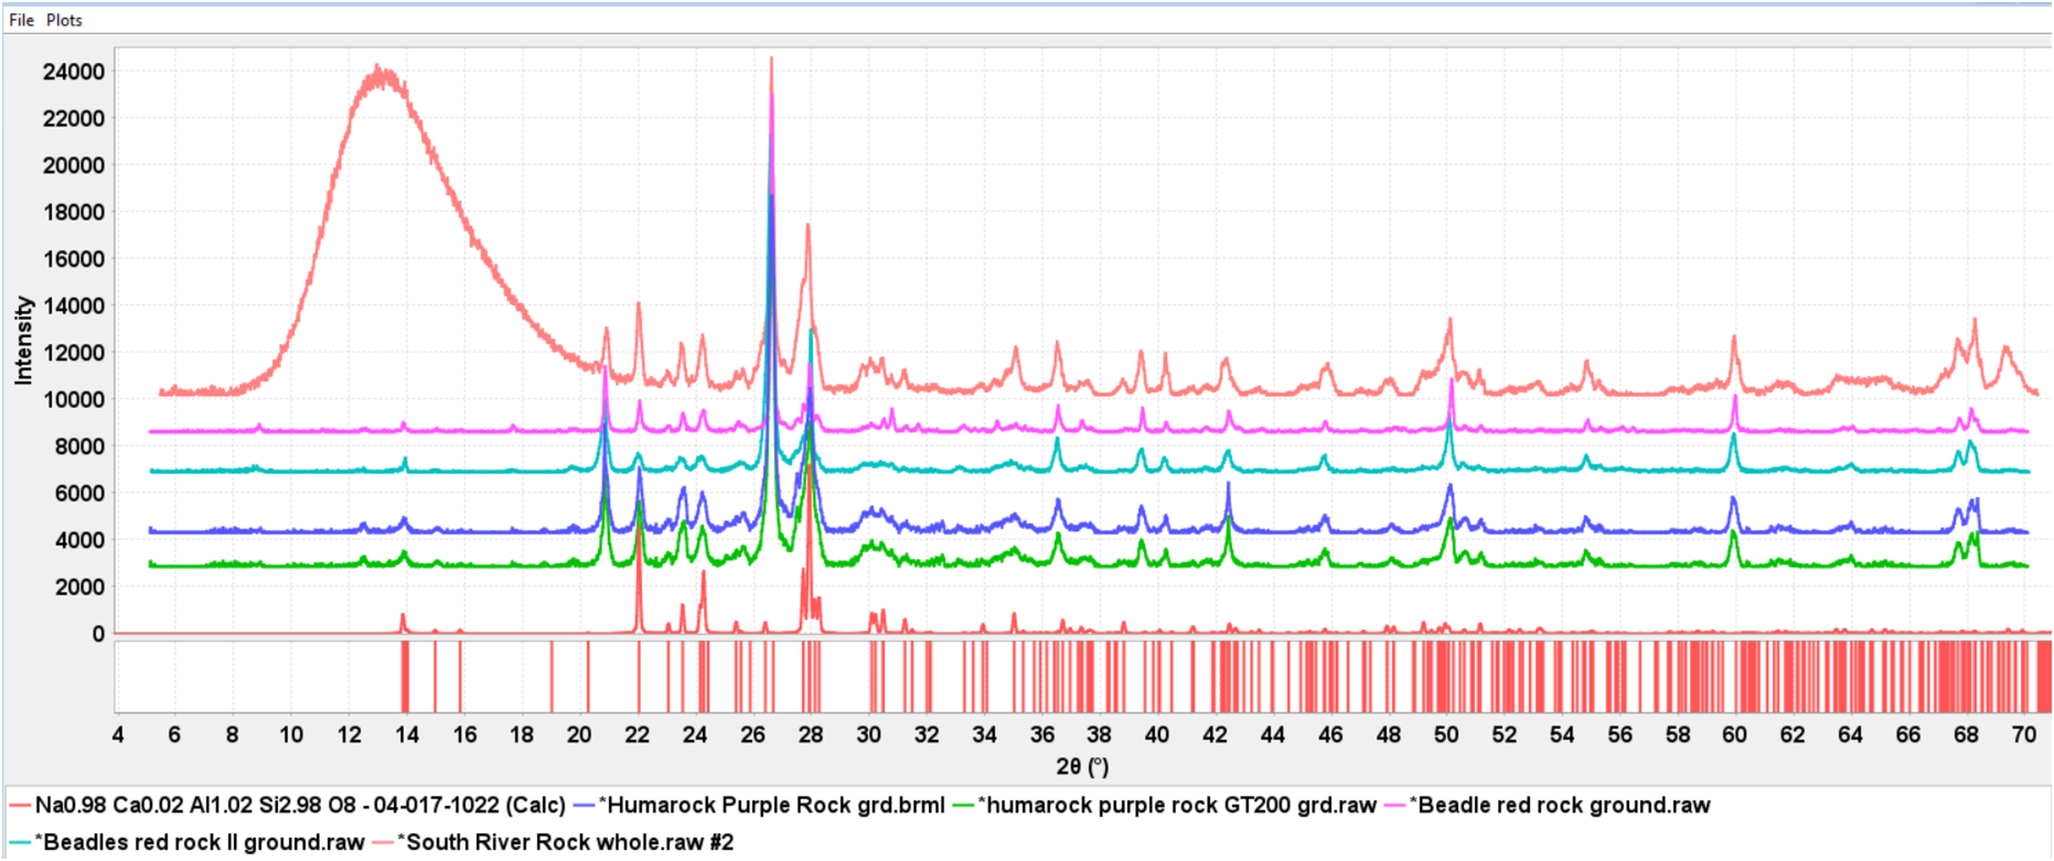
Sands and rocks that contained red albite. The top pattern was taken on a whole rock sample, the other specimens were ground rocks. The bottom scan is a reference pattern of albite.
XRF-EDS spectra of black sand. The XRD analysis identified ilmenite TiFeO3 and a Ti-enriched hematite. The high concentration of Ti was a signature of the black sands versus other sand samples. The XRD QPA estimated 13.49% iron and 8.51% titanium in this sample based on formula weight percentages.

In a separate investigation, both recent and fossilized shells from the same beaches were analyzed (Fawcett et. al., Reference Fawcett, Blanton, Kabekkodu, Blanton, Lyza and Broton2022). Oysters and quahogs have both aragonite and calcite in their shells. In the Eastern and Duxbury oysters, calcite is the dominant phase, and in Quahog’s aragonite is the dominant phase. Fossilized shells can contain gypsum, quartz, and various calcium silicates. Several beaches are spawning areas for blue mussels and surf clams (Marshfield Beach Management Plan, 2017).
Epidote a mineral garnet has been identified in red and red-brown sands along with Fe containing feldspars and mica. The more common green form of epidote has been identified several times including both the northernmost and southernmost beaches studied. This is the mineral that has also been identified in Cohasset/Westwood granite and Cohasset beach sands. Ilmenite and epidote are mentioned in the online mineralogical database Mindat, as being found in various Massachusetts shoreline quarries.
D. Indiana Dunes National Park
During the course of this study, the author had the opportunity to examine sands from West Beach, Indiana Dunes National Park (IDNP). The National Park was of interest since it has a similar history to the dunes and sands described above, influenced by the same glacier, in an area of glacial till influenced by glacial retreat (Pettijohn, Reference Pettijohn1931).
The sands from Indiana Dunes National Park had the exact same minerals as shown in Table II. The concentrations of albite, microcline, and clinochlore were lower and the average quartz content was higher at 81%. Overall quartz and the two feldspars averaged 93% of the samples similar to the light fraction of sands analyzed by Pettijohn. Seven data sets were recorded with multiple specimens for each sample. All data sets from IDNP clustered with similar composition beach and dune samples from Massachusetts. This was the largest cluster group shown in green on the right center side of Figure 4.
A black sand extract was taken from a 100 to 200 mesh fraction and shown to have arfvedsonite (hornblende) and ilmenite. Pettijohn in his petrological analysis identified hornblende as the most common heavy mineral in Indiana sand samples. It was noticed throughout this study that the 100 to 200 mesh as-received fraction, before grinding, often concentrated dark grains. The close similarity of the Indiana Dunes National Park samples to dune samples from Massachusetts is attributed to a similarity in geological history. The same glacier that covered New England and New York also covered the National Park area and formed Lake Michigan. Instead of common Northeasters, this region gets regular “Northwesters” as a prevalent wind pattern that starts in Canada sweeps across the middle of the United States and across Lake Michigan. These sands would also be classified as “continental.” In appearance, there were many more clear quartz grains, similar to the bottom left photograph in Figure 14. In the petrological study by Pettijohn, many beach sands were analyzed in southern Lake Michigan on both the east and west shorlines, and a wider range of minerals were identified. A more complete analysis of the sands and dunes in the park, which will cover a more extensive area, is currently being conducted under the National Park Service study permit INDU-00555.
IV. CONCLUSIONS
Sands on Marshfield beaches are amazingly uniform suggesting that the ocean and surrounding rocks and rock formations act like a giant grinding mill. The sand composition is a “continental sand” reflecting the area’s granite bedrock with quartz, mica, feldspars, and amphibole, and is similar to other coastal sands in the region. This analysis confirmed a prior analysis that the sand has a slightly higher albite content and a small amount of characteristic green epidote versus other area sands.
In contrast, rocks, cobble berms, and pebbles show a broad diversity of minerals consistent with past glacial till coverage and surrounding river sediments. Many common rock types were identified and a few uncommon rocks. This diversity entails ~30 minerals. Many of the minerals are colored and sometimes visible as a variety of colored sands that reflect various mineral compositions. Ilmenite was the most frequently encountered mineral in black sands. Among the uncommon minerals, bog ore, and a red-orange fluorite were characterized.
Sands on the Green Harbor Beach currently reflect dredging operations in nearby Green Harbor. The sand is finer and has large areas of colored sand may reflect the dredged sediments being deposited on the adjacent beach.
DEPOSITED DATA
The raw data files were deposited with ICDD. The files can be requested by contacting the managing editor at pdj@icdd.com.
SUPPLEMENTARY MATERIAL
To view supplementary material for this article, please visit http://doi.org/10.1017/S0885715625000041.
ACKNOWLEDGEMENTS
The laboratory of the International Centre for Diffraction Data (ICDD) was essential to this work. The author would like to specifically acknowledge the help and assistance of Executive Director Tom Blanton and Editorial Scientist Megan Rost for their many helpful suggestions both on the scope of the work and on best practices for the instrumentation. The ICDD laboratory supports the ICDD’s educational works and non-profit charter. The author would also like to thank Amp-Tek, Proto, and Bruker-AXS for supporting this laboratory via technical support. Thanks to Jessica Lyza, Marquis Stephenson, Marissa Sousa, and Lora Page from EC Levy who helped analyze the sands from Indiana Dunes National Park. The author also thanks Justin Blanton, Steffan Weber, and Rongsheng Zhou for their amazing software developments (PDF-5+, JADE Pro) and guidance on new applications. Finally, I would like to thank Liz Anoja and Michael Steele from Marshfield Town Conservation Office for their helpful discussions and suggestions.


 Open access

