


1. Introduction
Over the last few decades, one of the most imperative tasks of actuaries working within the life and non-life sectors is to construct models with high predictive ability which can efficiently capture the stylized characteristics of claim count and severity data. Even today, traditional regression models, particularly generalized linear models (GLMs) as introduced by Nelder & Wedderburn (Reference Nelder and Wedderburn1972), are one of the widely adopted approaches for handling such data sets. Instances of application of GLMs in an insurance context could be found in Ohlsson & Johansson (Reference Ohlsson and Johansson2010), De Jong et al. (Reference De Jong and Heller2008), Haberman & Renshaw (Reference Haberman and Renshaw1996), and Frees (Reference Frees2009). Furthermore, morbidity studies encompassing regression models under a Bayesian framework have also been considered by Arık et al. (Reference Arık, Dodd, Cairns and Streftaris2021), and Ozkok et al. (Reference Ozkok, Streftaris, Waters and Wilkie2014).
As far as modeling of hospital admission frequency data is concerned, which is the main focus of this study, it should be noted that one of the main issues associated with this and similar type of rare event count data has been the zero-inflated nature of the data leading to overdispersion. Although regression models with an underlying negative binomial distributional assumption could address the issue of overdispersion, they fall short of effectively addressing the issue of excess zeros (Gurmu & Trivedi, Reference Gurmu and Trivedi1996). The problem of excess zeros magnifies once we start looking at cause-specific events. For instance, in our context, we are interested in admissions to hospitals or healthcare facilities, specifically due to respiratory diseases. Even though many individuals could suffer respiratory diseases, admission to hospital implies a severe condition and could be less frequent. This highlights the difficulty and necessity for accurately modeling admission rates and analyzing the impact of different risk characteristics on the medical condition. In addition to the above-mentioned insurance context, numerous instances from other fields of research also deal with zero-inflated data. Irrespective of the area of research, for any studies based on rare events data, examples of which could be found in Ridout et al. (Reference Ridout, Demétrio and Hinde1998), the issue of excess zeros presents a challenge.
Different methodologies have been proposed to handle rare event data, out of which zero-inflated Poisson regression modes, proposed by Lambert (Reference Lambert1992), and the hurdle model by Mullahy (Reference Mullahy1986), are two of the most popular approaches. The underlying principle behind both approaches is similar. In essence, both approaches set forth a mixture distribution with two components: the zero component and the count component. The zero component is used to model the zeros (in case of hurdle models) or the excess zeros (in case of zero-inflated models), and the count component is for the frequency data of the event of interest. Several variants and extensions have been developed ever since, and the application of the same under different contexts has also been considered. Lambert (Reference Lambert1992) considered the application to defects in manufacturing, whereas Gurmu (Reference Gurmu1997) used a semi-parametric version of the hurdle model for Medicaid utilization. Famoye & Singh (Reference Famoye and Singh2006) proposed a generalized variant of the zero-inflated model in the context of domestic violence data. In an actuarial setting, Yip & Yau (Reference Yip and Yau2005) used zero-inflated models for modeling insurance claim frequency data. Ridout et al. (Reference Ridout, Demétrio and Hinde1998) provide details regarding other similar instances. For additional information regarding the zero-adjusted models for handling data sets with excess zeros, we refer to the textbook of Cameron & Trivedi (Reference Cameron and Trivedi2013).
The advancing field of deep learning, a subset of artificial intelligence, embodies a modern approach to designing and training neural networks (NNs) – computerized systems inspired by the human brain that learn from complex data to make predictions or decisions. This methodology has garnered remarkable successes in fields like computer vision, natural language processing, and speech recognition. Furthermore, it is attracting growing attention within the actuarial community, as evidenced by works both in the academic research field (Wüthrich & Merz, Reference Wüthrich and Merz2019; Denuit et al., Reference Denuit, Hainaut and Trufin2019; Wüthrich, Reference Wüthrich2020; Denuit et al., Reference Denuit, Charpentier and Trufin2021 and Wüthrich & Merz, Reference Wüthrich and Merz2023) and in the insurance business sector. One drawback of neural network (NN) models is the lack of explainability and interpretability of the results due to the inherent black box nature arising from their complex structure. Several techniques, such as SHapley Additive exPlanations by Lundberg & Lee (Reference Lundberg and Lee2017), LocalGLMet from Richman & Wüthrich Reference Richman and Wüthrich2023), locally interpretable model-agnostic explanation proposed by Ribeiro et al. (Reference Ribeiro, Singh and Guestrin2016) etc., have been developed to address the interpretability issue. Out of these different approaches, here we adopt and extend the LocalGLMnet approach, owing to its ease of implementation and the likeness that it provides to interpretations derived from traditional regression models. Further criticism for NN models relates to the potential failure to maintain the balance property, thereby leading to bias at the population or portfolio level. (see Wüthrich, Reference Wüthrich2020, Reference Wüthrich2022). Several bias regularization approaches, such as those discussed in the aforementioned articles, have been proposed to address this problem.Footnote 1 Also, autocalibration, which was considered by Denuit et al. (Reference Denuit, Charpentier and Trufin2021), is a technique that can be employed to mitigate population-level bias, and for this reason, it has gained wide popularity recently.
The main focus of this study is to enhance the predictive performance of zero-inflated models utilized in the context of modeling admission rates associated with respiratory diseases in the US-insured population, characterized by a significant prevalence of zero counts. This will be achieved by constructing interpretable zero-inflated Poisson NN models capable of effectively analyzing count data, where there is a high prevalence of zero occurrences, as is the case with the data used herein. This is important since accurate forecasting of hospital admission rates would assist hospitals in anticipating fluctuations in demand and thereby enhancing the overall quality of patient care. Furthermore, in addition to improving predictive performance, retaining interpretability is crucial for investigating the impact of covariates or input variables (see Table 2) on the admission counts.
The primary motivation for considering admissions-related respiratory diseases is that they remain one of the leading cause of mortality and morbidity. According to World Health Organization (WHO), worldwide, hundreds of millions of people suffer from preventable chronic respiratory diseases (CRDs) such as asthma, chronic obstructive pulmonary disease (COPD), and occupational lung diseases, and around four million deaths occur each year due to CRDs (Bousquet et al., Reference Bousquet, Khaltaev and Cruz2007). Recent statistics indicate that each year 3 million people die from COPD, which comes to nearly 6% of all the deaths worldwide, and globally 262 million people suffer from asthma (WHO, 2022). The significance of having an efficient predictive model for analyzing the admissions related to respiratory diseases arises from the fact that most CRDs are preventable through early detection and intervention. This demands precise identification and understanding of significant risk attributes of respiratory diseases. The alternative models which we consider in this study facilitate more accurate modeling of admission rates compared to the ZIP model, while also analyzing the impact of different risk attributes on these diseases. In particular, the main contributions of this paper are outlined below.
• Firstly, following the CANN approach of Wüthrich & Merz (Reference Wüthrich and Merz2019), we construct a Zero-inflated Poisson Combined Actuarial Neural network (ZIPCANN) model for modeling hospital admission frequency data. By embedding a zero-inflated Poisson regression into the CANN framework, we can explore the gains in predictive power compared to conventional regression models, and at the same time, we can accommodate the high presence of zeros in the count data. Additionally, it is worth noting that the CANN model and its extensions are part of the Residual Neural Network (ResNet) family, which employs skip connections, as discussed in He et al. (Reference He, Zhang, Ren and Sun2016). These skip connections enable the model to address the vanishing gradient effects commonly associated with deep NNs.
• Secondly, we interpret the results of the ZIPNN model using the LocalGLMnet approach. It should be noted that interpreting results from a ZIP distributional assumption is more complex compared to the Poisson distributional assumption counterpart. This complexity arises due to the model’s mixture nature, wherein input features are incorporated through the rate and probability parameters. Furthermore, the interpretations obtained from the NN-based model are compared to those derived with the coefficient estimates of the ZIP regression model. This comparison showcases the impact of potential non-linear interactions captured by the NN on the final results.
With the above contributions, we have taken into account all of the alternative approaches that have been developed in the recent actuarial literature concerning network-based models. For instance, Noll et al. (Reference Noll, Salzmann and Wuthrich2020) and Gao et al. (Reference Gao, Meng and Wüthrich2019) consider NN models in the context of motor insurance. Hejazi & Jackson (Reference Hejazi and Jackson2016) propose a network-based approach for the valuation of large portfolios of variable annuities, while Kuo (Reference Kuo2019) considers a deep-learning approach to loss reserving. Additionally, Hainaut (Reference Hainaut2018) adapts NNs for mortality forecasting. Richman (Reference Richman2021) provides a detailed review of recent advances of Artificial Intelligence in actuarial science. For more details regarding the application of NNs in an actuarial context, please refer to textbooks Denuit et al. (Reference Denuit, Hainaut and Trufin2019) and Wüthrich & Merz (Reference Wüthrich and Merz2023). Moreover, it is worth noting that the above approaches and their combinations are used for the first time in the literature regarding the zero-inflated Poisson model for the case of hospital admission data.
The rest of this article is organized as follows: Section 2 provides a general description of the data, along with descriptive statistics and data considerations that were carried out prior to modeling. The different models considered as part of this work, i.e., the ZIP, ZIPNN, and ZIPCANN models, are discussed in Section 3. Details of the different hyper-parameter assumptions associated with NN model fitting are given in Section 4. Section 5 describes the LocalGLMnet approach and its extension for the ZIPNN model. A comparison of different models in terms of predictive performance and interpretations derived is given in Section 6. Finally, Section 7 contains the concluding remarks.
2. Data
The Merative (previously called IBM Watson Health) provides the admission data for the US population. The data set was constructed by combining the enrollment information and the admission details from different tables in the Commercial Claims and Encounters Database of Merative MarketScan Research Databases. The data contain individual-level demographic and employment-related information sourced from various employers and health plans around the US. The International Statistical Classification of Diseases and Related Health Problems 10th Revision – Clinical Modification (ICD-10-CM) codes were used for defining the underlying cause of admission facilitating the categorization of the admissions based on the disease (CDC, 2016). Also, multiple admission records of an individual due to a particular disease within a period of two days were treated as a single admission. As our focus is predominantly on the working population, we consider individuals in the age range [30, 65] for the year 2016. Different data consideration steps were undertaken to create the final data set. For instance, a variable (INDSTRY) which contained information regarding the industry in which the individual is employed, was excluded due to a high proportion of missingness. For the rest of the data variables, only the complete cases are used as the proportion of missingness was less than 2%. Additionally, variables, such as HLTHPLAN and DATATYP, are excluded due to the high level of relationship with other variables. The HLTHPLAN variable indicates whether the employer or a health plan provides the data, and the DATATYP variable indicates whether the individual’s plan is on a reimbursement or capitation basis. The HLTHPLAN variable is strongly associated with employment-related variables such as EECLASS and EESTATU, and the DATATYP variable is correlated with the PLANTYP variable, which details the type of health plan the individual is part of. A description of the various variables within the final data set is given in Table 2. Furthermore, the ceiling for the number of admissions for an individual was set as five to address the unusually high numbers of individual admissions, possibly due to the common healthcare data practices. The same data set was used in earlier work (Jose et al., Reference Jose, Macdonald, Tzougas and Streftaris2022), which contains a more detailed description of the above-mentioned data considerations and the preliminary exploratory analysis that was carried out. Here, the REGION variable is chosen over a more granular geographical variable EGEOLOC which was used in Jose et al. (Reference Jose, Macdonald, Tzougas and Streftaris2022). The final data set contains 2,050,100 records with 4513 admissions related to respiratory diseases (see Table 1). For a further in-depth understanding of the data set and its analysis, we refer the reader to earlier work by Jose et al. (Reference Jose, Macdonald, Tzougas and Streftaris2022).
Frequency of number of admissions related to respiratory diseases

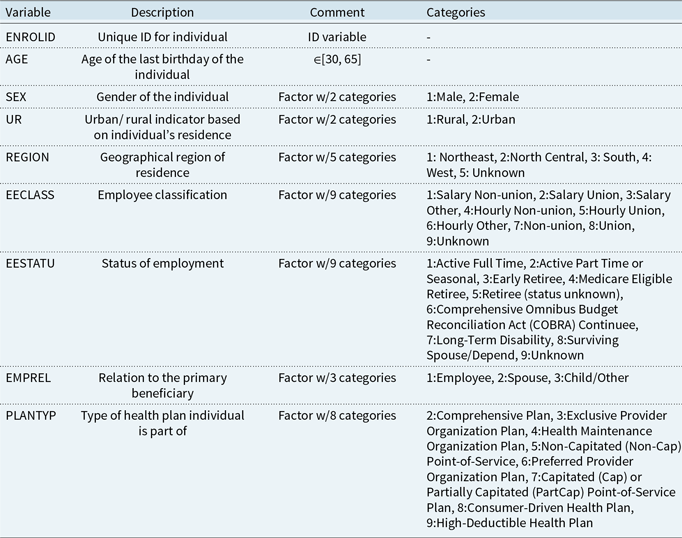
Description of variables in the admission data set
2.1 Data pre-processing
Prior to carrying out any modeling, two data pre-processing steps were undertaken, the details of which are outlined below.
(1) One-hot encoding: for all categorical variables with more than two levels, one-hot encoding was applied. One-hot encoding represents a categorical variable with $l$
categories
$c_1, c_2, \ldots, c_l$
using a
$l$
dimensional feature vector which is of the form(1)
\begin{equation} x_j \mapsto \Big (\unicode{x1D7D9}_{\{x_j = c_1\}},\ldots, \unicode{x1D7D9}_{\{x_j = c_{l}\}} \Big )^T \in \mathbb{R}^{l}. \end{equation}
$l$
categories
$c_1, c_2, \ldots, c_l$
using a
$l$
dimensional feature vector which is of the form(1)
\begin{equation} x_j \mapsto \Big (\unicode{x1D7D9}_{\{x_j = c_1\}},\ldots, \unicode{x1D7D9}_{\{x_j = c_{l}\}} \Big )^T \in \mathbb{R}^{l}. \end{equation}
-
(2) Min-max scaler: a min-max scaler which transforms the variable to a
$[-1,1]$
scale was implemented for the numerical and binary variables. The transformation was applied using the formula(2)where
\begin{equation} x_j \mapsto x_j^{*} = \frac{2(x_j - m_j)}{M_j - m_j} -1\in [-1, 1] \end{equation}
$m_j$
and
$M_j$
represent the minimum and maximum values of variable
$x_j$
.


A more detailed description of the application of both one-hot encoding and min-max scaler on the admission data set under consideration is given in Jose et al. (Reference Jose, Macdonald, Tzougas and Streftaris2022). Following the data pre-processing steps, a 90:10 random split of the entire data set was created to be used as the learning $\mathcal{D}$
and testing
$\mathcal{D}$
and testing $\mathcal{T}$
data sets. All the models were fitted using the learning data set, and the performance of the models on the testing data set was used to compare their performances.
$\mathcal{T}$
data sets. All the models were fitted using the learning data set, and the performance of the models on the testing data set was used to compare their performances.
3. Models
The main models discussed as part of this work are the ZIPNN and ZIPCANN models, along with the extension of the ZIPNN model developed by incorporating the LocalGLMnet approach, which facilitates the interpretation of the results. A zero-inflated Poisson (ZIP) regression model is also considered for comparing the predictive performance between traditional regression modeling and network-based approaches. Furthermore, although not explicitly described here, instances of traditional Poisson regression, NN, and CANN models as detailed in Jose et al. (Reference Jose, Macdonald, Tzougas and Streftaris2022) are also considered for comparison. Before extending the LocalGLMnet approach to ZIPNN model, the same was implemented for the NN model as well.
3.1 Zero-inflated Poisson regression
As mentioned earlier, zero-inflated Poisson models are based on a mixture distribution comprising two components (Lambert, Reference Lambert1992; Cameron & Trivedi, Reference Cameron and Trivedi2013). In practice, a count distribution such as the Poisson or negative binomial distribution is used to represent the count component, and a Bernoulli distribution is assumed for the zero component. Hence a zero-inflated Poisson (ZIP) regression model is of the form
 \begin{equation} Y_i\sim \begin{cases} 0& \text{with probability}\; \pi _i\\ Poisson(\lambda _i e_i)&\text{with probability}\; (1-\pi _i)\qquad \ldots \;\text{for}\;\; i = 1, \ldots, n\\ \end{cases} \end{equation}
with $\mu _i=\lambda _ie_i$
being the mean of the Poisson part of the ith record with exposure
$\mu _i=\lambda _ie_i$
being the mean of the Poisson part of the ith record with exposure $e_i$
and rate parameter
$e_i$
and rate parameter $\lambda _i$
, while
$\lambda _i$
, while $\pi _i$
represents the probability of only having zero admissions. Zeros arise from both the zero component and the count component, with the two components having probability
$\pi _i$
represents the probability of only having zero admissions. Zeros arise from both the zero component and the count component, with the two components having probability $\pi _i$
and
$\pi _i$
and $(1-\pi _i)$
, respectively. Hence, the probability mass function of the ZIP mixture distribution is
$(1-\pi _i)$
, respectively. Hence, the probability mass function of the ZIP mixture distribution is
 \begin{equation} Pr(Y_i=y_i)= \begin{cases} \pi _i + (1-\pi _i) e^{-\mu _i}, & y_i = 0\\ (1-\pi _i) \frac{e^{-\mu _i}\mu _i^{y_i} }{y_i!} & y_i \gt 0 \\ \end{cases} \end{equation}
and the corresponding mean and variance are given by
 \begin{equation} E(Y_i) = (1-\pi _i)\mu _i,\qquad V(Y_i) = (1-\pi _i)\mu _i(1+\pi _i\mu _i). \end{equation}
The ZIP model allows both $\mu _i$
and
$\mu _i$
and $\pi _i$
to be modeled using a set of covariates. This would be of the form :
$\pi _i$
to be modeled using a set of covariates. This would be of the form :
 \begin{equation} \log (\mu _i) = o_i + \beta _{0} + \boldsymbol{\beta }_{reg}^{\top }\boldsymbol{x_i} = o_i + \beta _0 + \langle \boldsymbol{\beta }_{reg}, \boldsymbol{x_i}\rangle \end{equation}
and
 \begin{equation} logit(\pi _i) = \gamma _{0} + \boldsymbol{\gamma ^\top w_i} \end{equation}
where $o_i=\log (e_i)$
is the offset term,
$o_i=\log (e_i)$
is the offset term, $\beta _{0},\gamma _{0}$
the intercept terms and
$\beta _{0},\gamma _{0}$
the intercept terms and $\boldsymbol{\{\beta }_{reg}^\top,\boldsymbol{\gamma ^\top \}} = (\beta _{1},\ldots, \beta _{q}, \gamma _{1},\ldots, \gamma _{s})$
being the unknown vector of coefficients to be estimated corresponding to the sets of covariates
$\boldsymbol{\{\beta }_{reg}^\top,\boldsymbol{\gamma ^\top \}} = (\beta _{1},\ldots, \beta _{q}, \gamma _{1},\ldots, \gamma _{s})$
being the unknown vector of coefficients to be estimated corresponding to the sets of covariates $\boldsymbol{x}_i=(x_{i,1},\ldots,x_{i,q})^ \top$
and
$\boldsymbol{x}_i=(x_{i,1},\ldots,x_{i,q})^ \top$
and $\boldsymbol{w}_i=(\boldsymbol{w}_{i,1},\ldots,\boldsymbol{w}_{i,s})^ \top$
considered in the two regression functions with dimensions
$\boldsymbol{w}_i=(\boldsymbol{w}_{i,1},\ldots,\boldsymbol{w}_{i,s})^ \top$
considered in the two regression functions with dimensions $q\times 1$
and
$q\times 1$
and $s\times 1$
, respectively. Regarding the treatment of exposure within the ZIP model, it is possible that the exposure or period at risk could potentially influence the probability of admission, as well as the rates of admission. Consequently, the exposure could be factored into both components, as detailed in Feng (Reference Feng2022). Here, we follow the general practice of treating it as an offset term in the regression function for
$s\times 1$
, respectively. Regarding the treatment of exposure within the ZIP model, it is possible that the exposure or period at risk could potentially influence the probability of admission, as well as the rates of admission. Consequently, the exposure could be factored into both components, as detailed in Feng (Reference Feng2022). Here, we follow the general practice of treating it as an offset term in the regression function for $\mu$
, as discussed in Lee et al. (Reference Lee, Wang and Yau2001).
$\mu$
, as discussed in Lee et al. (Reference Lee, Wang and Yau2001).
The model selection procedure was carried out for both count and zero components of the ZIP regression model. All variables entered the model for the count component, and thus, a full model with all the covariates was utilized for the Poisson regression function. Similarly, for the regression function associated with the zero component, a forward step-wise variable selection process based on the Bayesian information criterion (BIC) was carried out(Vrieze, Reference Vrieze2012). As we are using logistic regression to model the probability parameter, we refer to it as the logistic component from here on. The summary of the variable selection process of the logistic component of the model is given below in Table 3. Under the forward step-wise variable selection process, we start from a model without any terms in the logistic component and consider adding one variable at a time. The outcome of any particular step is the model that yields the lowest BIC value, and the whole process is repeated until there is no further reduction in the BIC value. The model thus identified from the variable selection process had the vector of coefficients $\{\beta _{0}, \boldsymbol{\beta }_{reg},\gamma _{0}, \boldsymbol{\gamma \}} = (\beta _{0}, \beta _{1},\ldots, \beta _{q}, \gamma _{0}, \gamma _{1})$
corresponding to the complete set of covariates as presented in Table 4. The ZIP regression model was fitted using the zeroinfl() function in the pscl package which employs the optim() function to estimate the model parameters in both components simultaneously, by maximum likelihood, using optimization algorithms such as Nelder-Mead or a quasi-Newton method (Zeileis et al., Reference Zeileis, Kleiber and Jackman2008).
$\{\beta _{0}, \boldsymbol{\beta }_{reg},\gamma _{0}, \boldsymbol{\gamma \}} = (\beta _{0}, \beta _{1},\ldots, \beta _{q}, \gamma _{0}, \gamma _{1})$
corresponding to the complete set of covariates as presented in Table 4. The ZIP regression model was fitted using the zeroinfl() function in the pscl package which employs the optim() function to estimate the model parameters in both components simultaneously, by maximum likelihood, using optimization algorithms such as Nelder-Mead or a quasi-Newton method (Zeileis et al., Reference Zeileis, Kleiber and Jackman2008).
Summary of the variable selection process of the logistic component of the ZIP regression model

List of covariates and the corresponding coefficient parameters in both the components of the ZIP regression model

3.2 Zero-inflated Poisson neural network (ZIPNN) model
A generic feed forward NN comprises an input layer, followed by multiple hidden layers and then the output layer. The structure of a feed forward NN is first discussed using a NN model with an underlying Poisson distribution assumption (model 3 in Table 5). A feature space $\mathcal{X}$
is taken as the input layer with dimension
$\mathcal{X}$
is taken as the input layer with dimension $q_0$
. Assuming a network architecture of
$q_0$
. Assuming a network architecture of $d\in \mathbb{N}$
hidden layers with
$d\in \mathbb{N}$
hidden layers with $q_m\in \mathbb{N}, 1\leq m\leq d$
neurons in each of the layers then a neuron
$q_m\in \mathbb{N}, 1\leq m\leq d$
neurons in each of the layers then a neuron $ z_{j}^{(m)},1 \leq j \leq q_{m},$
in the
$ z_{j}^{(m)},1 \leq j \leq q_{m},$
in the $m^{th}$
hidden layer
$m^{th}$
hidden layer $\textbf{z}^{(m)}$
is given by
$\textbf{z}^{(m)}$
is given by
 \begin{equation} z_{j}^{(m)}(\textbf{z})=\psi \left ( \langle \boldsymbol{\beta }_{j}^{(m)},\textbf{z} \rangle,\right ) \end{equation}
with $\textbf{z}^{(m)}$
represented as
$\textbf{z}^{(m)}$
represented as
 \begin{equation} \textbf{z}^{(m)}:\, \mathbb{R}^{q_{m-1}} \rightarrow \mathbb{R}^{q_{m}}, \quad \textbf{z}\mapsto \textbf{z}^{(m)}(\textbf{z})=(1,z_{1}^{(m)}(\textbf{z}),\dots,z_{q_{m}}^{(m)}(\textbf{z}))^\top, \end{equation}
inclusive of the intercept component, where $\boldsymbol{\beta }_{j}^{(m)}= (\beta _{l,j}^{(m)})^\top _{0\leq l \leq q_{m-1}} \in \mathbb{R}^{q_{m-1}+1}$
are the network parameters and
$\boldsymbol{\beta }_{j}^{(m)}= (\beta _{l,j}^{(m)})^\top _{0\leq l \leq q_{m-1}} \in \mathbb{R}^{q_{m-1}+1}$
are the network parameters and $\psi :\, \mathbb{R} \rightarrow \mathbb{R},$
the activation function. The network parameters corresponding to the hidden layer
$\psi :\, \mathbb{R} \rightarrow \mathbb{R},$
the activation function. The network parameters corresponding to the hidden layer $\textbf{z}^{(m)}$
are the
$\textbf{z}^{(m)}$
are the $\left (\boldsymbol{\beta }_{1}^{(m)},\ldots,\boldsymbol{\beta }_{q_{m}}^{(m)}\right ) \in \mathbb{R}^{q_{m}}$
. The comprehensive set of network parameter is given by
$\left (\boldsymbol{\beta }_{1}^{(m)},\ldots,\boldsymbol{\beta }_{q_{m}}^{(m)}\right ) \in \mathbb{R}^{q_{m}}$
. The comprehensive set of network parameter is given by $\boldsymbol{\beta }=\left (\boldsymbol{\beta }_{1}^{(1)},\ldots,\boldsymbol{\beta }_{q_{d}}^{(d)}, \boldsymbol{\beta }^{(d+1)}\right ) \in \mathbb{R}^{r}$
, where the dimension is
$\boldsymbol{\beta }=\left (\boldsymbol{\beta }_{1}^{(1)},\ldots,\boldsymbol{\beta }_{q_{d}}^{(d)}, \boldsymbol{\beta }^{(d+1)}\right ) \in \mathbb{R}^{r}$
, where the dimension is $r=\sum _{m=1}^{d} q_{m}\left (q_{m-1}+1\right ) + (q_{d}+1)$
. The predictor of the NN obtained from the output layer is then of the form
$r=\sum _{m=1}^{d} q_{m}\left (q_{m-1}+1\right ) + (q_{d}+1)$
. The predictor of the NN obtained from the output layer is then of the form
 \begin{equation} (o_i, \boldsymbol{x}_i) \mapsto \log(\mu _i^{NN})= o_i +\langle \boldsymbol{\beta }^{(d+1)}, (\textbf{z}^{(d)} \circ \dots \circ \textbf{z}^{(1)}) (\boldsymbol{x}_{i})\rangle, \end{equation}
for $i=1,\ldots,n$
, where
$i=1,\ldots,n$
, where $\boldsymbol{\beta }^{(d+1)} \in \mathbb{R}^{q_{d}+1}$
are the weights associated with the output layer which connects the last hidden layer
$\boldsymbol{\beta }^{(d+1)} \in \mathbb{R}^{q_{d}+1}$
are the weights associated with the output layer which connects the last hidden layer $\textbf{z}^{d}$
to the output layer
$\textbf{z}^{d}$
to the output layer $\mathbb{R}_{+}$
.
$\mathbb{R}_{+}$
.
Predictive performance of Poisson and ZIP regression models and network-based models with and without an additional layer for interpretation based on NLL. The empirical mean of the observed data is 0.0027

For a ZIPNN model, the feature space $\mathcal{X}$
with dimension
$\mathcal{X}$
with dimension $q$
is taken as the input layer, i.e.,
$q$
is taken as the input layer, i.e., $q_0=q$
. The construction of ZIPNN models involves incorporating zero-inflation considerations through the establishment of a distribution layer within the NN. This distribution layer, referred to as a lambda layerFootnote 2 in machine learning terminology, is a component in a NN that facilitates the integration of custom operations by defining a function applied to input data. In particular, this functionality allows for the inclusion of specific computations not covered by standard layers. In the specific context of zero-inflated NNs, the distribution lambda layer is employed to integrate a zero-inflated distribution assumption into the NN, enabling the model to capture complex relationships in the data. Also, we take
$q_0=q$
. The construction of ZIPNN models involves incorporating zero-inflation considerations through the establishment of a distribution layer within the NN. This distribution layer, referred to as a lambda layerFootnote 2 in machine learning terminology, is a component in a NN that facilitates the integration of custom operations by defining a function applied to input data. In particular, this functionality allows for the inclusion of specific computations not covered by standard layers. In the specific context of zero-inflated NNs, the distribution lambda layer is employed to integrate a zero-inflated distribution assumption into the NN, enabling the model to capture complex relationships in the data. Also, we take $q_d=2$
with
$q_d=2$
with $\psi :\, f(x)=x$
. In other words, a dense layer with two neurons without activation is defined before the distribution layer.
$\psi :\, f(x)=x$
. In other words, a dense layer with two neurons without activation is defined before the distribution layer.
The output of these two neurons is then used to calculate the probability $(\pi )$
and rate
$(\pi )$
and rate $(\lambda )$
parameters of the zero-inflated Poisson distribution constructed using the distribution layer that follows. The distribution layer thus created has an underlying zero-inflated Poisson mixture distribution. The model output is then derived as the mean of the distribution given by
$(\lambda )$
parameters of the zero-inflated Poisson distribution constructed using the distribution layer that follows. The distribution layer thus created has an underlying zero-inflated Poisson mixture distribution. The model output is then derived as the mean of the distribution given by
 \begin{equation} E(Y_i) = (1-\pi _i^{zipnn})\mu ^{zipnn}_i \end{equation}
where $\pi _i^{zipnn}$
and
$\pi _i^{zipnn}$
and $\mu ^{zipnn}_i$
are the rate and probability parameters of the underlying zero-inflated Poisson distribution. As in the case of a ZIP model, the exposure is taken as an offset term in the count component of the ZIPNN model. An exponential transformation is applied to the sum of the offset term and the output from the neuron associated with
$\mu ^{zipnn}_i$
are the rate and probability parameters of the underlying zero-inflated Poisson distribution. As in the case of a ZIP model, the exposure is taken as an offset term in the count component of the ZIPNN model. An exponential transformation is applied to the sum of the offset term and the output from the neuron associated with $\lambda$
. A sigmoid function is applied to the output from the neuron associated with
$\lambda$
. A sigmoid function is applied to the output from the neuron associated with $\pi$
to restrict the value of
$\pi$
to restrict the value of $\pi$
to
$\pi$
to $[0,1]$
interval. The
$[0,1]$
interval. The $\mu _i^{zipnn}$
is then given by
$\mu _i^{zipnn}$
is then given by
 \begin{equation} \log (\mu _i^{zipnn}) = z_{1}^{(d)}(\textbf{z})=\psi \left ( \langle \boldsymbol{\beta }_{1}^{(d)},\textbf{z} \rangle \right ) +o_i = \langle \boldsymbol{\beta }_{1}^{(d)},\textbf{z} \rangle + o_i \end{equation}
or equivalently
 \begin{equation} \log (\mu _i^{zipnn}) = o_i +\langle \boldsymbol{\beta }_{1}^{(d)}, (\textbf{z}^{(d-1)} \circ \dots \circ \textbf{z}^{(1)}) (\boldsymbol{x}_{i})\rangle. \end{equation}
Similarly, $\pi _i^{zipnn}$
is of the form
$\pi _i^{zipnn}$
is of the form
 \begin{equation} logit(\pi _i^{zipnn}) = z_{2}^{(d)}(\textbf{z})=\psi \left ( \langle \boldsymbol{\beta }_{2}^{(d)},\textbf{z} \rangle \right ) = \langle \boldsymbol{\beta }_{2}^{(d)},\textbf{z} \rangle. \end{equation} $\boldsymbol{\beta }_{1}^{(d)}$
and
$\boldsymbol{\beta }_{1}^{(d)}$
and $ \boldsymbol{\beta }_{2}^{(d)}$
represent the network weights associated with the two neurons in the last hidden layer corresponding to probability and rate parameters. In essence the Equations (6) and (7) are replaced by Equations (13) and (14). Alternatively, we could also define
$ \boldsymbol{\beta }_{2}^{(d)}$
represent the network weights associated with the two neurons in the last hidden layer corresponding to probability and rate parameters. In essence the Equations (6) and (7) are replaced by Equations (13) and (14). Alternatively, we could also define
 \begin{equation} logit(1-\pi _i^{zipnn}) = z_{2}^{(d)}(\textbf{z})=\psi \left ( \langle \boldsymbol{\beta }_{2}^{(d)},\textbf{z} \rangle \right ) = \langle \boldsymbol{\beta }_{2}^{(d)},\textbf{z} \rangle. \end{equation}
Since the zero-inflated distribution is defined as a mixture distribution using the distribution layer, the models could also be constructed using the $p_i= (1-\pi _i)$
parameter with ease. This means that instead of
$p_i= (1-\pi _i)$
parameter with ease. This means that instead of $\pi$
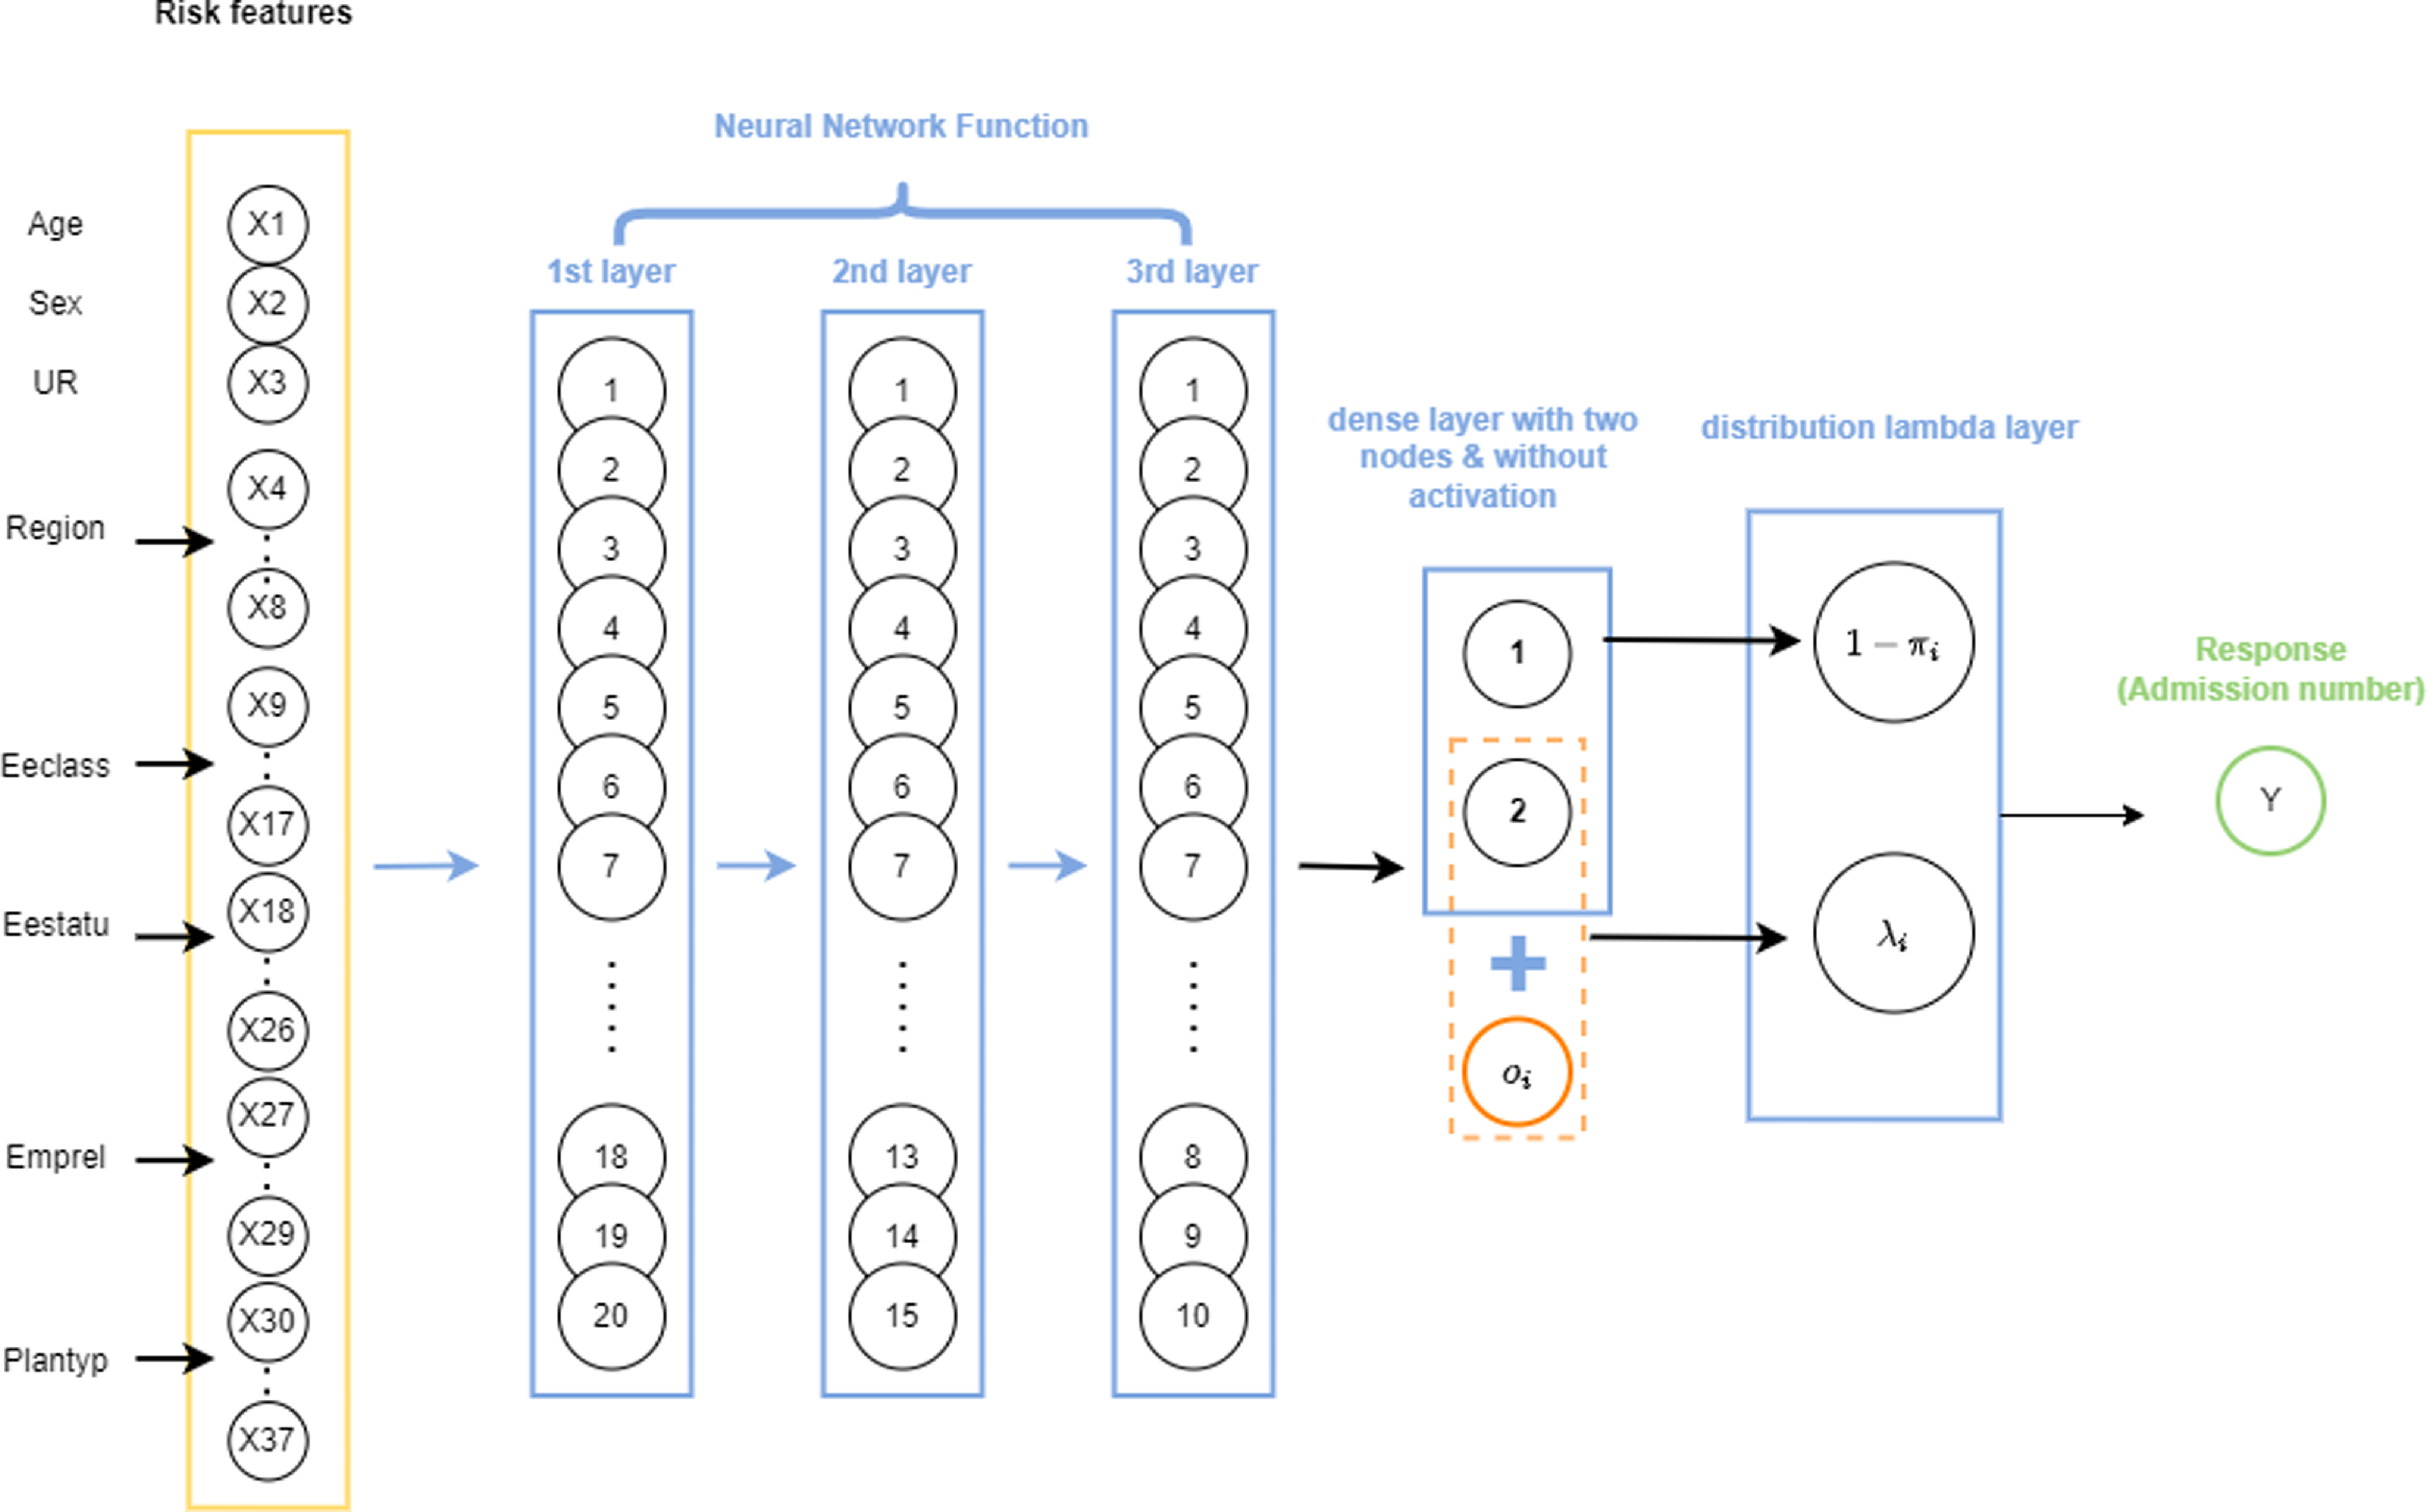
, the probability of zero component, the distribution layer considers p, which is the probability of count component or, in other words, the probability of having a non-zero admission. The only difference is how the mixture distribution is defined. For ease of interpretation, while using the attention layers, we have adopted the latter approach. A schematic representation of a ZIPNN with 20,15,10,2 neurons (model 5 in Table 5) in each dense layer is shown in Fig. 1. Code for implementing the same is given in Listing 3 and additional details regarding the approach can be found in Dürr et al. (Reference Dürr, Sick and Murina2020). The structure of the ZIPNN model in terms of the connection between layers, the shape of input and out of each layer, and the number of parameters is shown in Listing 1. The final layer of the model is the distribution layer, which follows a zero-inflated Poisson distribution. The mean of the distribution is taken as the output or the response, which, in our case, is the admission count.
$\pi$
, the probability of zero component, the distribution layer considers p, which is the probability of count component or, in other words, the probability of having a non-zero admission. The only difference is how the mixture distribution is defined. For ease of interpretation, while using the attention layers, we have adopted the latter approach. A schematic representation of a ZIPNN with 20,15,10,2 neurons (model 5 in Table 5) in each dense layer is shown in Fig. 1. Code for implementing the same is given in Listing 3 and additional details regarding the approach can be found in Dürr et al. (Reference Dürr, Sick and Murina2020). The structure of the ZIPNN model in terms of the connection between layers, the shape of input and out of each layer, and the number of parameters is shown in Listing 1. The final layer of the model is the distribution layer, which follows a zero-inflated Poisson distribution. The mean of the distribution is taken as the output or the response, which, in our case, is the admission count.
An illustration of a sample ZIPNN model with three hidden layers and 20,15,10,2 neurons in each layer.
Structure of the ZIPCANN model.

3.3 Zero-inflated Poisson combined actuarial neural network (ZIPCANN) model
The ZIPCANN model contains additional skip connections, as in the case of a CANN model. In a CANN model (model 4 in Table 5), a skip connection connects the input features directly to the output layer. In effect, the predictor of a CANN model contains an additional regression function compared to the predictor of a NN and is of the form
 \begin{equation} (o_i, \boldsymbol{x}_i) \mapsto \log(\mu ^{CANN}_i)= o_i + \langle \boldsymbol{\beta }^{reg}, \boldsymbol{x}_i \rangle + \langle \boldsymbol{\beta }^{(d+1)}, (\textbf{z}^{(d)} \circ \dots \circ \textbf{z}^{(1)}) (\boldsymbol{x}_{i})\rangle, \end{equation}
with the parameters from the regression function or skip connection represented by $\boldsymbol{\beta }^{reg}$
(Schelldorfer & Wuthrich, Reference Schelldorfer and Wuthrich2019; Jose et al., Reference Jose, Macdonald, Tzougas and Streftaris2022). As detailed in Schelldorfer & Wuthrich (Reference Schelldorfer and Wuthrich2019), various versions of CANNs exist depending on whether the weights in the regression part are updated or not whilst training the model. More specifically, one can either estimate the weights in the skip connection during training, or alternatively, keep the weights of the regression component fixed as the iterated weighted least squares estimates from the corresponding regression model. In this work, we adopt the former approach for all models containing skip connections.
$\boldsymbol{\beta }^{reg}$
(Schelldorfer & Wuthrich, Reference Schelldorfer and Wuthrich2019; Jose et al., Reference Jose, Macdonald, Tzougas and Streftaris2022). As detailed in Schelldorfer & Wuthrich (Reference Schelldorfer and Wuthrich2019), various versions of CANNs exist depending on whether the weights in the regression part are updated or not whilst training the model. More specifically, one can either estimate the weights in the skip connection during training, or alternatively, keep the weights of the regression component fixed as the iterated weighted least squares estimates from the corresponding regression model. In this work, we adopt the former approach for all models containing skip connections.
For the ZIPCANN model, two skip connections are used; one for the rate parameter and one for the probability parameter. Instead of the output layer, the skip connection is made to the two neurons in the last hidden layer. In order to be consistent with the ZIP model, only the age variable was used in the skip connection associated with $\pi$
, whereas all the features were used in the skip connection for
$\pi$
, whereas all the features were used in the skip connection for $\mu$
. Consequently, the predictor for the ZIPCANN model is of the form
$\mu$
. Consequently, the predictor for the ZIPCANN model is of the form
 \begin{equation} E(Y_i) = (1-\pi _i^{zipcann})\mu ^{zipcann}_i \end{equation}
where $\mu ^{zipcann}_i$
is given by
$\mu ^{zipcann}_i$
is given by
 \begin{equation} \log (\mu _i^{zipcann}) = \langle \boldsymbol{\beta }^{reg}, \boldsymbol{x}_i \rangle + \langle \boldsymbol{\beta }_{1}^{(d)},\textbf{z} \rangle + o_i \end{equation}
and $\pi _i^{zipcann}$
is given by
$\pi _i^{zipcann}$
is given by
 \begin{equation} logit(\pi _i^{zipcann}) = \gamma _{age} x^{age}_i+ \langle \boldsymbol{\beta }_{2}^{(d)},\textbf{z} \rangle \end{equation}
or alternatively,
 \begin{equation} logit(1-\pi _i^{zipcann}) = \gamma _{age} x^{age}_i+ \langle \boldsymbol{\beta }_{2}^{(d)},\textbf{z} \rangle. \end{equation}
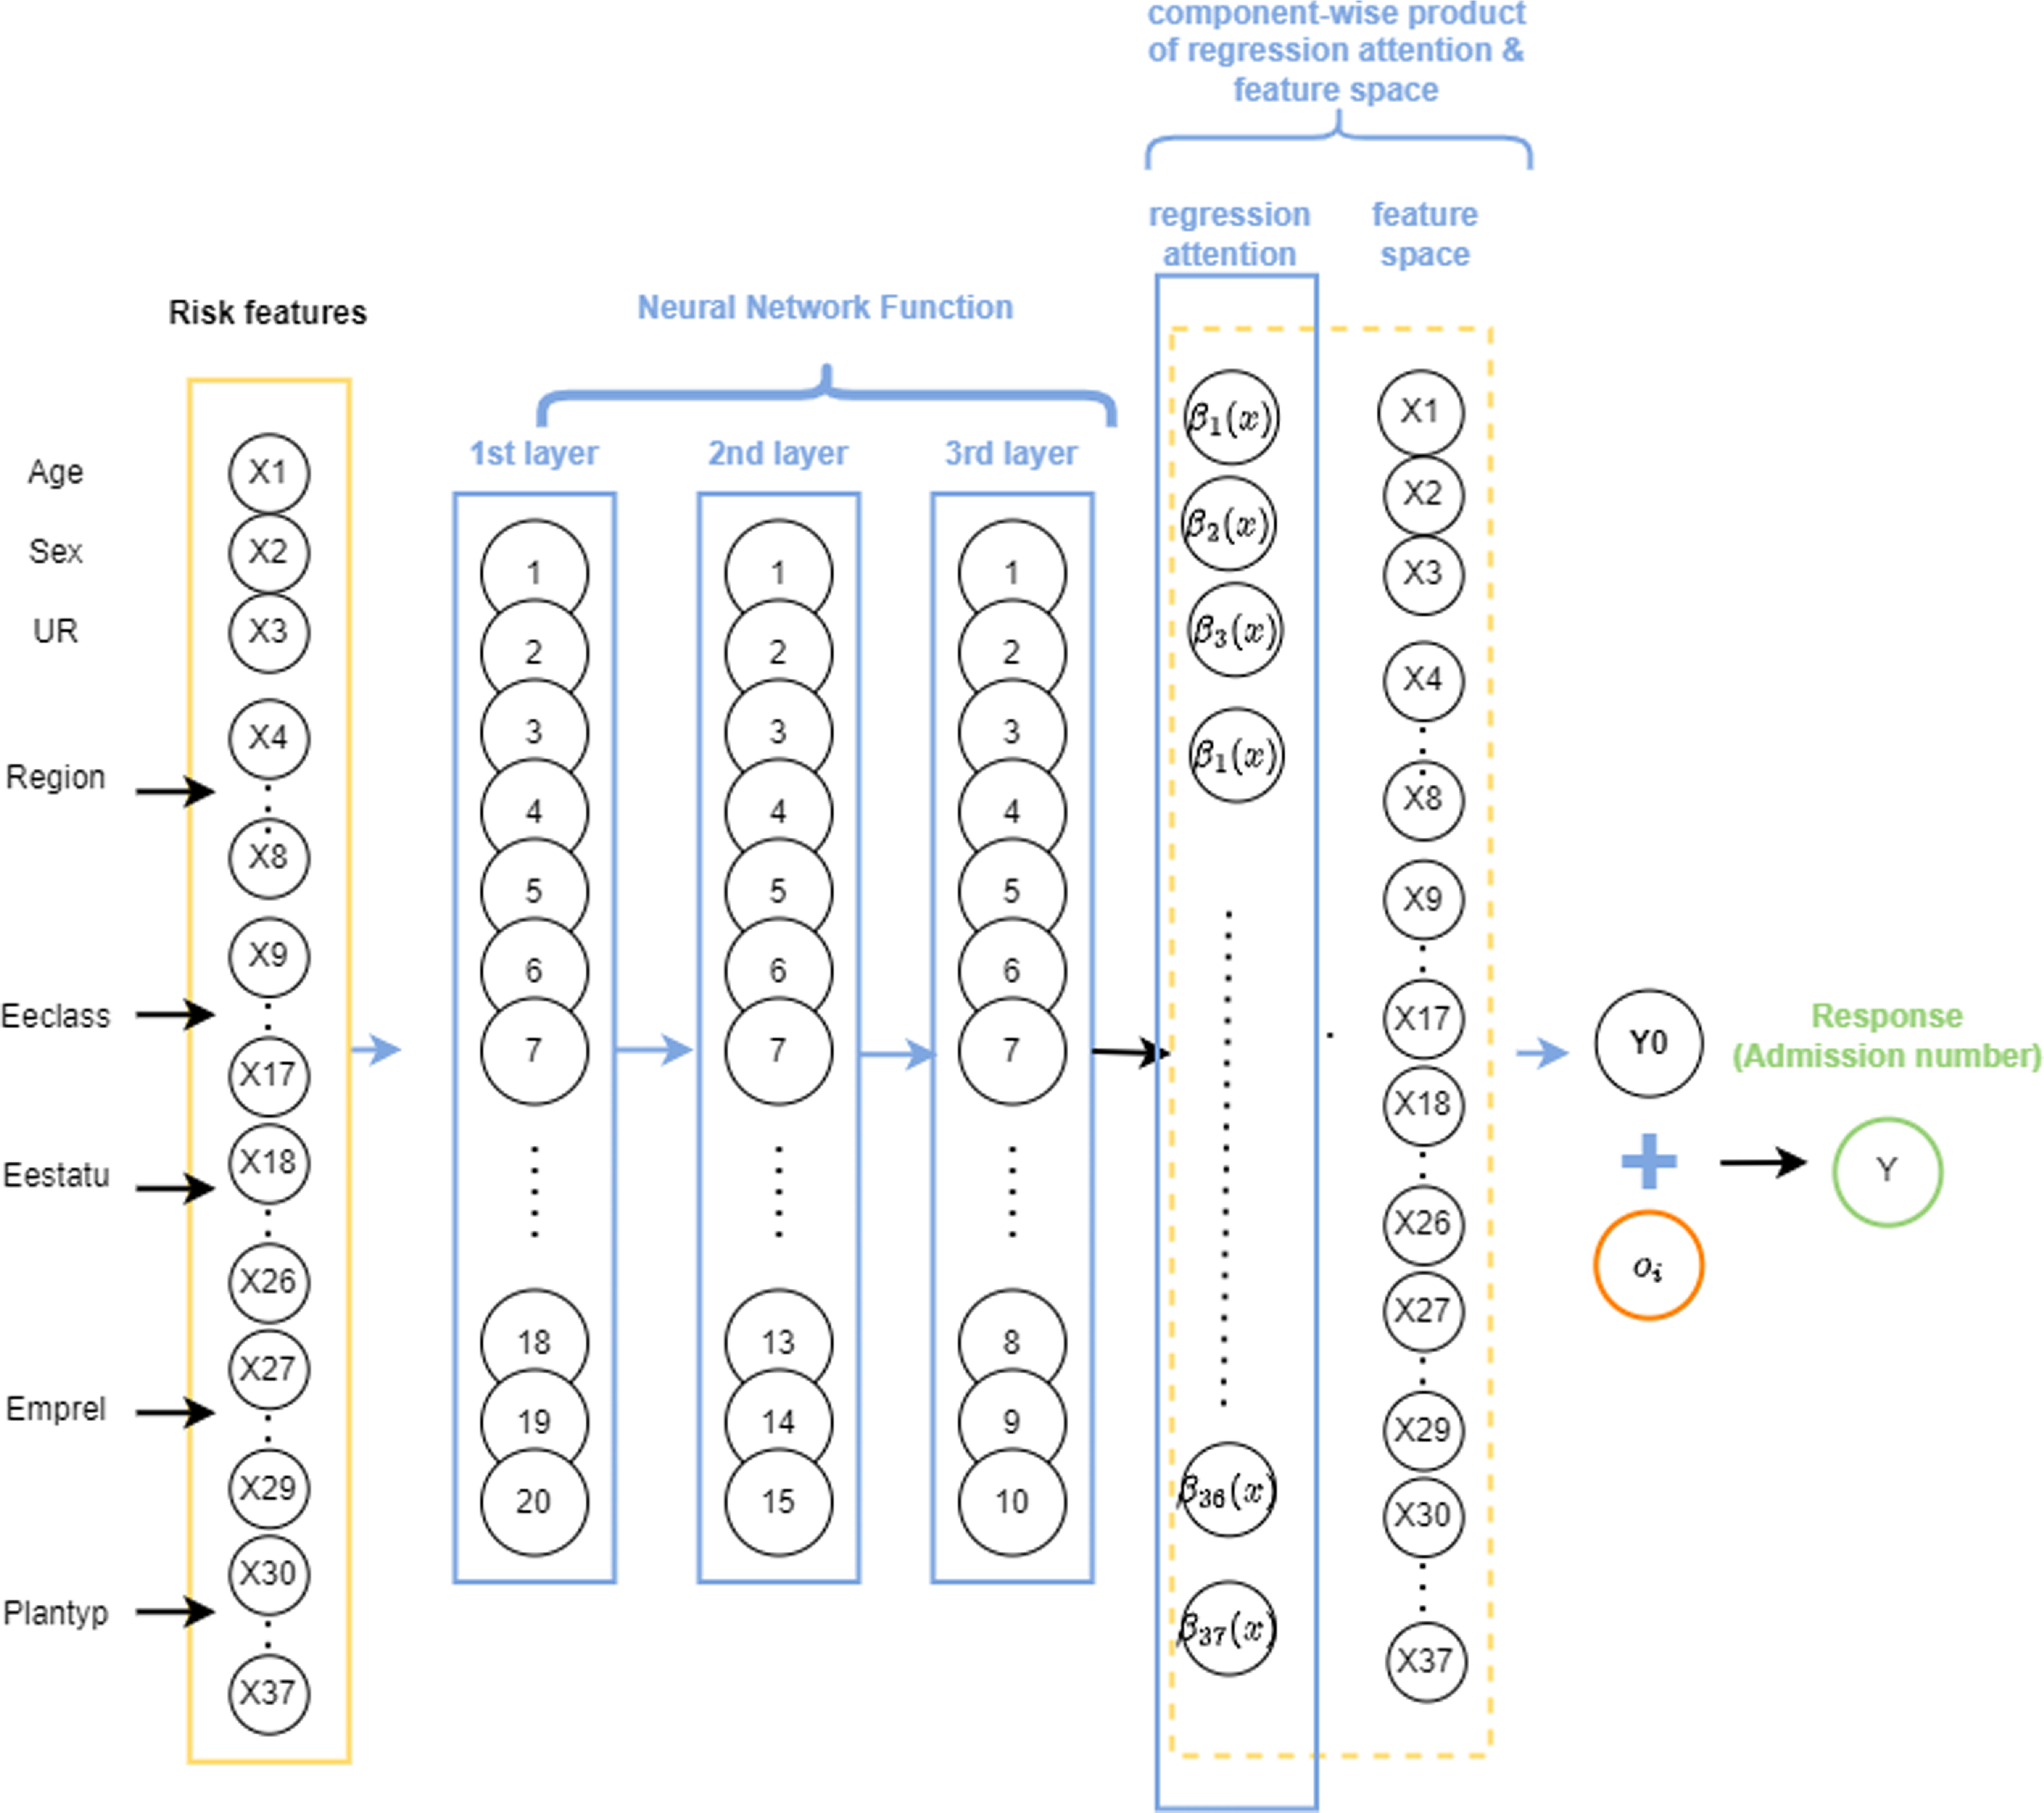
Similarly to the ZIPNN model, the final output layer of the ZIPCANN model is also a distribution layer. The code for fitting the ZIPCANN model is given in Listing 4, and a diagrammatic representation of a sample model with one-hot encoding, skip connections, and 20,15,10,2 neurons in each of the layers (model 6 in Table 5), is shown in Fig. 2. The structure of the ZIPCANN model is given in Listing 5.
An illustration of a sample ZIPCANN model with skip connections, one-hot encoding, and 20,15,10,2 neurons in each of the layers.

4. Model fitting
The ZIP regression model was fitted using zeroinfl() function in the pscl package in RStudio (Zeileis et al., Reference Zeileis, Kleiber and Jackman2008; Jackman, Reference Jackman2020; R Core Team, 2021; RStudio Team, 2021). The zeroinfl() utilizes the Nelder and Mead optimization method for estimating the model coefficients. For the network-based implementation of the ZIP model, we mainly employed the tfprobability package (Keydana, Reference Keydana2022; Dillon et al., Reference Dillon, Langmore, Tran, Brevdo, Vasudevan, Moore, Patton, Alemi, Hoffman and Saurous2017) in addition to the keras (Allaire & Chollet, Reference Allaire and Chollet2021) and tensorflow (Allaire & Tang, Reference Allaire and Tang2021) packages used for constructing NN models. The tfprobability package allows to define probability distributions within a deep-learning model using a distribution layer. The main parts of the code used for building the network-based models are given in Appendix A.2.
4.1 Hyper-parameters
The fitting of NN models requires determining a number of associated hyper-parameters, including the depth of the network, choice of activation function, loss function, and gradient descent method. The hyper-parameter options identified and adopted in Jose et al. (Reference Jose, Macdonald, Tzougas and Streftaris2022) have also been used here, with details given below.
-
• Gradient descent method (GDM): the Nesterov-accelerated adaptive moment estimation (Nadam) method was used as the choice of the Gradient descent optimization algorithm for estimating the model weights.
-
• Network architecture: for NN and CANN models, a network architecture with three hidden layers with (20,15,10) neurons in each layer was considered. As mentioned earlier, the ZIPNN and ZIPCANN models have an additional layer with two neurons. In addition to the layers mentioned above, an attention layer is used to interpret the results from NN models (see Section 5). Also, for the ZIPNN and ZIPCANN models, alternate architectures with different numbers of neurons in the first three hidden layers were considered. The results, as given in Table A.1, indicate that the choice of (20,15,10) architecture has the best predictive performance compared to other architectures in the case of the ZIPNN model. Moreover, for the ZIPCANN model, the (35,25,20) architecture only minimally outperforms the (20,15,10) architecture. Hence, the combination of (20,15,10) neurons in the initial three hidden layers is adopted for both models.
-
• Batch size and epochs: a combination of 30,000 batch size and 500 epochs were used for fitting the NN models. The 30,000 batch size was identified as a reasonable choice in earlier work by Jose et al. (Reference Jose, Macdonald, Tzougas and Streftaris2022), and the large epoch was used since the early stopping approach implemented using the callback method will restrict the model from overfitting.
-
• Validation split: a further 80:20 split of the learning set was used as the training set,
$\mathcal{D}^{(-)}$
, and a validation data set
$\mathcal{V}.$
-
• Loss function: the negative log-likelihood (NLL) was used as the objective function, which the GDM algorithm minimizes for estimating the model weights. The log-likelihood of ZIP mixture distribution is given by
(21)
\begin{equation} \begin{aligned} l(\pi,\mu ;y) = \sum _{i=1}^n &u_i \ln \big (\pi _i + (1-\pi _i) \exp (-\mu _i)\big )\\ &+ (1-u_i)\big [ \ln (1-\pi _i) - \mu _i + y_i\ln (\mu _i)- \ln{(y_i!)} \big ], \end{aligned} \end{equation}


where $u_i = I(y_i = 0)$
,
$u_i = I(y_i = 0)$
, $\mu _i$
is the mean of the Poisson component,
$\mu _i$
is the mean of the Poisson component, $\pi _i$
the probability parameter and
$\pi _i$
the probability parameter and $y_i$
is the response variable. It is worth noting that in the case of the zero-inflated models, the saturated model reduces to the saturated version of the count component (Martin & Hall, Reference Martin and Hall2016). This follows from the fact that a saturated model has the mean responses equivalent to the data, i.e.,
$y_i$
is the response variable. It is worth noting that in the case of the zero-inflated models, the saturated model reduces to the saturated version of the count component (Martin & Hall, Reference Martin and Hall2016). This follows from the fact that a saturated model has the mean responses equivalent to the data, i.e., $E(y_i)= y_i$
. For the zero-inflated models, this is true when we set
$E(y_i)= y_i$
. For the zero-inflated models, this is true when we set $\mu _i = y_i$
and replace
$\mu _i = y_i$
and replace $\pi _i$
with
$\pi _i$
with $u_i= I(y_i=0)$
since
$u_i= I(y_i=0)$
since $E(y_i)=(1-\pi _i)\mu _i$
. Hence, the saturated model for ZIP mixture distribution will be a saturated Poisson distribution.
$E(y_i)=(1-\pi _i)\mu _i$
. Hence, the saturated model for ZIP mixture distribution will be a saturated Poisson distribution.
As previously mentioned, for the ZIPNN and ZIPCANN models, the output layer is a distribution layer (see Listing 1 and A5) with underlying Zero-inflated Poisson distribution and the mean of the distribution is taken as the model outcome or response which is the admission number. More precisely the distribution layer is considered as the model output. The NLL is the negative sum of the logarithm of the likelihood assigned to the observed count by the conditional probability distribution ( $-\sum log(P(y|x,w))$
). As the model’s output is the distribution layer, we can obtain this by defining the loss function as shown in Listing 2.
$-\sum log(P(y|x,w))$
). As the model’s output is the distribution layer, we can obtain this by defining the loss function as shown in Listing 2.
Negative log-likelihood loss function used for training zero-inflated neural network models.

Additionally, the early stopping and dropout model improvement approaches, as detailed in Jose et al. (Reference Jose, Macdonald, Tzougas and Streftaris2022), were used to avoid overfitting for all the network-based models.
5. Interpreting network-based models using the LocalGLMnet approach
The underlying principle of the LocalGLMnet approach, as proposed by Richman & Wüthrich Reference Richman and Wüthrich2023), is to use a NN for estimating the model coefficients of a GLM, as indicated by the name local generalized linear model network or LocalGLMnet. In this case, the coefficients $\boldsymbol{\beta }$
are replaced by feature-dependent non-linear functions
$\boldsymbol{\beta }$
are replaced by feature-dependent non-linear functions $\boldsymbol{\beta (x)}$
. The implementation of this approach involves creating an additional network layer, called the attention layer, with the same dimension as that of the feature space
$\boldsymbol{\beta (x)}$
. The implementation of this approach involves creating an additional network layer, called the attention layer, with the same dimension as that of the feature space $q=q_0$
, containing the so-called regression attention
$q=q_0$
, containing the so-called regression attention $\boldsymbol{\beta (x)}$
. The regression attention terminology follows from its similarity to the attention weights proposed by Bahdanau et al. (Reference Bahdanau, Cho and Bengio2014) and Vaswani et al. (Reference Vaswani, Shazeer, Parmar, Uszkoreit, Jones, Gomez, Kaiser and Polosukhin2017). The motivation behind the attention weights is to give sufficient weight (attention) to the different features reflecting their significance. Richman & Wüthrich Reference Richman and Wüthrich2023) further extended this to develop LocalGLMnet to derive explanations from the results similar to a GLM. The key assumption behind this is the additive decomposition of the predicted value in terms of the features, as shown in Equation (22). In other words, the predicted value could be represented in terms of the weighted sum of features. Thus, in the case of a LocalGLMnet, the predictor is of the form
$\boldsymbol{\beta (x)}$
. The regression attention terminology follows from its similarity to the attention weights proposed by Bahdanau et al. (Reference Bahdanau, Cho and Bengio2014) and Vaswani et al. (Reference Vaswani, Shazeer, Parmar, Uszkoreit, Jones, Gomez, Kaiser and Polosukhin2017). The motivation behind the attention weights is to give sufficient weight (attention) to the different features reflecting their significance. Richman & Wüthrich Reference Richman and Wüthrich2023) further extended this to develop LocalGLMnet to derive explanations from the results similar to a GLM. The key assumption behind this is the additive decomposition of the predicted value in terms of the features, as shown in Equation (22). In other words, the predicted value could be represented in terms of the weighted sum of features. Thus, in the case of a LocalGLMnet, the predictor is of the form
 \begin{equation} \begin{aligned} \boldsymbol{x_i}\mapsto g(\mu _i) = g(\mu (\boldsymbol{x_i})) &= \beta _0 + \langle \boldsymbol{\beta (x_i),x_i}\rangle + o_i\\\\ &=\beta _0 + \big (\beta _1(\boldsymbol{x_i})x_{i1} +\ldots + \beta _q(\boldsymbol{x_i})x_{iq}\big ) + o_i \end{aligned} \end{equation}
where
 \begin{equation} \boldsymbol{x_i}\mapsto \boldsymbol{\beta (x_i) = z^{(d:1)}(x_i) = \big (z^{(1)}\circ \ldots .\circ z^{(d)}\big )(x_i)} \end{equation}
with $g()$
being the link function and
$g()$
being the link function and $\mu _i$
being the mean of the distribution underlying the NN regression function. Interpretations are then obtained by considering the covariate contribution
$\mu _i$
being the mean of the distribution underlying the NN regression function. Interpretations are then obtained by considering the covariate contribution $\beta _j(\boldsymbol{x_i})x_{ij}$
associated with each of the features
$\beta _j(\boldsymbol{x_i})x_{ij}$
associated with each of the features $x_{ij}, j=1,\ldots,q_0$
, obtained by extracting the component-wise product. The layer thus containing the component-wise product was termed the LocalGLM layer by Richman & Wüthrich Reference Richman and Wüthrich2023). As
$x_{ij}, j=1,\ldots,q_0$
, obtained by extracting the component-wise product. The layer thus containing the component-wise product was termed the LocalGLM layer by Richman & Wüthrich Reference Richman and Wüthrich2023). As $\beta _j(\boldsymbol{x_i})$
depends on the features
$\beta _j(\boldsymbol{x_i})$
depends on the features $\boldsymbol{x}_i= (x_{i1},\ldots,x_{i,j})$
,
$\boldsymbol{x}_i= (x_{i1},\ldots,x_{i,j})$
, $\beta _j(\boldsymbol{x_i})x_{ij}$
vary for each of the record and interpretations are derived for each feature
$\beta _j(\boldsymbol{x_i})x_{ij}$
vary for each of the record and interpretations are derived for each feature $x_j$
by looking at the
$x_j$
by looking at the $\beta _j(\boldsymbol{x_i})x_{ij}$
for
$\beta _j(\boldsymbol{x_i})x_{ij}$
for $i=1,\ldots,n$
. Prior to extending the approach to the ZIPNN model, we implemented it for a NN model, as proposed by Richman & Wüthrich Reference Richman and Wüthrich2023). This highlights the merits of the LocalGLMnet approach, as well as its potential to be extended for more complex models. A diagrammatic representation of a sample LocalGLMnet with three hidden layers and (20,15,10) neurons in each of the layers (model 7 in Table 5) is shown in Fig. 3 and the code for implementing it is given in Listing 6.
$i=1,\ldots,n$
. Prior to extending the approach to the ZIPNN model, we implemented it for a NN model, as proposed by Richman & Wüthrich Reference Richman and Wüthrich2023). This highlights the merits of the LocalGLMnet approach, as well as its potential to be extended for more complex models. A diagrammatic representation of a sample LocalGLMnet with three hidden layers and (20,15,10) neurons in each of the layers (model 7 in Table 5) is shown in Fig. 3 and the code for implementing it is given in Listing 6.
An illustration of a sample LocalGLMnet model with LocalGLM layer, one-hot encoding, and 20,15,10 neurons in each of the layers.
To demonstrate the process of deriving interpretations we consider, as an example, the covariate contributions for the variables AGE and SEX. These are shown in Fig. 4, while the crude admission rates are shown in Fig. 5. Detailed analysis and interpretations for other covariate contributions is given later using the ZIPNN model.
Graphical representation of covariate contribution from LocalGLMnet model for the testing set (a) age variable; (b) male, female; the blue line indicates a spline fit approximate curve and the yellow line has been added as a reference line at levels -0.25 and 0.25.

Age-wise crude rates of admission due to respiratory diseases for male and female patients for the entire data set.

The crude admission rates clearly show that the rates increase with age for both males and females. Also, the female population generally has higher rates compared to the male population. The same conclusion can be inferred from the covariate contributions. The median value of covariate contributions for females (SEX = 2) is higher than for males (SEX = 1), indicating higher admission rates. Similarly, the covariate contribution for the AGE variable implies an increasing trend of admission rates with age, with more variability at younger and older ages.
5.1 Interpreting the ZIPNN model
In order to interpret the results obtained from ZIPNN model, we extend the additive decomposition assumption to the $\mu$
and
$\mu$
and $p=(1-\pi )$
parameters of the underlying ZIP mixture distribution as shown in Equation (4). The regression weights corresponding to each feature are calculated separately for
$p=(1-\pi )$
parameters of the underlying ZIP mixture distribution as shown in Equation (4). The regression weights corresponding to each feature are calculated separately for $\mu$
and
$\mu$
and $p$
. Hence, the dimension of the layer analogous to the LocalGLM layer with the component-wise product of regression weights and features is
$p$
. Hence, the dimension of the layer analogous to the LocalGLM layer with the component-wise product of regression weights and features is $2\times q_0$
. Among these
$2\times q_0$
. Among these $2\times q_0$
weights,
$2\times q_0$
weights, $q_0$
weights are associated with
$q_0$
weights are associated with $\mu$
and the rest with
$\mu$
and the rest with $p$
.
$p$
.
5.1.1 Regression attention for ZIPNN
The ZIPNN model, as defined in Section 3.2, consists of an input layer, multiple hidden layers, with the last hidden layer containing two neurons, followed by the distribution layer and the output layer. To create the interpretable ZIPNN model, the attention layer is introduced before the distribution layer, effectively replacing the last hidden layer of the ZIPNN model with two neurons (see Fig. 6).
An illustration of an interpretable ZIPNN model with regression attention, one-hot encoding, and 20,15,10 neurons in each of the layers.

Hence, the rate and probability parameters defined in Equations (13) and (14) are replaced by
 \begin{equation} \log (\mu _i^{zipnn}) = \beta _{0\mu } + \langle \boldsymbol{\beta _{(q_0+1:2q_0)}(x}_i),\boldsymbol{x_i}\rangle + o_i \end{equation}
and
 \begin{equation} logit(p_i^{zipnn}) = \beta _{0\pi } + \langle \boldsymbol{\beta _{(1:q_0)}(x}_i),\boldsymbol{x_i}\rangle \end{equation}
with $\boldsymbol{x_i}\mapsto \boldsymbol{\beta (x_i) = z^{(d:1)}(x_i) = \big (z^{(1)}\circ \ldots .\circ z^{(d)}\big )(x_i)}$
. The attention weights
$\boldsymbol{x_i}\mapsto \boldsymbol{\beta (x_i) = z^{(d:1)}(x_i) = \big (z^{(1)}\circ \ldots .\circ z^{(d)}\big )(x_i)}$
. The attention weights $\boldsymbol{\beta _{(1:q_0)}(x})$
and
$\boldsymbol{\beta _{(1:q_0)}(x})$
and $\boldsymbol{\beta _{(q_0+1:2q_0)}(x})$
are associated with parameters
$\boldsymbol{\beta _{(q_0+1:2q_0)}(x})$
are associated with parameters $p$
and
$p$
and $\mu$
respectively. The interpretations or the impact of the different features on parameters
$\mu$
respectively. The interpretations or the impact of the different features on parameters $\mu$
and
$\mu$
and $p$
are derived by analyzing the covariate contributions:
$p$
are derived by analyzing the covariate contributions: $\beta _j(\boldsymbol{x_i})x_{ij}$
for
$\beta _j(\boldsymbol{x_i})x_{ij}$
for $p_i$
and
$p_i$
and $\beta _{q_0+j}(\boldsymbol{x_i})x_{ij}$
for
$\beta _{q_0+j}(\boldsymbol{x_i})x_{ij}$
for $\mu _i$
, where
$\mu _i$
, where $j=1,\ldots,q_0$
. Sample code for creating an interpretable ZIPNN model (model 8 in Table 5) is given in Listing 7. The structure of the interpretable ZIPNN model is given in Listing 8.
$j=1,\ldots,q_0$
. Sample code for creating an interpretable ZIPNN model (model 8 in Table 5) is given in Listing 7. The structure of the interpretable ZIPNN model is given in Listing 8.
Although it is possible to create interpretable versions of both CANN and ZIPCANN models similar to those for the NN and ZIPNN models, the introduction of the attention layer nullifies one of the primary purposes of skip connections, which is to distinguish the main effects from the complex effects. This is because the attention layer will integrate the main effect represented by the skip connection and with the complex effect from the network. Hence, in this work, we do not discuss interpretable versions of the CANN and ZIPCANN models.
6. Comparison of models
In this section, we compare the different models discussed so far. The models are compared in terms of predictive performance and the insights obtained from the model results.
6.1 Predictive performance
The NLL was used to compare the predictive performance of the implemented models. While other comparison measures are available, such as the mean absolute error and the mean square error, these focus on the deviation of the predicted value from the actual observed value and do not fully account for the considered probability distribution when using a probabilistic model. Also, other alternative measures, such as the predicted probability of a zero count, fall short of providing a comprehensive comparison as they only consider the probability of admission as a dichotomous event, and fail to consider the admission rate. The NLL of a model has the form:
 \begin{equation} \mathcal{L}_{\mathcal{A}} (\boldsymbol{\beta }) = -\log \Big (L_{f}\Big ) \end{equation}
where $\mathcal{A}$
represents the data set and
$\mathcal{A}$
represents the data set and $L_{f}$
gives the likelihood of the fitted model (e.g. Equation (21) for the log-likelihood of a ZIP mixture distribution). Performance was compared based on the NLL
$L_{f}$
gives the likelihood of the fitted model (e.g. Equation (21) for the log-likelihood of a ZIP mixture distribution). Performance was compared based on the NLL $\mathcal{L}_{\mathcal{T}}$
of different models for the testing set
$\mathcal{L}_{\mathcal{T}}$
of different models for the testing set $\mathcal{T}$
. Values of the NLL for both the testing and training data sets, for all considered models, are shown in Table 5. Table 5 also contains the average fitted mean
$\mathcal{T}$
. Values of the NLL for both the testing and training data sets, for all considered models, are shown in Table 5. Table 5 also contains the average fitted mean $\hat{\mu }$
for each model for the full data set. The difference between the average fitted mean of a model and that of the empirical mean of observed data indicates population-level bias.
$\hat{\mu }$
for each model for the full data set. The difference between the average fitted mean of a model and that of the empirical mean of observed data indicates population-level bias.
The results indicate that the ZIPNN model has the lowest testing loss compared to other models. In general, the models with an underlying zero-inflated mixture distribution assumption performed better than those with a basic Poisson distribution assumption. The ZIPNN and ZIPCANN models performed better than the traditional ZIP regression model. Similarly, the NN and CANN models performed better than the conventional Poisson regression model. As the difference between the testing loss of ZIPNN and ZIPCANN models is small, it is not possible to conclusively state the supremacy of one over the other due to the inherent randomness in NN results. The different attributes leading to the randomness in NN model results have been extensively discussed by Richman & Wüthrich (Reference Richman and Wüthrich2020). Approaches such as nagging predictor and k-fold validation could be adopted to address this randomness, as done in previous work by Jose et al. (Reference Jose, Macdonald, Tzougas and Streftaris2022). More than the inherent randomness, the underlying architecture sways the model performance on a larger scale. Hence we analyzed this impact by considering different architectures of varying complexity. As shown in Table A.1, the combination of 20,15,10 neurons in the first three hidden layers is a suitable choice for both ZIPNN and ZIPCANN models.
6.2 Model interpretability
In order to compare the interpretations derived from the model results, we consider the coefficient estimates from the ZIP regression model and the covariate contributions from the ZIPNN model. The coefficient estimates $(\boldsymbol{\beta _{reg},\gamma })$
from the ZIP regression model are given in Table 6. For the ease of interpretation of the results, a sum-to-zero constraint was applied to the coefficient estimates of different levels of all the non-binary categorical variables.
$(\boldsymbol{\beta _{reg},\gamma })$
from the ZIP regression model are given in Table 6. For the ease of interpretation of the results, a sum-to-zero constraint was applied to the coefficient estimates of different levels of all the non-binary categorical variables.
Coefficient estimates based on the ZIP regression model with the significance codes ("***,""**,""*," ".,"" ") indicating the level of significance of the estimates at levels (0, 0.001,0.01, 0.05, 0.1, 1 )

The interpretation of coefficient estimates from a ZIP distributional assumption is more complex compared to a conventional regression model, because it refers to a mixture distribution. For the ZIP regression model considered here, the count component considers all features, whereas the zero component only considers the age variable. Additionally, in the case of the ZIPNN model, an attention layer is used for both $\lambda$
and
$\lambda$
and $p$
parameters, which means that the covariate contributions of different variables for
$p$
parameters, which means that the covariate contributions of different variables for $\lambda$
need to be considered in conjunction with those for the
$\lambda$
need to be considered in conjunction with those for the $p$
parameter. This makes interpreting the results and comparison with ZIP regression model less straightforward. The comparison was carried out between the most significant coefficient estimates in the ZIP regression model and the corresponding covariate contribution using the ZIPNN model.
$p$
parameter. This makes interpreting the results and comparison with ZIP regression model less straightforward. The comparison was carried out between the most significant coefficient estimates in the ZIP regression model and the corresponding covariate contribution using the ZIPNN model.
The plots showing the covariate contributions were produced using the test data. Figs. 7 and 7 (continued) show the covariate contributions for different variables associated with the rate ( $\lambda$
) parameter, while Figs. 8 and 8 (continued) show the covariate contributions for the
$\lambda$
) parameter, while Figs. 8 and 8 (continued) show the covariate contributions for the $p$
parameter. The horizontal yellow line in the plots was added as a reference line at levels -0.25 and 0.25. This can help to compare the magnitude of the covariate contributions and how they are associated with the parameters.
$p$
parameter. The horizontal yellow line in the plots was added as a reference line at levels -0.25 and 0.25. This can help to compare the magnitude of the covariate contributions and how they are associated with the parameters.
Graphical representation of covariate contributions for parameter $\lambda$
in the ZIPNN model: (a) AGE; (b) SEX; (c) UR; (d) REGION; (e) EECLASS; (f) EESTATU.
$\lambda$
in the ZIPNN model: (a) AGE; (b) SEX; (c) UR; (d) REGION; (e) EECLASS; (f) EESTATU.

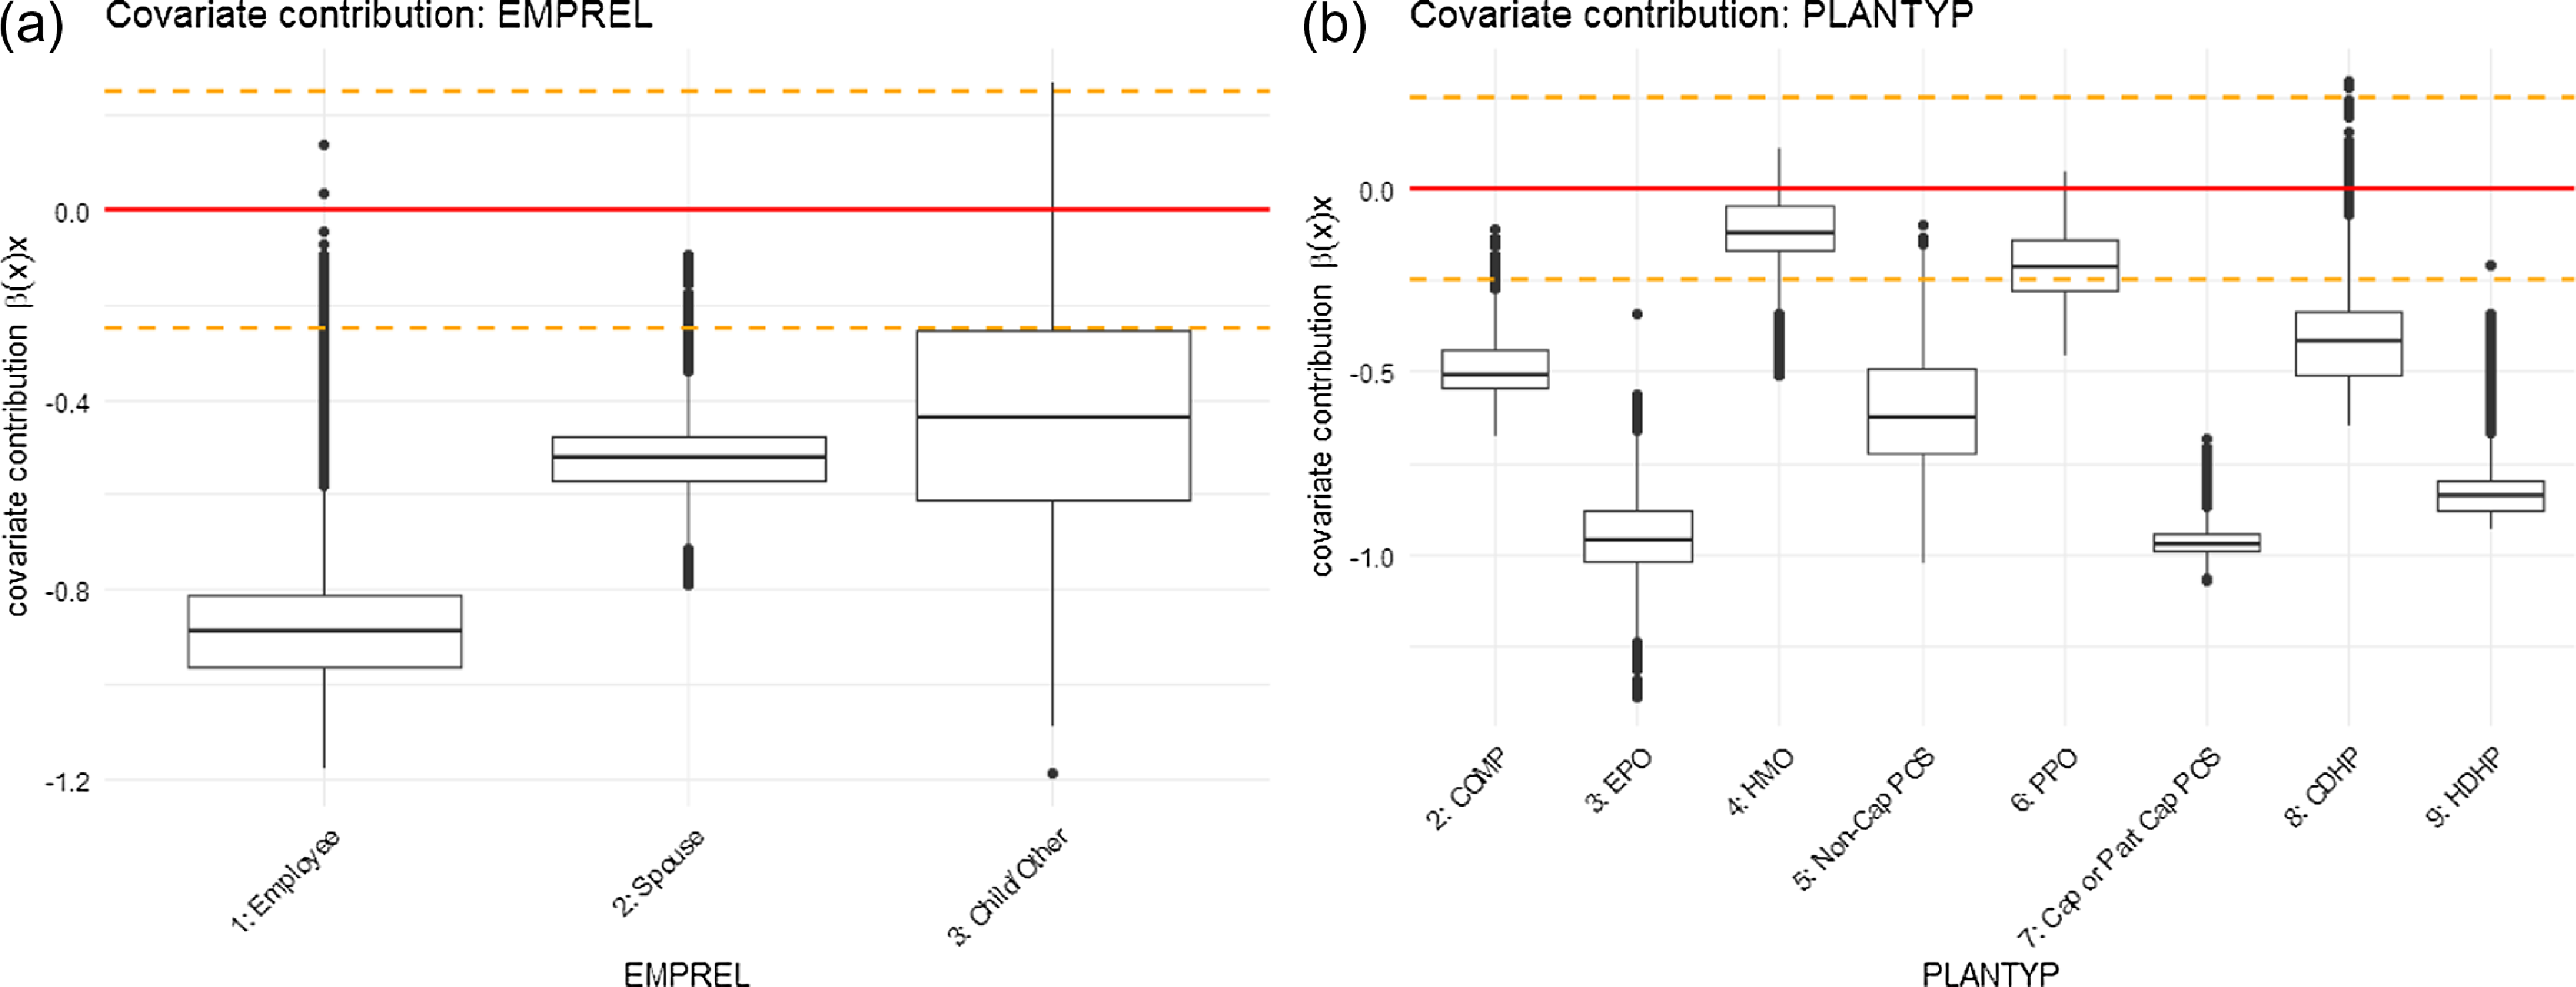
(continued). Graphical representation of covariate contributions for parameter $\lambda$
in the ZIPNN model: (a) EMPREL; (b) PLANTYP.
$\lambda$
in the ZIPNN model: (a) EMPREL; (b) PLANTYP.
The analysis of the covariate contributions using the ZIPNN model for the AGE variable for both the probability and rate parameters (Figs. 7 and 8) indicates an increasing trend over age. This suggests a positive relationship showing that as age increases, both the probability of having an admission and the rate of admission increase. The spline fit (blue line) indicates an almost linear trend, with the greatest variability at younger and older ages. In both cases, this suggests that the impact of the age variable on the parameters varies at different ages. The variation appears to be lowest around the age of 47 before increasing for older ages as well. The highly significant positive coefficient estimate for the AGE variable in the count component of the ZIP regression model (see Table 6) indicates that the rate of admission increases with age. The negative estimate in the zero component associated with the $\pi$
parameter also suggests that the probability of having excess zero decreases with age. In other words, the probability of having non-zero admissions increases with age.
$\pi$
parameter also suggests that the probability of having excess zero decreases with age. In other words, the probability of having non-zero admissions increases with age.
The covariate contributions under the ZIPNN model for the SEX variable indicate a higher probability and rate of admission for females (SEX = 2) compared to males (Figs. 7 and 8). The significant positive coefficient estimate in the count component of the ZIP regression model also implies the same. This is in line with the pattern displayed by the crude rates (see Fig. 5). The low variability in both cases suggests that gender has a consistent and explicit impact on admissions related to respiratory diseases.
Regarding the UR variable, the ZIP regression model suggests a lower admission rate for individuals in the urban area (UR = 2), based on its significant negative coefficient estimate (Table 6). This contradicts the pattern observed under the ZIPNN model. Although not considerably different, the covariate contributions suggest that people in urban areas are more prone to respiratory disease-related admissions (Figs. 7 and 8). This difference could be arising due to the fact that the network architecture captures complex interactions between different features, which is accounted for while estimating the non-linear regression weights, $\boldsymbol{\beta (x)}$
. For instance, there may exist an interaction between the age and UR variables, due to the possibility that retired or older individuals are more likely to reside in rural areas.
$\boldsymbol{\beta (x)}$
. For instance, there may exist an interaction between the age and UR variables, due to the possibility that retired or older individuals are more likely to reside in rural areas.
Graphical representation of covariate contributions for parameter $p$
in the ZIPNN model: (a) AGE; (b) SEX; (c) UR; (d) REGION; (e) EECLASS; (f) EESTATU.
$p$
in the ZIPNN model: (a) AGE; (b) SEX; (c) UR; (d) REGION; (e) EECLASS; (f) EESTATU.

(continued). Graphical representation of covariate contributions for parameter $p$
in the ZIPNN model: (a) EMPREL; (b) PLANTYP.
$p$
in the ZIPNN model: (a) EMPREL; (b) PLANTYP.

The coefficient estimates based on the ZIP regression model for the REGION variable $(\beta _{region_z}, z=1,\ldots,5)$
, given in Table 6, indicate a higher rate of admission when the REGION variable is unknown (REGION = 5). However, the estimate is not significant. The high variability of covariate contribution under the ZIPNN model for level 5 of the region variable is also pointing toward this uncertainty (see Fig. 7). On the other hand, the “west” region (REGION = 4) has a significant negative coefficient estimate under the ZIP regression model, implying a lower admission rate for individuals from the western region. The covariate contribution in the ZIPNN model corresponding to the
$(\beta _{region_z}, z=1,\ldots,5)$
, given in Table 6, indicate a higher rate of admission when the REGION variable is unknown (REGION = 5). However, the estimate is not significant. The high variability of covariate contribution under the ZIPNN model for level 5 of the region variable is also pointing toward this uncertainty (see Fig. 7). On the other hand, the “west” region (REGION = 4) has a significant negative coefficient estimate under the ZIP regression model, implying a lower admission rate for individuals from the western region. The covariate contribution in the ZIPNN model corresponding to the $\lambda$
parameter for the REGION variable also suggests the same (Fig. 7).
$\lambda$
parameter for the REGION variable also suggests the same (Fig. 7).
In the case of the EECLASS variable, a significantly higher rate of admission is inferred from the coefficient estimates of the ZIP regression model for “hourly non-union” and “hourly union” (levels 4 and 5) and significantly low rates for individuals with unknown (level 9) employee classification (Table 6). A comparable trend is observed when the covariate contributions for both rate and probability parameters under the ZIPNN model are considered together, which is essential as interpreting the results based on a single parameter could be unclear. For example, the covariate contributions for the “salary union” level (level 2) of the EECLASS variable related to the rate parameter (see Fig. 7) suggest that the admission rate is high for individuals belonging to that employee classification cohort. However, the covariate contribution associated with the probability parameter (Fig. 8) indicates that the probability of having an admission is very low for individuals in that group. In contrast, for individuals with unknown employee classification, the covariate contributions not only indicate a lower probability of admission but also imply a lower admission rate.
Similarly, for the EESTATU variable, the combined analysis of covariate contributions of both parameters (Figs. 7 and 8) points toward a higher propensity for admission related to respiratory diseases for individuals with employment status categorized as “long-term disability” (level 7), whereas it is low for individuals with employment status “Active Part Time or Seasonal” (level 2). The same pattern is inferred from the associated coefficient estimates in the ZIP regression model. It is reasonable to conclude that the higher admission rates for people with long-term disability are as anticipated. Drawing further inferences regarding the relationship between employment details of individuals and hospital admission for respiratory diseases is difficult in the current context of admission data. The data provider has compiled the data set by assigning the employment-related information of the primary beneficiary/employee to their dependents as well. In other words, the employment information of those individuals classified as dependents (EMPREL as “spouse” (level = 2) or “child/other” (level = 3)) in the data set does not accurately represent their actual employment status. For instance, an unemployed dependent of an employee/primary beneficiary will also have the same employment-related information as the employee. Due to these inaccuracies within the data set, it becomes challenging to draw conclusive associations between employment information and the rate of admission due to respiratory diseases.
For the EMPREL variable, the pattern is slightly more evident. The coefficient estimates based on the ZIP regression model indicate a significant difference in the admission rates for different levels of EMPREL covariate (Table 6). The individuals with EMPREL as “child/other” (level = 3) have the highest rate of admission, followed by “spouse”(level = 2) and “employee”(level = 1). Although the same pattern is observed in the covariate contribution related to the $\lambda$
parameter (Fig. 7 (continued)), the covariate contribution associated with
$\lambda$
parameter (Fig. 7 (continued)), the covariate contribution associated with $p$
(Fig. 8 (continued)) indicates a lower probability of admission for individuals with EMPREL categorized as "spouse" compared to "employee."
$p$
(Fig. 8 (continued)) indicates a lower probability of admission for individuals with EMPREL categorized as "spouse" compared to "employee."
The coefficient estimates for the different levels of the PLANTYP variable in the ZIP regression model indicate that the admission rates are significantly lower for the High-Deductible Health Plan (HDHP) (level = 9) than for other types of plans. This trend is also supported by the ZIPNN model. The covariate contributions not only indicate a lower probability of admission (Fig. 8 (continued)) but also suggest lower admission rates (Fig. 7 (continued)) for individuals under the "HDHP" plan type. This suggests that individuals who are covered under HDHP plans may have a lower likelihood of getting hospitalized for respiratory diseases, and if they do, it occurs at a lower rate. This might be due to the fact that the HDHP plan incentivizes individuals to be more proactive in managing their health and seek care only when essential or have more restrictive coverage.
7. Concluding remarks
In this article, we have considered the combined actuarial neural network (CANN) approach for constructing a Zero-inflated Poisson Combined Actuarial Neural Network (ZIPCANN) model for modeling admission rates related to health insurance. We also employed the LocalGLMnet approach to interpret the findings under the ZIPNN model and compared them with those obtained from the ZIP regression model. The comparisons demonstrated the capability of NN-based models to capture potential non-linear interactions among risk factors for both the probability and rate parameters of the mixture model (see Figs. 7 and 8, respectively). Furthermore, from a practical standpoint, the separate attention layers that we included in the NN structure for the two model components, enabled us to analyze the impact of important risk factors on both the probability and rate of admissions.
The results indicate that the ensemble of models developed in this work benefit from superior predictive performance compared to conventional regression models. Furthermore, the underlying zero-inflated mixture distribution allows the ZIPNN and ZIPCANN models to accommodate the excess zero nature of the data, while also benefiting from improved predictive performance offered by NN methodologies. Moreover, the network architecture enables the model to capture potential interactions between features without the need to manually identify and specify them, as required in regression models. Additionally, the attention layer approach facilitates deriving interpretations from the model, allowing for an in-depth understanding of the various risk attributes on admissions related to respiratory diseases.
An interesting approach for further research would be to consider bivariate or multivariate versions of the developed models, aiming to address rates related to comorbidities. These models could extensively aid in devising healthcare intervention programs and investigating admissions related to other diseases. They could also be easily extended and adapted for other rate-setting problems within the insurance sector. Finally, it is worth noting that other zero-inflated models, such as a zero-inflated negative binomial model, can be implemented under the proposed framework, while extensions to bivariate and/or mutlivariate versions of such zero-inflated models for dealing with different types of claims are possible.
Acknowledgments
Certain data used in this study were supplied by Merative as part of one or more Merative MarketScan Research Databases. Any analysis, interpretation, or conclusion based on these data is solely that of the authors and not Merative.
We would also like to thank Ian Duncan of the University of California, Santa Barbara for his immense support and guidance.
Data availability statement
Restrictions apply to the availability of these data. We are unable to provide the data due to the data use agreement with Merative, who provided the data.
Funding statement
This research was funded by the Society of Actuaries, https://www.soa.org under a CAE research grant on “Predictive modelling for medical morbidity trends related to insurance”.
A. Appendix
A. 1. Tables
The testing loss, learning loss, and average fitted mean of the ZIPNN and ZIPCANN models with (50,35,25), (35,25,20), (25,20,15), (20,15,10), and (15,10,5) neurons in the initial three hidden layers.

A.2. Codes and model structure
Code for implementing ZIPNN.

Code for implementing ZIPCANN.

Structure of the ZIPCANN model.

Code for implementing LocalGLMnet.

Code for interpretable ZIPNN model.

Structure of the interpretable ZIPNN model.


 Open access