


Introduction
Inner-city neighborhoods are often disadvantaged because of high levels of poverty and the lack of resources, income, and healthful food opportunities. Many disparities can be linked to socioeconomic inequality. Jiao et al. (Reference Jiao, Drewnowski, Moudon, Ulmer and Hurvitz2012) find that health risks and resources are spatially and socially structured, as well as economically disproportionate to those in disadvantaged neighborhoods. They associate the diet-related health of individuals with the socioeconomic status of their neighborhoods. Often, there is a greater proportion of nonwhite residents in these inner-city neighborhoods (Parker et al. Reference Parker, Horowitz, Brown, Fry, Cohn and Igielnik2018).
Taste preferences, culture, and the variety and affordability of healthful food alternatives affect healthful food choices (McEntee and Agyeman Reference McEntee and Agyeman2010; Ver Ploeg and Wilde Reference Ver Ploeg and Wilde2018). Since consumers are often aware of the difference between healthful and unhealthful foods and would prefer healthful foods if both prices were the same (Drewnowski and Barratt-Fornell Reference Drewnowski and Barratt-Fornell2004; Breyer and Voss-Andreae Reference Breyer and Voss-Andreae2013; Patel et al. Reference Patel, Cogswell, John, Creel and Ayala2017), the main interest is whether the retail food environment provides a broad collection of affordable foods that constitute a healthful diet (Walker et al. Reference Walker, Fryer, Butler, Keane, Kriska and Burke2011, Walker, Block, and Kawachi Reference Walker, Block and Kawachi2012; Thomsen et al. Reference Thomsen, Nayga, Alviola and Rouse2015). Grocery retailers can be a resource that provides healthful food options. The quality of accessible food influences a person's desire to establish a dietary pattern (French, Story, and Jeffrey Reference French, Story and Jeffrey2001; Drewnowski and Spector Reference Drewnowski and Specter2004).
Obesity and other weight-related diseases already account for 25 to 64 percent of the U.S. public health sector costs (RTI 2013). Gordon-Larsen et al. (Reference Gordon-Larsen, Nelson, Page and Popkin2006) find that health disparities decrease with a higher socioeconomic status. Several studies suggest that a greater accessibility of healthful foods and healthier outlets is associated with a greater consumption of those foods (Moore and Diez Roux Reference Moore and Diez Roux2006; Franco et al. Reference Franco, Diez Roux, Glass, Cabllero and Brancati2008; Auchincloss et al. Reference Auchincloss, Riolo, Brown, Cook and Diez Roux2011) and lower obesity rates (Morland, Diez Roux, and Wing Reference Morland, Diez Roux and Wing2006; Morland and Evenson Reference Morland and Evenson2009).
In this article, we analyze whether the racial/ethnic composition and the food-assistance status of residents within Seattle, WA, explain the travel distance and travel time from specific census tracts to the closest full-service grocery store. We use percentages of different nonwhite populations to assess whether they must travel an equal distance to shop at a full-service grocery store. Many studies do not differentiate across nonwhite populations. Following Sharpe (Reference Sharpe2019), we argue that using the breakdown of racial/ethnic groups offers better insights, which can be lost if there is an aggregation across all nonwhite populations. To preview our results, our findings differ across black, Asian, and Hispanic populations. We apply a spatial autoregressive (SAR) model to estimate how the composition of census tracts explains the driving distances and driving times to grocery stores. We find that the effect of a greater income on the distance is heterogeneous across racial groups, which may be influenced by cultural affinity.
We focus on Seattle and argue that the problem of food access and nutritional equity is heterogeneous, causing it to be difficult to make general observations nationally. For example, using Canadian cities, Wang et al. (Reference Wang, Tao, Qiu and Lu2016) find a significant negative coefficient with minority variables in Regina but does not find any statistically significant association in Saskatoon. Our study in Seattle, WA, differs from many previous studies and finds that Asian populations are closer to groceries and Hispanic populations are farther away from groceries, and that the supplemental nutrition assistance program (SNAP)-recipient status is a significant predictor of distance to groceries in Seattle. We find that greater household income has a heterogeneous relationship with the driving distance across racial groups. We note that minority populations in Seattle also have lesser access to vehicles. This implies that nationally representative studies may not capture the regional heterogeneity, and localized studies are required to avoid “one-size-fits-all” policies, especially in rapidly growing communities with multiple minority populations such as Seattle, WA.
Previous studies
Location of grocery stores, food deserts, and food swamps
The trip to the grocery store should be one of the most basic functions of life. For many, buying food is a major chore, involving traffic or public transportation, long lines, sporadic services, unsanitary conditions, and poor food selection. The environment and other socioeconomic characteristics often influence how and where one shops. Residents who lack easy access to healthful foods require traveling to supermarkets outside their neighborhoods. The cost may not compensate for the marginal utility of healthful foods given the financial and physical constraints to mobility (LeDoux and Vojnovic Reference LeDoux and Vojnovic2013).
The criteria used to define access to healthful food, as well as the variables that predict it, have varied in the literature (Walker, Keane, and Burke Reference Walker, Keane and Burke2010, Alviola et al. Reference Alviola, Nayga, Thomsen and Wang2013; Thomsen et al. Reference Thomsen, Nayga, Alviola and Rouse2015). The term “food desert” was first used in the early 1990s in Scotland by a resident of a public housing sector scheme (Cummins and Macintyre Reference Cummins and Macintyre2002). Since that time, the phrase has taken on many different meanings. For example, in a study by Hendrickson, Smith, and Eikenberry (Reference Hendrickson, Smith and Eikenberry2006), food deserts were defined as “urban areas with 10 or fewer stores and no stores with more than 20 employees” (p. 372). Cummins and Macintyre (Reference Cummins and Macintyre2006) define food deserts as poor urban areas, where residents cannot buy affordable, healthful food. The research on food deserts ranges from the type and quality of foods to the type and size of grocery stores available to residents.
More recently, the term “food swamp” has entered the discussion in both research and policy realms. An area can be considered as a food swamp if healthful retailers are disproportionally outnumbered by less healthful ones. Several studies find that low-income neighborhoods fit the criteria to be called food swamps. Researchers find that these areas have significantly fewer grocery retailers and more fast-food restaurants (Morland, Diez Roux, and Wing Reference Morland, Diez Roux and Wing2006; Franco et al. Reference Franco, Diez Roux, Glass, Cabllero and Brancati2008). Using national data with machine learning, Amin, Badruddoza, and McCluskey (Reference Amin, Badruddoza and McCluskey2021) find that residents of food swamps—primarily black and Hispanic populations in densely populated areas—mostly rely on public transportation and do not own vehicles. They conclude that with greater poverty rates and an abundance of unhealthful options, low-income residents who live in food swamps are less likely to choose healthful foods.
Sociodemographic factors and healthful food access
Studies have shown that the built environment characterized by the socioeconomic factors, including the presence, quantity, and accessibility of healthful food retailers, contributes to healthful food consumption (e.g., Laraia et al. Reference Laraia, Siega-Riz, Kaufman and Jones2004; Fitzpatrick, Greenhalgh-Stanley, and Ver Ploeg Reference Fitzpatrick, Greenhalgh-Stanley and Ver Ploeg2015, Reference Fitzpatrick, Greenhalgh-Stanley and Ver Ploeg2019). Nelson et al. (Reference Nelson, Cunningham, Andersen, Harrison and Gelberg2001) find disparities in healthful food access across black and white neighborhoods. Public health experts claim that inner-city grocery retailers have a paucity of fresh and nutritious foods, in part because the neighborhoods are overpopulated with fast-food outlets (Hellmich Reference Hellmich2003).
Henderson (Reference Henderson2004) and Tardoff (Reference Tardoff2002) report that the food industry receives criticism for the inadequate distribution of healthful food choices that are accessible to impoverished populations. Still, other studies find no difference in the accessibility of grocery retailers in neighborhoods (e.g., Cummins and Macintyre Reference Cummins and Macintyre2006). This discrepancy could reflect either differences in the definition or size of grocery retailers or the true accessibility that may differ across locations. From a business perspective, lower purchasing power may be a reason for the relative scarcity of grocery retailers in underprivileged neighborhoods.
There have been debates about the relative importance of race/ethnicity and poverty in shaping an urban landscape. In particular, there is the premise that research does not measure the distribution of different races/ethnicities. The use of geographic information system (GIS) allows researchers to examine the distribution of race/ethnicities and the distance between certain outlets more precisely. Wilson's (Reference Wilson1978) seminal work focuses on urban transformation and urban poverty. In particular, he focuses on the geographic separation and the importance of resources, both social and economic.
According to Morland and Filomena (Reference Morland and Filomena2007), most low-income neighborhoods have significantly fewer grocery retailers and more fast-food restaurants than high-income neighborhoods. Duran et al. (Reference Duran, Diez Roux, do Rosario, Latorre and Jaime2013) investigate the socioeconomic characteristics of neighborhoods and found differences in the availability of healthy food stores and restaurants in low socioeconomic status and high socioeconomic status neighborhoods.
Location, data, and descriptive statistics
The setting for this study is in Seattle, WA, which is often characterized by extreme economic inequalities across neighborhoods (Drewnowski, Rehm, and Solet Reference Drewnowski, Rehm and Solet2007). In the State of Washington, there are 10 counties whose minority population exceeds 25 percent of their total population. Eight of these counties are located in Eastern Washington, where agriculture has a significant presence. The other two counties with greater than 25 percent minority populations are King and Pierce counties, where the large metropolitan areas of Seattle, WA, and Tacoma, WA, respectively, are located. Seattle, WA, has a distinct race/ethnicity contrast with the 68.7 percent of residents identifying as white in 2010. This percentage has fallen slightly to 67.3 percent in the 2019 census estimate, while the overall population in Seattle, WA, increased by 23 percent to over 750,000. Seattle, WA, also has the largest Asian, African American, and Hispanic populations of any city in the Pacific Northwest. The city has seen a major increase in immigration in recent decades. The foreign-born population has increased by 40 percent between the 1990 and the 2010 censuses.
In 2010, 9.5 percent of the total Seattle, WA population was African American. This has fallen to 6.8 percent in 2020, which is the lowest in 50 years. Balk (Reference Balk2020) argues that gentrification and skyrocketing costs of living in Seattle, WA, had implications for the drop in the percentage of African American residents. The Hispanic population represented 8.6 percent of the total population in 2010. They had been the most rapidly growing population group in Washington State, with an estimated increase of 71.2 percent between 2000 and 2010. However, the percentage of the population in Seattle, WA, who is Hispanic also fell in the 2019 census estimates to 6.7 percent. The Asian population represented 14.4 percent of the total Seattle, WA, population in 2010. This population experienced a 48.9 percent growth between the years 2000 and 2010. The Asian population in Seattle, WA, grew further to a 2019 estimate percentage of 15.4 percent. Note that these percentages do not include multiracial residents who constituted 6.9 percent in the 2019 census estimate.
We examine whether racial disparities exist in access to grocery stores in the Seattle, WA, metropolitan area in terms of travel distance and travel time. Since we are interested in the association between the access to grocery retailers and race/ethnicity, poverty, and other demographic factors, we combine sociodemographic data from the 2020 census tract level for Seattle, WA, to characterize the neighborhoods. Missing values of some variables were filled using the 2019 American Community Survey under the assumption that the sociodemographic characteristics of a census tract do not change drastically in a year.
The database includes a large number of variables that are relevant for understanding socioeconomic factors for race/ethnicity comparisons. It is impossible to accurately analyze the role of race without regarding poverty or analyze poverty without considering the role of race. It would depict an inaccurate measurement of socioeconomic status factors in determining the spatial accessibility of grocery retailers. This is particularly important given the history of racial segregation and economic restructuring in low-income neighborhoods in Seattle, WA. For example, Figure 1 depicts how the median household income has a negative association with the percentage of minority populations in Seattle, WA. Figure 2 shows how the SNAP-recipient households have a positive correlation with the percentage of minority residents. Therefore, we include both racial and income-related variables in the analysis. Consistent with the literature, we parsimoniously choose racial composition, vehicle access, education, income, employment, property values, and population density (e.g., Amin, Badruddoza, and McCluskey Reference Amin, Badruddoza and McCluskey2021).
Median Household Income and Racial Composition of Census Tracts in Seattle. Source: Authors’ Calculation Using the U.S. Census 2020 and American Community Survey 2019 Data.

SNAP-Recipient Population and Racial Composition of Census Tracts in Seattle. Source: Authors’ Calculation Using the U.S. Census 2020 and American Community Survey 2019 Data.

The response variables: (1) road distance to the nearest grocery store (in meters) and (2) driving time to the nearest grocery store (in seconds) from the center of the census tract were calculated by the authors. Grocery retailers are defined as supercenters (e.g., Sam's Club, Walmart, and Costco) and full-line grocery retailers (e.g., Albertson's, Fred Meyer, Safeway, QFC, Trader Joe's, Whole Foods, and others) associated with a national or regional grocery chain or an independent full-service grocery store. To identify grocery retailers, we utilize the Reference USA 2010 database of grocery stores in Washington State. In addition, we utilize GIS data from the City of Seattle government website, as well as the Google online directory search, to verify the addresses of these grocery retailers and to identify additional grocery retailers. Figure 3 provides a detailed map for Seattle grocery stores and tract centroids.
Seattle Full-Service Grocery Stores and Tract Centroids Used in the Data.
Source: Authors’ Calculation Using the ArcGIS Software.

We confirmed the addresses of additional grocery retailers not included in the Reference USA database or the food facilities database of the GIS department of the Seattle government. There are 112 full-service grocery retailers included in the Seattle metropolitan area within a 15-mile buffer of King County. The additional 15-mile buffer helped to ensure that grocery retailers for the sample neighborhoods are included. We linked the locations of all of the grocery retailers to the 2020 U.S. Census tract file for the Seattle metropolitan area based on location points.
The descriptive statistics for all variables are presented in Table 1. The mean travel distance to the nearest supermarket is about 1,060 m (with a mean of 1,277 m and a range of 32.33–3,668 m), and the median driving time is about 80 s (with a mean of 95 s and a range of 2.9–823 s, i.e., 13.7 min). The mean of the population within the census tracts is white with 61.16 percent, followed by Asian (17.26 percent), Hispanic (8.24 percent), black (6.89 percent), and others. The median household income is about $94,045, with a standard deviation of $33,803. The population density is calculated as the total population per square mile. The mean population density in the census tracts is 1,616 people per square mile, with a standard deviation of 1,550. The mean unemployment rate was 4 percent and, on average, about 5.5 percent people in a census tract received SNAP benefits. Median house values are about $675,000.
Descriptive statistics

Source: American Community Survey 2019 and U.S. Census 2020 for demographic data. Travel time and distance were calculated by authors using ArcGIS software.
Figure 4 provides simple nonparametric representation of the association between access to the nearest grocery retailer and tract characteristics. The distance is measured by the travel distance in meters. We use a log transformation of the income variable to remove the effects of extreme observations. Tracts with greater income and SNAP recipients, respectively, show positive and negative relationships with the travel distance to the nearest full-service grocery store. The white population shows almost zero correlation with the distance, whereas the Asian population, no-vehicle households, and the education variable show a negative correlation. The figure also implies that tracts with other minorities, especially Hispanics and African Americans, have a greater travel distance to grocery stores than other tracts. However, we want to check if the mean distance to grocery stores varies by the presence of minorities, holding other variables constant. The following section discusses econometric techniques required to further understand how healthful food access differs across neighborhoods.
The Relationship Between Distance to the Nearest Grocery Measured by Road Length (Meters) and Tract Characteristics in Seattle. Note: Figures Show Scatterplots of the Raw Data and Linear Fit with 95 Percent Confidence Interval.

Econometric methods
Amin, Badruddoza, and McCluskey (Reference Amin, Badruddoza and McCluskey2021) discuss two common measures of food access in the literature: (1) distance-based measure that uses the distance from household or tract location to the healthful food retailers and (2) density-based measure that uses the percentage of healthful food retailers in an area. The former primarily is used to define food deserts and is common in small-scale localized studies because measuring the distance at a large scale has an additional cost. The latter is used by several studies, including Amin, Badruddoza, and McCluskey (Reference Amin, Badruddoza and McCluskey2021), to measure food access at the national level. The distance can be used as a proxy for access, but it is only one factor. Access to healthful food retailers depends on many additional factors, including income, vehicle access, ease of use of public transportation, density of traffic, travel time, and travel route. Consumers’ distance to a large grocery store is often used as a proxy for better access to a good selection of high-quality, lower-cost healthy foods. Drewnowski et al. (Reference Drewnowski, Aggarwal, Hurvitz, Monsivais and Moudon2012), for example, found that the distance to the nearest grocery store is a good predictor of healthier eating and lower risk of obesity and chronic disease. Much of the literature uses some form of distance, and it is one objective measure for which data are available.
Direct measurement and comparison of the availability of items in grocery retailers could have generated the best possible dataset. However, such a survey would have been prohibitively expensive. The time needed to travel from one's residence to the grocery store is another informative indicator of accessibility in addition to physical distance. Given that a significant proportion of the population living in poverty is concentrated in the more densely populated central district of Seattle, WA, travel times to grocery retailers are likely longer for those living in poverty, and the implication is that the findings of differences in accessibility by race/ethnicity and proportion of the population living in poverty are progressing. Understanding the complexity of the issue, we choose both distance-based and time-based measures as factors that represent access to grocery retailers. The distance of residents to grocery retailers was measured using (1) the length of the road grocers need to travel to go to the nearest grocery retailer and (2) the time required to travel to go to the nearest grocery retailers. We also control for access to a private vehicle.
Apparicio, Cloutier, and Shearmur (Reference Apparicio, Cloutier and Shearmur2007) show geographic accessibility of residential areas to selected healthcare services using different distance types. The centroids (geometric centers) of those neighborhoods served as proxies of the locations. Therefore, the grocery retailer's accessibility is represented by the distance to the nearest supermarket for a resident positioned in the middle of the neighborhood (census tract). To develop an understanding of access to healthful foods, we follow Zenk et al.'s (Reference Zenk, Schulz, Israel, James, Bao and Wilson2005) methods with some deviation and with a focus on racial composition. The objective is to assess whether the percentage of different races/ethnicities in the neighborhoods of Seattle, WA, affects the location of grocery stores. As a proxy for poverty, we use SNAP-recipient status. There are two standard hypotheses for the models in this study.
Hypothesis 1: Ethnic composition
H10 : The race/ethnicity composition of neighborhoods is associated with the location of healthful food outlets.
H1A : The race/ethnicity composition of neighborhoods is not associated with the location of healthful food outlets.
Hypothesis 2: SNAP recipients
H20 : The percentage of SNAP recipients in a neighborhood is associated with the location of healthful food outlets.
H2A : The percentage of SNAP recipients in a neighborhood is not associated with the location of healthful food outlets.
We begin with a simple linear equation:

where d i is the distance to the nearest grocery retailer from the census tract centroid—measured by road length and travel time, x ip is a socioeconomic factor associated with the distance, α is the intercept, β ip is the parameter of interest, and ε i represents the error term. We take the log of the response variables for two reasons. First, to lessen the effects of extreme observations. The variables are not normally distributed; the Shapiro–Wilk W statistic is rejected at the 1 percent level for road length and travel time. Second, the above association may not be linear. We use a left-hand Box–Cox specification to find the appropriate functional form. That is, we use a maximum likelihood (ML) approach and iteratively solve for the power of d i . The estimated powers approach zero for both road length and travel time, and we reject the null hypothesis of the power being −1 or 1 at the 1 percent level of significance. Hence, we choose a log-linear specification for the model above.
Another concern of estimation is spatial autocorrelation. The spatial data are frequently characterized by positive spatial autocorrelation or the tendency for neighborhoods that are near each other in space to share similar attributes. Ignoring spatial interlinkages may lead to an overestimation of the true disparities. Following Wang et al. (Reference Wang, Tao, Qiu and Lu2016), we apply an SAR model defined as

where the term w ij is an element of the spatial neighborhood matrix that takes 1 for neighboring census tracts and zero otherwise, and the parameter λ represents the spatial influence of neighboring access on the access of the ith track. The SAR model extends linear regression by allowing outcomes in one area to be affected by outcomes in nearby areas or errors from nearby areas. However, the SAR model is more appropriate for the current exercise because the spatial-error model only allows for spatial dependence among unobserved disturbances and ignores spatial spillover effects.
Applying simple ordinary least squares (OLS) on the model above would yield inconsistent estimates and biased coefficients for λ. There are two ways to estimate the SAR model: a ML estimator as proposed by Anselin (Reference Anselin1988) and the generalized method of moments instrumental variables (GS2SLS) (Kelejian and Prucha Reference Kelejian and Prucha1998). Discussing the econometric derivation of these models is beyond the scope of the article, so we refer interested readers to Gibbons and Overman (Reference Gibbons and Overman2012). We present the results from both methods for completeness.
Results
Table 2 presents results for the relationship between the travel distance to the nearest grocery retailer measured by road length and demographic features, including the racial composition. The first three columns (1–3) report estimation results from OLS, ML spatial, and GS2SLS spatial models. The remaining columns (4–6) repeat the exercise with terms that interact with income and race. Adding interaction terms provides a more nuanced representation of the effects by the socioeconomic status of minority population. However, it increases the collinearity among predictors—the variance inflation factor (VIF) becomes 1,492 from 4.80. Therefore, we report both sets of results for a better comprehension. All models show robust standard errors because we reject the null of homoskedasticity at the 1 percent level of significance.
Regression results (distance measured by road length)

Note: Robust standard errors in parentheses.
***p<0.01, **p<0.05, *p<0.1.
ML = maximum likelihood; GS2SLS = generalized spatial two-stage least squares.
To avoid strong collinearity among predictors, the white population variable is omitted. The highest VIF is 4.80 when the percent of the white population is not included in the estimation, whereas the VIF becomes 275.69 when the percent of the white population is included. Since other racial groups are very small in many tracts, excluding the white population variable allows room for data variation, and the intercept acts as a benchmark of comparison.
The results in columns 2, 3, 5, and 6 of Table 2 are produced with a spatial weighting matrix to account for the spatial spillover effects across census tracts. The association between grocery access and racial composition remains similar after spatial autocorrelations are considered. ML and GS2SLS control for both heteroskedasticity and spatial autocorrelation but produce similar results, which indicates that our findings are robust.
The results in Table 2 provide evidence that the nonwhite population is not homogenously distributed around grocery retailers. The black population variable does not show a statistically significant association with distance. However, a greater percentage of the Hispanic population in a census tract is associated with greater travel distances to full-service grocery stores (Table 2), and the magnitude of the effect increases with more robust models with spatial controls. An increase in the percentage of the Asian population in a tract is associated with lesser travel distances to full-service stores. This association is insignificant in columns 1–3, but it becomes significant as we account for income by race.
Census tracts with higher household incomes are located farther from grocery retailers, but the effect becomes statistically insignificant in the model as we account for the interactions of income and race/ethnicity. Interacting income with racial distribution reveals some interesting patterns. For example, census tracts with greater Hispanic populations tend to be farther from grocery retailers, but an increase in their income is associated with the shorter distance. On the other hand, an increase in the income of tracts with a greater Asian population is associated with the longer distance to the grocery retailers. The effects of income turn out to be insignificant for the African American population.
Among other variables, a percent increase in SNAP recipients relates to a 0.036 percent greater distance. Census tracts with more graduates have the nearest grocery stores 0.007 percent closer. However, the distance to grocery retailers does not change across SNAP-recipient status in the dataset. A greater population density is associated with shorter distances to grocery retailers. The income and SNAP variables become statistically insignificant, but the economic and statistical significance of race variables increases in the full model. These associations hold after controlling for vehicle ownership, education, population density, and property values. Cultural differences can be a contributing factor here. Hispanic diets often include more fruits and vegetables compared with that of other races (e.g., Di Noia et al. Reference Di Noia, Monica, Cullen, Perez-Escamilla, Gray and Sikorskii2016), which may create a greater incentive to establish a grocery with a greater provision of fruits and vegetables in high-income Hispanic-dominating tracts. Therefore, we find evidence that the location preference regarding grocery retailers varies across racial groups and is sensitive to the level of income within the group.
In order to compare the coefficient estimates across racial groups, we conduct χ2 tests using the full model (Table 2, column 3). The coefficients for the black and Hispanic populations are statistically different:
${\rm \chi }_1^2 = 4.90$
 with p-value = 0.02. The travel distance to grocery retailers is also different across Hispanic and Asian:
${\rm \chi }_1^2 = 6.79$
with p-value = 0.02. The travel distance to grocery retailers is also different across Hispanic and Asian:
${\rm \chi }_1^2 = 6.79$
 , p-value < 0.01. However, we fail to reject the null that the coefficients are different for black and Asian populations (
${\rm \chi }_1^2 = 0.14$
, p-value < 0.01. However, we fail to reject the null that the coefficients are different for black and Asian populations (
${\rm \chi }_1^2 = 0.14$
 , p-value = 0.71).
Table 3 shows regression results with the response variable changed to driving time. Most results are consistent with those from the previous specification. A greater percentage of the Asian population is negatively related to driving time to the nearest grocery retailer, whereas the Hispanic population variable is positively related. Once again, we do not find evidence that the driving time to the nearest grocery store correlates with the percentage of the African American population in a census tract.
Regression results (distance measured by the driving time)

Note: Standard errors in parentheses.
***p<0.01, **p<0.05, *p<0.1.
ML = maximum likelihood; GS2SLS = generalized spatial two-stage least squares.
Another noticeable similarity is that the median income and SNAP-recipient variables do not remain statistically significant when income is interacted with race variables, implying that wealthier tracts have longer driving times, but it is primarily influenced by the low-income Hispanic population with longer driving times or the low-income Asian population with shorter driving times. The latter affects the income variable more than the former, creating a net positive effect of income on the distance. Another possible implication is that tracts with greater white or black populations may locate in areas of Seattle, WA, where the road length to a grocery store may vary, but that does not significantly decrease the driving time to the store. The results for all other predictors and interaction terms are consistent with earlier findings. Thus, our results are fairly robust across model specifications and econometric methods.
We use the model to predict the distance to the nearest grocery retailers under various racial compositions of a census tract. Figures 5 and 6 present linear fits for different predicted scenarios, respectively, for road length and driving time. Note that we use the variable ranges seen in the data and do not use the model to forecast cases outside of our data (e.g., the Hispanic population does not exceed 40 percent in a tract). Our predictions indicate that greater Hispanic (and to some extent black) populations in a census tract are associated with a longer distance to the grocery. The variation on the vertical axis shrinks as we move from Figure 5 to Figure 6. The driving time is similar regardless of the road length, and it is particularly true for tracts with a more white population. Apart from the census tracts where the white population is below approximately 40 percent, the predicted values of driving time to the nearest grocery do not change much with the level of white population in the tract.
Predicted Distance to Grocery Stores (Log Road Length in Meters) by the Racial Composition of a Tract.

Predicted Distance to Grocery Stores (Log Driving Time in Seconds) by the Racial Composition of a Tract.

The opposite is true for minorities, e.g., census tracts with a greater Asian and Hispanic population show greater variation in driving distance and time. We note that many of the patterns in the results could be consistent with a story that higher percent white neighborhoods are in the suburbs where wealthy white residents have access to vehicles. It is much easier for them to reach a grocery store that is five miles away than it is for an inner-city nonwhite resident to reach a grocery store only one mile away. For the Hispanic population, the predicted distance rises, perhaps because many tracts with Hispanic populations are agricultural lands where the presence of grocery retailers is low (e.g., UW Climate Impacts Group et al. 2018).
Thus, we cannot reject hypothesis H10 that the race/ethnicity composition of neighborhoods is associated with the location of healthful food outlets in Seattle, WA. Disparities in travel distances and travel times to supermarkets across racial compositions of neighborhoods vary, given the racial/ethnicity and proportion of the population living in poverty for metropolitan Seattle, WA. However, disparities in grocery retailer accessibility on the basis of race/ethnicity are evident with the percent of Asian or black population being closer to stores than the Hispanic population. Our results suggest that distance to the nearest grocery retailer may vary across minorities as well, and Hispanic populations face a greater distance to the nearest grocery store more than other minority groups in metropolitan Seattle, WA.
Moreover, greater household incomes have a heterogeneous relationship with the distance across racial groups. The Hispanic population with a greater income would locate closer to groceries, whereas the Asian population may move away from groceries. Intuitively, a greater income may incentivize the Hispanic population to move closer to the city center or grocery retailers to establish a store because of the higher demand for fruits and vegetables in the Hispanic culture, but the same may encourage the Asian population to move to suburbs from inner cities. Similar effects of income on predicting the distance for black populations were not found.
There may be several reasons that underlie these findings. It is possible that Asian populations may live in congested urban commercial areas of Seattle. Amin, Badruddoza, and McCluskey (Reference Amin, Badruddoza and McCluskey2021) found that densely populated commercial areas often have more than proportional minority populations. These areas are often “food swamps,” which means that healthful retailers are disproportionally outnumbered by less healthful ones such as fast-food restaurants (Cooksey-Stowers, Schwartz, and Brownell Reference Cooksey-Stowers, Schwartz and Brownell2017).
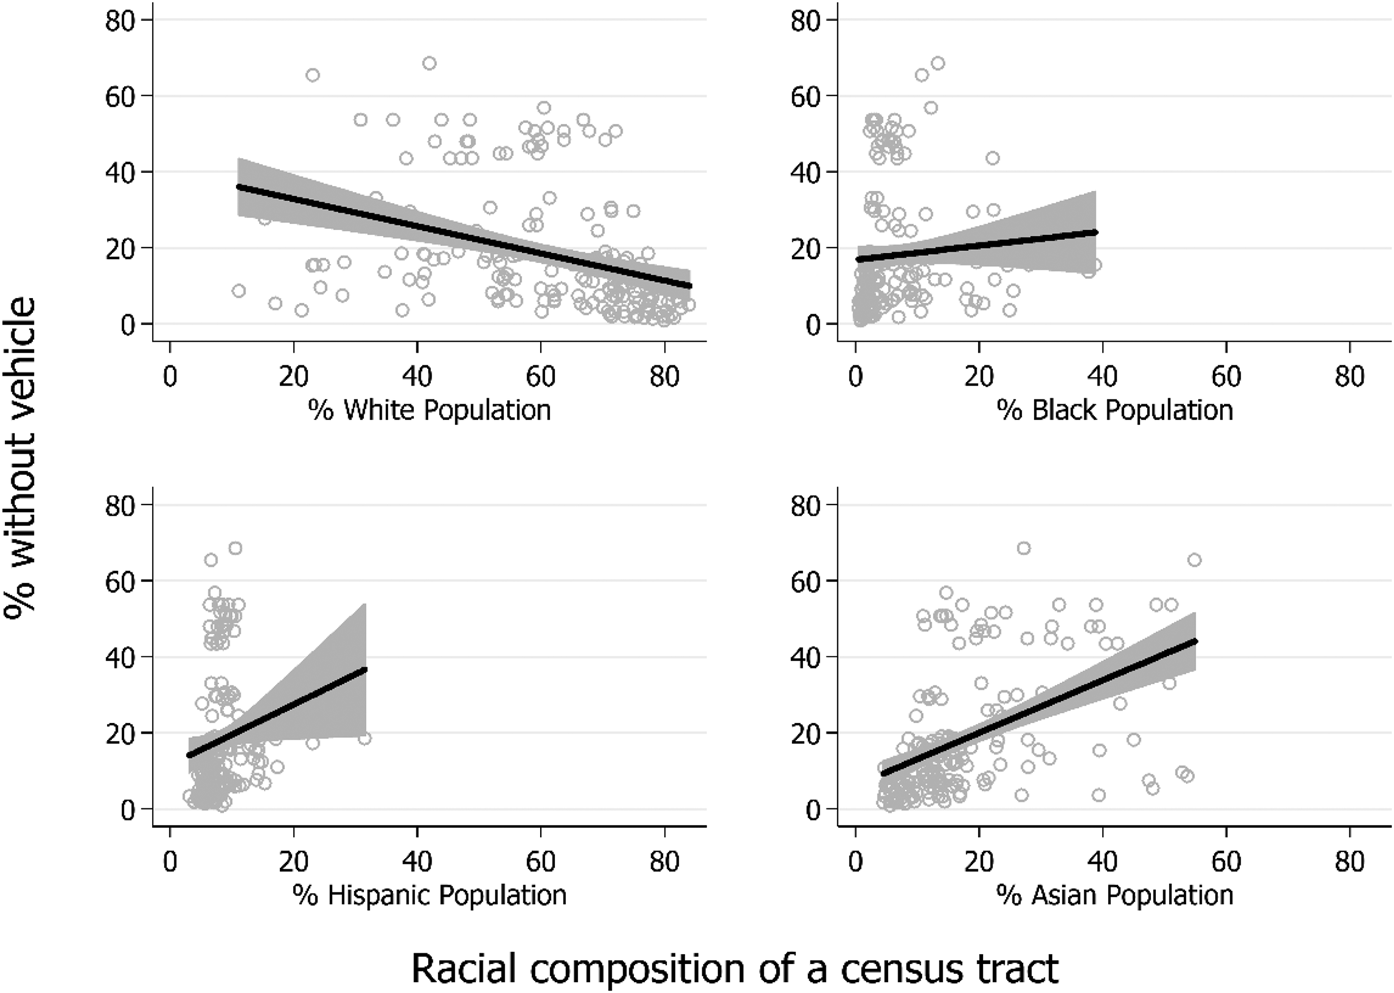
Ceteris paribus, census tracts with a greater income are located further from grocery stores. However, we cannot reject hypothesis H20 that the percentage of SNAP recipients in a neighborhood is associated with the location of health food outlets. The percentage of SNAP recipients is statistically significant in estimating the travel distance to the nearest grocery store if we do not include the interaction of income with racial groups. Other relevant variables, including the unemployment rate and vehicle access, are not statistically significant in our estimations. This means people who lack vehicle access choose to either live in locations that are close to grocery stores or live in downtown-like places where public transportation is available, and they do not need to own a vehicle. On the other hand, populations who live farther away from the commercial areas may use public transportation to go grocery shopping. Figure 7 shows that tracts with a greater share of minorities are also less likely to have vehicle access, whereas tracts with a predominantly white population have fewer households lacking vehicle access.
Lack of Vehicle Access by the Racial Composition of a Census Tract.

Population density has a negative and statistically significant effect on distance and travel time to the nearest grocery store. One could make an argument for either positive or negative impacts of population density. On the positive side, as population is denser, there is less land to locate a large store. On the negative side, as the population is denser, there are more potential customers who will buy food. Our evidence supports the latter for Seattle, WA, in all models and specifications.
Limitations and future directions
There are several limitations to the study. For instance, we do not consider social barriers (such as crime) or other nonspatial factors (e.g., operating hours) that affect accessibility, nor do we consider individual access to grocery retailers, which will show a discrepancy by residents’ locations within neighborhoods and by individual opportunity costs such as time, access to a car, income, and physical functioning. Behavior and choices cannot be homogeneous for race/ethnicity or for the proportion of the population living in poverty. Future studies should include cultural differences in diet, and preferences for food in stores to properly measure the difference between Hispanic and Asian populations’ access to supermarkets.
The cross-sectional nature of the study precludes the definitive establishment of causal ordering among neighborhood race/ethnicity, the proportion of the population living in poverty, and grocery retailer accessibility. Some of the grocery retailers were built in the past 10 years, but many were built much longer ago. The characteristics of neighborhoods today and especially historically have shaped the accessibility of grocery retailers across metropolitan Seattle, WA. Establishing detailed longitudinal analyses, similar to Drewnowski et al. (Reference Drewnowski, Aggarwal, Hurvitz, Monsivais and Moudon2012), would help to clarify the dynamic relationships between race/ethnicity and the proportion of the population living in poverty, and supermarket accessibility, while gaining insights into the subcategories of the different races. Since 2010, five of the current chain grocery retailers in the City of Seattle have opened, and only three local supermarkets had closed temporarily due to renovation and expanding their business.
An additional consideration is the proliferation of fast-food restaurants in a neighborhood, which is not considered in this analysis. Fast-food restaurants are often marketed with “value menus” that offer inexpensive but high-calorie food items. Residents in neighborhoods with many fast-food restaurants, food swamps, may choose this option more often. In fact, Cooksey-Stowers, Schwartz, and Brownell (Reference Cooksey-Stowers, Schwartz and Brownell2017) find evidence that food swamps are a distinct and separate phenomenon to food deserts as they predict adult obesity rates better than food deserts in the United States.
Conclusions
With more than 50 percent of the U.S. population living in urban areas, it is often challenging for grocery retailers to reach their customers. Poor accessibility to grocery retailers may contribute to less nutritious diets and hence to a greater risk for chronic, diet-related diseases (e.g., heart disease, obesity). Drewnowski et al. (Reference Drewnowski, Aggarwal, Hurvitz, Monsivais and Moudon2012) find that Seattle, WA, residents reported that a lack of access to grocery retailers is a barrier to healthful eating. Examining chain grocery stores, Drewnowski, Rehm, and Solet (Reference Drewnowski, Rehm and Solet2007) find that closer proximity to grocery retailers is associated with better-quality diets. We find that the nearest grocery retailer is farther away for residents in census tracts with more Hispanic households but closer for tracts with more Asian households. We also find that the income variable across racial groups is heterogeneously related to the distance and that a greater income may not necessarily relate to a shorter distance for all racial groups. For example, our nonparametric analysis suggests that there is a strong negative association between income and the Hispanic population, yet census tracts with a greater Hispanic population are farther away from the grocery retailers in Seattle—which is also true for higher-income tracts. However, an increase in income for tracts with more Hispanics relates to a shorter distance. Thus, the distance may be heavily influenced by taste and preferences such as dietary habits. We understand that distance does not equal access.
Using the breakdown of racial/ethnic groups offers us better insights to understand food access in the City of Seattle, WA. We show that the median incomes of census tracts that are far from groceries are slightly higher. Although our regression results robustly suggest that the tracts with higher Asian populations are closer to grocery retailers, nonparametric results indicate that greater Asian populations are associated with low-income and low vehicle access. It is possible that greater numbers of the Asian population live closer to grocery stores because they cannot afford the commute. We found evidence that the Asian population with a higher income would locate away from grocery stores, but it is uncertain that an increase in income would reduce the travel time or distance for the African American population. It is worth pointing out that one's location relative to a grocery store may not be the primary determinant of where people choose to live. Other factors such as proximity to one's work, high-quality schools, and rent/property values certainly affect the decision of where to live. Finally, the travel distance and travel time to food retailers is not only heterogeneous across minority groups, but different groups also deal with the lack of access differently. Hence, the composition of racial variables matters for policy insights.
Acknowledgements
The authors wish to thank without implicating Ron Mittelhammer, Vicki McCracken, and Jeremy Sage for helpful comments.
Funding statement
This work was supported by USDA-NIFA Hatch funds.
Conflicts of interest
None declared.
Data availability statement
Replication materials are available by request to the authors.


 Open access