


Impact Statement
Sheet/cloud cavitation exhibits strong instabilities that can cause severe problems such as vibration, noise, erosion and even structural failure. This phenomenon is often unavoidable, and has become a great issue for many applications, such as fluid machineries (i.e. hydrofoils, pipes, pumps and turbines), and marine and rocket propulsion devices (i.e. turbomachinery, naval propellers and inducers). Most of these problems are owing to the unsteady characteristic and stochastic nature of sheet/cloud cavitating flows, especially in the process of cavity shedding. Therefore, it is of great significance to study the shedding mechanism associated with sheet/cloud cavitating flows. This paper helps to improve our understanding of cavitating flow-induced pressure fluctuations, and further investigates the re-entrant jet instability and shockwave shedding mechanism. It can improve our understanding and the development of high-performance marine propulsion systems and effective control strategies.
1. Introduction
Hydrodynamic cavitation is commonly encountered on lifting surfaces, the blades of marine propellers and pumps and the inducers of cryogenic rocket motors, particularly with the rapid upgrading of the size and speed of ships and underwater vehicles in recent years (Reference BrennenBrennen, 1995; Reference Franc and MichelFranc & Michel, 2005; Reference Wang, Senocak, Shyy, Ikohagi and CaoWang, Senocak, Shyy, Ikohagi, & Cao, 2001). Occurrence of unsteady cavitation could lead to undesirable phenomena such as increased noise and vibration, pressure fluctuations, power loss and material erosion. Pressure fluctuations generated by transient cavity behaviours (i.e. cavity formation, detachment, condensation or collapse), one of the undesirable effects of cavitation, are the major source of cavitation instabilities in turbulent cavitating flows, and play a crucial role in the accurate prediction of cavitation damage in practical applications. However, the dynamics and mechanisms of fluctuating pressure fields in cavitating flows have not been yet fully understood due to the complex phenomena involved, especially in the cloud cavitation regime, such as cavity interfacial instabilities, cavitation/turbulence interaction, re-entrant jet (RJ) dynamics and shockwave (SW) dynamics. Furthermore, the pressure distribution is the critical parameter to determine the phase change rate for the cavity evolution process and pressure fluctuations are important to a deep understanding of the inception and subsequent development of cavitation (Reference Gopalan and KatzGopalan & Katz, 2000; Reference Gopalan, Katz and KnioGopalan, Katz, & Knio, 1999). As a consequence, it is required to conduct intensive and extensive investigations to elucidate the physics and mechanisms in cavitating flows and their induced pressure fluctuations to improve our understanding of the flow structures of the cavitation turbulence or to provide the data needed in the solution of practical engineering applications (Reference JosephJoseph, 1995; Reference Schnerr, Sezal and SchmidtSchnerr, Sezal, & Schmidt, 2008).
Extensive research on cavitation, especially partial cavitation which is unsteady by nature and exhibits serious instabilities, has been conducted to understand the general characteristics and dynamics of cavities (cavity evolution, cavity structures), and the underlying physics under different cavity regimes and their transition (Reference Brunhart, Soteriou, Gavaises, Karathanassis, Koukouvinis, Jahangir and PoelmaBrunhart et al., 2020; Reference Kjeldsen and ArndtKjeldsen & Arndt, 2001; Reference Li, Wang, Zhang and ShyyLi, Wang, Zhang, & Shyy, 2008). At the early phase of cavity formation and development, i.e. inception cavitation, cavity usually initiates at the low-pressure vortex cores and cavity structure evolution is closely associated with the local vortex structures in pure liquid flows (Reference Ran and KatzRan & Katz, 1991, Reference Ran and Katz1994). Cavity closure does not vary very much and transient cavity structures are often stated to be steady and stable. As the cavity grows, the cavity closure varies a lot accompanied by intermittent or periodic shedding of cavity structures, i.e. sheet/cloud cavitation, leading to strong unsteadiness effects (Reference Brandner, Walker, Niekamp and AndersonBrandner, Walker, Niekamp, & Anderson, 2010; Reference Kawanami, Kato, Yamaguchi, Tanimura and TagayaKawanami, Kato, Yamaguchi, Tanimura, & Tagaya, 1997; Reference Trummler, Schmidt and AdamsTrummler, Schmidt, & Adams, 2020), which has attracted a lot of interest.
With advances in both computational and experimental capabilities, most recent investigations have been utilized to enhance our understanding of the physics in cloud cavitating flows, especially in the process of cavity breakup and shedding in sheet/cloud cavitation regimes. Two typical instabilities, i.e. re-entrant jet (Reference Callenaere, Franc, Michel and RiondetCallenaere, Franc, Michel, & Riondet, 2001) and bubbly shockwave dynamics (Reference Ganesh, Mäkiharju and CeccioGanesh, Mäkiharju, & Ceccio, 2016), are supposed to be the main causes of the onset of cloud cavitation. These phenomena are widely observed at low cavitation numbers around foils (Reference Arndt, Song, Kjeldsen, He and KellerArndt, Song, Kjeldsen, He, & Keller, 2001; Reference Leroux, Coutier-Delgosha and AstolfiLeroux, Coutier-Delgosha, & Astolfi, 2005; Reference Wu, Ganesh and CeccioWu, Ganesh, & Ceccio, 2019), spheres (Reference de Graaf, Brandner and Pearcede Graaf, Brandner, & Pearce, 2017), venturis (Reference HogendoornHogendoorn, 2017), underwater vehicles (Reference Wang, Ye, Wang and HuangWang, Ye, Wang, & Huang, 2018) and so on. For example, Reference Stutz and ReboudStutz & Reboud (1997a, Reference Stutz and Rebound1997b) and Reference Coutier-Delgosha, Stutz, Vabre and LegoupilCoutier-Delgosha, Stutz, Vabre, & Legoupil, (2007) provided detailed investigations of internal flows of sheet/cloud cavitation, indicating the existence of re-entrant flow. The re-entrant flow (i.e. approximately 15 % ~35 % the cavity thickness, and approximately half the mean flow velocity Reference Callenaere, Franc, Michel and RiondetCallenaere et al., 2001) which is generated at the cavity closure when the cavity grows approximately to its maximum length, is mainly composed of liquid and flows upstream along the wall beneath the cavity to the front part of the cavity, resulting in cavity leading edge breakup, known as the re-entrant jet dominant shedding mechanism (Reference Callenaere, Franc, Michel and RiondetCallenaere et al., 2001).
On the other hand, the acoustics in gas–liquid mixtures is significantly changed and the sonic speed will drop abruptly, increasing the compressibility effects in cavitation regions, as has been studied both theoretically (Reference BrennenBrennen, 1995; Reference KarplusKarplus, 1957) and experimentally (Reference Gouse and BrownGouse & Brown, 1964; Reference Shamsborhan, Coutier, Caignaert and Abdel NourShamsborhan, Coutier, Caignaert, & Abdel Nour, 2010). Consequently, the cavitation mixtures are highly compressible and susceptible to the generation of shockwaves when the Mach number of the cavitating flow exceeds the required conditions. Reference Arndt, Song, Kjeldsen, He and KellerArndt et al. (2001) first observed the shockwave dynamics in the cavity breakup and shedding process around a foil using a combined experimental and simulation method, and proposed the normalized parameter σ/2α < 4 (here  $\sigma$ is the cavitation number and the $\sigma$ the attack of angle) as the required condition for the shockwave shedding mechanism. Reference Leroux, Astolfi and BillardLeroux, Astolfi, and Billard (2004) used high-speed imaging and dynamic pressure measurement to investigate the cavitation instabilities around a NACA66 (mod) hydrofoil, and found that the generation and propagation of the shockwave will significantly alter the cavity evolution cycle and induce strong pressure fluctuations. Reference Ganesh, Mäkiharju and CeccioGanesh et al. (2016) employed time-resolved X-ray densitometry techniques and visualized the shockwave propagation process inside the cavity and attributed its role in the cavity shedding process over a wedge model. Their study showed that the shockwave propagation will cause local cavity collapse, reducing the cavity void fraction, and that when it propagates to the cavity leading edge, results in cavity breakup and then cloud formation and shedding. This mechanism is different from the classical re-entrant jet mechanism and is known as the shockwave mechanism. There are also other mechanisms that have been described to hinder the shedding dynamics of cloud cavitation such as Kelvin–Helmholtz instabilities (the Kelvin--Helmholtz mechanism) (Reference Brandner, Walker, Niekamp and AndersonBrandner et al., 2010; Reference Podbevšek, Petkovšek, Ohl and DularPodbevšek, Petkovšek, Ohl, & Dular, 2021), but they usually tend to be in small-scale flows, and accompanied by the presence of a re-entrant jet and shockwave (Reference Larrarte, Pauchet, Bousquet and FrumanLarrarte et al., 1995; Reference Pham, Larrarte and FrumanPham, Larrarte, & Fruman, 1999).
The data-driven methods of modal decomposition approaches called proper orthogonal decomposition (POD) and dynamic mode decomposition (DMD) are becoming more and more popular recently to provide physical insights into the cavitation instabilities (Reference Gupta and JaimanGupta & Jaiman, 2022; Reference Liu, Long, Wu, Huang and WangLiu, Long, Wu, Huang, & Wang, 2021) instead of observing the evolution of cavity on acquired high-speed images, to explore these abundant spatial-temporal features of coherent structures and the associated dynamics in cavitation flows, especially in the sheet/cloud cavitation regime. For example, Reference Prothin, Billard and DjeridiProthin, Billard, and Djeridi (2016) experimentally investigated the sheet/cloud cavitation instabilities around a NACA0015 foil at high Reynolds number using POD and DMD, and pointed out the occurrence of three-dimensional (3-D) effects due to the re-entrant jet instabilities or due to the propagating shockwave mechanism at the origin of the shedding process of the cavitation cloud. Using the same NACA series foil, Reference Barwey, Ganesh, Hassanaly, Raman and CeccioBarwey, Ganesh, Hassanaly, Raman, and Ceccio (2020) studied the partial cavity shedding dynamics using three data-driven decomposition techniques (POD, DMD and cluster-based reduced-order modelling) based on time-resolved X-ray densitometry void fraction measurements, and observed a shared harmonic between the different physical cavitation modes, providing further insight into the cavity regime transition process. Reference Zhang, Liu and WangZhang, Liu, and Wang (2021) investigated in detail the shedding mechanisms around a NACA0012 foil using a developed frequency-weighted DMD, and revealed the high-frequency and small-scale shedding structures in the process of transient sheet/cloud cavitating flows. Reference Gouin, Junqueira-Junior, Da Silva and RobinetGouin, Junqueira-Junior, Da Silva, and Robinet (2021) conducted numerical investigations of 3-D partial cavitation and the associated dynamics in a venturi geometry via spectral POD. Their study showed detailed flow structures associated with the cavitation pocket and re-entrant jet shapes and 3-D effects on the cavity dynamics caused by the sidewall were examined as well.
In this study, an experimental study was conducted to investigate the cavity structures and dynamics of cavitating flows in a convergent–divergent wedge model for a wide range of cavitation numbers at a fixed Reynolds number of Re = 7.8 × 10⁵. A synchronized technique combining the unsteady pressure fluctuation signal measurement and high-speed imaging was used, and the multi-scale proper orthogonal decomposition (mPOD) (Reference Mendez, Balabane and BuchlinMendez, Balabane, & Buchlin, 2019) was employed to examine in detail the cavity dynamics associated with the cloud shedding mechanism. The present paper is structured as follows: § 2 presents the details about the experimental set-up, flow conditions, measurement techniques and analysis approach. Section 3.1 reports the results of the observations of different cavity regimes and wall-pressure fluctuations. Section 3.2 presents the spectral contents and statistics of pressure fluctuations and cavity structures. Section 3.3 reports the data-driven analysis of cavity structures associated with the re-entrant jet shedding mechanism and shockwave shedding mechanism via mPOD. Section 4 provides the discussion and concluding remarks on the results.
2. Experimental set-up
The experiments are conducted in the closed-loop recirculating cavitation water tunnel at the Beijing Institute of Technology, which is shown in figure 1. The tunnel has a rectangular test section 700 mm in length, 70 mm in width and 190 mm in height. Transparent windows are installed at the top, bottom and front sides, which are made of Perspex for observations and optical-based measurements. An axial pump, which is used to drive the flow into the water tunnel, is located approximately 5 m below the test section, reducing the likelihood of pump cavitation. A tank with a volume of 5 m3 is placed upstream of the test section to separate the undesired free-stream bubbles in the flow and facilitate nucleus control. The top of the tank is connected to a vacuum pump for controlling the pressure in the tunnel. To reduce the turbulence level of the flow in the test section, a corner vane and a straightening vane are placed between the tank and the test section. According to the laser Doppler velocity measurement, the average velocities are well distributed in the upstream, downstream and centre of the test section, and the turbulence intensity levels are smaller than 2 % except for the near-wall area (Reference Li, Wang, Zhang and ShyyLi et al., 2008). The water tunnel is capable of generating free-stream velocities in the range 2 ~ 15 m s−1 with a highest operating velocity in the tunnel test section of approximately 20 m s−1. In recent years, this facility has been used extensively for a number of cavitation experiments (Reference Chen, Wang, Hu, Huang and ZhangChen, Wang, Hu, Huang, & Zhang, 2015; Reference Li, Wang, Zhang and ShyyLi et al., 2008; Reference Wang, Huang, Zhang, Wang, Wu and KongWang, Huang, et al., 2018; Reference Wang, Wang, Zhang and HuangWang, Wang, Zhang, & Huang, 2022).
Schematic of the water tunnel.

In the present study, a backward-facing wedge model is designed and installed on the bottom wall of the 700 mm test section to generate cavitation. The test model and its position are shown in figure 2, the wedge model has a convergent angle of 20° and divergent angle of 10°, and the contraction ratio at the throat is 0.5. The throat height of the wedge is H = 95 mm, which is half of the test section height, resulting in a length of the convergent channel of  ${L_{convergent}} = 95/\sin 20\mathrm{^\circ } = 278\;\textrm{mm}$ and length of the divergent channel of ${L_{divergent}} = 95/\sin 10\mathrm{^\circ } = 547\;\textrm{mm}$. The flow can be observed from both the top and front windows. Before conducting experiments, the water in the reservoir was kept still for some time to ensure the complete precipitation of the sediment and gas to separate the undesired free-stream bubbles in the flow.
Schematic diagram of the convergent–divergent channel installed in the water tunnel test section, and transducer mounting.

The experimental conditions are maintained to within 1 % uncertainty on the angle of the convergent–divergent channel and 2 % uncertainty on both the flow velocity and the upstream pressure. In detail, the upstream pressure is measured by the vacuometer (model Y-60, by SALANE, with 0.25 % uncertainty) and the flow velocity by the electromagnetic flowmeter (product code TDS4033-1CA00-1AA6A01, by TIANJIN KENTAI, with 0.5 % uncertainty). Together, the cavitation number can be controlled to within 5 % uncertainty. Further details about the experimental apparatus and measurement system can be found in the Methodology section in the supplementary material available at https://doi.org/10.1017/flo.2023.2.
In this study, the reference velocity U is fixed at 4.14 m s−1 with the velocity at the wedge throat 8.3 m s−1, and the pressure upstream of the test section was varied in the range  $24.5 < {p_\infty } < 72.5\;\textrm{kPa}$. The Reynolds number, Re = (UtH/ν), and cavitation number, $\sigma = ({p_\infty } - {p_v})/0.5{\rho _l}U_t^2)$, where Ut corresponds to the velocity at the throat, ν is the water kinematic viscosity, p∞ is the static pressure at the test section inlet, pv is the water vapour pressure and ρ is the water density, are defined. The current Reynolds numbers in the experiments are Re = 7.8 × 10⁵. The Froude number $Fr = {U_t}/{(gH)^{1/2}}$ is 6.08. During the experiments, by adjusting the ambient pressure, different cavity regimes were observed.
3. Results and discussion
3.1 Observations of different cavitation regimes and wall-pressure fluctuations
There are a variety of cavitation regimes observed in the separated flow region in the 10° divergent section in our experiments. In figure 3, the variation of mean cavity length (Lc) normalized by LH with σ is presented along with cavity behaviours at typical cavity regimes. The value of Lc is calculated based on a mean cavitation image intensity of 1.5 s, which consists of at least 10 cavity shedding cycles for the minimum σ to ensure statistical convergence. In general, with decreasing σ, cavity length increases at an exponential growth rate. As previously observed by Reference Franc and MichelFranc and Michel (2005), three flow regimes are observed, namely inception cavitation, sheet cavitation and cloud cavitation, with the sheet cavitation being dominant. The inception cavitation refers to the state before the small-scale cavity cluster shedding occurs where the sheet cavity length is small. When the cavity length increases, the cavity closure becomes unsteady and cavity clusters are intermittently shed downstream, namely sheet cavitation. The cloud cavitation occurs when the cavity length oscillation is strong with periodic sheet cavity breakup at the cavity leading edge and large-scale cavity cloud formation and shedding. In addition, as shown in figure 3, two cloud cavitation regimes are discovered in our experiment, i.e. cloud cavitation with a re-entrant jet dominated shedding mechanism and cloud cavitation with a shockwave dominated shedding mechanism. The cloud cavitation with shockwave mechanism over a wedge model was first observed by Reference Arndt, Song, Kjeldsen, He and KellerArndt et al. (2001), Reference Leroux, Coutier-Delgosha and AstolfiLeroux et al. (2005), and recently has been visualized using X-ray densitometry by Reference Ganesh, Mäkiharju and CeccioGanesh et al. (2016). At inception and sheet cavitation, the cavity length is relatively short, and the cavity length growth rate is relatively slow. At cloud cavitation, the cavity length increases exponentially and the cavity length growth rate is relatively fast. It should be noted that this negative exponential growth trend of cavity length with decreasing σ is in consistent with the measurement of Reference Laberteaux and CeccioLaberteaux and Ceccio (2001) and Reference Ganesh, Mäkiharju and CeccioGanesh et al. (2016).
Flow map of different cavitation regimes in the Lc/LH ~ σ plane (Lc is the mean cavity length based on mean cavitation image intensity of 1.5 s, LH is the length of divergent channel along surface direction) at Re = 7.8 × 10⁵. The solid line denotes the fitted mean cavity length the definition of which is shown schematically. The inserted images show the typical cavity behaviours under inception cavitation, sheet cavitation and cloud cavitation, respectively.

The variation of root-mean-square (RMS) wall-pressure fluctuations (pRMS) and normalized distance from the cavity leading edge (ξ/Lc, where ξ is the distance from the cavity leading edge in the along-wall direction and Lc is the mean cavity length) as a function of σ are presented in figure 4(a). The value of pRMS is calculated using a sample length of 10 s wall-pressure fluctuation signals which consists of at least 66 cavity shedding cycles for the minimum σ to ensure statistical convergence. With decreasing σ, Lc increases, thus ξ/Lc decreases correspondingly from 6.30 to 0.37 for the fixed pressure transducer locations (ξ), resulting in the monitor position changing from the outside or rear part of cavity to the front part. When ξ/Lc > 1, the monitor is located outside the cavity and approaches the cavity closure region with the reduction of σ, accompanied by the increase of pRMS. Note that, with decreasing σ, much more pRMS scattering occurs at the sheet cavity which is caused by the intermittent small-scale cavity cluster shedding at the rear of the sheet cavity than that at inception cavity. At around σ = 0.79, the pressure transducer is located at the cavity closure where ξ/Lc = 1, and a peak of pRMS is found, as indicated by the dashed line. It should be noted that large pressure fluctuations at the closure regions of transient cavities have been supported by experimental observations reported by Reference Leroux, Astolfi and BillardLeroux et al. (2004) and Reference Ganesh, Mäkiharju and CeccioGanesh et al. (2016) while our study further shows this maximum pressure fluctuation intensity at the closure of the mean cavity of independent of the cavity regime. With a further reduction of σ, the pressure transducer is located inside the cavity (ξ/Lc < 1) and approaches the cavity leading edge, along with decreasing pRMS. However, at around σ = 0.73, another peak with an increase in pRMS is observed, as indicated by the red dashed ellipse. Detailed examination shows that, at this critical flow condition, there exists the transition of the cloud cavitating flow regime from the re-entrant jet mechanism to the shockwave mechanism, as shown in figure 3. It is supposed that the pRMS magnitude is enhanced by the initiation of the shockwave dynamics, which is more violent than the re-entrant jet dynamics. Figure 4(b) presents the pressure fluctuation signals during 0.5 s for typical cavity regimes observed in figure 3 along with the synchronized wedge throat section-based normalized cavity area ( ${S_{throat}} = dH$, d and H are the width and height of the convergent–divergent channel, respectively). It is shown that the cavity area evolution is closely related to the pressure signals. With the reduction of σ, the cavity area and the corresponding pressure signals increase, and in the cloud cavitation regimes, both plots present the periodic behaviours. In the following, the cavity structures are examined in detail to gain further insight into the cavity dynamics, i.e. cloud shedding mechanism and fluctuating pressure fields.
(a) The variation of root-mean-square wall-pressure fluctuations, i.e. pRMS, (square, □) and normalized distance from cavity leading edge (ξ/Lc, circle, ○, red) along wall surface by mean cavity length (Lc) as a function of σ, and (b) time series of normalized cavity area and wall-pressure fluctuation signals under typical cavity regimes at transducer number 4.

To investigate the unsteadiness of cavity structures, figure 5 presents the spatial-temporal evolution of  $\hat{g}$ to show the evolution of cavity structures based on grey level images for different cavitation regimes using the methodology described in the supplementary material. As has been used in cavitation behaviours by Reference Ganesh, Mäkiharju and CeccioGanesh et al. (2016), Reference Smith, Venning, Giosio, Brandner, Pearce and YoungSmith et al. (2019, Reference Smith, Venning, Pearce, Young and Brandner2020), Reference AndreasAndreas (2006) and Reference Young, Chang, Smith, Venning, Pearce and BrandnerYoung et al. (2022), the spatial-temporal (s–t) diagram is obtained by stacking the grey level lines defined in (S2) and (S3) in the supplementary material, which contain both the temporal and spatial evolution of cavity behaviours. At inception cavitation in figure 5(a), cavity structures are stable with small variations of cavity length at the cavity rear part, which is consistent with the observations of transient cavity behaviours in figure S4 in the supplementary material. At sheet cavitation in figure 5(b), cavity length increases to reach transducer number 4, and cavity instabilities increase, showing the intermittency. Shedding structures are observed at the rear of the sheet cavity, which correspond to the intermittent small-scale shedding cavity clusters observed in high-speed imaging in figure S5 in the supplementary material. The shedding distance of these small-scale cavity clusters is much shorter than the sheet cavity length, approximately <0.5 Lc at the flow conditions studied. At cloud cavitation with the re-entrant jet mechanism in figure 5(c), cavity structures become much more unsteady and present periodic behaviours. The transient cavity evolution process includes attached sheet cavity growth, re-entrant jet movement and large-scale cavity cloud shedding, as observed in the transient cavity behaviours in figure S6 in the supplementary material as well. As shown in figure 5(c), the attached sheet cavity arrives at transducers number 4, and the size of the shedding structure is almost the same as the cavity length, where the large-scale shedding cloud is transported further downstream. At cloud cavitation with the shockwave mechanism in figure 5(d), a shockwave structure is generated, propagating in the whole flow field, and the cavity regime transitions from the re-entrant jet mechanism to the shockwave mechanism. The transient cavity evolution process includes attached sheet cavity growth, shockwave propagation and large-scale cavity cloud shedding, as observed in the transient cavity behaviours in figure S7 in the supplementary material. As shown in figure 5(d), the attached sheet cavity grows beyond transducer number 4, and the shedding structure is further transported, even outside of the imaging region. To further analyse the typical cavity structures observed in cloud cavitation, the speeds of typical cavity structures in cloud cavitation have been estimated from the s–t plots in figure 5. Table 1 lists the motion velocity of the typical cavity structures along with the standard derivations, i.e. attached sheet cavity, re-entrant jet/shockwave and large-scale cavity cloud, in cloud cavitation for both the re-entrant jet and shockwave mechanism. Taking into account the variety from cycle to cycle, the velocity in table 1 is averaged for at least 10 cavity cycles to ensure statistical convergence. It is found that the velocity of the attached sheet cavity and shedding cloud is almost the same for different cloud cavitation regimes, while the shockwave propagation velocity is a little larger than the re-entrant jet movement velocity, indicating different frequency features associated with RJ or SW motion involved in different cavity regimes. In addition, from the statistical viewpoint, across the range of σ studied, the motions of these typical cavity structures in cloud cavitation show that the average sheet cavity growth velocity is approximately 2.08 ± 0.14 m s−1, the average speed of RJ/SW 2.91 ± 0.36 m s−1 and the average cloud cavity shedding velocity 3.61 ± 0.30 m s−1. The average cloud cavity shedding velocity is almost 0.43 Ut. The speed variation of typical cavity structures in cloud cavitation with σ is shown in figure S8 in the supplementary material.
Temporal-spatial (s–t) diagram of grey level variance  $(\hat{g})$ based on experimentally observed images for (a) σ = 1.11, (b) σ = 0.85, (c) σ = 0.75 and (d) σ = 0.71 at Ut = 8.3 m s−1, Re = 7.8 × 10⁵. Vertical dashed lines show the locations of four pressure transducers, respectively.

Estimation of speeds of attached sheet cavity growth, re-entrant jet movement/shockwave propagation and cavity cloud shedding under re-entrant jet (σ = 0.75) and shockwave mechanisms (σ = 0.71).

3.2 Spectral content and statistics
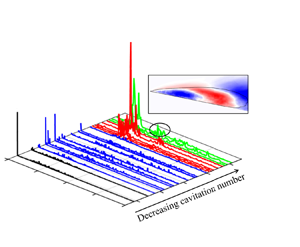
The power spectral densities (PSDs) of the sampled fluctuating pressure signals are analysed using the fast Fourier transform technique (Reference BrighamBrigham, 1988) with a Hamming window length of 1 024 000 and 50 % overlap (Reference AndreasAndreas, 2006). The PSDs are obtained for σ values ranging from 1.20 to 0.65, as shown in figure 6(a). The frequencies, f, are non-dimensionalized using a cavity length-based Strouhal number, St = fLc/Ut, where Lc is the mean cavity length. Four distinct cavity regimes are marked by different line colours. Generally, with decreasing σ, the frequency contents changes from intermittency in inception and sheet cavitation to periodicity in cloud cavitation, and from high frequency to the low frequency. At inception cavitation, shown in black lines, and sheet cavitation, shown in blue lines, the frequency content with high energy magnitude concentrates at high St (>0.25), and the frequency range is wide, while no clear frequency peak is observed, indicating the intermittency of the cavity dynamics. In cloud cavitation with the re-entrant jet mechanism and shockwave mechanism, shown in red and green lines in figure 6(a) respectively, double-peak behaviours of St, that is the dominant Strouhal number Std and secondary Strouhal number Sts, are clearly observed, indicating the periodicity of the cavity dynamics. The secondary frequency phenomenon in cloud cavitation observed in our experiment has also been reported by several research works, including Reference Kjeldsen and ArndtKjeldsen and Arndt (2001) on a NACA0015 hydrofoil, Reference Wu, Ganesh and CeccioWu et al. (2019) over a wedge model and Reference Smith, Venning, Giosio, Brandner, Pearce and YoungSmith et al. (2019, Reference Smith, Venning, Pearce, Young and Brandner2020) and Reference Young, Chang, Smith, Venning, Pearce and BrandnerYoung et al. (2022) on a 3-D flexible hydrofoil. In figure 6(b), the power spectrograms of the sampled fluctuating pressure signals for σ values ranging from 0.8 to 0.65 are presented to illustrate the spectral content (i.e. double-peak behaviours) in cloud cavitation. Both plots show that, with σ decreasing from 0.80 to 0.65, Std and Sts present a decreasing trend and the energy magnitude at the dominant Strouhal number Std is far stronger than that at the secondary Strouhal number Sts. The Std is caused by large-scale cloud shedding which has been widely discussed (Reference Arndt, Song, Kjeldsen, He and KellerArndt et al., 2001; Reference Ganesh, Mäkiharju and CeccioGanesh et al., 2016; Reference Kjeldsen and ArndtKjeldsen & Arndt, 2001; Reference Wu, Ganesh and CeccioWu et al., 2019). According to the works by Reference Smith, Venning, Giosio, Brandner, Pearce and YoungSmith et al. (2019, Reference Smith, Venning, Pearce, Young and Brandner2020) and Reference Young, Chang, Smith, Venning, Pearce and BrandnerYoung et al. (2022), the dominant frequency is supposed to be related to the cavity dynamics at the top of the hydrofoil and the secondary frequency at the tip. The frequency peaks are associated with the changing cavity length along the spanwise direction from the top to tip of hydrofoil, and thus a different re-entrant jet dynamics is involved. Inspired by these works, we check the RJ/SW dynamics (i.e. frequency) to illustrate the physics at the secondary frequency in our experiment. Across the range of σ studied, the value of Std varies from 0.30 to 0.20, and Stf from 0.68 to 0.37. The relation between Std and Sts shows that Std is approximately 2.00 ± 0.14 Sts, which agrees with the relation between the re-entrant jet or shockwave frequency and the cavity shedding frequency described in the supplementary material. Combined with the frequency–temporal characteristics of cavity volumes from cavitation images using a Morlet-6 wavelet analysis (Reference TeolisTeolis, 1998) in figures S10 and S11 in the supplementary material, and the characteristics of typical cavity structures listed in table 1, Sts is associated with the RJ/SW dynamics.
(a) The PSDs of the wall-pressure fluctuations on pressure transducer number 2 (x/H = 0.37) as a function of Strouhal number (St = fLc/Ut) for various σ values ranging from 1.20 to 0.65, and (b) power spectrograms of cavity shedding Strouhal number in cloud cavitating regimes for σ values ranging from 0.80 to 0.65.

The probability density functions (PDFs) of cavity structures and pressure fluctuations are analysed to gain further understanding of the cavitation dynamics. The PDF is calculated from both the grey level variance using cavitation images and wall-pressure fluctuation signals. Figure 7 presents the PDFs of grey level variance and wall-pressure fluctuations at four transducer locations for different cavity regimes, including inception cavitation, sheet cavitation, cloud cavitation with the re-entrant jet mechanism and cloud cavitation with the shockwave mechanism. For convenience of comparison, the Gaussian distribution is also plotted. In figure 7, the bin size of bar plots is 1.0 and of line plots is 0.1 to show finer statistical features. Generally, the PDFs of wall-pressure fluctuations agree well with those obtained from the grey level variance, showing that the statistical characteristics (i.e. fluctuations) of cavity structures have the same trend as those of wall-pressure fluctuation signals, except that, in cloud cavitation, a double-peak behaviour of the PDF is observed for grey level variance at transducer numbers 3 and 4 in cloud cavitation, as illustrated by the panels with a small bin size in figures 7(c-iii,c-iv) and 7(d-iii,d-iv). The double-peak distributed PDF of cavitation image intensities suggests that positive and negative image intensities alternate at the locations of transducer numbers 3 and 4 in cloud cavitation. We also find that transducer numbers 3 and 4 are located on the path of RJ and SW motion in cloud cavitation, as shown by the s–t diagrams presented in figure 5, showing that this may be due to the interactions between RJ/SW with the cavity which can significantly reduce the local void fraction. This double-peak PDF behaviours of cavitation image grey level variance observed at specific locations in cloud cavitation in figure 7 will be quantitatively explained later when we examine the whole flow fields via cavitation image intensities in detail to gain further insights into the flow regimes and the transition mechanism. Moreover, the PDF in figures 7(a-iii,a-iv) and 7(b-iv) presents the Gaussian distribution, while all the other PDFs present the non-Gaussian distribution with a long tail on the right side, which is positively skewed. Combined with the cavity dimensions analysis in figure S12 in the supplementary material, the transducer numbers 3 and 4 at inception cavitation and transducer number 4 at sheet cavitation are at the closure or outside of the mean cavitation region. As a consequence, we speculate that the PDF distribution of both cavity structures of pressure signals is significantly influenced by the relative location of the transducer to the mean cavitation region, and the unsteadiness in cloud cavitation, i.e. re-entrant jet and shockwave dynamics, indicating inhomogeneous flow characteristics inside the cavity.
The PDF distributions of pressure fluctuations and the corresponding grey level variance for (a) σ = 1.11, (b) σ = 0.85, (c) σ = 0.75 and (d) σ = 0.71 at Ut = 8.3 m s−1, Re = 7.8 × 10⁵. Bin width is 1.0. Note that the parameters are normalized by subtracting the mean and dividing by the standard deviation. The inserted schematics show the relative locations of four transducers in the cavitation region, and the insets have a smaller bin width of 0.1 and for clarity, the y-axis of the insets is shifted.

To confirm our speculation described above, PDF distributions of grey level variance at each streamwise pixel location extracted from high-speed images are presented in figure 8 to further illustrate the statistical features of flow structures inside the cavitation region. The sampled length of grey level variance to calculate the PDFs is 1.5 s, which consists of more than 10 cavity shedding cycles at minimum σ, ensuring statistical convergence. The PDF of grey level variance at each streamwise pixel location is calculated and then stacked together to form the PDF diagram as a function of ξ/Lc, along with the high-order moment (Ku and Sk) plots. As shown in figure 8, the PDF diagrams at inception and sheet cavitation present that negative (m-mean(m))/std(m) values occur with a larger probability, and long tails are observed on the positive side of the PDF shape, showing the positive skewness features of cavitating flow structures inside the cavitation region. This positive skewness feature agrees with the that obtained from wall-pressure signals in figures 7(a) and 7(b). In cloud cavitation for both the re-entrant jet mechanism and shockwave mechanism, besides the positive skewness with long tails on the PDF positive side, double-peak behaviours of PDF shape are also observed in the region of approximately 0.25 < ξ/Lc < 0.65, as indicated by the black shadow regions in figures 8(c) and 8(d). The high cavitation intensity (i.e. high void fraction) is related to the generation of vapour bubbles. At the same time, we observe that the interactions between RJ/SW and the cavity will reduce the local void fraction in figures S6 and S7, thus leading to low cavitation image intensities. As clearly shown in the s–t diagram of grey level variance in cloud cavitation in figures 5(c) and 5(d), in the region of approximately 0.25 < ξ/Lc < 0.65, alternate RJ/SW propagation upstream inside the cavity occurs, leading to low cavitation image intensities (i.e. low void fraction) along its propagation path. In addition, the Sk < 0 as indicated by the skewness curves is also observed in this region in cloud cavitation, which agrees with the observation of two scattered negative low skewness values in figures S13 and S14 in the supplementary material. This double-peak behaviour of PDF shape with negative skewness values also shows the discrepancy between the cavity structures and wall-pressure fluctuations in terms of the statistics of fluctuating flow fields, indicating the complexity of capitating flow structures and their dynamics. Remarkably, this double-peak behaviour in cloud cavitation is associated with complex phenomena, including cavity interfacial instabilities, large-scale turbulence, re-entrant jet, and shockwave dynamics, especially the interactions between the re-entrant jet and shockwave dynamics and cavities. The sophisticated measurements and high-fidelity simulations can help to promote the understanding of cavity structures and associated dynamics.
Maps of PDF of grey level variance along with the high-order moment (i.e. Ku, and Sk) distribution in the streamwise direction for (a) σ = 1.11, (b) σ = 0.85, (c) σ = 0.75 and (d) σ = 0.71 at Ut = 8.3 m s−1, Re = 7.8 × 10⁵. Note that the parameters are normalized by subtracting the mean and dividing by the standard deviation.

3.3 Multi-scale proper orthogonal decomposition analysis of cavity structures
To identify the flow structures and physics in cloud cavitation for the re-entrant jet shedding mechanism and shockwave shedding mechanism, i.e. dominant and secondary frequencies, double-peak structures and negative skewness of grey level function PDFs, mPOD is employed to extract the coherent structures at different flow scales using the technique outlined by Reference Mendez, Balabane and BuchlinMendez et al. (2019). In its basic implementation, mPOD combines multi-resolution analysis with the standard POD and bridges the energy optimality of the standard POD (Reference LumleyLumley, 1967) and spectral purity of the standard DMD (Reference SchmidSchmid, 2010). In our work, the mPOD is applied to the time-varying cavitation image intensities. Each high-speed image represents the spatial variation of cavitation image pixel intensity, where a high intensity indicates the presence of a cavitation bubble or cavity cluster/shed cloud due to the light scattering from cavity interfaces. The mPOD analysis of these cavitation intensity data can provide information of various coherent structure modes, both in frequency content and the spatial location, an approach that has been adopted in several research works (Reference Barwey, Ganesh, Hassanaly, Raman and CeccioBarwey et al., 2020; Reference Prothin, Billard and DjeridiProthin et al., 2016; Reference Smith, Venning, Giosio, Brandner, Pearce and YoungSmith et al., 2019; Reference Smith, Venning, Pearce, Young and Brandner2020; Reference Young, Chang, Smith, Venning, Pearce and BrandnerYoung et al., 2022; Reference Zhang, Liu and WangZhang et al., 2021). Further details on the mPOD methodology are outlined in the supplementary material. The number of snapshots used in the mPOD algorithm is 2300 frames to guarantee the convergence of the dataset, including at least six cavity shedding cycles, which has been shown to be sufficient for the convergence of results by Reference Zhang, Liu and WangZhang et al. (2021). Figures 9(a) and 9(b) presents the comparisons of the PSD distributions of the temporal coefficient of the first ten mPODs as well as the pressure signals for the re-entrant jet shedding mechanism and shockwave shedding mechanism, respectively. In figure 9(a) under the re-entrant jet shedding mechanism, the mPOD modes in the range of St ≈ 0 ~ 0.39 (i.e. r = 1, 2, 3) describe low-frequency flow phenomena, and have a dominant frequency at St ≈ 0.24, indicating that these modes are paired with phase differences. The dominant frequency of these modes has the similar value to that obtained from pressure signals at transducer number 1 at approximately St ≈ 0.25, revealing that these modes describe the coherent structures associated with the large-scale cavity cloud shedding process at the dominant frequency. The mPOD mode 4 and mPOD mode 5 are paired and describe the flow phenomena taking place in the range of St ≈ 0.39 ~ 0.63, and both have a dominant frequency at St ≈ 0.47, which is similar to the secondary frequency obtained from the pressure signals at number 1 transducer at approximately St ≈ 0.48 primarily caused by the re-entrant jet dynamics. As a consequence, mode 4 and mode 5 describe the coherent structures associated with the re-entrant jet dynamics at the secondary frequency. The mPOD modes from r = 6 to 10 describe the flow phenomenon with high frequency in the range of St > 0.63 as presented in figure 9(a). Similarly, the same mode pair phenomenon is also observed for the shockwave shedding mechanism presented in figure 9(b), where the mPOD modes in the range of St ≈ 0 ~ 0.33 (i.e. r = 1, 2, 3) describe the low-frequency flow phenomenon. The dominant frequency for mPOD modes 1 to 3 is at St ≈ 0.21, which is similar to the dominant frequency obtained from the pressure signals at number 1 transducer at approximately St ≈ 0.20, indicating the large-scale cavity shedding process. The mPOD mode 4 and mPOD mode 7 are paired and associated with the flow phenomenon in the range of St ≈ 0.33 ~ 0.51 with the dominant frequency at St ≈ 0.37, a similar to the secondary frequency obtained the pressure signals at number 1 transducer at approximately St ≈ 0.40 primarily caused by the shockwave dynamics. The mPOD modes from r = 5, 8, 9 and 10 describe the flow phenomenon with high frequency in the range of St > 0.63, as presented in figure 9(a). However, the energy distribution for different mPOD modes (thus frequency ranges) under the shockwave shedding mechanism is different from that under the re-entrant jet shedding mechanism. Specifically, in figure 9(c), the energy distribution for the first 100 mPOD modes is presented. The energy is mainly concentrated in the first 10 mPOD modes. Compared with those under the re-entrant jet shedding mechanism, the energy magnitude for mPOD mode 2 and mPOD mode 3 under the shockwave shedding mechanism is smaller, while the other high-order modes show a similar energy percentage. Considering that the first two mPOD mode pairs are mainly caused by cavity shedding process and re-entrant jet/shockwave dynamics, the differences in energy distribution show the different flow physics caused by the re-entrant jet and shockwave dynamics. Taking advantage of the non-overlapping frequencies between different mode pairs, in the following, the coherent structures associated with the cavity shedding process and RJ/SW dynamics will be explained by examining the spatial structures in detail for the mPOD modes at frequencies of interest.
The PSD distribution of the dominant first ten mPOD modes and pressure signals at number 1 for (a) re-entrant jet mechanism, σ = 0.75, and (b) shockwave mechanism, σ = 0.71, and (c) distribution of energy content percentage for the first 100 mPOD modes. The amplitude of the PSD from the pressure signals is shifted to make the comparisons clear.

To give a physical explanation for the dynamic behaviours responsible for different shedding mechanisms, the spatial and temporal structures of representative mPOD modes at frequency ranges of interest are shown in figure 10 for the re-entrant jet shedding mechanism and figure 11 for the shockwave shedding mechanism. Generally, the coherent structures feature alternative positive and negative parts along the streamwise direction for both cloud cavitating flow mechanisms. The size of the negative and positive coherent structures for the shockwave mechanism in figure 11 is larger than that for re-entrant jet mechanism in figure 10. In particular, the mPOD mode at St = 0.24 for the re-entrant jet mechanism is characterized by a negative coherent structure with a positive coherent structure inside and confined near the wall in the attached cavity region in figure 10(a), including a large positive shedding structure downstream of the negative coherent structure. For the shockwave mechanism, the mPOD mode at St = 0.21 has similar coherent structures, however, with opposite signs, where the attached cavity region is characterized by a positive coherent structure with a negative coherent structure inside and confined near the wall in figure 11(a). Moreover, flows in the region x/Lc = 0.25 ~ 0.65 for both re-entrant jet mechanism and shockwave mechanism feature both negative and positive coherent structures with different relative locations. The mPOD mode at St = 0.47 for the re-entrant jet mechanism and at St = 0.37 for the shockwave mechanism has smaller structures than that in the corresponding mPOD mode. As stated above, the mPOD mode with the similar frequency to the fs obtained from pressure signals reflects the behaviours of the re-entrant jet and shockwave. In figure 10(b) under the re-entrant jet mechanism, in the distance range x/Lc = 0.25 ~ 0.65, the negative coherent structures have two regions with an upper part and lower part where the lower part has a weaker strength than the upper part. The lower part is supposed to be related to the interactions between the re-entrant jet and cavity. In figure 11(b) under the shockwave mechanism, in the distance range x/Lc = 0.25 ~ 0.65, only positive coherent structures are observed, which are supposed to be caused by the interactions between the shockwave and cavity. Furthermore, the negative coherent structure is seen at the wedge throat near the wall beneath the positive coherent structures, which is supposed to be caused by the re-entrant jet. Consequently, in the flow condition examined, the flow physics are governed by both the shockwave and re-entrant jet dynamics with the shockwave dynamics being dominant. The mPOD modes at St = 0.66, 1.13 in figure 10(c,d) and at St = 0.58, 1.13 in figure 11(c,d) represent the flow structures at higher frequencies. Different from the mPOD modes at low frequencies, coherent structures on these two high mPOD modes have the same signs between the re-entrant jet mechanism and shockwave mechanism, indicating that flows at high frequencies under different cloud shedding mechanisms could have the same physical mechanisms, which is also consistent with the energy distribution in the high mPOD mode where the energy percentage to the first mPOD mode remains the same between the re-entrant jet mechanism and shockwave mechanism.
Spatial and temporal structures (ψ) for the mPOD modes at the frequencies of interest for the cloud cavitation with re-entrant jet mechanism (σ = 0.75). The yellow shadow region is in the distance range x/Lc = 0.25 ~ 0.65.

Spatial and temporal structures (ψ) for mPOD modes at the frequencies of interest for the cloud cavitation with shockwave mechanism (σ = 0.71). The yellow shadow region is in the distance range x/Lc = 0.25 ~ 0.65.

4. Conclusions
The physics and mechanism (i.e. statistics) of attached cavitation, especially the sheet/cloud cavitation shedding process and its transition in a convergent–divergent wedge model, were experimentally investigated using synchronized high-speed imaging and unsteady pressure fluctuation measurement technique. The experiments are conducted at a Reynolds number of 7.8 × 10⁵ with various cavitation numbers ranging from inception to cloud cavitation. An image processing algorithm where the cavitation structure identification functions are defined based on grey level profiles is proposed to analyse the unsteady cavitation multiphase flow structures. Data-driven mPOD is employed to examine in detail the multiscale flow structures in the process of cavity shedding for different cloud cavitation regimes to gain further insights into the physics involved in shedding processes and the transition mechanism. The primary findings can be summarized as follows:
(i) Four distinct cavity regimes and the associated instabilities are identified and examined. A peak of pressure fluctuation intensity independent of cavity regime is observed near the mean cavity closure due to the strong flow unsteadiness. We find that, in cloud cavitation, during the transition from the re-entrant jet shedding mechanism to the shockwave shedding mechanism, another peak with a significant increase in pressure fluctuation intensity is identified, indicating the stronger instabilities in the shockwave mechanism compared with that in the re-entrant jet mechanism.
(ii) The spectral features and statistics are analysed based on both wall-pressure signals and the high-speed imaging observations. Our study shows that two frequency peaks, where the dominant frequency ( fd) is associated with the large-scale cavity cloud shedding process and the secondary dominant frequency ( fs) is related to the re-entrant jet/shockwave dynamics, are observed in cloud cavitating flows. Moreover, in the range of 0.25 < ξ/Lc < 0.65 inside the mean cavity, the PDFs of grey level show double-peak behaviours, indicating the complexity of cavity structures and their induced pressure fluctuations in cloud cavitation regimes.
(iii) Two shedding mechanisms in cloud cavitation, namely the re-entrant jet mechanism and the shockwave mechanism, are identified and examined in detail. Due to the shockwave/cavity interactions, a region with negative skewness values from the PDFs of grey level is observed in the region of 0.25 < ξ/Lc < 0.65 under the shockwave shedding mechanism. In addition, mPOD analysis shows that, under the shockwave shedding mechanism, the integrated interactions of shockwave and re-entrant jet are responsible for the complex cavity dynamics.
In summary, the current study provides a detailed analysis of the dynamics and statistics of sheet/cloud cavitation (i.e. wall-pressure fluctuations and cavity structures) associated with cavity shedding, and the physics involved in regime transitions. Further investigations both experimentally and numerically into the integrated interactions between the shockwave and re-entrant jet in the process of cavity shedding in a wider range of flow conditions will allow a more detailed and comprehensive understanding and better predictions, and promote the establishment of physics-based criteria to identify the dominant dynamics. The findings and results obtained from the current study can be extended to other sheet/cloud cavitation set-ups such as around hydrofoils, spheres and cylinders in practical settings. Our study can improve the understanding of high-performance marine propulsion systems and hydroelectric power systems and the development of effective control strategies.
Supplementary material
The supplementary text is provided to get more details about the work and procedures. Supplementary material are available at https://doi.org/10.1017/flo.2023.2.
Funding
Financial support by grants from the National Natural Science Foundation of China (grant number 51979003) is gratefully acknowledged. C.W. is grateful for the financial support of the China Scholarship Council (CSC, grant number 201906030144) for her visit to the Saint Anthony Falls Laboratory of the University of Minnesota.
Declaration of interests
The authors report no conflict of interest.
Data availability
The data that support the findings of this study are available from the corresponding author upon reasonable request.


 Open access