

Two variants of glycomacropeptides (GMP-A and GMP-B) with 15–20% concentration are produced and combined with whey protein during cheese-making due to the breakdown of casein by chymosin enzyme. The pure GMP-A is composed of sialic acid (the prominent and essential form of carbohydrate) and it is highly glycolyzable in an appropriate pH. While both variants have phosphorous compounds, GMP-A is more phosphorylated than GMP-B because of dissimilarity in their amino acid structures (Neelima et al., Reference Neelima, Rajput and Mann2013). While GMP-A is highly polymerized, GMP-B exists in different forms of monomers, dimers, and tetramers (Vasbinder et al., Reference Vasbinder, Rollema and de-Kruif2003; Tolkach and Kulozik, Reference Tolkach and Kulozik2005; Thomä-Worringer et al., Reference Thomä-Worringer, Sorensen and Lopez-Fandino2006). The presence of sialic acid with very low contents of aromatic amino acids (mainly phenylalanine and tyrosine) in GMP-A makes it a useful protein for nutritive supervision of phenylketonuria (a genetic disorder) and ulcerative colitis diseases (Martin-Diana et al., Reference Martin-Diana, Frias and Fontecha2005). In addition, the sialic acid attached to GMP-A has an important role in functioning of the cell membranes, membrane receptors and overall normal brain activities (Wang et al., Reference Wang, Brand-Miller, McVeagh and Petocz2001). Furthermore, the two forms of GMPs have excellent physical properties (such as foaming, emulsification and gel formation) and a good potential to establish a healthy intestinal microbiota and prevent pathogenic bacteria colonization, if they are used in clinically designed diet foods (Martin-Diana et al., Reference Martin-Diana, Frias and Fontecha2005).
It is not easy to separate these two forms of GMPs from other whey proteins because they have heterogeneous structures with different isoelectric points (IPs). Whereas the GMP-B has IP = 4.1, GMP-A has two IPs of 3.15 and 2.2 respectively for two chains of peptides and carbohydrates (Farías et al., Reference Farías, Martinez and Pilosof2010). While the GMP-A is soluble in trichloroacetic acid (TCA) due to its high glycoside content, the GMP-B with low glycoside is insoluble and precipitated in TCA (Taylor and Woonton, Reference Taylor and Woonton2009).
Different methods of pH modification including heating, superficial carbon dioxide injection, salt addition, diafiltration and application of different electronic, magnetic and ultrasonic fields as well as enzymatic treatments have been used to increase the efficiency of GMPs separation from the other proteins in whey solution (Luo et al., Reference Luo, Morthensen, Meyer and Pinelo2014). Recently, anion exchange resin and chitin (as an adsorbent) were used for the first time to isolate κ-casein glycomacropeptide from whey solution (Nakano and Betti, Reference Nakano and Betti2020). However, most of these studies showed a modest yield of GMPs because of insufficient glycosylation. For example, injecting superficial carbon dioxide results in good separation of GMP-A (because of temperature increase up to 70°C), but it reduces GMPs glycosylation. A similar process happened when ultrasonic wavelengths were used for GMP-B separation from the whey solution (Bonnaillie et al., Reference Bonnaillie, Qi, Wickham and Tomasula2014).
Kawasaki et al. (Reference Kawasaki, Kawakani, Tanimoto, Dosako, Tomizawa, Kotake and Nakajima1993) used UF for the first time for sweet whey and whey protein concentrate. However, they obtained GMP-A without sialic acid, GMP-B without phosphoric acid and a low yield (~25%) for the two combined variants of GMPs. Most probably these essential acids were removed either in preparation of WPS or during ultrafiltration (UF). In other words, the attachment of carbohydrate moiety of sialic acid should be strong with polymers of GMP to pass through the membrane efficiently (Sejong et al., Reference Sejong, Worobo, Kim, Rheem and Kim2000). Additionally, the more valuable form of GMP-A may convert to GMP-B without phosphoric acid (due to the unfavorable pH conditions) with an accompanying decline in potentially positive biological functions (Lieske et al., Reference Lieske, Konrad and Kleinschmidt2004c). Furthermore, the chemical compositions and physical structure of GMP-A and GMP-B polymers in WPS are significantly affected by changing their pH (Neelima et al., Reference Neelima, Rajput and Mann2013).
Based on this overview, it was our objective to determine whether the pretreatment of whey protein solution (WPS) before first ultrafiltration (UF-1) and sequentially before UF-2 can separate its two valuable and combined variants (A&B) polymers of GMPs from other proteins with maximum yield and high purity whilst maintaining minimum phenylalanine (Phe) content. We hypothesized that applying proper pretreatments and refining of WPS will glycosylate and isolate these compounds from other proteins efficiently.
Materials and methods
Whey protein powder with 70% protein (including 13% GMP), 6.4% moisture and 23.6% other materials (lactose and minerals) was prepared from Agri-Mark (Andover, MA, USA) and dissolved in distilled water to make WPS (whey protein solution) with 6.5% GMPs concentration. Standardized powder of glycomacropeptides (SPGMP from Lacprodan®) with 81% GMP and 5.5% moisture was purchased from Arla (Viby, Denmark) and used as a standard solution for HPLC analyses. Standard solution of Phe and concentrated hydrochloric and sodium hydroxide solutions were prepared from the local Merck agency in Iran. A magnetic agitator with a speed controller (model RH Basic-2, IKAMAG®, Germany) was prepared and used for uniform mixing
Pretreatment of feed solutions and sequential ultrafiltrations
Online Supplementary Figure S1 shows the flow process of running the four TRT-CON, CON-TRT, TRT-TRT and CON-CON experiments with and without the mixing pretreatment prior to the UF-1 and UF-2. Initially, the WPS was acidified for each experiment with 8 N hydrochloric acid before passing through the UF-1. Then, the resulting permeate of each experiment was neutralized with 6 N sodium hydroxide before passing across the UF-2. The acidification and neutralization reactions (at different stages) were completed with pretreatment of mixing at 150 RPM for 30 min for TRT-CON and TRT-TRT prior to UF-1, and for CON-TRT and TRT-TRT experiments before UF-2. The acidification and alkalization of WPS for CON-CON were performed exactly like the TRT-TRT experiment but without the mixing-pretreatment before UF-1 and UF-2. This testing was performed to show the separate and combined effects of different processes on the UF-2 retentate. The water permeates flux and different resistances of membranes were measured in UF-1 and UF-2, after cleaning with water, sodium hydroxide, and acid solutions.
Since UF was the main process for this research, the following Equations (1)–(7) were used to calculate permeate flux (J p, kgm−2 s−1), total membrane resistance Rt (with the dimension of m−1), membrane resistance (R m), membrane hydraulic permeability (ms−1 Pa−1), irreversible fouling resistance (R firr), reversible fouling resistance (R frev), and predominant fouling index, respectively (Kalbasi-Ashtari and Cisneros-Zevallos, Reference Kalbasi-Ashtari and Cisneros-Zevallos2007; Mirsaeedghazi et al., Reference Mirsaeedghazi, Emam-Djomeh, Mousavi, Aroujalian and Navidbakhsh2010; Mah et al., Reference Mah, Chuah, Cathie-Lee and Chai2012).
 $$J_{\rm p} = \displaystyle{{\Delta m} \over {A \times t}}\;$$
 $$R_{\rm t} = R_{\rm m} + R_{\rm c} + R_{{\rm frev}} + R_{{\rm firr}}$$
 $$R_{\rm m} = \displaystyle{1 \over {{\rm \mu }_{\rm w}L_{\rm p}^0 }}$$
 $$L_{\rm p}^0 = \displaystyle{{J_{\rm w}} \over {\Delta P}}$$
 $$R_{{\rm firr}} = \displaystyle{1 \over {\mu s_{\rm w}L_{\rm p}^4 }}-R_{\rm m}\;$$
 $$R_{\rm m} + R_{{\rm frev}} + R_{{\rm firr}} = \displaystyle{1 \over {\mu _{\rm w}L_{\rm p}^2 }}$$
 $$\displaystyle{{{\rm d}^2t} \over {{\rm d}v^2}} = k\left({\displaystyle{{{\rm d}t} \over {{\rm d}v}}} \right)^i$$
Description I in the online Supplementary File gives the definition of i and dimension of each parameter used in Equations (1)–(7).
The UF-1 and UF-2 processes were perfomed with polyethersulfone (PES) membranes with nominal molecular weight cut-off (MWCO) of 20 kDa. While the resulting retentates of UF-1 and UF-2 were recycled to their feed tanks by a rotary pump, the subsequent permeate of each process was collected and weighed in a tank continuously. Each UF test was performed with a new PES membrane at a transmembrane pressure of 1.5 bar and a feed flow rate of 10 ml/s at 25°C.
HPLC procedures for measuring GMPs and Phe
The standard powders of glycomacropeptides (SPGMP) and whey protein powder were dissolved in pure water to make two separate 6.5% solutions (w/v) for HPLC analysis of GMPs. Each solution was acidified and neutralized similar to the TRT-TRT experiment but without ultrafiltration processes. The mobile phases of A (50 mm sodium phosphate at pH = 3.0) and B (mixture of 60% acetonitrile with 40% water containing 0.1% TCA) were used to measure GMPs in HPLC. Later, each sample of UF2-retentate was purified with 8% trichloroacetic acid (TCA) to precipitate its non-peptides components as reported by Minkiewicz et al. (Reference Minkiewicz, Slangen, Lagerwerf, Haverkamp, Rollema and Visser1996). Then 50 μl of supernatant solution of each sample (from SPGMP, WPS, and UF-2 retentates) was injected into HPLC equipment (Agilent 1100, Germany) with Hypersil ODSC_18 column (125 mm × 4 mm dimensions and 5 μm particle sizes), and its eluting (or washed out) peptides was detected at UV-226 nm.
To obtain HPLC peak of Phe and determine its concentration, each sample (including standard pure phenylalanine solution) was acidified (with 8 ml of 6 M HCl) and incubated for 24 h at 110°C (Doultani et al., Reference Thomä-Worringer, Sorensen and Lopez-Fandino2003). After the acidic hydrolysis, it was mixed with the 8% trichloroacetic acid (TCA) and 2.5% Na2SO4, and then centrifuged at 5000 × g for 1 h. Two mobile phases of A (10 mm Na2HPO4, and 10 mm Na2B4O7 at pH = 8.2) and B (mixture of 45% acetonitrile, 45%methanol, and 10% water v:v:v) were used along with derivatization process to detect Phe in HPLC. This process is the sequential injections of 20 μl of borate buffers, o-phthalaldehyde (OPA), fluorenylmethyl-chloroformate (FMOC) reagents, and the proposed sample. Furthermore, the derivatization step along with OPA/FMOC was performed to analyze and separate the Phe of each sample by using RP (reverse-phase)-HPLC/fluorescence system. The RP was used to remove the impurities of each sample with a volatile solvent and dehydrate it under a vacuum centrifuge (Wahl and Holzgrabe, Reference Wahl and Holzgrabe2016).
Statistical analysis
The Standard Statistical Package was used to perform the necessary analysis of variances for the contents of GMP-A, GMP-B, and different resistances occurred after UF-1 and UF-2. The Tukey method was used to compare the means of recovery and purity of two GMP variants. Additionally, correlation coefficients were calculated to estimate the relationship between permeate flux and its operation time for each experiment for the two stages of UF-1 and UF-2.
Results and discussion
Pretreatment and ultrafiltration of WPS
After performing this study, only TRT-TRT could recover >95% of the GMPs from WPS and produced significantly (P < 0.05) higher yields of the GMP-A (1.22 g/l) and GMP-B (4.99 g/l) in comparison with other experiments (Table 1). When the WPS in the TRT-TRT experiment was mixed (at 150 RPM for 30 min) after its acidification, its original pH gradually decreased from 6.7 to a uniform of 2.2, and stronger electrostatic bonds were made between the two variants of GMP. Because the self-assembling of casein macro-peptides in WPS is highly pH-dependent (in an acidic environment), it needs considerable time for gel formation as described by Farías et al. (Reference Farías, Martinez and Pilosof2010). Additionally, the neutralization of first permeate (as a feed solution of UF-2) with similar mixing conditions caused the gel-structure of the two GMPs (formed in TRT-TRT) to disassemble (return to their original bulky structure) and remain in the UF-2 retentate.
Separate concentrations of GMP-A and GMP-B, total, yield recovery (%), purity (%), and phenylalanine (Phe) contents in the feed and UF-2 retentates of four experiments after acidification, alkalization along with or without mixing-pretreatment*

*All values are average of three replicates with ± 95% CI (confidence interval), and the numbers with the various superscripts (a, b, and c) in each column are significantly (P < 0.05) different.
**The contents of GMP-A and GMP-B, their purities, and phe concentrations in the feed and UF-2 retentates of four experiments were measured by HPLC analysis.
***The calculated yield of feed or retentate of each experiment was based on the percentage of total GMPs, which was 13 g/l in the original whey protein solution (WPS). Since the recovered of two variants of GMPs in retentate of T3 was 6.214 g/l obtained from the 50 g of WPC (or 12.428 g/l in 100 g WPS), therefore, the yield was >95%.
****Different superscripts for each column shows the significant higher yield of two (A&B) variants of GMP for treatment T3 in comparison with other treatments.
It is interesting that decreasing or increasing the stirring rate or time of feed solution before UF-1 and UF-2 did not increase the GMPs' yield significantly. Luo et al. (Reference Luo, Morthensen, Meyer and Pinelo2014) used different mixing rates of 50, 150, and 200 RPM for enzymatic separation of sialic acid from casein glycolmacropeptide, and stated that stirring at 50 RPM increased the GMPs' aggregations more than those in 150 and 200 RPM. Lieske et al. (Reference Lieske, Konrad and Kleinschmidt2004a, Reference Lieske, Konrad and Kleinschmidt2004c) reported that the short blending time of acidified WPS retards the GMP-A formation (due to de-glycolization), and reduce the yield of mixed GMPs <45%. On the other hands, higher yield for only GMP-B was obtained when researchers used a long-time (few hours) reaction time without stirring (Farías et al., Reference Farías, Martinez and Pilosof2010).
Since the TRT-CON and CON-TRT experiments did not have the two necessary mixing treatments respectively before the UF-2 and UF-1, the GMP yields and purity in their UF-2 retentates increased to some extent due to their partial glycolyzations and transformation (Table 1). Even though the feed solution CON-CON experiment was acidified and neutralized respectively before UF-1 and UF-2 (similar to other experiments), its GMPs yield was very low, mainly because its original GMPs' structure did not change and could not pass the membrane of UF-1.
Researchers used two stages of ultrafiltration for whey solution to obtain higher yield of GMPs, but they did not get the expected yield due to the insufficient stirring and reaction time (Kawasaki et al., Reference Kawasaki, Kawakani, Tanimoto, Dosako, Tomizawa, Kotake and Nakajima1993). Different chemical reactions take place because of mixing rate and times after acidification and neutralization, which are explained in online Supplementary Fig. S2 Description II. Overall, it is concluded that the monomers of GMP-A and GMP-B require appropriate mixing rate and reaction time for dimer, tetramer and polymer formation between the two (A&B) variants of GMPs after acidification and depolymerization process after neutralization as confirmed by Kreuß et al. (Reference Kreuß, Strixner and Kulozik2009), primarily because their complete glycosylation can convert them to amphiphilic (possessing both hydrophilic and lipophilic) form (Tolkach and Kulozik, Reference Tolkach and Kulozik2005). The results obtained for the TRT-TRT experiment proved that the mixing conditions (150 RPM for 30 min) were appropriate for gaining high yield and purity for the two forms of GMPs (Table 1).
Membrane permeability and resistances
The permeate flux of all experiments dropped with the operation time (from 0.005 to 0.001 kg/m2, s) in UF-1 and UF-2 due to the unsteady state conditions and concentration polarization of large particles (at the membrane surface) in the first 5 min (Fig. 1). However, their trends smoothly declined with power-law (Y = aX −b) models both in UF-1 and UF-2. Since most of the GMPs of WPS in CON-CON experiment remained in membrane of the UF-1 (without self assembling process), its permeate did not have enough flow for the UF-2, and its flow rate stopped before 40 min. On the other hand, the gel form of GMPs in the first permeate of TRT-TRT experiment converted to a bulky structure after neutralization and remained in the UF-2 retentate. Although the molecular mass of GMP-A (9.6~kDa) and GMP-B (6.7–6.8 kDa) available in WPS (Mollé and Léonil, Reference Mollé and Léonil2005) were much lower than the pore-sizes of 20 K PES membrane, they could not pass through the membrane's channels easily at the neutral pH (~6.5) in UF-1, most probably because they were not in chain structures (possibly in clustered or agglomerated forms). However, when the primary and secondary structures of GMP-A and GMP-B in TRT-TRT experiment made polymers with MWCO of 45–50 kDa, they could pass through the same membrane along the permeate because of their flexibile and glycoside structures as confirmed by Mikkelsen et al. (Reference Mikkelsen, Frøkiaer, Topp, Bonomi, Iametti, Picariello and Barkholt2005) and Lieske et al. (Reference Lieske, Konrad and Kleinschmidt2004b). The polymers of macromolecular compounds (such as GMPs) are created in the first few minutes of membrane filtration in protein solutions (Razavi et al., Reference Razavi, Mortazavi and Mousavi2003). Because the pretreatments of feed solution in UF-1 and UF-2 for other experiments were not complete, most GMPs were adsorbed onto the surfaces and/or within membrane pores or remained in the UF-1 retentate.
UF-1 permeate flux using WPS as a feed (a) and UF-2 permeate flux using first permeate as a feed (b) with 20 K pore sizes of PES membrane for TRT-CON, CON-TRT, TRT-TRT, and CON-CON experiments. In UF-1, there was a linear relationship between operation time and permeate flux after first 5 min unsteady state conditions. However, the trends of permeate flux in UF-2 changed from linear to exponential format. Equations of y(CON-TRT) = 0.0182x −0.288 (R 2 = 0.9602), y(TRT-TRT) = 0.0142x −0.21 (R 2 = 0.8951), y(TRT-CON) = 0.0164−0.142 (R 2 = 0.9728), and y(CON-CON) = 0.0271x −0.319 (R 2 = 0.9419).

It is notable that α-lactalbumin and β-lactoglobulin of whey proteins with MWCO of respectively 14.2 and 18.3 kDa, could not pass the 20 K PES membrane, probably because their bulky structures did not change to an elastic form during the self-assembling process. Additionally, our HPLC analysis could not detect these compounds in the UF-2 retentate of TRT-TRT experiment.
Table 2 and online Supplementary Fig. S3 show the reversible and irreversible resistances of the four experiments for UF-1 and UF-2. While the cake resistance of TRT-TRT (~56.1 × 10¹², m−1) was significantly (P < 0.05) lower than TRT-CON and CON-TRT after the UF-1 stage, its reversible (~40 × 1012, m−1) and total resistances (~110 × 1012, m−1) were significantly higher than other treatments. The cake layer is a dominant resistance to ultrafiltration when the particles' molecular weights are bigger than the membrane's pore sizes (Huang et al., Reference Huang, Gu, Xiao, Qu, Yu and Wei2020). This shows that the cake layers of TRT-CON and CON-TRT were probably due to the accumulation of large protein molecules (such as serum albumin and immunoglobulins) together with GMPs of WPS on the membrane of UF-1.
The resistance values obtained after running WPS through the two sequential UF-1 and UF-2 for the TRT-CON, CON-TRT, TRT-TRT, and CON-CON experiments through the 20 K pore-sizes of PES membrane

*The magnitudes and units of Rr, Ri, Rc, and Rt are multiplied by 1012, m−1.
**Although the overall resistances of TRT-TRT is equal to those for CON-TRT, its reversible resistance in UF-1 is significantly (P < 0.05) higher than those in CON-TRT.
The high content of reversible resistance in TRT-TRT confirmed that the combined polymers of GMPs had high rejection (or concentration polarization) and could pass along with permeate in UF-1. Conversely, the irreversible resistance of TRT-TRT (~7 × 10¹², m−1) in UF-2 was significantly (P < 0.05) higher than other experiments. This result shows that the macromolecular protein of GMPs returned to their original bulky form (due to neutralization) and could not pass through UF-2 membrane (Table 2). While the initial WPS was not clear and had different forms of turbid proteins, the UF-2 retentate of TRT-TRT experiment was very clear (online Supplementary Fig. S4) and, based on HPLC analysis, had mainly two forms of soluble GMP-A and GMP-B. This is another reason that the total resistances of TRT-TRT in UF-1 and UF-2 were higher than other experiments.
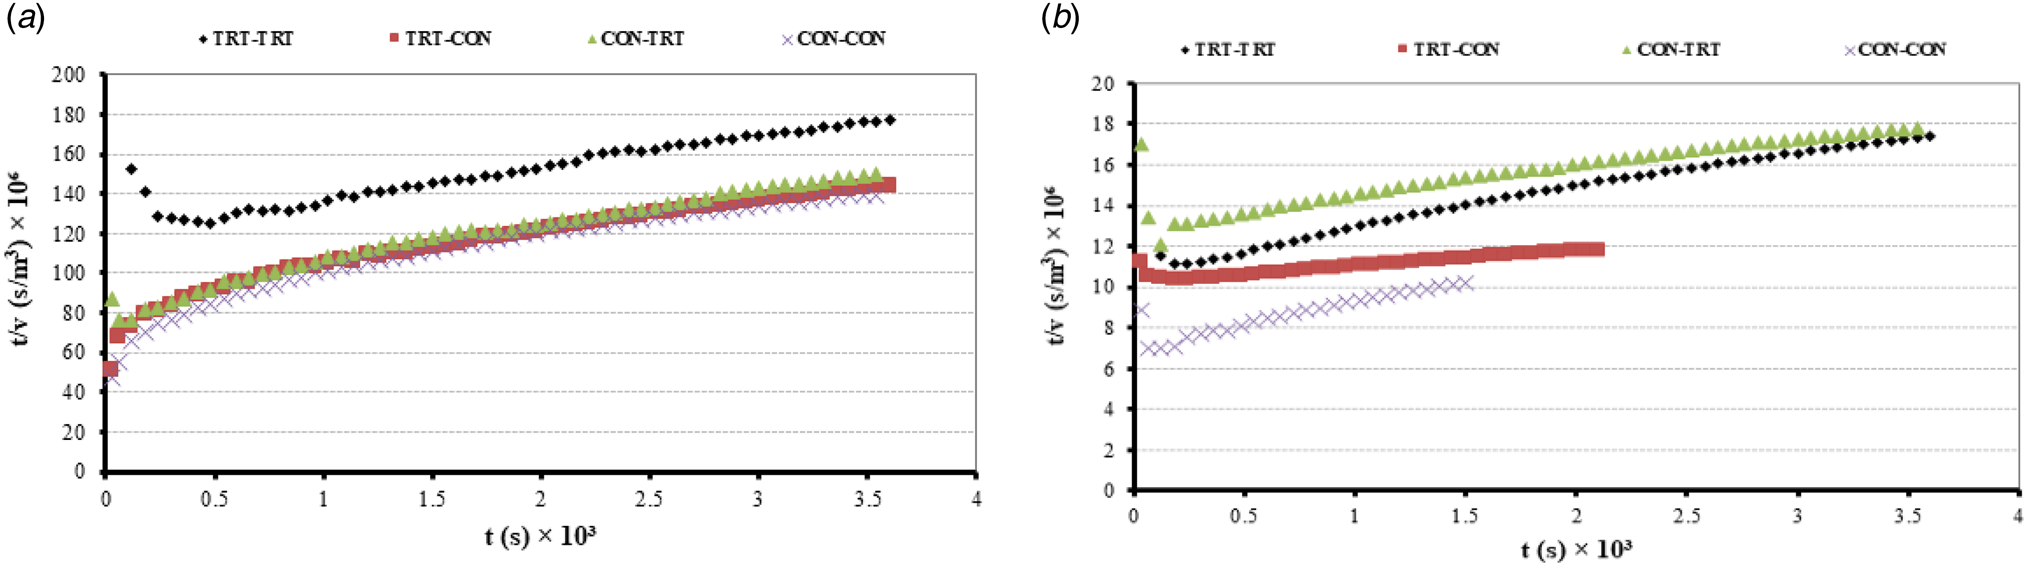
Based on Eq. (8), the relationship between fouling (i) indices and times of permeate production for each experiment during the UF-1 and UF-2 stages were calculated and then plotted as online Supplementary Fig. S5. The average fouling index in UF-1 and UF-2 for each experiment respectively were ~1.5 and 2.5 (if we ignore the first 5 min unsteady state conditions of permeate in UF-1). According to Hermia's model (Mah et al., Reference Mah, Chuah, Cathie-Lee and Chai2012; Huang et al., Reference Huang, Gu, Xiao, Qu, Yu and Wei2020), a linear relationship existed between t/v vs. t because the average of i was equal to 1.5 in UF-1. The two plots for UF-1 and UF-2 were prepared to determine the dominant fouling mechanism for each experiment after running UF-1 and UF-2 (Fig. 2). Since the TRT-TRT (in UF-1 and UF-2) had the highest correlation coefficients among the four experiments, it can be concluded the protein compounds of WPS with MWCO equal to pore sizes of PES membrane = 20 K (like α-lactalbumin, β-lactoglobulin) made complete and highest blocking (or fouling) in the UF-1 for TRT-TRT experiment. Even though the low molecular weights (<0.2 kDa) of free amino acids (including phenylalanine, glutamine, and asparagine) in acidic pH of WPS were much smaller than the membrane pore sizes, they could not pass with the UF1-permeate and made noticeable standard blocking on its membrane. The soluble amino acids of WPS were attached to the pores' wall in the membrane of UF-1 regardless of the mixing treatment in each experiment. Huang et al. (Reference Huang, Gu, Xiao, Qu, Yu and Wei2020) reported this matter when trying to concentrate the protein of whey solution by ultrafiltration. The membranes of CON-TRT and TRT-TRT had much lower resistances than those in TRT-CON and CON-CON because their blocking times were 100% more than TRT-CON and CON-CON experiments (online Supplementary Fig. S5). Consequently, the three fouling mechanisms of cake blocking, complete blocking and standard blocking of TRT-TRT were more than the other experiments during the two stages of UF-1 and UF-2. This means that the PES membranes were quite efficient in recovery of pure GMPs from WPS within the UF-1 and UF-2, when proper acidification, neutralization and pretreatent of mixing was performed.
Relation of t/v vs. t (time) in the UF-1 (a) and UF-2 (b) for the four experiments of TRT-CON, CON-TRT, TRT-TRT, and CON-CON. Linear relationships were generated between t/v and operation time in all experiments during UF-1 and UF-2. However, the highest linear correlations (R 2 = 0.9897) was belong to the TRT-TRT experiment in two stages of ultrafiltration.
HPLC analysis of GMP-A, GMP-B, and phe in the feed and UF-2 retentate
The retention times of mixed GMPs and two separated peaks of GMP-A and GMP-B obtained from the HPLC analysis of whey protein powder (WPP) were very similar to those that resulted from the analogous evaluation of the standard powder of glycomacropeptides (SPGMP) (Fig. 3). The slope (S) and standard deviation (σ) obtained from the calibration curve of SPGMP were 5.43 and 0.0258 g/l, respectively (online Supplementary Fig. S6). Since the LOD (limit of detection) and LOQ (limit of quantification) are respectively equal to 3.3σ/S, and 10σ/S (Separation Science HPLC Solutions, 2022), the low values of LOD (<0.02) and LOQ (<0.05 g/l) confirmed the high precision of SPGMP analysis in this study. Figure 3a and b show two peak heights of combined variants (A&B) of GMPs obtained from separate HPLC analysis of the SPGMP and WPP, when they were dissolved with similar solutions, concentations, and without any other treatments. When the prepared solutions of SPGMP and whey protein powder were treated separately and analogous to TRT-TRT experiment (but without UF-1 and UF-2), the HPLC analysis showed the two distinct peaks of GMP-A and GMP-B respectively with their retention times of around 1.992 and 3.81 min (Fig. 3c and d). These results confirmed the availability of the combined GMPs in WPS after complete glycolysis.
The HPLC-chromatograms obtained from separate solutions of standardized powder of glycomacropeptides (SPGMP) and whey protein powder (WPP) with similar concentrations. (a) and (b) show the combined GMP-A & GMP-B obtained after removing the impurities of SPGMP and WPP (by dissolving in TCA). Figure c and d show the separate chromatograms of SPGMP and WPP when their resulting clear-solutions separately treated parallel to TRT-TRT experiment (but without UF-1 and UF-2). It is interesting that the retention-time ranges and peak heights of the combined and separated GMP-A and GMP-B (obtained from the SPGMP and whey protein) were very close to each other's.

While the HPLC peaks of the whey protein (dissolved in 8% TCA) showed its two separate peaks of GMP-A and GMP-B, the HPLC of precipitated form of WPS (dissolved only in a high concentration of TCA) showed that they were shifted to longer residence times (instead of 2–4 min for two GMPs), which indicated the presence of other protein materials. Although the residence times of α -lactalbumin (MW = ~14 kDa) and ∝-lactoglobumin (~17 kDa) are far beyond the two GMPs and they are respectively in ranges of 19.2–20.6 and 25–27 min (Lieske et al., Reference Lieske, Konrad and Kleinschmidt2004b), our HPLC analysis did not show any peak regarding these compounds in UF-2 retentates of the tested experiments. This means that the combined form of protein and lactose could not pass the UF-1 membrane.
Figure 4 shows the HPLC chromatograms for the two GMPs extracted from the UF-2 retentate of each experiment. As Figure 4c shows the retention times of GMP-A (2.033) and GMP-B (3.81 min) found in UF-2 retentate of TRT-TRT experiment were very similar to those obtained from the HPLC analysis of WPP and STGMP (Fig. 3c and d). Since the peak height of TRT-TRT experiment emerged at 2 min retention time, the glycolyzed form of GMP had considerable soluble carbohydrate. However, in the CON-CON experiment, only the peak of solubilized GMP-B, which had very low glycosylation appeared in HPLC analysis.
The HPLC peaks of GMP-A and GMP-B obtained from the retentate of UF-2 for each experiment of TRT-CON, CON-TRT, TRT-TRT, and CON-CON. The labelled number in each HPLC analysis shows its peak height retention-time (min). The peak points of GMP-A and GMP-B in T3 were very close to those specified for GMP-A and GMP-B in the standard solutions of SPGMPs and WPC (Figs. 3c and d).
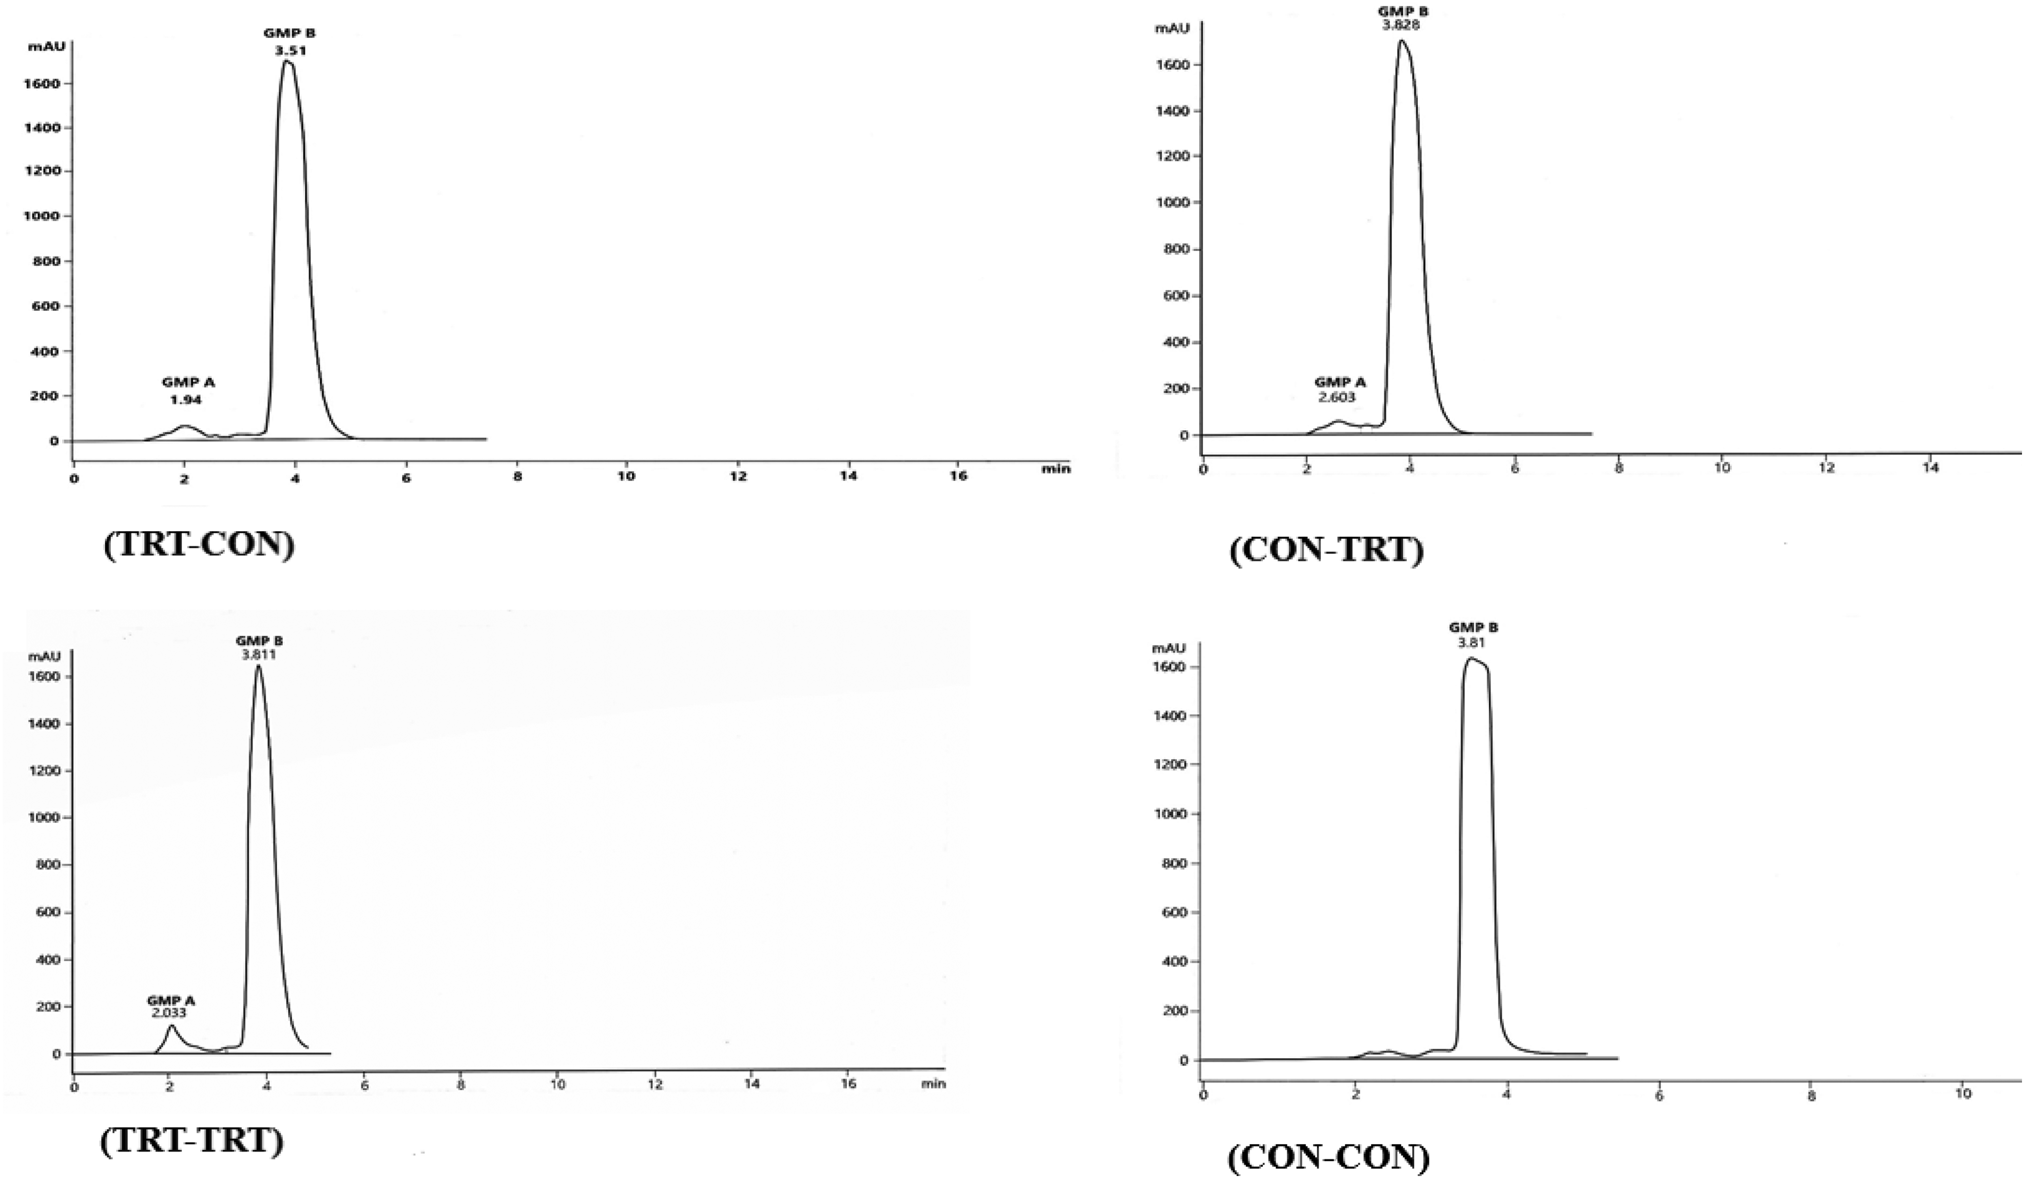
Figure 5 shows the retention time and peak height of Phe in each sample obtained from the reversed phases of HPLC, which was consistent with the report of Taylor and Woonton (Reference Taylor and Woonton2009). As Figure 5 reveals the Phe chromatograms of each UF-2 retentate (in terms of retention time and peak height) was very similar to its standard solution. Since the standard deviation (σ) and slope (S) resulted from the phe calibration curve of the standard solution (online Supplementary Fig. 6b) were 0.034 g/l and 4.42, the low values of LOD (<0.03) and LOQ (0.09 g/l) showed the high precision performed for Phe measurement in each experiment.
The peaks of phenylalanine obtained from its standard solution and retentates of UF-2 for the four experiments of TRT-CON, CON-TRT, TRT-TRT, and CON-CON. The retention times of Phe in TRT-TRT experiment was completely equal to its standard solution (24.731 vs. 24.720 min as retention time).

The Phe content of UF-2 retentate (end product) of each experiment was <10 ppm (Table 1). However, the content of this amino acid in WPS (pretreated similar to TRT-TRT experiment but without ultrafiltration) reached to >2000 ppm (see Table 1). In other words, the prescribed pretreatments of WPS should be combined with sequential ultrafiltration to minimize this compound in the retentate of UF-2 (as a final product). As it was mentioned before, the soluble Phe of WPS was attached to the pores' wall in the membrane of UF-1 in each experiment (with or without the mixing pretreatment). The results of Phe contents in different experiments indicated that the ultrafiltration process of WPS was extremely effective for eliminating its high content of phe (>2000 ppm) to very low level of <10 ppm (99.5% reduction).
In conclusion, our results have confirmed that there is a good potential to separate the mixed variants (A&B) of GMPs from whey protein complex efficiently (>95% yield and >99% purity) using a straightforward mixing treatment prior to each of two ultrafiltration steps. Although the molecular mass of GMPs amplified to 45–50 kDa due to acidification and mixing, they could pass the 20 ka pore size PES membrane very easily due to the formation of highly flexible polymers. The HPLC analysis confirmed the presence of these GMPs in UF-2 retentate of this experiment which were similar (in terms of retention time) to those found in standard powder of GMP and whey protein. More importantly, performing acidification and sequential ultrafiltration of WPS could reduce its high levels of phenylalanine to <12 ppm. Overall, the results of this study confirmed our original and predicted hypothesis.
Supplementary material
The supplementary material for this article can be found at https://doi.org/10.1017/S0022029922000632.
Acknowledgements
The authors are thankful to Mr. Dariush Mohammad Rezaei (Manager of Modern Green-World Company) for supplying facilities and guidance concerning the membrane system, and Mr. Mostafa Bashash (Director of PBDG Research Institute), for his cooperation in HPLC analysis of different samples.


 Open access