


Introduction
From 1972 to 2018, the Greenland ice sheet experienced a decrease in mass, contributing to a sea-level rise of 13.7 ± 1.1 mm (Mouginot and others, Reference Mouginot2019). Approximately 60% of the ice-sheet mass loss since 2000 can be attributed to the increasingly negative surface mass balance owing to the warming trend of the atmosphere over Greenland (Enderlin and others, Reference Enderlin2014; van den Broeke and others, Reference van den Broeke2016). Accordingly, since 1992, fresh water runoff from the Greenland ice sheet has increased by 16.9 ± 1.8 km3 a−2 (Bamber and others, Reference Bamber, van den Broeke, Ettema, Lenaerts and Rignot2012; Ahlstrøm and others, Reference Ahlstrøm, Petersen, Langen, Citterio and Box2017). Glaciers and ice caps located along the coast of Greenland are also affected by atmospheric warming. Reportedly, for the period 2003–08, the mass loss of the peripheral glaciers and ice caps in Greenland was −28 ± 11 Gt a−1 (Bolch and others, Reference Bolch2013). Given that glaciers and ice caps are located at relatively low elevations, they are sensitive to recent atmospheric warming trends in coastal regions (Mernild and others, Reference Mernild2011; Hanna and others, Reference Hanna, Mernild, Cappelen and Steffen2012).
An increase in meltwater runoff from the Greenland ice sheet, glaciers and ice caps poses a serious threat to the local communities. In the summer of 2012, there was an increase in the discharge from the Watson River, which is an outlet of the Kangerlussuaq sector of the ice sheet in central western Greenland, resulting in a washout and the destruction of the Watson River Bridge on 11 July 2012 (Mikkelsen and others, Reference Mikkelsen2016; van As and others, Reference van As2017). Additionally, on 12 July 2012, the Greenland ice sheet experienced an extreme melt event in which surface melt covered up to 98.6% of the ice sheet (Nghiem and others, Reference Nghiem2012). It has been suggested that this melt event was responsible for the disaster that was observed at Watson River (Mikkelsen and others, Reference Mikkelsen2016; van As and others, Reference van As2017).
Floods caused by glacial discharges have also occurred in northern parts of Greenland. On 21 July 2015 and 2 August 2016, in the Qaanaaq region in northwestern Greenland, the outlet stream of Qaanaaq Glacier flooded. Qaanaaq Glacier is an outlet glacier of Qaanaaq Ice Cap and has, over the past decade, been studied by Japanese scientists (Sugiyama and others, Reference Sugiyama2014; Machguth and others, Reference Machguth2016; Tsutaki and others, Reference Tsutaki, Sugiyama, Sakakibara, Aoki and Niwano2017; Takeuchi and others, Reference Takeuchi2018). The flooding of this glacial stream resulted in the destruction of a road linking the settlement of Qaanaaq to Qaanaaq Airport (Fig. 1). Since the establishment of Qaanaaq Airport in 1991, three similar incidents have been recorded – in 1997, 2001 and 2009 (personal communication from K. Petersen, 2018). The floods in 2015 and 2016 destroyed the road which had been reinforced after the previous events, thus we presume that the flood magnitude was greater than those in 1997–2009. Based on existing literature, hydrological monitoring has never been performed in this outlet stream and the discharge parameters associated with the flooding events that occurred are still unknown. Therefore, to monitor and/or forecast similar or even more severe events in the future, investigations are necessary.
Aerial photograph of the destruction of the road linking the settlement of Qaanaaq to Qaanaaq Airport by the outlet stream from Qaanaaq Glacier. (Photograph was taken on 3 August 2016, from a helicopter).

Glacier hydrology is linked to flood prevention, hydroelectric power generation, water resource assessment and glacier mass balance. Considering the various studies on temperate glaciers in alpine settings (e.g. Moore, Reference Moore1993; Hock and Noetzli, Reference Hock and Noetzli1997; Verbunt and others, Reference Verbunt2003; Zhang and others, Reference Zhang, Liu and Ding2007; Fujita and Sakai, Reference Fujita and Sakai2014; Bravo and others, Reference Bravo, Loriaux, Rivera and Brock2017), relatively few have focused on glaciers and ice caps in Greenland (Bøggild and others, Reference Bøggild, Knudby, Knudsen and Starzer1999; Liston and Mernild, Reference Liston and Mernild2012). Given the remoteness of Greenland and its harsh environment, river discharge measurements in this area are scarce (Rennermalm and others, Reference Rennermalm2012; Hasholt and others, Reference Hasholt, Mikkelsen, Nielsen and Larsen2013; van As and others, Reference van As2017). Previous glacier runoff modeling in Greenland primarily focused on the southwestern part, owing to the limited river discharge time series that are available. Sustained efforts (Hasholt and others, Reference Hasholt, Mikkelsen, Nielsen and Larsen2013; van As and others, Reference van As2017) provide highly accurate long-term discharge data for Watson River and can be used for a better understanding of surface mass balance and ice-sheet hydrology (Mikkelsen and others, Reference Mikkelsen2016; Mernild and others, Reference Mernild, Liston, van As, Hasholt and Yde2018). Compared to southern Greenland, very few studies have been conducted on glacial runoffs in northern Greenland (Mernild and others, Reference Mernild, Hasholt and Liston2008).
Glaciers and ice caps located in Greenland and other Arctic are characterized by ice temperatures that are lower than the pressure melting point (Blatter and Hutter, Reference Blatter and Hutter1991; Curffey and Paterson, Reference Curffey and Paterson2010). Given that the ice is impermeable, glacial meltwater runs on the surface of the glacier rather than draining into the glacier bed (Hodgkins, Reference Hodgkins1997; Irvine-Fynn and others, Reference Irvine-Fynn, Hodson, Moorman, Vatne and Hubbard2011). Therefore, surface processes play a central role in the seasonal and short-term patterns of glacier discharges in Greenland. Particularly, the retention and refreezing of meltwater within snow layers control the magnitude and timing of the runoff (Hodgkins, Reference Hodgkins1997). Despite the importance of glacier surface hydrology and glacier discharge in rapidly changing coastal environments in Greenland, studies of the link between the two are scarce.
Motivated by the flood events that occurred in 2015 and 2016, in this study we investigate the discharge of the outlet stream from Qaanaaq Glacier. Based on field observations between 2016 and 2019, we developed a numerical model to quantify the discharges during the 2015 and 2016 floods. The model was also used to forecast glacial discharges under warming atmospheric conditions.
Study site
Qaanaaq Ice Cap is located in northwestern Greenland (77°28′ N, 69°14′ W) and covers an area of 289 km2 at an elevation between 30 and 1110 m a.s.l. (above sea level) (Sugiyama and others, Reference Sugiyama2014), as shown in Figures 2a and b. Qaanaaq Glacier is one of the outlet glaciers of this ice cap that flows southwestward and terminates on land at 190 m a.s.l. (Fig. 2c). The mean equilibrium line altitude of the glacier over the 2012–16 period was 910 m a.s.l. (Tsutaki and others, Reference Tsutaki, Sugiyama, Sakakibara, Aoki and Niwano2017). The glacial meltwater drains into an outlet stream that intersects a road before emptying into the ocean (Fig. 2c). This road connects Qaanaaq Village and Qaanaaq Airport; thus, it is an important part of the infrastructure for the ~600 residents of this village and its visitors. Based on a digital elevation model provided by the Greenland Ice Mapping Project (Howat and others, Reference Howat, Negrete and Smith2014), the outlet stream has a catchment area of 11 km2, of which 78% is covered with the glacier (Fig. 3). The glacier area below 700 m a.s.l. is relatively small (i.e. 17% of the total glacier area), because it narrows into valley geometry.
(a) Landsat 8 OLI image (24 July 2017) showing northwestern Greenland, including the Qaanaaq region. The inset shows the location of the Qaanaaq region in Greenland; the red box indicates the area shown in (b). (b) Sentinel-2 image of Qaanaaq Ice Cap (21 August 2018); the red box indicates the area shown in (c). (c) Sentinel-2 image of the study site (21 August 2018), showing the locations of the weather stations (♦), discharge measurement sites (+) and surface melt and snow survey sites (•).

Hypsometry of the catchment area of the outlet stream from Qaanaaq Glacier partitioned into glacier-covered (black) and ice-free (white) areas.

Since 2012, Japanese research groups have been conducting in situ studies on Qaanaaq Glacier. Sugiyama and others (Reference Sugiyama2014) carried out glaciological observations and reported melt rates, ice velocity and ice thickness along the flowline. Tsutaki and others (Reference Tsutaki, Sugiyama, Sakakibara, Aoki and Niwano2017) reported near-surface ice temperature, as well as surface mass balance and ice velocity measured from 2012 to 2016. Aoki and others (Reference Aoki, Matoba, Uetake, Takeuchi and Motoyama2014) installed an automatic weather station on the ice cap in 2012 (SIGMA-B in Fig. 2c) and it has been operational since then. Qaanaaq glacial microbes and their influence on glacier melt have also been studied (Uetake and others, Reference Uetake2016; Takeuchi and others, Reference Takeuchi2018). Darkening resulting from microbial activity reduces ice surface albedo and enhances surface melt on the ice cap (Sugiyama and others, Reference Sugiyama2014). To quantify the surface elevation change of ice caps in this region, satellite-based research was conducted (Saito and others, Reference Saito, Sugiyama, Tsutaki and Sawagaki2016) and the results indicated that the mass-loss rate of Qaanaaq Ice Cap was 1.8 ± 0.1 m a−1 between 2007 and 2009.
During the summer months (June, July and August) of the 2016–19 period, glaciological observations were performed on Qaanaaq Glacier at six survey sites covering the glacier snout up until the accumulation area, from an elevation of 243–968 m a.s.l. (Fig. 2c) and the discharge of the outlet stream was measured during the summer months of 2017–19.
Methods
Field measurements
Glacier surface melt
Snow and ice melt measurements on Qaanaaq Glacier were conducted by utilizing six aluminum poles installed at 243, 427, 584, 739, 839 and 968 m a.s.l. (Fig. 2c). Since 2012, mass balance and ice velocities are also available at these sites (Sugiyama and others, Reference Sugiyama2014; Tsutaki and others, Reference Tsutaki, Sugiyama, Sakakibara, Aoki and Niwano2017). The poles were drilled into the snow or ice surface using a mechanical ice drill (Kovacs Enterprise) attached to an electric drill driver (Makita HR262DRDX). Surface melt and snow accumulation were inferred by frequent recordings of the surface height at temporal intervals of 1–14 days from 12 June to 2 August 2017, 6 July to 19 August 2018 and 29 June to 22 August 2019. Conversion of surface height to melt/accumulation in water equivalent was done by assuming ice density of 917 kg m−3 and utilizing measured snow densities that were conducted with a 100 cm3 box-type stainless steel density cutter and an electronic scale.
Proglacial discharge
Outlet stream measurements were performed 1.4 and 2.0 km away from the glacier terminus in 2017 and 2018–19, respectively (Fig. 2c). A pressure sensor (HOBO U20-001-04) was installed in the stream to record water pressure between 21 July and 3 August 2017, 5 July and 18 August 2018, and 27 June and 26 August 2019. The sensor was mounted on an aluminum pole and fixed on the stream floor to measure water pressure at 5 min intervals. After correcting the data for atmospheric pressure variations using data recorded by another sensor exposed to air, the water pressure values were converted to water stage. The accuracy of the pressure sensor was translated to a water depth of ±3 mm.
During the 2017, 2018 and 2019 field observations, the discharge of the stream was measured 6, 15 and 12 times, respectively. For the discharge calculations, water depth and current were measured every 0.5 m across the stream using an electromagnetic current meter (YOKOGAWA ES-7603) at a depth of 60% from the surface, which represents the mean current of a vertical water column. Each measurement was performed for 1 min at each location and the mean current was integrated over the vertical cross section of the stream. The uncertainty of each discharge measurement was 8% based on the method described by Sauer and Meyer (Reference Sauer and Meyer1992).
The water stage observations were used to compute the discharge time series, assuming a power function between the water stage and discharge (Fig. 4). Relationships between water stage and discharge were determined independently for 2017 and 2018/19, given the different locations of the water pressure sensors for the different periods. The discharge uncertainty obtained from the water stage measurements was 9% and 22% in 2017 and 2018/19, respectively (Sauer and Meyer, Reference Sauer and Meyer1992; Rennermalm and others, Reference Rennermalm2012).
Relationships between water stage and discharge of the outlet stream from Qaanaaq Glacier in (a) 2017 and (b) 2018/19. Solid curves, coefficient of determination (R 2) and RMSE represent the results of the power regression analysis of the data. Shaded areas represent the estimated uncertainty ranges.

Meteorological observations
Meteorological observations were recorded from 1 June 2015 to 31 August 2019 by an automatic weather station at SIGMA-B (944 m a.s.l.) (Fig. 2c) (Aoki and others, Reference Aoki, Matoba, Uetake, Takeuchi and Motoyama2014). Air temperature, downward shortwave and longwave radiation, relative humidity, wind speed, atmospheric pressure and ice/snow surface height were recorded with hourly resolution. In this same period, we recorded air temperature and liquid precipitation at the Qaanaaq Village at 68 m a.s.l. (Fig. 2c). The air temperature sensor (T&D RTR-502L) and the rain gauge (Climatec CEM-TBRG) operated from 1 June 2015 to 27 August 2019, recording their respective parameters at the hourly resolution, with accuracies of ±0.3 °C and ±0.2 mm, respectively.
Numerical modeling
A glacier runoff routing model was developed, based on the 2016–19 field observations. The model consisted of a surface energy balance and linear reservoir schemes and was used to compute snow/ice melt and glacier runoff, respectively. Its purpose was to reconstruct the 2015 and 2016 discharges, to better understand the underlying processes that led to the flood events and also to forecast glacial discharges under the atmospheric warming trend in Greenland.
Surface melt model
The surface energy-balance model used in this study was based on equations that are commonly used for snow and ice melt studies (Kondo, Reference Kondo1994; Oerlemans, Reference Oerlemans2001). These formulations have been previously employed in the studies of glacier mass balance (e.g. Fujita and Ageta, Reference Fujita and Ageta2000; Klok and Oerlemans, Reference Klok and Oerlemans2002; Van As, Reference Van As2011; van Pelt and others, Reference van Pelt2012) and glacier runoff (e.g. Liston and Mernild, Reference Liston and Mernild2012; Fujita and Sakai, Reference Fujita and Sakai2014). The energy flux available for melting (H M) was expressed as the residual of the net shortwave radiation (S net), net longwave radiation (L net), sensible heat flux (H S), latent heat flux (H L), conductive heat flux due to rainfall (R) and conductive heat flux from subsurface (G), i.e.,

The energy flux into the glacier was considered to be positive. In this study, given that the contribution of the conductive heat flux from the subsurface and rainfall was relatively small during the melt season, it was ignored (Kondo and Yamazaki, Reference Kondo and Yamazaki1990; Van As, Reference Van As2011). The sensible and latent heat fluxes were estimated using the bulk method and were expressed respectively as follows:


where c p = 1006 J kg−1 K−1 represents the specific heat capacity of air under constant pressure, C S = 0.002 represents the bulk coefficient for snow and ice surfaces proposed based on field data (Kondo and Yamazawa, Reference Kondo and Yamazawa1986; Kondo, Reference Kondo1994) and previously used for glacier runoff modeling (e.g. Fujita and Sakai, Reference Fujita and Sakai2014), l represents the latent heat of evaporation of water (2.5 × 10⁶ J kg−1) when the ice surface is melting (T s = 0°C) or the latent heat of sublimation of ice (2.83 × 10⁶ J kg−1) during freezing (T s < 0°C). U, T s, T a and h r represent wind speed, surface temperature, air temperature and relative humidity, respectively. In Eqn (1), as long as H M > 0, the surface temperature, T s was equal to 0°C. Otherwise, Eqn (1) was solved for T s by substituting H M = 0. The density of air (ρ) and the saturated specific humidity (q) were given by the following equations (Kondo, Reference Kondo1994):


where p and p0 = 1013.2 hPa are atmospheric pressure and its standard value. The saturated vapor water pressure (e) was calculated from air temperature values using Tetens formulation (Tetens, Reference Tetens1930). The net shortwave radiation (S net) and the net longwave radiation (L net) were expressed as:


where S down and L down represent the downward shortwave and longwave radiation, respectively; σ, which represents the Stefan–Boltzmann constant, was equal to 5.67 × 10⁻⁸ W m−2 K−4; and ɛ, which represents longwave emissivity, was assumed to be 1. For the bare ice surface (α i), the surface albedo, α was optimized and the optimization was performed at each pole measurement site within the range α i = 0.2–0.8. To identify the best fit between the computed melt and the observations made in the 2016–19 period, RMSE was minimized; α i = 0.6 was assumed for the upper two poles because of the unavailability of ice surface measurements. The influence of this assumption on melt calculations was insignificant, given that these two poles were mostly snow-covered. The ice surface albedo determined at each pole was linearly interpolated to other elevations, and the albedo of fresh snow (α s(0)) was given by the following equations (Fujita and Sakai, Reference Fujita and Sakai2014):


The lower limit of snow albedo α s(∞) was assumed to be 0.53 (Klok and Oerlemans, Reference Klok and Oerlemans2002). Furthermore, snow albedo, which decreases as a function of time (Kondo and Xu, Reference Kondo and Xu1997; Oerlemans and Knap, Reference Oerlemans and Knap1998), was expressed as:

where t represents the time after snowfall, Δt = 1 h represents the model time step and t* was considered to be 360 h, following Bougamont and others (Reference Bougamont, Bamber and Greuell2005).
The model input variables were air temperature, relative humidity, wind speed, atmospheric pressure, downward shortwave and longwave radiation measured at SIGMA-B at 1 h intervals. The model calculation was performed for the period of 1 June to 31 August in 2015–19. Initial snow depth on 1 June was taken after the glacier observations made each year. The surface energy balance was computed for every hour and for every 100 m elevation band. The air temperature at each elevation band was linearly interpolated from those observed at SIGMA-B and Qaanaaq Village, while wind speed and relative humidity were assumed to be uniform given the relatively small study area (5.5 km from SIGMA-B to the glacier snout).
The surface melt rate, M was calculated in the water equivalent thickness using Eqn (11).

where ρ w and l m represent the density of water (1000 kg m−3) and the latent heat of fusion of ice (3.34 × 10⁵ J kg−1), respectively.
Linear reservoir model
The simulation of the outlet stream discharge was based on a linear reservoir model (e.g. Hock and Jansson, Reference Hock, Jansson, Anderson and McDonnell2005), taking into account the meltwater storage of snowpacks and the refreezing within firn layers or on ice surfaces (Fig. 5). The sum of the glacier surface melt and the liquid precipitation was considered as the input of the reservoir (I).

Schematic representation of the routing model used in this study. S, storage of a linear reservoir; Q, runoff from a linear reservoir; S 0, retention capacity; and k ice and k snow, storage coefficients for ice- and snow-covered surfaces, respectively.

Solid (P s) or liquid precipitation (P r) was distinguished based on the air temperature at each elevation band i.e.,


where P represents the liquid precipitation measured in Qaanaaq Village. The rain-snow threshold temperature was chosen based on previous studies in Greenland (Oerlemans and Vugts, Reference Oerlemans and Vugts1993; Bougamont and others, Reference Bougamont, Bamber and Greuell2005). Outflow from the reservoir (Q) resulted when the volume of the stored water (S) exceeded the retention capacity (S 0), which represents the amount of water stored or refrozen on the glacier surface until the end of the melt season. The discharge from the reservoir was assumed to be proportional to the volume of the stored water that exceeded the retention capacity, with a storage coefficient k.


The stored water volume was given by a volume balance equation, i.e.,

Eqns (15)–(17) were solved forward in time with a time step of 1 h for every 100 m elevation band. The river discharge (Q sum), which represents the sum of the discharge from an elevation band Qi was given by:

Based on a previously reported measurement from Greenland, S 0 in the ablation area was considered equal to 0.1 m (Cooper and others, Reference Cooper2018). In the accumulation area, it was assumed to increase from 0.3 m in 900‒1000 m a.s.l. to 0.5 m in ⩾1100 m a.s.l. as a firn layer thickens up-glacier, based on the superimposed ice thickness observed on Qaanaaq Glacier (Tsutaki and others, Reference Tsutaki, Sugiyama, Sakakibara, Aoki and Niwano2017). The determination of storage coefficient k was based on surface properties, i.e., k land, k ice and k snow for ice-free and ice and snow-covered surfaces, respectively. A smooth transition between k ice and k snow was achieved by introducing a snow depth function, d in the ice–snow transition zone.


To identify the best fit between the modeled and observed discharges in the 2017–19 period, the parameters k land, k ice and k snow were optimized and the optimization was performed within parameter ranges of 5 < k land < 50, 1 < k ice < 15 and 10 < k snow < 70 (h), respectively based on previous studies of similar-sized glaciers (Hannah and Gurnell, Reference Hannah and Gurnell2001; Hock and Jansson, Reference Hock, Jansson, Anderson and McDonnell2005). For parameter tuning and for the evaluation of the performance of the model, the Nash–Sutcliffe coefficient (NSC) (Nash and Sutcliffe, Reference Nash and Sutcliffe1970) was used.
Results
Field measurements
Meteorological conditions
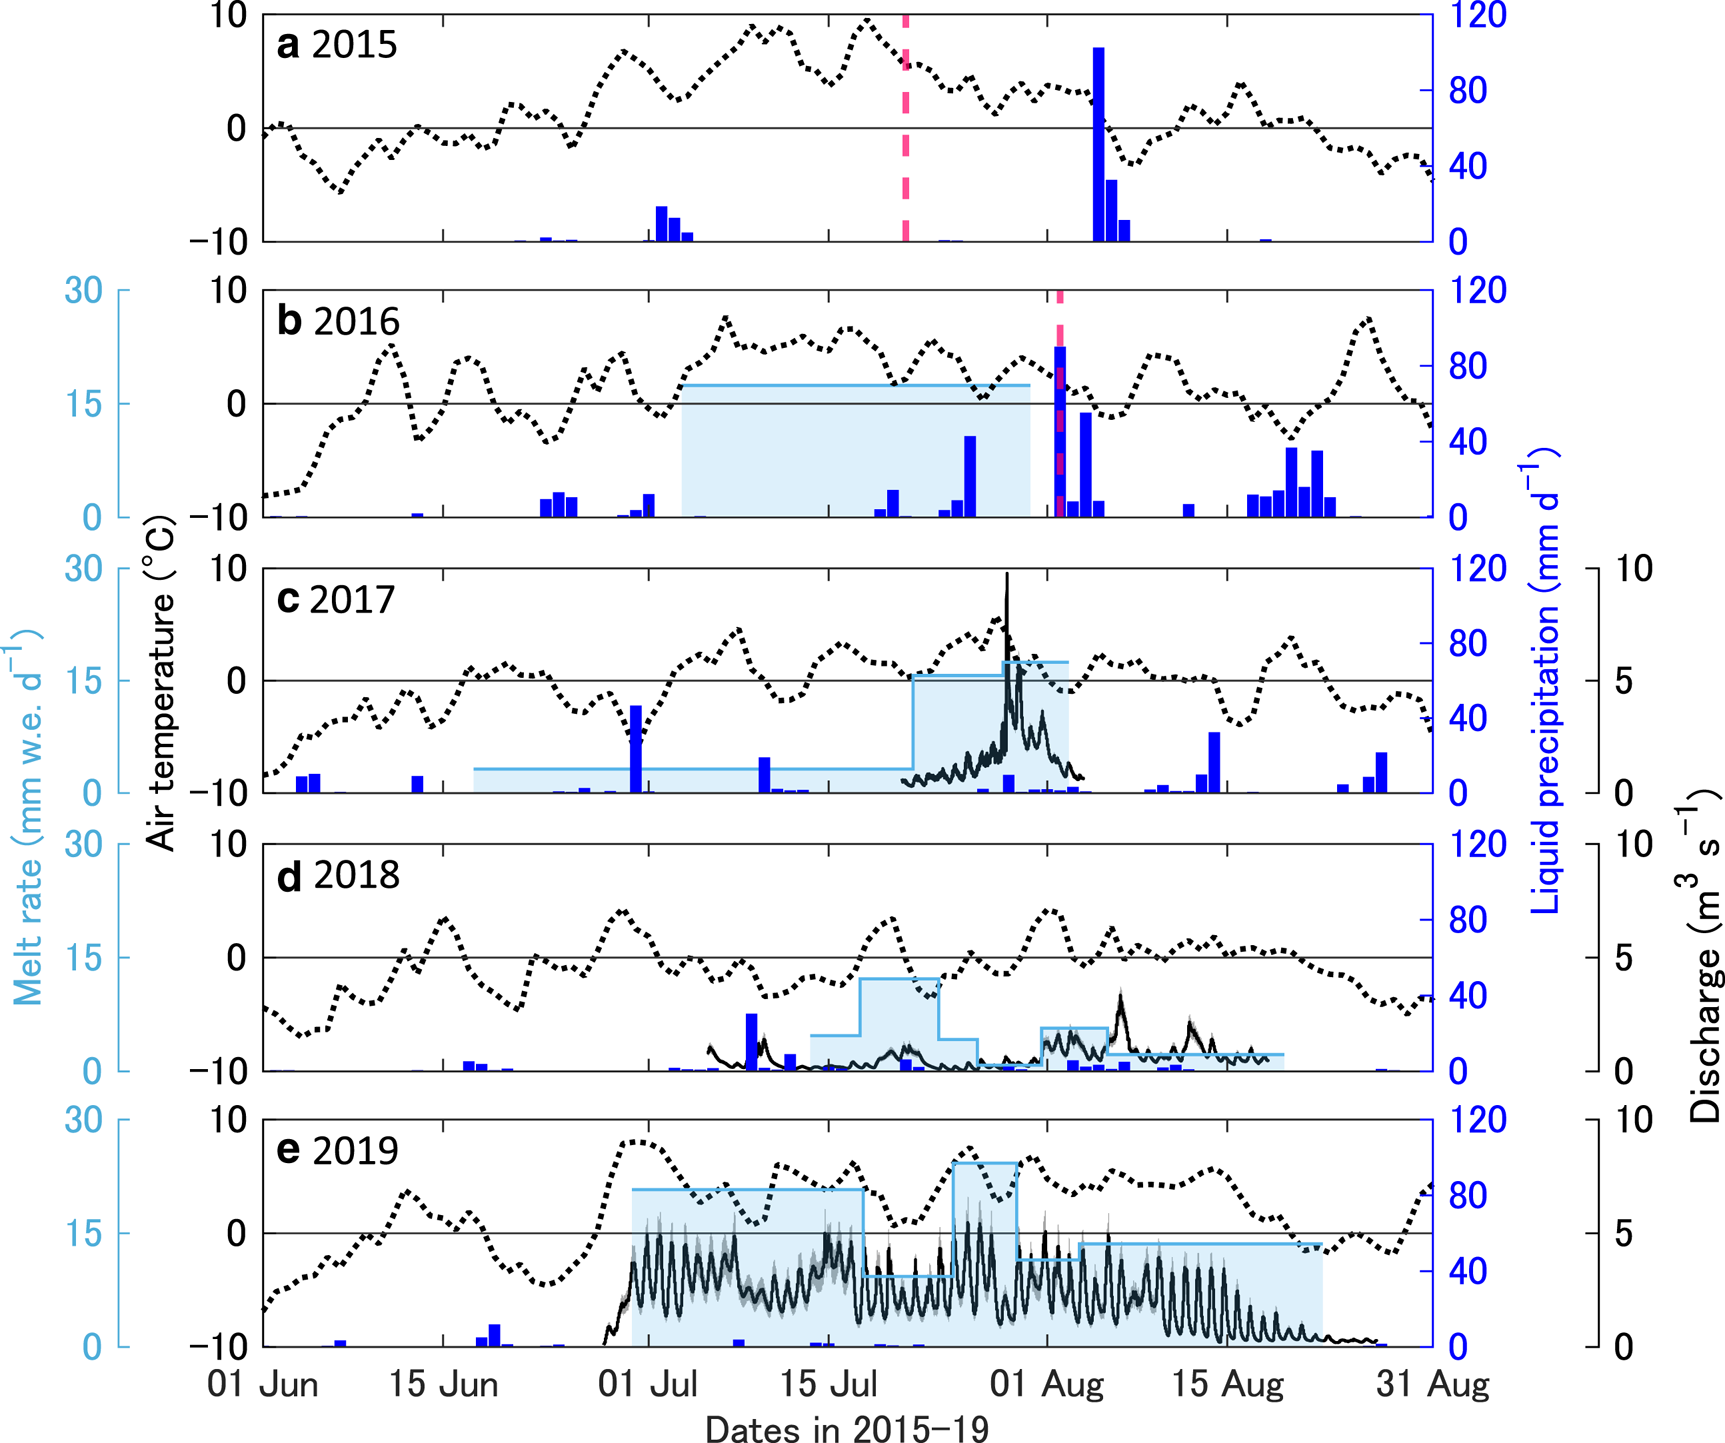
The mean temperatures in summer (June, July and August) at SIGMA-B in 2015, 2016 and 2019 – 1.7, 1.5 and 2.0°C, respectively – indicated remarkably warm atmospheric conditions compared to those observed in 2017 and 2018, which were −0.4 and −1.0°C, respectively (Table 1). As shown in Figures 6a and b, persistent high air temperatures were observed prior to the 2015 and 2016 floods. From 26 June to 5 August 2015, in particular, the daily mean air temperature was consistently above the melting point of ice; over the 5-day period prior to the flood on 21 July, the daily mean temperature was above 5°C and a maximum of 9.5°C was recorded on 18 July, suggesting intensive glacier melt. Similarly, warm conditions were observed before the 2016 flood event. The daily mean temperature was above 0°C from 3 July to 4 August 2016 and a maximum of 7.7°C was observed on 7 July. In addition to the warm conditions, extraordinarily heavy rainfall (90 mm d−1) occurred on 2 August 2016 (Table 1, Fig. 6b), the date of the flood event. The meteorological data showed an even greater amount of precipitation in 2015 (102 mm d−1 on 5 August) as shown in Figure 6a. The mean wind speed in summer ranged from 3.2 to 4.0 m s−1 with the maximum daily wind speed of 14.6 m s−1 observed on 30 July 2017 (Table 1).
Air temperature at the SIGMA-B station (dotted), liquid precipitation at Qaanaaq Village (blue), stream discharge (solid) with uncertainty (shaded gray) and the melt rate of Qaanaaq Glacier at 839 m a.s.l. (light blue) observed during the 2015–19 period. The vertical purple dashed lines in (a) and (b) represent the 2015 and 2016 flood dates.

Maximum and mean daily temperature for the summer months (June, July and August) during the 2015–19 period at the SIGMA-B station on Qaanaaq Glacier. The maximum daily and summer rainfall levels, maximum and mean daily wind speeds are also listed. The dates in brackets represent the event dates.

Melt rate
Significant variations in glacier surface melt were observed for the different years. This is consistent with the abovementioned temperature trends (Figs 6b–e). In 2016, the mean melt rate from 3 July to 30 July, which was one of the most intensive melt periods over the 2016–19 study period, at 839 m a.s.l. was 17.4 mm w.e. d−1 (Fig. 6b). The mean air temperature during this period was 4.2°C. The following year (2017), the melt rate was relatively low (< 4 mm w.e. d−1), except from 21 July to 2 August, when a mean melt rate of 16.6 mm w.e. d−1 was observed under a mean temperature of 2.2°C (Fig. 6c). In 2018, the melt rate was generally lower than that observed in previous years, i.e., <6 mm w.e. d−1 at 0.5°C from 23 July to 19 August as shown in Figure 6d and in 2019, a relatively higher melt rate (15.9 mm w.e. d−1) was observed from 29 June to 22 August (Fig. 6e) and the mean temperature during this period was 4.0°C.
Discharge
During the first week of the observational period in 2017, there was a gradual increase in the discharge, with daily fluctuations (Fig. 6c). However, there was a rapid increase in the discharge on 28 July 2017, which peaked at 9.8 m3 s−1 and was the highest value recorded over the observation period (2017–19) as shown in Figure 6c. In 2018, the discharge was relatively small until the end of July, which was followed by an increase to a peak discharge of 3.4 m3 s−1 on 6 August 2018 (Fig. 6d). In 2019, the discharge was consistently high, and a peak value of 5.5 m3 s−1 was observed on 25 July (Fig. 6e). Additionally, in 2019, the amplitude of the daily fluctuations was significantly greater than those observed in previous years.
It should be noted that our measurements were utilized for validation of daily discharge from all Greenlandic drainage basins estimated from output of two regional climate models (Mankoff and others, Reference Mankoff2020). The comparison of the data from 2017 to 2019 indicated that one of the models (MAR) (e.g. Fettweis and others, Reference Fettweis2017) overestimated the total discharge by 29%, whereas the other (RACMO) (e.g. Noël and others, Reference Noël, van de Berg, Lhermitte and van den Broeke2019) underestimated by 56%. The model performance at the Qaanaaq Glacier basin was relatively poor (NSC = 0.30 for MAR and −0.01 for RACMO). We speculate that the resolution of the climate models was too coarse (7.5 km for MAR and 5.5 km for RACMO) to accurately reproduce discharge from a small basin. We also suspect that a lack of long-term meteorological observations in the Qaanaaq region affected the accuracy of the models.
Numerical modeling
Surface melt
The ice surface albedo was optimized for the observations in the 2016–19 period. For the poles at 243–739 m a.s.l., α i = 0.37–0.75 was considered, resulting in an RMSE = 0.09 m w.e. and a correlation coefficient R 2 = 0.90 between the simulated and observed melt rates (Fig. 7). The optimized ice albedo was particularly low at 739 m a.s.l. (α i = 0.37), where the ice was covered with dark material (Sugiyama and others, Reference Sugiyama2014). The tuned model was used to reproduce the cumulative melt at SIGMA-B during summer (June, July and August) in the 2015–19 period (Fig. 8). The total summer melt obtained in 2015, 2016 and 2019 was greater than that obtained in 2017 and 2018. The total melt in 2019 was 0.98 m w.e., which was 3.9-fold higher than that obtained in 2018 (0.25 m w.e.). In 2015 and 2016, the cumulative melts prior to the flood events were 0.63 and 0.62 m w.e., respectively.
Scatter plot for observed and simulated melt at all observation sites in 2016 (crosses), 2017 (triangles), 2018 (circles) and 2019 (boxes). The dashed line represents the linear regression of the data. Coefficient of determination (R 2) and RMSE between simulated and observed melt rates are given.

Cumulative melt at 950 m a.s.l. simulated using the surface energy-balance model for 2015 (red), 2016 (blue), 2017 (green), 2018 (orange), 2019 (brown); the mean of the 2015–19 data (dashed). Vertical lines represent the dates of the flood events in 2015 (orange) and 2016 (cyan).

The simulated daily melt was compared to the discharge observations shown in Figure 9. The modeled melt rates were substantially greater than the observed discharges for most of the observational period, which was likely due to meltwater retention and refreezing on the glacier. These results indicated the necessity of a linear reservoir model to accurately compute the discharge time series.
Daily discharge measured at the outlet stream from Qaanaaq Glacier (black), daily melt rate simulated using the surface energy balance model (snowmelt, light blue; and ice melt, dark blue) and liquid precipitation observed in Qaanaaq Village (orange).

Stream discharge
Agreement between modeled and observed discharge was greatly improved by introducing the linear reservoir model (Fig. 10). After the optimization of the storage constants (k ice = 4 h, k snow = 55 h and k land = 10 h), the NSC between the runoff routing model and the discharge measurements within the 2017–19 period was 0.71. This value was found to be well above the threshold values proposed for sufficiently accurate hydrological models (Moriasi and others, Reference Moriasi2007). The performance of the model was particularly good in 2017 and 2018 (Figs 10a and b). The RMSEs between the model and the observed measurements for these 2 years were 0.6 and 0.3 m3 s−1, respectively, and in 2019, a higher RMSE was observed (0.9 m3 s−1). The modeled discharge in 2019 underestimated and overestimated the measurements in early July and mid-August, respectively, as shown in Figures 10c and d.
(a)–(c) Simulated (red) and observed (blue) hourly discharge with uncertainty (shaded) within the 2017–19 period. (d) Scatter plot of simulated and observed hourly discharge in 2017 (triangles), 2018 (circles) and 2019 (boxes). The dashed line represents the linear regression of the data. Coefficient of determination (R 2) and RMSE between simulated and observed discharge are given.

The model was applied to the summer months of 2015 and 2016 (Fig. 11). A significant increase in discharge was simulated in the first week of July 2015, owing to the influence of rain (Fig. 11a); for the rest of the month, it was maintained at a high level, i.e. the daily peak discharge never dropped below 2.5 m3 s−1 until the end of the month. The total discharge obtained in July (8.9 × 10⁶ m3) accounted for 73% of the total discharge in the summer of 2015. The daily peak discharge increased progressively, reaching 9.1 m3 s−1 on 21 July, the day of the flood event. According to the model, 75% of the discharge on 21 July originated from ice melt, whereas the rest originated from snowmelt. Additionally, a higher peak discharge of 13.3 m3 s−1 was obtained on 5 August 2015. This event could be attributed to rainwater, which accounted for 62% of the discharge on that day.
Simulated discharge of the outlet stream from Qaanaaq Glacier in 2015 and 2016. The discharge is partitioned into rain (orange), snowmelt (light blue) and ice melt (dark blue). The shaded gray areas represent the dates of the flood events.

A large amount of discharge was simulated for 2016 as well (Fig. 11b). In July 2016, the total discharge was 7.1 × 10⁶ m3, which corresponded to 81% of that obtained in July 2015 and 58% of that obtained during the summer months of 2016. On 2 August 2016, owing to rainfall on the day of the flood event, the discharge increased sharply to 19.9 m3 s−1, which was the greatest simulated discharge over the study period (2015–19). The contribution of rainwater to the discharge on that day was 73%, while rainwater from 2 to 4 August accounted for 12.5% of the summer discharge obtained in 2016.
Discussion
Drivers of the floods in 2015 and 2016
The modeled discharge in 2015 and 2016 revealed details of the 21 July 2015 and 2 August 2016 flood events (Fig. 11). On the day of the 2015 flood, the mean melt rate over the glacier was 51 mm w.e. d−1. This episodic melt event was due to a considerable heat flux elevated by northeasterly strong winds under warm conditions, i.e., a daily mean wind speed of 7.4 m s−1 and a temperature of 5.4°C at SIGMA-B (944 m a.s.l.). Similar meteorological conditions were associated with the rapid increase in discharge observed on 28 July 2017 and 6 August 2018 (Figs 6c and d). The strong winds (11.5 m s−1 in 2017 and 17.8 m s−1 in 2018) enhanced the glacier surface melt to 53 mm w.e. d−1 and 25 mm w.e. d−1 in 2017 and 2018, respectively, leading to peak discharges. Thus, both the simulated and the observed meteorology revealed that wind speed, as well as temperature, play an important role in melt-induced discharge events.
The discharge during the 2016 flood resulted primarily from rainwater (90 mm d−1 on 2 August 2016) as shown in Figures 6b and 11b. Previous studies have reported an increase in precipitation in the Arctic over the past decades (Kattsov and Walsh, Reference Kattsov and Walsh2000; Walls and others, Reference Walls2020) and owing to warming atmospheric conditions, as well as retreating sea ice that favor a greater moisture transport from the ocean, future increases in rainfall in the Arctic have been projected (Bintanja and Selten, Reference Bintanja and Selten2014; Bintanja and Andry, Reference Bintanja and Andry2017). Thus, in the future, a higher risk of flooding owing to an increase in heavy rainfall in the Arctic should be expected.
In addition to the obvious influence of glacier melt and rainfall on the 2015 and 2016 floods, the effect of snowpack disappearance on glaciers has also been suggested as another contributing factor to the flood events. Given that Qaanaaq Glacier has an impermeable cold ice surface, snowpack is the most important meltwater storage mechanism. Therefore, the disappearance of the snowpack facilitates immediate runoff into the proglacial stream. Under the influence of summer melt and winter snow accumulation, the seasonal pattern of the snowline migration on Qaanaaq Glacier is significantly different from year to year. In 2015 and 2016, persistently high air temperatures in June and July resulted in intensive glacier surface melt (Figs 6a, b and 8). Thus, the snowline was above SIGMA-B (944 m a.s.l.) on 31 July 2015 and 2016, and the largely exposed bare ice had small water retention capacity, which led to immediate runoff of water generated by the intensive melt event in 2015 and the rain event in 2016. Glacier surface conditions also affect short-term discharge variations. The diurnal patterns in the hydrograph that were attributed to the exposed bare ice were most pronounced in 2019 (Figs 10a–c). On 24 July 2019, the snowline was at 839 m a.s.l., where the surface was still covered by 0.85 and 1.25 m thick snow layers in the same week in 2017 and 2018, respectively. The extent of bare ice area in Greenland has been increasing (Ryan and others, Reference Ryan2019); hence, significant impact on glacial streams owing to discharge regimes should be expected.
Discharge under warming climate conditions
The summer air temperature in Greenland is projected to rise by 2°C in 2050 and 4°C in 2100, based on estimations made using Representative Concentration Pathway 8.5 (RCP 8.5), which assumes a high greenhouse gas emission rate (Vizcaíno and others, Reference Vizcaíno, Lipscomb, Sacks and van den Broeke2014). This warming enhances glacier surface melt, thereby increasing the risk of future floods. To quantify the future proglacial discharges of Qaanaaq Glacier, the glacier runoff routing model was run assuming the abovementioned projected temperature rise.
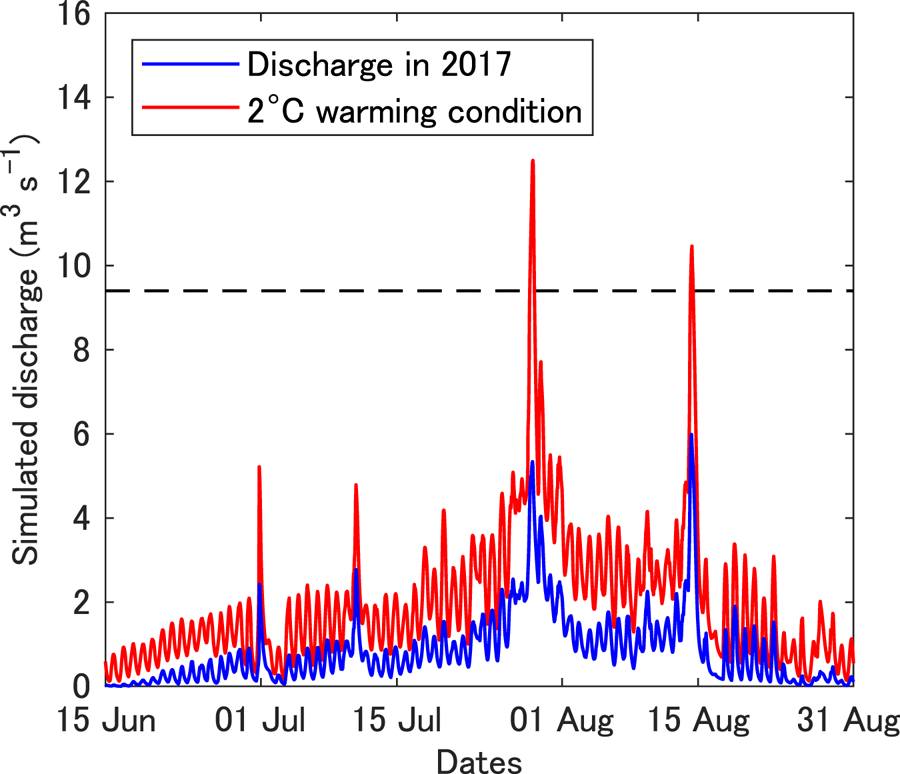
As an example of the sensitivity experiments, we show discharge simulated by imposing 2°C air temperature increases on the meteorological conditions from 2017 (Fig. 12). The results showed that a 2°C increase in air temperature resulted in a 144% increase in the total summer discharge (from 5.6 × 10⁶ to 13.8 × 10⁶ m3). The magnitude of the increase was more pronounced during the early melt season and the discharge in June was projected to be 4.1-fold greater than that based on 2017 observations. Owing to this increase in temperature, the peak discharges on 28 July and 14 August were higher than the discharges obtained during the 2015 flood event, suggesting more frequent and intense floods in the future. Most of the increase in discharge could be ascribed to two mechanisms. The first is the linear increase of sensible heat flux with air temperature (Eqn (2)). This effect was more significant under windy conditions, a conclusion supported by the peak discharge obtained on 28 July. The importance of turbulent heat flux in intensive melt events was demonstrated by the surface energy budget over the ablation zone of the Greenland ice sheet during the exceptionally large melt episodes in July 2012 (Fausto and others, Reference Fausto2016). Second, liquid precipitation increased – particularly in the high elevation area – following the conditions given by Eqns (13) and (14). For example, in the 400–500 m a.s.l. elevation band, there was an increase in the total summer liquid precipitation by 106% (i.e. 86.2–177.6 mm).
Simulated discharge for the conditions observed in 2017 (blue) and for a 2°C warming (red). The horizontal dashed line represents the simulated peak discharge obtained during the flood event that occurred on 21 July 2015.

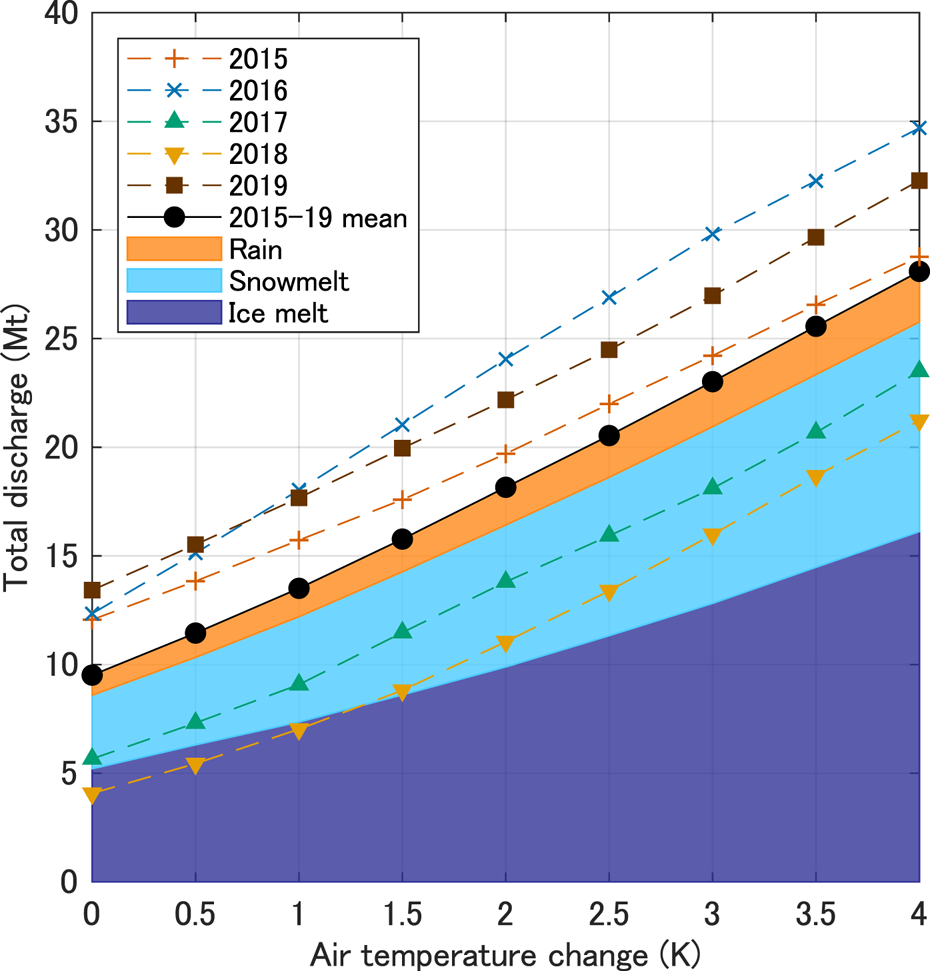
Further experiments were performed by imposing a 0.5–4°C temperature rise on the meteorological conditions observed in the 2015–19 period (Fig. 13). Relative to the mean of the experimental results based on the 2015–19 observations, a threefold increase in the summer discharge was projected (i.e. 9.5 × 10⁶ to 28.1 × 10⁶ m3) under a 4°C warming. Approximately 60% of the discharge increase resulted from ice melt, which increased nonlinearly as air temperature increased (Fig. 13), showing change rates of 2.3 × 10⁶ m3 K−1 and 3.1 × 10⁶ m3 K−1 for a change in temperature from 0 to 2°C and 2 to 4°C, respectively. The variation of ice melt with air temperature was nonlinear because a greater portion of the ice surface was exposed after the up-glacier migration of the snowline. The experiments performed using 2018 observation data show a more pronounced nonlinear increase in the total discharge (3.5 × 10⁶ m3 K−1 and 5.1 × 10⁶ m3 K−1 for a change in temperature from 0 to 2°C and from 2 to 4°C, respectively) as shown in Figure 13. The reason for this is that in 2018, the snowline migrated up-glacier over a large distance from a relatively low elevation. The variations of snowmelt and precipitation with increasing temperature were more linear and increased at rates of 1.6 × 10⁶ and 0.3 × 10⁶ m3 K−1, respectively, for a change in temperature from 0 to 4°C. In 2016, a significant increase in discharge was obtained, owing to an increase in temperature from 0 to 2°C (Fig. 13) given that a greater level of precipitation was observed that year (Table 1).
Simulated total summer discharge resulting from the imposition of a 0–4°C warming on the observed meteorological conditions in 2015 (+), 2016 (×), 2017 (▴), 2018 (▾), 2019 (■). The closed circles represent the means of the overall results (2015–19). The mean total discharge is partitioned into rain (orange), snowmelt (light blue) and ice melt (dark blue).
Our experiments quantified the increase in peak discharges as well as the total summer discharges on Qaanaaq Glacier, owing to warming projected over the next 100 years. Similar changes are expected for other glaciers and ice caps in Greenland and the Arctic, and the quantified discharges provide information that can be used to put measures in place that mitigate the impact of climate warming on communities in Greenland.
Conclusions
To investigate the underlying mechanisms associated with the glacial flood events that occurred in Qaanaaq, northwestern Greenland, field measurements on Qaanaaq Glacier and its outlet stream were made during the summer months of the 2016–19 period. Based on the field data, a glacier runoff routing model was developed by combining surface energy balance and linear reservoir models.
Based on an NSC of 0.71, the results of the glacier runoff routing model agreed sufficiently with the discharge observed within the 2017–19 period. The peak discharges reproduced using the model for the 2015 and 2016 flood events were 9.1 and 19.9 m3 s−1, respectively. Both the model and the observed meteorological data showed that the 2015 flood resulted from intensive glacier melting (51 mm w.e. d−1) that occurred on 21 July 2015 owing to warmer air temperature and strong wind, while the 2016 flood resulted from heavy rainfall (90 mm d−1) that occurred on 2 August 2016, suggesting that wetter conditions in the Arctic will lead to increased risk of similar disasters in the future.
The developed model was used to quantify future glacier discharges in a warming climate. The numerical experiments showed a nonlinear increase in discharge with increasing temperature, represented by a threefold increase in the total summer discharge, owing to a 4°C increase in temperature, relative to the observed measurements. The projected increase in discharge could be attributed to enhanced melt and change of precipitation from snow to rain. Therefore, in this study, the influence of changing climate on the glaciers and outlet streams along the coast of Greenland was quantified and results obtained contribute to a better understanding of the impact of a changing climate on human society at large.
Acknowledgements
We thank the members of the 2015–19 field campaign team in Qaanaaq. Special thanks to T. Ohshima, K. Petersen and S. Daorana for providing logistical support in Qaanaaq. We thank T. Aoki and M. Niwano for providing the meteorological data obtained at SIGMA-B. Thanks are also to K. Mankoff for helpful comments on regional climate modeling and J. Seguinot for providing Sentinel-2A satellite images processed with SentinelFlow (https://doi.org/10.5281/zenodo.1774659). Instruments for the discharge measurement was loaned from Y. Ishii. The manuscript was improved by constructive comments from the reviewer C. Charalampidis, the Scientific Editor W. Colgan, and the Chief Editor H. Jiskoot. English text was corrected by S. Alexiadis. This study was funded by the Japanese Ministry of Education, Culture, Sports, Science and Technology (MEXT) through the Green Network of Excellence (GRENE) Arctic Climate Change Research Project and the Arctic Challenge for Sustainability Projects (ArCS and ArCS II) (grant numbers JPMXD1300000000 and JPMXD1420318865). The meteorological measurements at SIGMA-B were supported by funds from the Ministry of Environment of Japan through the Experimental Research Fund for Global Environmental Research Coordination System.


 Open access