


1. Introduction
The idea that status concerns affect consumption decisions has a long history in the social sciences (Bourdieu, Reference Bourdieu1984; Duesenberry, Reference Duesenberry1949; Frank, Reference Frank1985; Veblen, Reference Veblen1994). In economics, status-motivated consumption is relevant for the understanding of a broad set of issues, including taxation (Abel, Reference Abel2005; Frank, Reference Frank1985), asset prices (Abel, Reference Abel1990; Gali, Reference Gali1994), crime (Mejía & Restrepo, Reference Mejía and Restrepo2016), migration (Stark & Taylor, Reference Stark and Taylor1991), and the subjective welfare of the poor (Fafchamps & Shilpi, Reference Fafchamps and Shilpi2008). Status-motivated consumption can harm welfare by displacing other valuable behaviors such as leisure, savings, or human capital investments (Frank et al., Reference Frank, Posner and Mullainathan2005).
Empirically identifying status consumption presents two primary challenges. The first is shared with the more general literature on peer effects and refers to choices being influenced by unobserved tastes and shocks that can be correlated between the decision-maker and the individuals or groups used as a reference for status comparisons (Manski, Reference Manski1993). This first challenge makes it very difficult to identify status-motivated consumption with nonexperimental techniques. The second challenge remains even after a consumption decision is experimentally shown to be affected by the consumption behavior of others. It refers to the possibility that other forces may motivate this observed consumption externality besides status concerns. The main candidates for these competing forces are learning from others’ choices (Bursztyn et al., Reference Bursztyn, Ederer, Ferman and Yuchtman2014) and complementarities in consumption among peers (Bailey et al., Reference Bailey, Johnston, Kuchler, Stroebel and Wong2022). Thus, a research design identifying status consumption must not only provide credible evidence of peer effects in consumption but also confirm that these are motivated by status.
Previous experimental studies have successfully overcome these two challenges and shown credible evidence of status consumption (Bursztyn et al., Reference Bursztyn, Ferman, Fiorin, Kanz and Rao2018; Clingingsmith & Sheremeta, Reference Clingingsmith and Sheremeta2018). However, in part, because these studies have high-income subjects, two important and inter-related questions remain open, and we address them in this paper. The first question is whether Duesenberry’s demonstration effects, which suggest that lower-income individuals emulate the consumption patterns of the better-off, exist. Although this idea plays a central role in the status literature and has been supported by non-experimental studies in South Africa and the USA (Bertrand & Morse, Reference Bertrand and Morse2016; Charles et al., Reference Charles, Hurst and Roussanov2009; Kaus, Reference Kaus2013), there is no experimental evidence supporting it.Footnote 1 The second open question is whether status consumption is relevant only for high-income individuals or for the broader population. Existing evidence of status consumption among high-income individuals has significant implications for issues in finance, saving, taxation, and fashion cycles (Abel, Reference Abel1990; Abel, Reference Abel2005; Pesendorfer, Reference Pesendorfer1995). Proving the existence of status consumption among lower- and average-income individuals would deepen its consequences in terms of inequality and welfare (Fafchamps & Shilpi, Reference Fafchamps and Shilpi2008; Frank, Reference Frank1985; Ireland, Reference Ireland1994; Veblen, Reference Veblen1994).
We contribute to answering these questions with a research design that addresses the two challenges mentioned above. We tackle the first challenge using random experimental variation to control for correlated unobservables between the consumer and her reference group. In our experiment, a twenty-year-old allocates 10 tickets between a lottery for a valued and socially visible good and a lottery for a valued but non-socially visible good. Before making this allocation decision, this subject is truthfully informed that a close friend has received 30 lottery tickets for either the visible or non-visible good or for an unknown good. The type of good for which the friend has received tickets is determined at random. Thus, this design allows us to evaluate the existence of a consumption externality for a valuable but non-socially visible good and for a valuable and socially visible good.
Interpreting the observed consumption externality as driven by status requires assuming that no other factors contribute to that externality. This assumption is directly related to the second challenge mentioned above, and we confirm it with a two-fold strategy. First, we discard the two main competing hypotheses of learning and complementarities/network effects. We minimize concerns about learning by not letting the reference group choose the type of ticket. We discard consumption complementarities and network effects by carefully choosing goods in which these two aspects are of little relevance.Footnote 2
The socially visible good is a piece of jewelry, and the non-visible good is a mattress. Both goods had a market value of 350 dollars. We selected them following the results of a series of focus groups conducted before the experiment. The participants in these focus groups associated jewelry with a high socioeconomic position and social visibility. They also associated the mattress with a high position but with no social visibility.Footnote 3 Expensive phones also emerged from the focus group as highly visible and valued goods, but we discarded them due to their network effects. The selection of jewelry as the socially noticeable item was further confirmed by the list in Heffetz Reference Heffetz(2011). This list ranks jewelry as the most visible good, second only to vehicles. However, vehicles are not pertinent to our experimental sample. Additionally, a questionnaire included in the experiment showed that subjects assigned very different levels of social visibility to the two goods, further validating the choice of jewelry as the socially visible good.
The second way in which we verify that the consumption externality we find is truly driven by status concerns involves establishing that three fundamental elements of the basic anatomy of status consumption are present in our experimental design and results. The first element is the central role of social visibility. Because status is defined as a set of shared beliefs about a rank of individuals in a society (Ridgeway, Reference Ridgeway2014; Weber, Reference Weber1968), status consumption must be socially visible and associated with a higher position in order to modify those beliefs (Duesenberry, Reference Duesenberry1949; Frank, Reference Frank1985; Veblen, Reference Veblen1994).
The second element of the basic anatomy of status consumption featured in our experiment is a very precise definition of the reference group of the decision-maker. We formed the pair of decision-maker and close friend by contacting the latter and asking her to name the former. As in Clark and Senik Reference Clark and Senik(2010) and Friehe et al. Reference Friehe, Mechtel and Pannenberg(2018), in our experiment, subjects play an active role in defining their reference group. This constitutes an advantage compared to studies defining the reference group based on people with similar sociodemographic characteristics (Clark et al., Reference Clark, Frijters and Shields2008; Clark & D’Ambrosio, Reference Clark, D’Ambrosio, Atkinson and Bourguignon2015; Ferrer-i Carbonell, Reference Ferrer-i Carbonell2005). We obtained the set of close friends from a longitudinal survey that started as a representative sample of the population of first-graders in public elementary schools in Uruguay. Although the survey experienced some instances of attrition, we show that our experimental sample has similar socioeconomic characteristics compared to the population. Our paper thus benefits from the advantages of a controlled experiment while being implemented in the field with average subjects. This sample of subjects with average socioeconomic characteristics allows us to answer the second of the two open questions in the literature identified above.
The third element of the basic anatomy of status consumption featured in our experiment is the existence of “snob” and “demonstration” effects. Snob effects occur when better-off individuals try to differentiate themselves from the consumption patterns of the poor (Leibenstein, Reference Leibenstein1950), while demonstration effects occur when the less well-off imitates the consumption of the wealthy (Duesenberry, Reference Duesenberry1949; Hirschman & Rothschild, Reference Hirschman and Rothschild1973; Veblen, Reference Veblen1994). We test for these two effects by calculating separate treatment effects depending on the relative socioeconomic position of the decision-maker with respect to her friend. We measure this relative position with the level of education of both members’ parents. This final aspect of the experimental design completes the characterization of the basic anatomy of status consumption, confirming that the consumption externality we observe is indeed motivated by status, and let us answer the first of the two open questions identified above.
In terms of results, we find no differences in decision-makers’ choices when their friend received the tickets for the non-socially visible instead of the unknown good. This finding suggests that the mere association of the consumption of a good with success in life is not sufficient for status consumption to emerge. In contrast, we find several differences in the choices when the friend received the tickets for the visible good instead of the other two. Consistent with theory and previous evidence, these differences suggest that social visibility is a necessary condition for status consumption (Charles et al., Reference Charles, Hurst and Roussanov2009; Ireland, Reference Ireland1994; Kamakura & Du, Reference Kamakura and Du2012; Veblen, Reference Veblen1994).
As mentioned previously, the theoretical literature on status consumption suggests that the direction of consumption responses driven by status concerns depends on consumers’ relative position compared to their reference group. Consumers in a higher position may engage in snob behavior, and those in a lower position may engage in imitative behavior. Although there is experimental evidence supporting snob effects, none is showing the imitative behavior behind demonstration effects. We leverage our socioeconomically diverse sample to confirm the existence of both snob and demonstration effects among young people in a single experimental setting. We find that decision-makers in a worse or equal position assigned 0.8 more tickets to the visible good when their friend received tickets for that good instead of the other two. On the other hand, the same comparison for those in a better position implies that 1.4 fewer tickets are assigned to the visible good. These are large effects considering an average of 4.4 tickets assigned to jewelry, with a standard deviation of 2.9. Snob and demonstration effects offset each other on average, and we find no statistically significant difference when we do not condition on decision-makers’ relative position.
These experimental findings provide answers to the two open questions identified in the literature. The observation that decision-makers in a lower position assign more tickets to jewelry represents the first empirical evidence of Duesenberry’s demonstration effects on consumption decisions. Furthermore, our sample of subjects with average socioeconomic characteristics demonstrates that status consumption is not restricted to high-income individuals, but applies to low- and average-income individuals as well.
Two additional features of our sample increase the relevance of our results. Firstly, our subjects are in a critical stage of human capital accumulation and career development, where status concerns may operate as a negative positional externality and distort their decisions (Frank et al., Reference Frank, Posner and Mullainathan2005). This could happen, for instance, if to afford status-motivated consumption, youngsters assign less time to human capital investments in favor of paid work, potentially including illegal activities. Secondly, these distortions could be amplified by the large income and wealth gaps typical of Latin American countries.Footnote 4
A final set of results reinforces the overall status interpretation of our findings and contributes to a more general literature on the differences in behavior between young men and women. The treatment with the visible good causes men to perceive themselves in a lower position in society and to assign more tickets to that good. In contrast, the same treatment improves women’s subjective socioeconomic position and, although not statistically significant, makes them assign fewer tickets to the visible good. These causal results are consistent with the treatment differentially changing men’s and women’s subjective positions in a way that triggered demonstration effects among men and snob effects among women.
The main contribution of this paper is to the literature on the identification of status consumption. This literature is composed of a majority of non-experimental studies, using either consumption data (Agarwal et al., Reference Agarwal, Qian and Zou2021; Bertrand & Morse, Reference Bertrand and Morse2016; Charles et al., Reference Charles, Hurst and Roussanov2009; De Giorgi et al., Reference De Giorgi, Frederiksen and Pistaferri2020; Kaus, Reference Kaus2013) or survey-responses to hypothetical situations (Carlsson et al., Reference Carlsson, Johansson-Stenman and Martinsson2007), and very few natural (Kuhn et al., Reference Kuhn, Kooreman, Soetevent and Kapteyn2011), laboratory (Clingingsmith & Sheremeta, Reference Clingingsmith and Sheremeta2018), and field experiments (Bursztyn et al., Reference Bursztyn, Ferman, Fiorin, Kanz and Rao2018). Although all experimental studies have an advantage over nonexperimental ones in identification, natural experiments are usually unable to control for critical aspects needed to discard competing hypotheses.Footnote 5
Our main contribution to this literature on the identification of status consumption is to provide evidence on the two open questions discussed above. Additionally, we improve the understanding of the type of comparisons in which consumers engage when making status-motivated consumption decisions. In most existing studies, there is little or no information on the relevant reference group for status comparisons (Bertrand & Morse, Reference Bertrand and Morse2016; Bursztyn et al., Reference Bursztyn, Ferman, Fiorin, Kanz and Rao2018; Charles et al., Reference Charles, Hurst and Roussanov2009). We fill that gap by showing that close friends constitute a relevant comparison group.
Our paper complements in two ways the work of Bursztyn et al. Reference Bursztyn, Ferman, Fiorin, Kanz and Rao(2018), who find status-motivated use of credit cards in Indonesia. First, while both papers document snob behavior, we provide the first experimental evidence on demonstration effects. Second, the contrast between our sample and their sample of “largely urban, upper-middle-class bank customers” reinforces the idea that status consumption is relevant for all types of consumers. Although our rich design allows us to complement the work of Bursztyn et al. Reference Bursztyn, Ferman, Fiorin, Kanz and Rao(2018) in these two ways, it introduces decisions that do not exist regularly outside the experiment. In this respect, their study of credit card use strengthens the external validity of experimental studies on status-motivated consumption.
Our findings further contribute to a large literature study documenting peer effects among teenagers (Bayer et al., Reference Bayer, Hjalmarsson and Pozen2009; Balsa et al., Reference Balsa, French and Regan2014; Bursztyn & Jensen, Reference Bursztyn and Jensen2015; Carrell et al., Reference Carrell, Hoekstra and Kuka2018; Kremer & Levy, Reference Kremer and Levy2008; Sacerdote, Reference Sacerdote2001). Peer effects in this age group are particularly relevant because teenagers make critical decisions about human capital accumulation, fertility, and entry into the labor market. Most previous studies focus on peer effects in education. As in Clingingsmith and Sheremeta Reference Clingingsmith and Sheremeta(2018), we provide evidence on peer effects in consumption decisions.
Finally, our heterogeneous results by gender have implications for the literature on behavioral differences between young men and women (Bertrand, Reference Bertrand, Card and Ashenfelte2011). The patterns we find could increase effort provision by men and decrease effort provision by women in contexts where comparisons are salient (Schram et al., Reference Schram, Brandts and Gërxhani2019). This could contribute to explaining commonly observed differences in performance between the two sexes in competitive environments (Antonovics et al., Reference Antonovics, Arcidiacono and Walsh2009; Buser et al., Reference Buser, Niederle and Oosterbeek2014; Cai et al., Reference Cai, Lu, Pan and Zhong2019; Gneezy et al., Reference Gneezy, Niederle and Rustichini2003; Gneezy & Rustichini, Reference Gneezy and Rustichini2004; Niederle & Vesterlund, Reference Niederle and Vesterlund2007; Shurchkov, Reference Shurchkov2012; Tungodden & Willén, Reference Tungodden and Willén2022).
2. Conceptual framework
Social status is a ranking of individuals based on shared beliefs about differences in honor, recognition, esteem, and respect (Ridgeway, Reference Ridgeway2014; Weber, Reference Weber1968; Weiss & Fershtman, Reference Weiss and Fershtman1998). People may care about their social status for intrinsic reasons, for example, because they value the esteem and respect others have for them, as well as for instrumental reasons. The instrumental benefits of having a higher social status can include better access to job opportunities and economic opportunities more generally.
Those shared beliefs that constitute the definition of social status can be based on individuals’ endowments, their gender or racial identity, as well as their behavior. Status-motivated consumption is one such behavior. This type of consumption occurs when part of the utility derived from a good comes from an improvement in the social status of the consumer. Because status involves, by definition, comparison between individuals, status consumption is usually modeled as depending on differences in consumption among individuals (Frank, Reference Frank1985).
Modeling of status-motivated consumption usually starts from a reduced-form utility function (Postlewaite, Reference Postlewaite1998). This function abstracts, for instance, from specifying whether individuals care about their status for intrinsic or instrumental reasons. We use the following reduced-form utility function to introduce the three basic elements of the anatomy of the status consumption hypothesis and present the formal structure of the experiment:
 \begin{equation}
\mathscr{U}_{i}(x_i,z_i, z_{-i}| \Phi_{i,-i})= U(x_i,z_i)+ S(z_i,z_{-i}| \Phi_{i,-i})
\end{equation}
\begin{equation}
\mathscr{U}_{i}(x_i,z_i, z_{-i}| \Phi_{i,-i})= U(x_i,z_i)+ S(z_i,z_{-i}| \Phi_{i,-i})
\end{equation} x and z are the only two goods in an economy populated by consumer i and a set of other consumers indexed by −i. The  $U(.)$ function denotes the conventional portion of the utility function, which does not depend on consumption by others. The function $S(.)$ adds the social status component by introducing the consumption of z by i and −i. Importantly, this function depends on $\Phi_{i,-i}$, which measures the social position of i compared to the other consumers (Leibenstein, Reference Leibenstein1950; Veblen, Reference Veblen1994).
Consumer i defines her optimal consumption  $z_i^{*}=z_i (Y_i, p, z_{-i}| \Phi_{i,-i})$ by maximizing $\mathscr{U}_{i}$ given an income Yi and a relative price of goods x and z, which we denote by p. Our experiment can be seen as evaluating changes in $z_i^{*}$ when the reference group −i receives different types of goods.
This simple formal structure allows us to introduce the three basic elements of the anatomy of status good consumption. The first element refers to the characteristics of the goods whose consumption may derive status. We highlight two characteristics that follow from the definition of social status given above. The first is that the consumption of a status good must be associated with being in a higher position in society. The second is that such consumption should be socially visible in order to change others’ beliefs (Heffetz, Reference Heffetz2011; Heffetz, Reference Heffetz2012; Heffetz, Reference Heffetz2018). In the experiment, we test for these two characteristics by randomly assigning to the reference group a good that only has the first one, a good that has both, or an unknown good.
The second element of the anatomy of status consumption refers to the individuals or groups against which consumers compare themselves. This “reference group” is denoted by −i above. In the experiment, we ex ante define close friends as the reference group and let participants tell us who are their close friends. Clark and Senik Reference Clark and Senik(2010) show that friends are the most relevant reference group in terms of life satisfaction among a broad population between 16 and 65 years old. Arguably, friends are even more relevant in our age group of 20-year-olds.Footnote 6 Thus, the experiment considers the most important reference group for 20-year-olds with a built-in mechanism to select individuals within that group.
The third element of the anatomy of status consumption introduces the role of the social position of the consumer with respect to her reference group. According to the classical Veblen effects, low- and middle-income consumers imitate the consumption of individuals at the top of the income distribution (Veblen, Reference Veblen1994). Veblen effects thus imply that we should observe  $\partial z_i^{*} / \partial z_{-i} \gt 0$ when lower-ranked consumers have a higher-ranked reference group. In contrast, according to the snob consumption hypothesis, consumers in a better position try to avoid those things consumed by lower-ranked groups (Leibenstein, Reference Leibenstein1950). Under this hypothesis, low-income groups act as the reference group for high-income consumers, and we should observe $\partial z_i^{*} / \partial z_{-i} \lt 0$.
3. Experimental design
3.1. Experimental procedures
The experiment consisted of two stages. Figure 1 presents the basic procedures for each stage. In the first stage, participants were asked to provide the names and contact information of four close friends, excluding relatives and partners. We thus refer to participants in this first stage of the experiment as Referring friends. We truthfully told Referring friends that their referred friends would participate in a lottery with a prize. We did not give them any further details about that lottery.
Experimental procedures
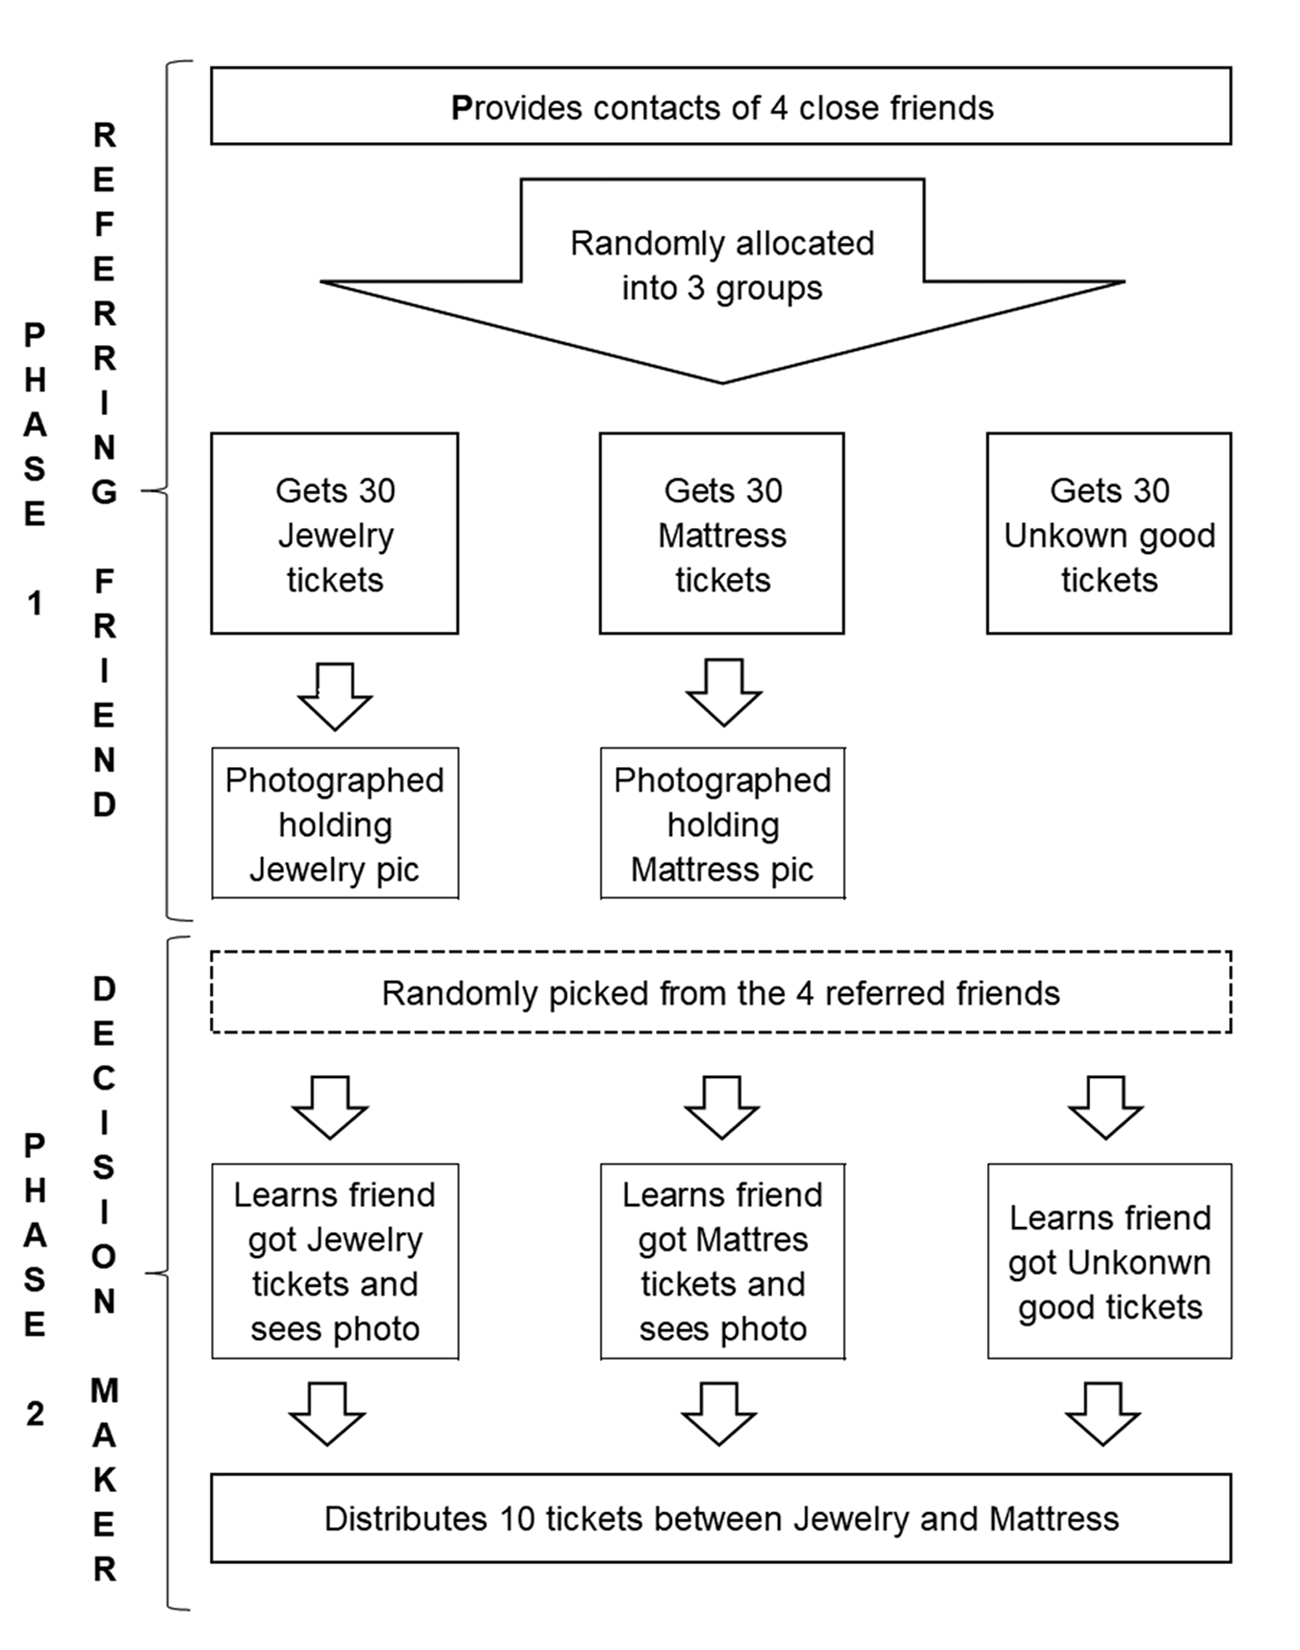
After the Referring friends provided us with the names of their friends, we gave them 30 tickets to participate in a lottery.Footnote 7 There were three types of lottery tickets, differing in their prize. One prize was an unknown good, another was a piece of jewelry, and the other was a mattress. The type of prize was randomly assigned to each Referring friend prior to the interview. We truthfully told them that all three prizes had a market value of US$ 350 and that all tickets had the same probability of winning.
To enhance credibility, the winning lottery ticket was chosen with the regular draw of the Uruguayan National Lottery. This lottery has a strong tradition in the country, and tying small private lotteries like ours to its results is a common practice. Each ticket had a 1/10,000 chance of winning. Subjects could infer this probability from the number of digits printed on their tickets. We truthfully informed the subjects about the date of the lottery and that winning chances were fixed and independent of the type of good they chose and the type of choices made by other subjects. All tickets were identical except for their prize, date, and number.
The first stage of the experiment ended with the interviewer photographing the Referring friends who got tickets for the piece of jewelry or the mattress. The photo consisted of the Referring friend holding a picture of the corresponding good. Online Appendix B.1 includes some of these photos (Figure B1) and the jewelry and mattress pictures they are holding (Figure B2). The jewelry picture features masculine (i.e., the ring in the picture), feminine (i.e., the bracelets), and unisex or gender-neutral items (i.e. some of the pendants). The picture of the mattress featured a queen-sized mattress with a box spring.
The participant in the second stage of the experiment was randomly selected from the four friends referred in the first stage. This random selection was aimed at muting any order effects and does not play any role in the identification, which is achieved by the randomization of the type of good.
Participants in the second stage are the only ones who make an actual choice in the experiment, and thus we refer to them as Decision-makers. We told them that a friend gave us their contact information and that this friend had received 30 lottery tickets for some unspecified good, a piece of jewelry, or a mattress. Importantly, we highlighted that their friend could not choose the type of prize. We further showed Decision-makers in the jewelry or the mattress treatments the photograph of their friend holding the corresponding picture. Decision-makers were then asked to assign 10 lottery tickets between the jewelry and the mattress lotteries. They could distribute the 10 tickets among the goods in any proportion they chose. We truthfully told them that both goods were of identical price and that the lottery numbers for both goods had the same chance.
After the Referring friends and Decision-makers performed the main procedures of the experiment, we asked them about their socioeconomic background and their perceptions of the visibility and status content of different types of goods. The information on their socioeconomic characteristics allows us to obtain separate treatment effects depending on the relative position of the Decision-maker and the Referring friend. For Decision-makers, the questionnaire also asked about the reasons behind the allocation they made. We present descriptive statistics on these reasons in Section 6.
3.2. Jewelry and mattress as status and non-status goods
The choice of the two goods is an essential part of the experiment. Participants value both goods highly because of their direct benefits and their association with a high social position. The key difference between the two goods is that jewelry is the quintessential socially visible good and a mattress cannot be shown socially beyond close friends and relatives. Thus, comparing decisions when the Referring friend received tickets for the mattress instead of the unknown good evaluates the existence of consumption externalities when a good is valuable but not socially visible. Comparing that allocation when their friend received the tickets for the jewelry instead of the mattress lotteries identifies the role of the social visibility of consumption.
The choice of the two goods originated in a series of focus groups conducted with people of the same age and city as our experimental sample. Participants in these focus groups were asked to imagine a situation in which, in a meeting with a group of friends, there is a new person they did not know before. They were then asked to think about things that this new person has and that they would like to have. After individually listing a set of goods according to this criterion, participants were asked to rank the goods in terms of their desirability and put a price on them. The next step consisted of them considering the three goods with the highest prices in their list and thinking of three other goods with similar prices that they would buy but do not think are “socially glamorous” or “provide status.” We mentioned the example of full insurance for a car as “something valued and necessary but that you cannot boast about... because it cannot be seen.”
The focus groups were segmented into three subgroups according to the level of education of the participants. Table A1 in the Appendix shows the list of status goods mentioned in each of the three subgroups, with their ranking, brands, and prices. Jewelry, together with clothing, sneakers, and phones, appeared as a highly valued and socially visible good in all the subgroups. We discarded clothing and sneakers because their brands, styles, and colors differ widely by gender and socioeconomic background. We discarded phones because they are typical network goods and could generate consumption externalities not motivated by status concerns but by their practical value increasing when friends have the same good. Mattress, together with other household items, such as TVs or stoves, appeared in the three subgroups as highly valued but non-socially visible goods.Footnote 8
We further validate the choice of jewelry and mattress as status and non-status goods with two other sources beyond the focus groups. First, jewelry appears as a positional good on the list in Heffetz Reference Heffetz(2011). Discarding vehicles, which in Heffetz’s list rank as the most visible but are not relevant in our age group, jewelry appears as one of the most visible goods in the list. Second, the answers to the questionnaire confirm the two key characteristics of the goods. We next discuss this in more detail.
The questionnaire included a set of four questions about 15 goods. Two questions were about the association of the goods with success in life and required a yes or no answer for each good. The first asked participants to imagine a successful person and answer if that person has the good. The second asked whether they think that increasing the consumption of the good improves the social position of a person. The two other questions required ranking the three goods with the highest visibility among the 15. The first asked which goods would help them the most in detecting a successful person. The second was very similar to the one used in Heffetz Reference Heffetz(2011); Heffetz Reference Heffetz(2012) and asked about the quickness with which participants would identify that a friend is consuming the good.Footnote 9
The set of goods included the two that appear in the jewelry image used in the experiment (bracelet and chain), the mattress, and a few other goods mentioned in the focus groups, some more visible (e.g., clothing and tattoos) and some less visible (e.g., TV and sound system). Table 1 presents the average share of subjects associating the consumption of jewelry, mattress, and the rest of the goods with success in life (first two columns) and the rank of the goods based on the share of subjects identifying them as most visible (last two columns). Since the treatments could affect these answers, Table 1 only considers participants whose friend received tickets for the unknown good. Results are similar when considering all subjects.
Association with success in life and visibility of different goods
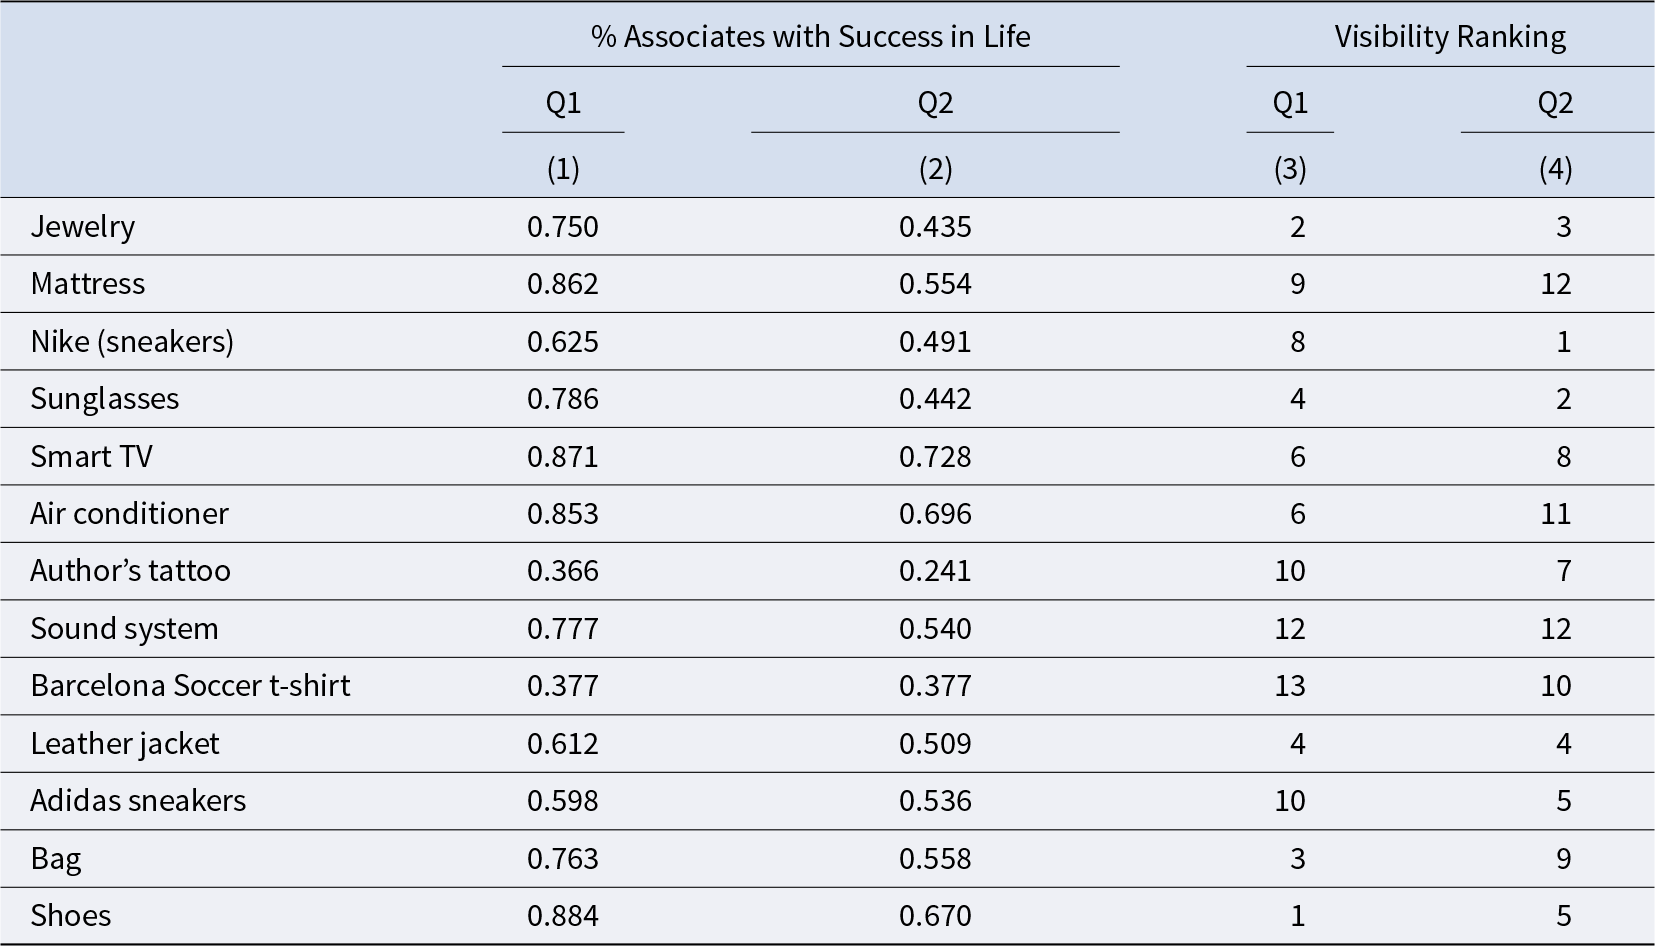
Columns 1 and 2 show, respectively, the proportion of subjects saying that a successful person has the good and that having this good improves your social position. Columns 3 and 4 present the rank for each good in terms of the proportion of subjects identifying that good as the most visible. Column 3 considers which good would help them the most in detecting a successful person, and Column 4 the quickness with which they would identify that a friend is using the good. Jewelry includes two goods from the list of 15: bracelets and rings. We exclude the watch from this table because we are unsure whether subjects considered it under the jewelry category.
The results in Table 1 confirm the two conclusions obtained from the focus groups. First, subjects highly associate all the goods with success in life, and this association is particularly strong for jewelry and mattress. Second, jewelry and mattress differ greatly in their visibility. While jewelry ranks second and third in each of the two visibility questions, mattress ranks ninth and twelfth. These two conclusions are further confirmed by the more detailed analysis in Tables B1, B2, and B3 in the Online Appendix.
3.3. Experimental sample
The sample of Referring friends consists of individuals aged 19–21 years living in the metropolitan area of Montevideo, the capital city of Uruguay. They are part of a longitudinal survey that started in 2004 as a representative sample of the population of first-grade students in public schools in Uruguay, which then represented 85% of the total population of that age. Having access to the contact information of participants in this survey gave us a sample that shares the characteristics of the average population of that age in the city. Although the existence of a few instances of attrition implies that ours is not a statistically representative sample in the population, Table B1 in the Appendix shows that there are no significant differences in a set of relevant covariates when using the national household survey to compare our sample against the population.
We successfully contacted and visited 551 individuals out of the total sample of 816 we obtained from the survey. The difference of 265 is explained by problems with the contact information and by rejections. Among the remaining, for 398, we found a referred friend who agreed to participate in the experiment. The difference is explained mainly because one of the members of the pair was not willing to participate in the experiment and, to a smaller extent, because of errors in the contact information. Of the final sample of 398 pairs, 224 were assigned to the unknown treatment and 174 were in the jewelry (88) or mattress treatments (86). In Section 5 we show that the observables of both members of the pairs are balanced across treatments for a large set of variables. Appendix B provides further detail on the origin of the sample and the fieldwork implementation.
4. Empirical strategy
In the conceptual framework introduced in Section 2, z denoted the units consumed of the good that generates utility with a status motive. Our experiment can be seen as testing for two different candidates for z: jewelry and mattress. Testing for these two candidates constitutes an indirect test for the two key characteristics that status goods must have. When comparing choices after their Referring friend received tickets for the mattress instead of the unknown good, we define z as the number of tickets assigned to the mattress lottery and evaluate the effect of a good being associated with success in life but not being socially visible. When doing the same comparison but when the Referring friend received jewelry tickets, we define z as the number of tickets assigned to the jewelry lottery and evaluate the effect of a good being associated with success in life and socially visible.Footnote 10
In order to complete the mapping between the conceptual framework and the experimental design, consider that the consumer i decides on z subject to a relative price p = 1 and an income of Y = 10. This decision is taken after her reference group receives an allocation z −i of 0 or 30 tickets.  $z_{-i}=0$ corresponds to the treatment in which the Referring friend received tickets for the unknown good, and $z_{-i}=30$ to when she received tickets for either the jewelry or mattress lotteries. Taking all these definitions into account and further defining the expected discrete change in consumption of good z as $\Delta z_i^{*}$, the average treatment effects identified in the experiment can be expressed as follows:
 \begin{equation}
\Delta z^{*} \equiv E[ z_i^{*}(Y_i=10,z_{-i}=30|\Phi_{i,-i})]-E[ z_i^{*}(Y_i=10,z_{-i}=0|\Phi_{i,-i})].
\end{equation}
\begin{equation}
\Delta z^{*} \equiv E[ z_i^{*}(Y_i=10,z_{-i}=30|\Phi_{i,-i})]-E[ z_i^{*}(Y_i=10,z_{-i}=0|\Phi_{i,-i})].
\end{equation} Thus, we separately compute  $\Delta z_i^*$ for mattress and jewelry and say that these goods generate utility with a status motive if the respective $\Delta z_i^*$ is different from zero. The fundamental assumption behind this status interpretation is that there are no alternative sources behind the consumption externality. We discard the main competing hypotheses, learning and complementarity/network effects, with two characteristics of the experimental design described in the previous section. First, the Referring friends do not choose the good, and thus, the decision-maker cannot learn from that decision. Second, the two goods we choose do not have a significant network or complementarities in their consumption.
We compute the two treatment effects both unconditionally and conditionally on the relative position of the Decision-maker with respect to the Referring friend, denoted by  $\Phi_{i,-i}$. $\Phi_{i,-i}$ is a binary variable that takes the value of one when the Decision-maker has the same or a lower position compared to the Referring friend and zero otherwise. We thus say that there is evidence of demonstration effects when we observe $\Delta z_i^* \gt 0$ for those Decision-makers with $\Phi_{i,-i}=1$ and evidence of snob effects when we observe $\Delta z_i^* \lt 0$ for those with $\Phi_{i,-i}=0$.
In practice, we estimate  $\Delta z_i^*$ with OLS regression. The basic version of that regression is the following:
 \begin{equation}
z_i = \beta_0 + \beta_1 {Jewelry}_i + \beta_2 {Mattress}_i + \epsilon_i,
\end{equation}
\begin{equation}
z_i = \beta_0 + \beta_1 {Jewelry}_i + \beta_2 {Mattress}_i + \epsilon_i,
\end{equation} with  $\text{Jewelry}_i$ and $\text{Mattress}_i$ indicating if the Referring friend of Decision-maker i received the jewelry or mattress tickets, respectively. The variable that indicates whether the friend received tickets for an unknown good is the one omitted in this regression. We estimate the regression with the number of units allocated to the jewelry lottery as the dependent variable.
In order to test for demonstration and snob effects, we estimate a similar version of Equation 3 in which we interact the two treatment variables with a binary variable indicating the relative position of the Decision-maker with respect to the Referring friend. This variable equals 1 if the Decision-maker is in a lower or equal position and 0 otherwise.
In the ordinary least squares (OLS) regressions, we control for a set of Decision-makers’ covariates, including sex, age, three educational levels, and the relative socioeconomic position compared to the Referring friend. Controlling for these covariates is not needed for identification. We include them for efficiency purposes and present estimates with and without these controls.
Because randomization occurs in the first stage of the experiment, the corresponding balance check compares the observables of the Referring friends across treatments.Footnote 11 Table A2 in the Appendix shows that the characteristics of the Referring friends are effectively balanced across the three treatments for a wide set of variables, including age, sex, and employment.
5. Decision-makers and their relationship with Referring friends
The first column of panel (a) of Table 2 confirms that most Decision-makers are between 19 and 21 years old. Only a fifth has emancipated and no longer lives with their parents, around 60% study, and a similar proportion works at least an hour a week. In terms of their formal education, around two-fifths reached secondary education, one-fifth reached post-secondary technical education, and about a third reached university. Table 2 also includes information on the maximum level of education reached by their parents and illustrates how our experimental subjects come from a variety of socioeconomic backgrounds. While a majority of the sample has parents who reached secondary education, about a fifth of parents only reached primary education and another fifth attended university.
Descriptive statistics. Characteristics of the Decision-makers and the pairs
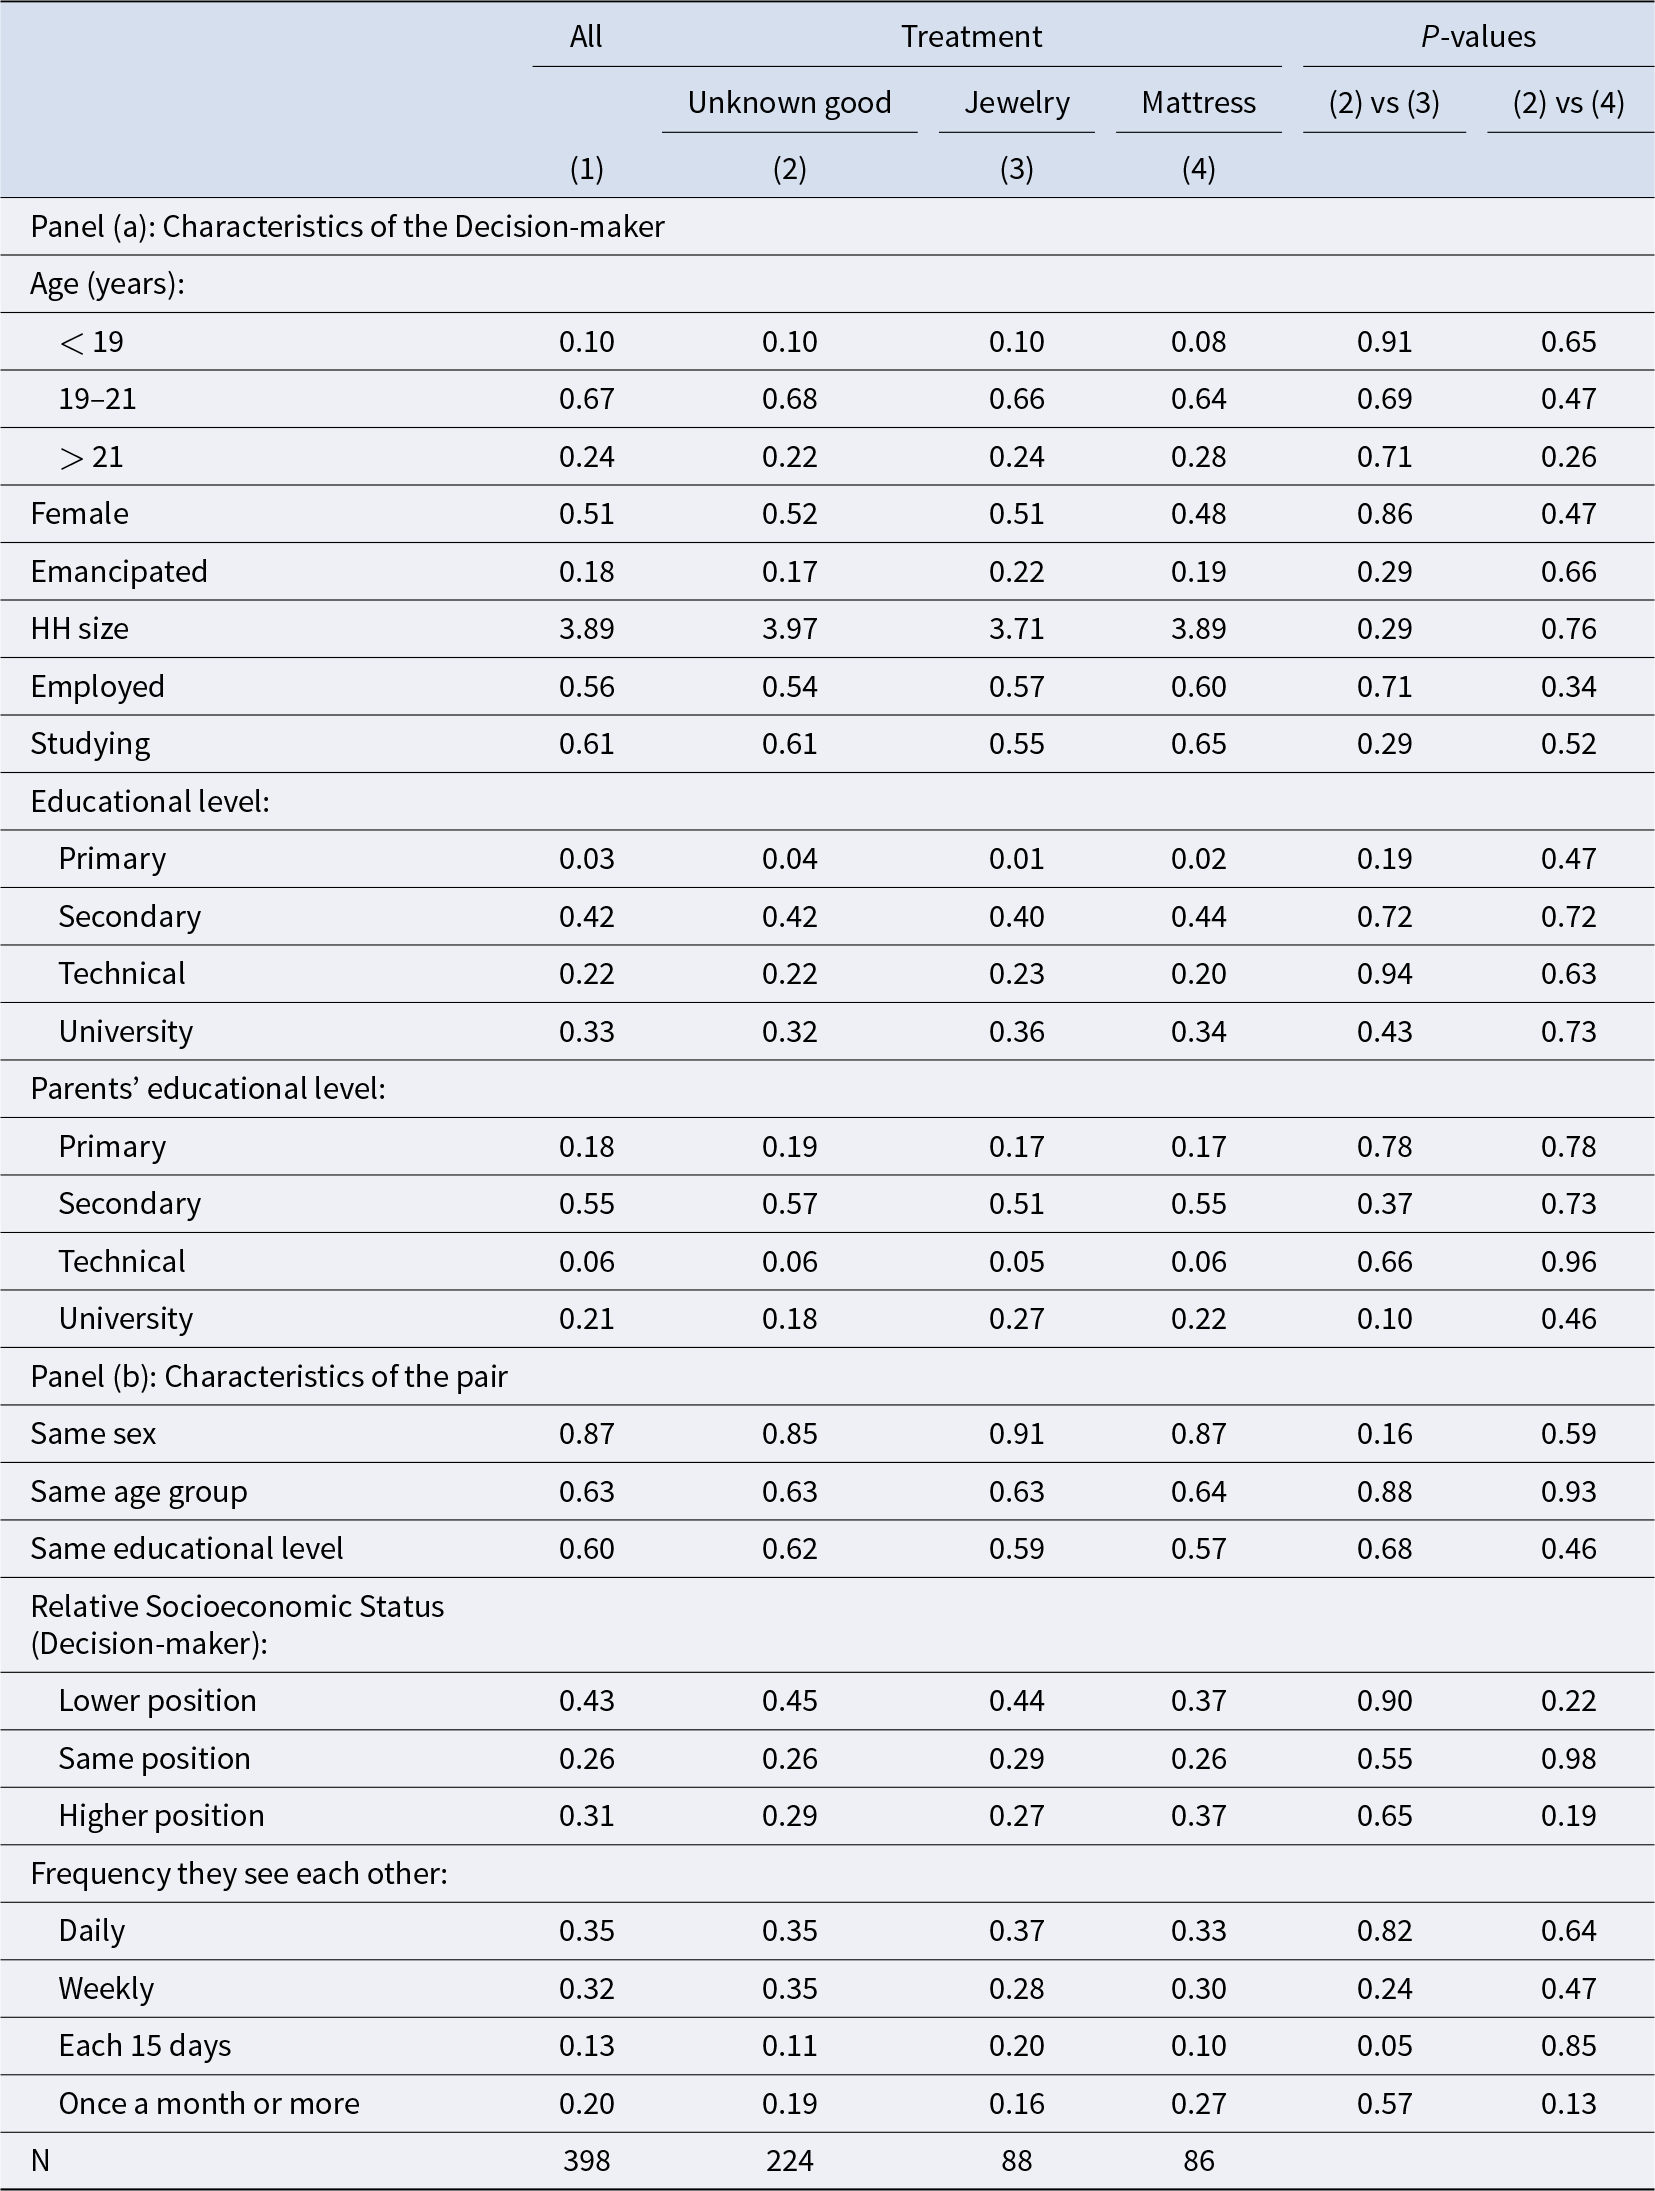
All the information in this table corresponds to members of the 398 pairs that form the experimental sample. It was generated with a questionnaire applied within the experiment. “Emancipated” indicates that the individual no longer lives with her parents. The educational level for the Decision-makers and their parents corresponds to the maximum level reached without considering if they completed that level. The relative SES variable is built in two steps. First, for each individual, we consider the maximum educational achievement among her parents. We consider the eight levels of educational achievement arising from the interaction of four levels of education (primary, secondary, post-secondary technical, and university) and whether the individual completed the maximum level she reached. Second, we compare the level of education obtained in the first step between the Decision-maker and the Referring friend. The frequency of interaction corresponds to the response from the Decision-makers.
Since the treatment was randomized at the Referring-friend level, the characteristics of the Decision-makers could differ across treatments. This could have happened if the treatments led Referring friends to name a different type of friend. We need to evaluate this hypothesis in order to discard that the selection of the type of friend could be a mechanism behind the effects we find.Footnote 12 The second to fourth columns separate participants by type of treatment to evaluate this possibility. The last two columns present the p-values of the corresponding differences in means and show that the characteristics of the Decision-makers are similar across treatments.
Panel (b) of Table 2 describes the characteristics of the pairs. The dimension in which the members of the pair are most similar is sex. In the experiment, men mostly referred men and women referred women, resulting in about 90% of same-sex pairs. There is more within-pair variation in other characteristics. For instance, the age and educational level coincide in only 60% of the pairs.
A crucial piece of within-pair variation for testing for snob and demonstration effects refers to the relative socioeconomic status within the pair. We measure Socioeconomic Status (SES) by asking subjects about the level of education reached by their parents and consider the maximum between both parents.Footnote 13 Panel (b) of Table 2 shows variation in the within-pair relative position. Parents have the same level of education in only about a quarter of the pairs. Among the rest, it is more common that the Decision-maker is in a lower (43%) than in a higher position (30%).
The last four rows of Table 2 present information on the frequency with which the members of the pairs see each other. Most friends in the sample see each other quite frequently, with nearly 70% seeing each other at least once a week.Footnote 14
6. Results
6.1. Descriptive evidence on choices
Decision-makers assigned slightly more tickets to the mattress than to the jewelry lotteries. On average, 4.4 tickets were assigned to the jewelry lottery, which implies that 5.6 tickets were assigned to the mattress lottery. The number of tickets assigned to the jewelry lottery had a standard deviation of 2.9. Figure 2 presents the unconditional average of the number of tickets assigned to the jewelry lottery, as well as conditional averages for a set of Decision-makers’ characteristics. Because the jewelry and mattress treatments could have affected subjects’ allocation, the data in that figure correspond only to Decision-makers in the treatment with the unknown good.
Average number of tickets assigned to the jewelry lottery by Decision-makers’ covariates. The dots indicate the average number of jewelry tickets chosen by Decision-makers, and the bars represent the respective 95% confidence intervals. The estimates are computed with the sample of Decision-makers whose Referring friend received the unknown good (224 observations)
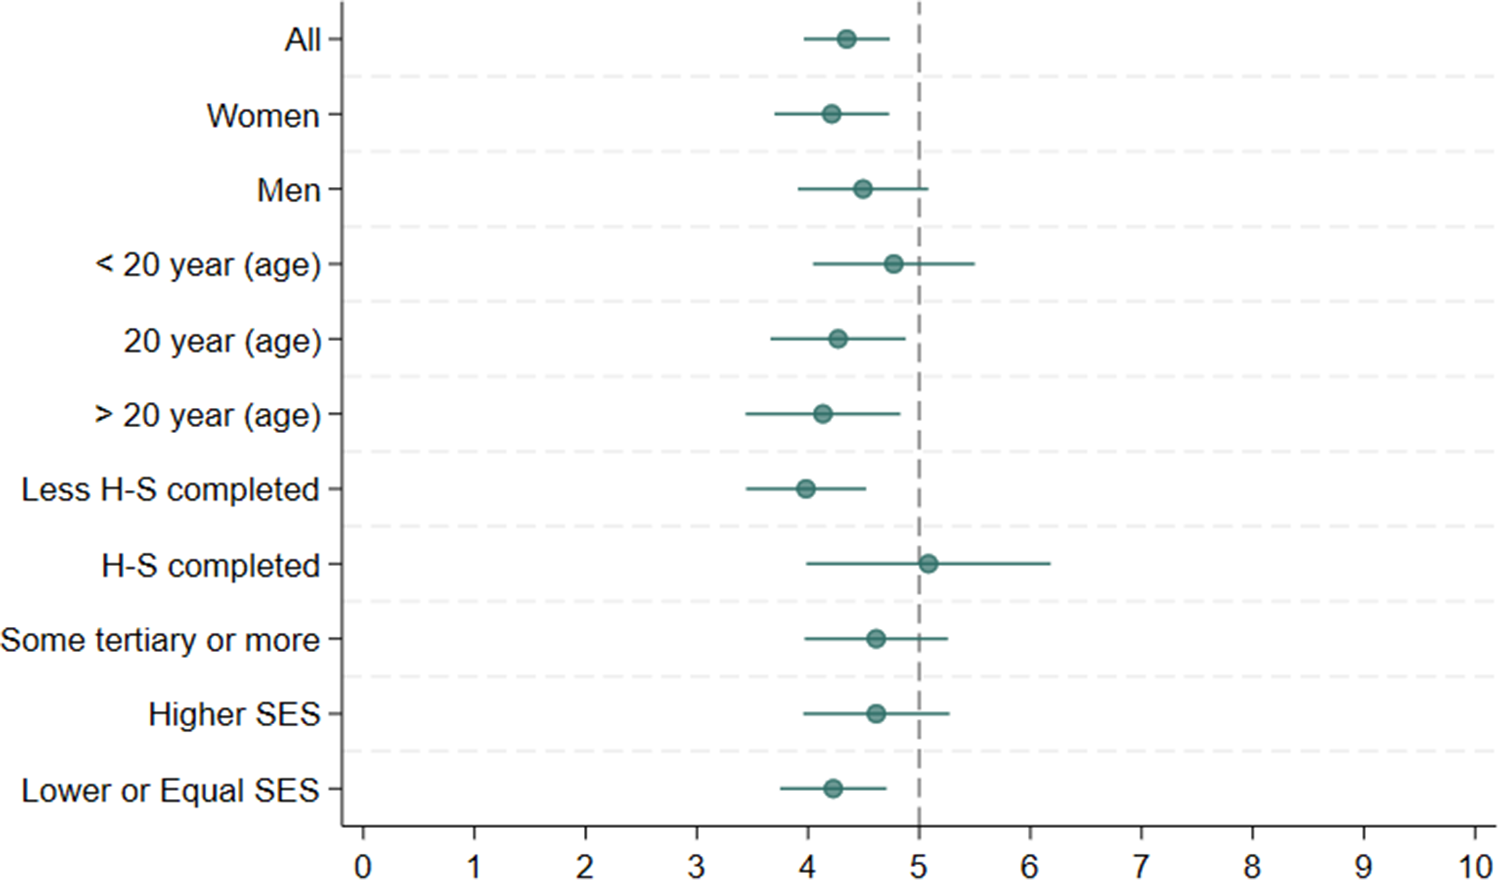
Male decision-makers, as well as those who are younger, have higher educational attainment, or hold a better relative socioeconomic position compared to their friends, allocated more tickets to the jewelry lottery. Since these covariates are likely to be correlated, we simultaneously include all of them in a regression that has the number of lottery tickets assigned to the jewelry lottery as the dependent variable. These corresponding estimates are presented in Table A3 in the Appendix and show that the education level of the Decision-maker is the only variable with a statistically significant (positive) association with the number of tickets assigned to jewelry.
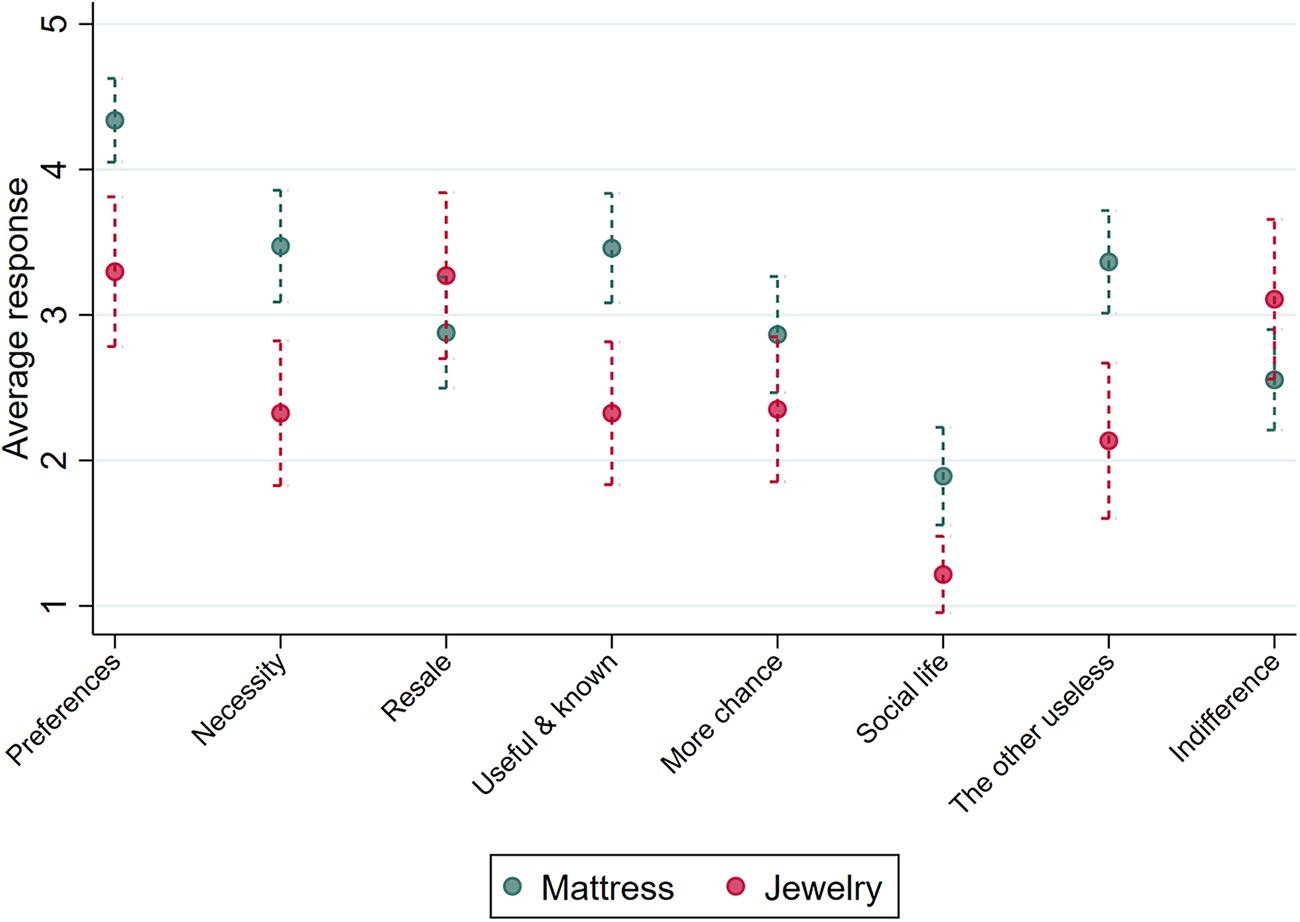
The questionnaire included in the experiment asked Decision-makers about the reasons behind their allocation. Specifically, they have to qualify a set of eight reasons with a number from 1 to 5, where 1 is “not at all agree” and 5 is “totally agree.” Figure 3 presents the respective averages, separately for participants who assigned more tickets to the mattress (emerald points) or jewelry lotteries (red points). As in Figure 2, here, we also report the results only for Decision-makers whose Referring friend received tickets for the unknown good. Figure A1 in the Appendix includes all participants and shows similar results. The evidence in Figure 3 matches the fact that the mattress is a non-status good and jewelry is a status good. For instance, subjects assigning more tickets to the mattress lottery mention significantly more the necessity and usefulness motives, as well as the fact that the other good (i.e., jewelry) is useless.
Reasons for assigning more tickets to the jewelry and mattress lotteries. The dots show the average response on a scale of 1–5 for each of 8 possible reasons the Decision-makers had for assigning more tickets to either the mattress or jewelry lotteries. The bars represent the 95% confidence interval for the mean. The eight reasons are (a) “Preferences”: participants respond that they prefer the good; (b) “Necessity”: participants respond that they prefer the good; (c) “Resale”: participants chose that good because it has a higher resale value; (d) “Useful and known”: participants chose that good because they know it and they know that it is more useful; (e) “More chance”: participants chose that good because they believe that it has a higher chance in the lottery; (f) “Social life: the good will improve their social life; (f) “The other useless”: chose that good because the other is useless; and (g) “Indifference”: indifferent between both goods. The estimates correspond to the sample of Decision-makers whose Referring friend received tickets for the unknown good lottery. In that sample of 224 participants, 74 assigned more tickets to the mattress lottery and 37 to the jewelry lottery. The rest assigned the same number of tickets to each lottery, and we did not ask them about their reasons
6.2. Main results
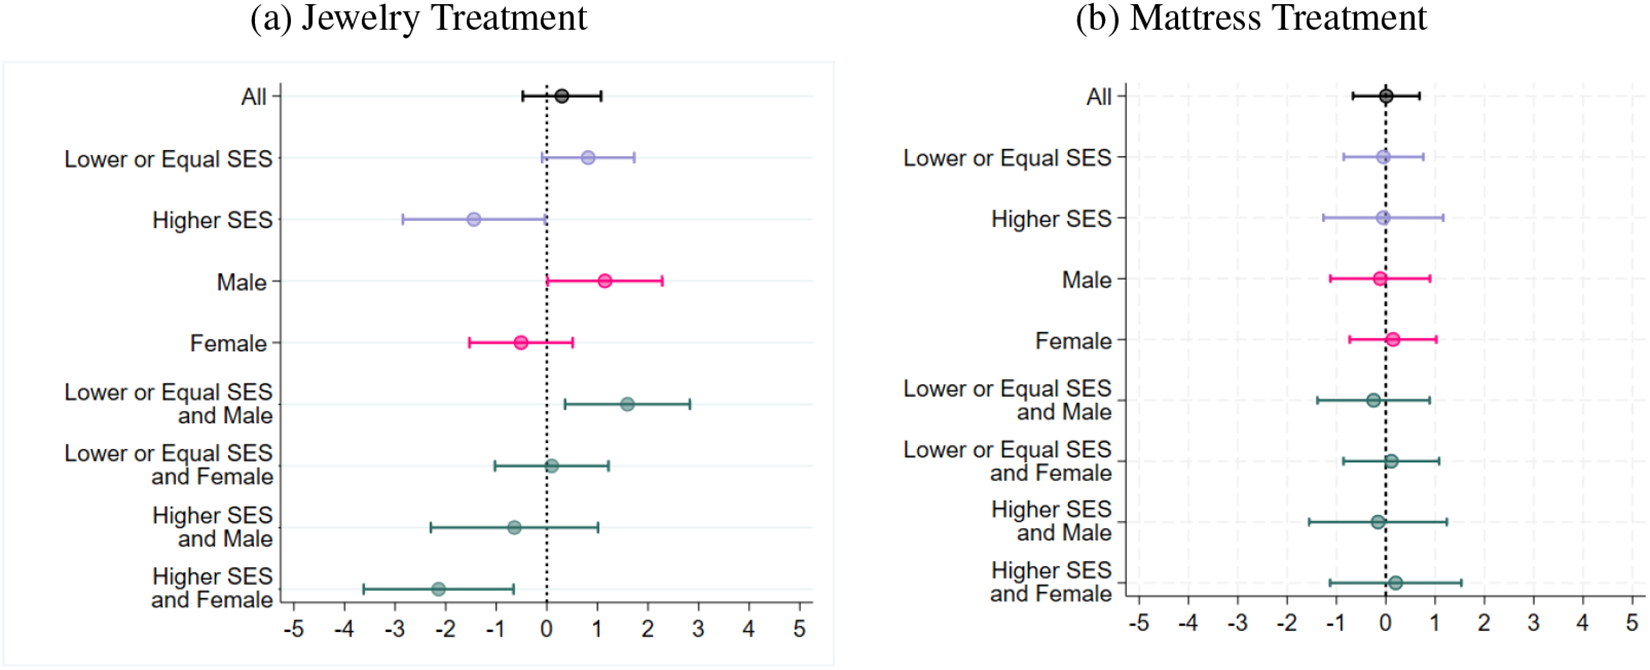
Figure 4 presents the main results of the experiment. They all correspond to regression estimates obtained by regressing the number of tickets assigned to the jewelry lottery on binary variables indicating the different treatments, with the treatment with the unknown good being the omitted category. Panel (a) shows the coefficient for the jewelry treatment, and panel (b) shows the coefficient for the mattress treatment. The coefficients at the top of each panel show the average treatment effect, and the rest correspond to heterogeneous effects. Table A4 in the Appendix presents the regression results in more detail.
A general look at Figure 4 gives a clear impression of the main results of the experiment. There are no significant effects of the mattress treatment (panel b) and several significant effects of the jewelry treatment (panel a). We extract three main conclusions from the results in Figure 4. Each of them refers to one of the three elements of the anatomy of status-motivated consumption introduced in Section 2.
The first element of the anatomy of status-motivated consumption referred to the characteristics of the goods that yield status benefits. In Section 3, we showed that subjects associate both the consumption of mattress and jewelry with a high social position but only identify the consumption of jewelry as socially visible. A first conclusion from the results in Figure 4 is then that the association of the consumption of a good with a high position in society is not sufficient for that good to generate status benefits for the consumer. The social visibility of consumption is a necessary condition for those benefits to arise.
The second conclusion from the results in Figure 4 refers to the nature of the reference group, the second element of the anatomy of status-motivated consumption. An important advantage of our experiment is that the reference group is well-specified in two respects. First, friends constitute a precisely defined reference group, in opposition to generic categories such as consumers or the upper class. Second, the friends in our paper are not “exogenously” specified by the researcher, for instance, by choosing them between classmates or from some prespecified list, but correspond to what the experimental subjects define as their friends. The second main conclusion is then that comparisons with friends constitute a source of status-motivated consumption externalities among 20-year-olds.
Jointly considering these first two conclusions yields an additional insight into the structure of status-motivated consumption externalities. The key to that insight is that friends in general know if one of them has a new mattress. Thus, the real contrast between the consumption of the mattress and the piece of jewelry lies in the visibility of that consumption, not to friends, but to people who are external to the friendship relationship. Our experiment thus shows that the way in which these comparisons work is that 20-year-olds care about things their friends have that can be shown to other people.
The third main conclusion is obtained from the second and third coefficients in the left panel of Figure 4. On average, Decision-makers assigned only slightly more lottery tickets to the jewelry lottery when their Referring friend received tickets for that good instead of the unknown one. The corresponding point estimate of 0.3 is positive but not statistically significant (see Table A4 in the Appendix). This average effect masks two large and opposite treatment effects that arise when considering the relative socioeconomic position of the Decision-maker compared to the Referring friend. Decision-makers in a worse or equal position assigned 0.8 more tickets to the jewelry lottery when the Referring friend randomly received tickets for that good instead of the unknown one. On the contrary, that same comparison yields a point estimate of −1.4 for those Decision-makers in a better position.Footnote 15
Treatment effects on the number of tickets assigned to the jewelry lottery. Note: The graph shows the point estimates and 95% confidence intervals corresponding to estimating different versions of Equation 3. Table A4 in the Appendix provides additional estimation results. In all the regressions in the graph, the dependent variable is the number of tickets assigned to the jewelry lottery, all observations (N = 398) are considered, and the two binary variables indicating the jewelry and the mattress treatments are simultaneously included. In the regressions with heterogeneous effects, we further include the relevant interactions of both treatments. The colors correspond to each of the four different specifications. The second specification includes both treatment variables and their interaction with the variable that identifies whether the Decision-maker is in a better or worse/equal socioeconomic position with respect to the Referring friend. This position refers to the level of education of the parents of the members of the pair. We consider parents’ education in eight categories resulting from the interaction of the maximum level reached considering four levels (primary, secondary, technical, and university) with whether that maximum level was completed. The third specification is similar to the second, but the interaction is done with a binary variable indicating the sex of the Decision-maker. Both interactions, the one with the relative position and the one with the sex of the Decision-maker, are included in the fourth specification. In Table B6 in the Online Appendix, we present a robustness exercise considering a “Lower or Equal” interaction with four categories instead of eight. This exercise yields a very similar result. Since the dependent variable could be interpreted as being censored, Table B5 in the Online Appendix estimates the same specification using a two-tailed censored regression model (Tobit). The results are consistent with the ones in this figure
The third main conclusion thus refers to the role of the relative position of the consumer with respect to her reference group, which is the third element of our anatomy of status-motivated consumption. Our result on Decision-makers assigning more tickets to the socially visible good when they are in a worse or equal position compared to their reference group constitutes evidence of Duesenberry’s demonstration effects. The idea that the less well-off may incur in status-motivated consumption to “keep up” with those in higher social positions goes back to Thorstein Veblen and has occupied a central place in the literature since then. Although demonstration effects have been shown to exist in a few correlational studies (Bertrand & Morse, Reference Bertrand and Morse2016; Charles et al., Reference Charles, Hurst and Roussanov2009), we are not aware of any studies that prove their existence using experimental methods. The result of Decision-makers assigning fewer lottery tickets to the socially visible good when they are in a better position can be taken as evidence of snob effects. This type of effect was also found using experimental methods by Bursztyn et al. Reference Bursztyn, Ferman, Fiorin, Kanz and Rao(2018). They show that high-income consumers of a platinum credit card in Indonesia demand a more exclusive card after lower-income consumers gain access to the platinum one.
Beyond our three main conclusions, the left panel of Figure 4 also shows statistically significant heterogeneous effects by gender. Men assigned 1.1 more lottery tickets to jewelry when the Referring friend received tickets for that good instead of the unknown one. The point estimate for women is negative but not statistically significant at conventional levels.
In principle, it could be that the effects by gender and relative position do not constitute separate results but capture the same variation in the data. This could happen if, for example, women in our sample are in a better socioeconomic position than men. This is not the case in our data. The gender distribution is similar between the worse-positioned and better-positioned groups (52% vs 51%), and the share of Decision-makers in a worse or equal position is similar across men (30%) and women (31%). Regression results in Table A4 in the Appendix show that when we simultaneously include the interactions of the treatments with the relative position and the gender variables, we obtain significant coefficients for both interactions.Footnote 16
As a result of the additive nature of the effects by gender and relative position, Figure 4 shows that men in a worse position exhibit the largest positive effect and women in a better position exhibit the largest negative effect. Men in a worse position assign 1.3 additional lottery tickets to jewelry when their friend received tickets for that good instead of the unknown good. Women in a better position assign 2.7 fewer tickets to jewelry, almost a full standard deviation, when their friend received tickets for that good instead of the unknown one. For the other two combinations of relative position and gender, the two forces offset each other and the point estimates are very close to zero.
We extract two conclusions from these heterogeneous effects by gender. First, they are interesting per se as they connect to a broad literature study on behavioral differences between men and women (Bertrand, Reference Bertrand, Card and Ashenfelte2011) and to a more specific but important literature study on gender differences in performance in competitive environments (Antonovics et al., Reference Antonovics, Arcidiacono and Walsh2009; Buser et al., Reference Buser, Niederle and Oosterbeek2014; Cai et al., Reference Cai, Lu, Pan and Zhong2019; Gneezy et al., Reference Gneezy, Niederle and Rustichini2003; Gneezy & Rustichini, Reference Gneezy and Rustichini2004; Niederle & Vesterlund, Reference Niederle and Vesterlund2007; Shurchkov, Reference Shurchkov2012; Tungodden & Willén, Reference Tungodden and Willén2022). A classic conclusion of simple models of status-motivated consumption is that relative concerns can affect effort provision (Bowles & Park, Reference Bowles and Park2005). If the prizes in competitive environments are perceived by men and women in the same way they perceive jewelry in our experiment, in those environments, men would provide higher effort than women. Thus, status concerns constitute an additional candidate to explain gender differences in performance in competitive environments where relative payoffs are salient.
The second conclusion requires introducing an additional piece of evidence on how the treatments differentially affected men and women’s perceptions of their position in society. As part of the general questionnaire implemented after the experiment, we asked subjects to rank themselves on a scale from 1 to 9, where 1 represents the poorest and 9 the richest people in society. On average, subjects positioned themselves at 4.8, with a standard deviation of 1.4.Footnote 17
Figure 5 shows how the subjective ranking of male and female Decision-makers changed in opposite directions when their Referring friends received tickets for jewelry instead of the unknown good. Men reduced their subjective position by 0.4 points, and women increased their position by 0.5 points.Footnote 18 These effects, together with the effects by gender on the allocation of lottery tickets, are entirely consistent with the logic of the demonstration and snob effects discussed above. When a friend of a male Decision-maker, who is most likely of the same sex, received tickets for the jewelry lottery, that Decision-maker felt in a lower socioeconomic position and assigned more tickets to jewelry. In contrast, female Decision-makers reacted in the opposite direction when a friend received tickets for the jewelry lottery. They improved their subjective position, which offset any effects that treatment could have on their allocation of tickets. Summing up, the second conclusion we extract from the heterogeneous effects by gender is that psychological status concerns could be behind the heterogeneous gender effects. We see this potential relationship as further strengthening the global status interpretation of the results of our experiment.
Treatment effects on Decision-makers’ subjective relative position. Note: Each dot represents the coefficient estimate, while bars represent the 95% confidence interval. The coefficients are obtained from Table A5 of the Appendix, with the colors corresponding to each of the four different specifications. The second specification includes the treatment variable and the interaction of the treatment with the variable that identifies whether the Decision-maker is in a better or worse socioeconomic position with respect to the Referring friend. The third specification is similar to the previous one, but the interaction is with a binary variable indicating the sex of the Decision-maker. Both interactions are included in the fourth specification

Robustness checks. Online Appendix B3 provides several important robustness exercises for our main results. All these replicate Table A4 under different scenarios and confirm our results. First, as we are simultaneously assessing the significance of various coefficients, a concern arises regarding the potential for false positives resulting from multiple hypothesis testing. Table B4 displays the adjusted p-values recommended by Romano and Wolf Reference Romano and Wolf(2005); Romano and Wolf Reference Romano and Wolf(2016) and Westfall and Young Reference Westfall and Young(1993) to address this concern. Second, since the dependent variable could be interpreted as being censored, Table B5 reports the main results with a two-tailed censored regression model (Tobit). Third, the estimates in Table B6 consider an alternative definition of socioeconomic status considering four categories for parents’ education instead of eight. Fourth, Table B7 shows that the heterogeneous treatment effects by gender are robust to excluding the 53 Decision-makers in cross-gender pairs. Finally, the results in Table B8 are obtained without the 74 Decision-makers who took their decision after the lottery for their Referring friend had already taken place.
7. Conclusions
This paper provides experimental evidence on the existence of status-motivated consumption among 20-year-olds. The paper combines a set of methodological innovations aimed at overcoming the arduous task of jointly identifying a consumption externality and classifying that externality as being motivated by status concerns. The relevance of our experimental results is enhanced because the implementation of those innovations is done in the field and with average subjects. Although the choices made in the experiment have real-life consequences in terms of the prizes obtained, a limitation of the study is that those same innovations that allow us to isolate the status motive behind our results create a choice environment that subjects do not experience in their life outside the experiment.
Our experimental population is at an age in which important decisions are made in terms of present and future well-being. The impact of status-motivated consumption on those decisions, such as education or healthy habits, is beyond the scope of the experiment. However, if health and education are mostly non-positional goods, theoretical models predict that the status-motivated consumption externality could have negative consequences on the consumption of these two goods and thus on the human capital accumulation of this young population (Frank et al., Reference Frank, Posner and Mullainathan2005). In other words, individuals could assign less time and money to accumulate human capital because they dedicate their resources to positional consumption. In particular, in the very unequal social contexts of Latin America, the search for a better social status through consumption among the youth could lead to severe losses, both at the individual and aggregate social levels, and especially for the most disadvantaged.
Supplementary material
The supplementary material for this article can be found at https://doi.org/10.1017/eec.2024.15.
Acknowledgements
The experiment is registered in the Registry for Randomized Controlled Trials operated by the American Economic Association: RCT ID AEARCTR-0003392. The replication material for the study is available at DOI: 10.17605/OSF.IO/EZ4VP. We especially thank Andrea Vigorito for the helpful discussions and support during the early stages of the project. We are very grateful to Ori Heffetz, who provided extensive comments on previous versions of the paper. Cecilia Toledo did excellent work as the head of the fieldwork of the experiment. Mauro Castiella provided an outstanding research assistantship.


 Open access