





Introduction
Democracies around the world face significant challenges, including threats to electoral integrity and a decline in legitimacy perceptions among citizens. Low levels of perceived legitimacy are particularly relevant for the European Union (EU), with some scholars even referring to a ‘crisis of legitimacy’ (Hobolt and Tilley Reference Hobolt and Tilley2014). Over the last decade, EU legitimacy has been challenged by various crises, such as the euro and the refugee crisis, and (related) developments, such as rising populism and Euroscepticism. These challenges are compounded by the complexity of the EU’s multi-level governance system, where maintaining citizen trust and satisfaction is crucial for the legitimacy of the EU’s democratic processes. In an attempt to make the EU less dependent on performance evaluation or ‘output legitimacy’ (Scharpf Reference Scharpf1999), the 2014 European elections marked a decisive step towards increasing citizens’ influence on EU politics through the personalization of EU politics (cf. Gattermann Reference Gattermann2022). The European Parliament aimed to motivate citizens to vote in the 2014 elections with the campaign slogan ‘This time it’s different’. The difference compared to previous elections was that the votes of European citizens had a more direct and transparent impact on determining the next Commission President. This desire for a stronger role for citizens can be seen in the light of procedural fairness theory, which argues that citizens judge political institutions by evaluating their internal processes, fairness, accountability, and transparency (Grimes Reference Grimes2006; Tyler Reference Tyler2006a), i.e., focusing on ‘throughput’ rather than ‘output’ legitimacy (Schmidt Reference Schmidt2006; Schmidt and Wood Reference Schmidt and Wood2019).
In practical terms, for the 2014 elections, the mainstream European parties nominated pan-European ‘lead candidates’ and agreed among themselves that they would support the lead candidate of the party that won the most seats in the European Parliament elections to become the new Commission President. This process became known as the Spitzenkandidaten process.Footnote 1
The main objective of the intended indirect election of the Commission President by the electorate was to make the EU polity ‘more palatable to voters’ (Popa, Rohrschneider, and Schmitt Reference Popa, Rohrschneider and Schmitt2016, 469). This included, among other things, the goal of increasing the legitimacy of the Commission and thus combating the often-proclaimed democratic deficit of the EU by increasing the general interest and participation of citizens in EU democracy (cf. Hobolt Reference Hobolt2014; Schmitt, Hobolt, and Popa Reference Schmitt, Hobolt and Popa2015; Maier, Faas, Rittberger et al. Reference Maier, Faas, Rittberger and Fortin-Rittberger2018).
The 2014 European Parliament (EP) elections fulfilled the promise of being ‘different’, as the winning lead candidate, Jean-Claude Juncker (European People’s Party (EPP)), actually became Commission President. The Spitzenkandidaten system was quite popular among Europeans. The Eurobarometer 89.2 study from 2018 reports that 71.1% believed that the direct election of the Commission President ‘represents significant progress for democracy within the EU’, 73.2% agree that it improves transparency, 71.6% believe that it improves the legitimacy of the Commission, and 52% say that the candidate system makes it more likely that they will vote in the upcoming 2019 elections (European Commission and European Parliament 2023). However, the 2019 EP elections turned out differently. Despite the continuation of the Spitzenkandidaten system, including the nomination of lead candidates by six European political parties (instead of five in 2014) and election campaigns featuring these candidates, e.g., in national and Europe-wide TV debates (e.g., Goldberg Reference Goldberg2023), the last and crucial step of the process was not taken. Instead of one of the Spitzenkandidaten, the European Council nominated a new, external candidate, Ursula von der Leyen, who was eventually elected by the EP as the new Commission President. While the overall success of the Spitzenkandidaten process in 2014 can be debated, the process clearly did not achieve its main goal of making the citizens’ vote more relevant in 2019.
It could even be argued that not having a Spitzenkandidaten process in the first place would have been better than breaking its central promise in the selection of Commission President. After all, the Spitzenkandidaten process clearly resonates with established principles of accountability and democratic procedural fairness that citizens are familiar with from national elections in parliamentary democracies: parties compete with different ideological programs but also with different candidates for the highest political office, and the leader of the party that wins the election gets the opportunity to form a governing coalition and become prime minister (or chancellor). Even in coalition governments where the candidate from a smaller party can become head of government, it is exceedingly rare that a politician that was not part of the election campaign in any function gets chosen. If a similar expectation is raised at the European level, but subsequently not fulfilled, citizens may be disenchanted. As a result, the goal of increasing the legitimacy of the EU does not seem to have been achieved, and worse, citizens may be even less satisfied with the functioning of democracy at the European level than before.
We investigate the traction of procedural fairness in the context of the Spitzenkandidaten process in two different studies. Study 1 presents the results of a natural experiment, in the form of an unexpected event during the survey design (UEDS) study, in the context of the 2019 European Parliament elections. We examine data from a survey that was in the field at the time when the Council announced Ursula von der Leyen as its proposed candidate, in a clear break with the intended Spitzenkandidaten logic. By comparing responses from those who answered the survey before the Council’s announcement with those who answered the survey afterward, we are able to exploit this natural experiment setting. Study 2 presents original data collected in the run-up to the 2024 European Parliament elections, in which we presented respondents with alternating scenarios in which they either could or could not vote for a Spitzenkandidat in a European primary, followed by different Council actions in which the Council either did not intervene, proposed the winning Spitzenkandidat as Commission President, or proposed someone else, in a 2 × 3 experimental design (preregistered). As our outcome variables, we analyze satisfaction with the Spitzenkandidaten process and satisfaction with EU democracy.
Both Study 1 and Study 2 show that procedural fairness theory has little impact on citizens’ satisfaction with the EU or the Spitzenkandidaten process. In addition to the weak evidence for procedural fairness theory, this implies that future actions by European party groups or the Council in nominating the President of the European Commission are likely to have negligible effects on EU legitimacy.
Procedural fairness theory and the Spitzenkandidaten process
Procedural fairness theory
Procedural fairness theory originated in social psychology, where researchers sought to understand the conditions under which people trust authorities and follow their orders without the application of force (Tyler Reference Tyler2006a; Tyler Reference Tyler2006b). According to this line of research, how individuals evaluate the processes behind authorities’ decisions is important. Although these evaluations are based on objective aspects of a process, judging these aspects as fair or unfair is subjective (Esaiasson et al. Reference Esaiasson, Persson, Gilljam and Lindholm2019). When people think that processes are fair, unbiased, and give opportunities for participation, and when the processes respect individuals’ rights, legitimacy beliefs are likely to be high (Tyler Reference Tyler2006b; Skitka, Bauman, and Lytleet Reference Skitka, Bauman and Lytle2009). We follow procedural fairness theory and use the sociological understanding of legitimacy, which is the belief that rules set by an authority are appropriate (Suchman Reference Suchman1995; Weber Reference Weber1999).
The central ideas of procedural fairness theory have been widely adopted in sociology and political science, where they have been used to understand the conditions under which citizens consider a political system legitimate. In these fields, procedural fairness becomes an institutional feature of a political system that contributes to legitimacy. Fair governmental procedures create a belief in the legitimacy of a political system and its actions. Here, the origin of procedural fairness theory in Weber’s (Reference Weber1999) concept of legal-rational sources of belief in legitimacy (Legitimitätsglaube) becomes apparent. Rather than relying on customs and values (traditional authority) or belief in a central figure (charismatic authority), rational sources of legitimacy stem from the processes behind the creation and enforcement of binding rules. Similarly, Easton argues that legitimacy is an important component of diffuse support for a political system and stabilizes it (Easton Reference Easton1965). Importantly, Easton distinguishes legitimacy from support based purely on a system’s performance. Legitimacy beliefs are notably bolstered by ‘belief in the validity of the structure and norms’ (Easton Reference Easton1965, 287). Therefore, good procedures are theorized to increase legitimacy not because they lead to better outcomes or decisions, but because the procedures themselves act as a source of legitimacy. Even when people judge an outcome as bad, this should not decrease their belief in the legitimacy of the political system as long as they see the exercise of authority as morally justified (Easton Reference Easton1975).
Procedural fairness theory in political science has been applied in local and national contexts (e.g., Anderson Reference Anderson2005; van der Meer and Hakhverdian Reference van der Meer and Hakhverdian2017; Esaiasson et al. Reference Esaiasson, Persson, Gilljam and Lindholm2019; Strebel, Kübler, and Marcinkowski Reference Strebel, Kübler and Marcinkowski2019; Werner and Marien Reference Werner and Marien2022) as well as in complex multinational polities such as the European Union (Fossum and Eriksen Reference Fossum and Eriksen2000; Risse and Kleine Reference Risse and Kleine2007; Licht, Naurin, Esaiasson et al. Reference De Fine Licht, Naurin, Esaiasson and Gilljam2014; Wratil and Wäckerle Reference Wratil and Wäckerle2023) or international institutions (Bernauer and Gampfer Reference Bernauer and Gampfer2013; Dellmuth, Scholte, and Tallberg Reference Dellmuth, Scholte and Tallberg2019; Bernauer, Mohrenberg, and Koubi Reference Bernauer, Mohrenberg and Koubi2020). Multiple studies applying procedural fairness theory show that citizens find political institutions to be more legitimate when they perceive the process by which these institutions are created, staffed, and/or changed to be accountable and transparent, and conversely, that they perceive these institutions to be less legitimate when these processes are perceived to be opaque or not following pre-established rules (Gibson Reference Gibson1989; Gangl Reference Gangl2003; Hibbing and Alford Reference Hibbing and Alford2004; Grimes Reference Grimes2006; Ulbig Reference Ulbig2008). In European studies, such ideas underpin the idea of throughput legitimacy (Schmidt Reference Schmidt2006; Schmidt and Wood Reference Schmidt and Wood2019). Here, procedural fairness connects to discussions about the sources of legitimacy centered around procedures vs. performance (Scharpf Reference Scharpf1999). If procedures matter most, the EU derives legitimacy through pathways of citizen participation. If performance matters most, the EU mostly derives legitimacy by creating favorable outcomes for EU citizens.
Procedural fairness theory has also been heavily contested. Earlier studies by Anderson and Guillory (Reference Anderson and Guillory1997) and Anderson (Reference Anderson2005) show that citizens care most about political outcomes they prefer, regardless of the procedures that led to them. This suggests that citizens might prioritize outcome favorability in their evaluation of legitimacy, indicating a preference for what has been termed a ‘stealth democracy’ (Hibbing and Theiss-Morse Reference Hibbing and Theiss-Morse2002). In the case of the EU, outcome-based evaluations may also matter more than perceptions of being democratic and transparent (Fuchs Reference Fuchs, Fuchs and Klingemann2011), though findings remain contradictory. Wratil and Wäckerle (Reference Wratil and Wäckerle2023) investigate the potential impacts of changing the EU’s institutional design and show that procedural reforms only have a small effect on legitimacy beliefs, whereas Schäfer, Treib, and Schlipphak (Reference Schäfer, Treib and Schlipphak2022) conclude that increasing citizen participation and rendering EU decision-making more transparent are important. However, Arnesen, Broderstad, Johannesson et al. (Reference Arnesen, Broderstad, Johannesson and Linde2019) find that the perceived legitimacy of EU membership referenda depends on outcome favorability. Moving beyond the dichotomy of processes versus procedures, an emerging consensus in the literature is that both favorable outcomes and fair processes matter (Dellmuth et al. Reference Dellmuth, Scholte and Tallberg2019; Esaiasson, Persson, Gilljam et al. Reference Esaiasson, Persson, Gilljam and Lindholm2019).
The EU’s Spitzenkandidaten process
The Spitzenkandidaten process was introduced to address the procedural fairness gap in the selection of the European Commission by giving Europeans a choice in the matter. It changes the objective features of the selection process to increase the perceived legitimacy of EU institutions. This strategy of changing procedures themselves instead of changing communication strategies or improving relevant outcomes closely mirrors policy recommendations from the procedural fairness literature (Tyler Reference Tyler2006b). Accordingly, the Spitzenkandidaten process has the potential to bolster legitimacy beliefs because it increases the match between democratic values that EU citizens hold and the perception of the EU as a democratic system. For citizens who believe that democracy is an important good (which we assume are most citizens in established democracies), a democratic EU is important. When the EU institutions then conform to democratic beliefs, they are likely to be seen as more legitimate. Although the Spitzenkandidaten system does not allow for the direct election of the head of the Commission, as it would in presidential systems, it nevertheless increases the influence that citizens have in the process, increasing the match between democratic expectations and practice.
However, reflecting the debates in the procedural fairness literature on the importance of outcome versus process characteristics, research on EU public opinion remains doubtful about the potential of Spitzenkandidaten. First of all, the European elections are famously still regarded by most as second-order elections (Hobolt Reference Hobolt2014; Gattermann, de Vreese, and van der Brug Reference Gattermann, de Vreese and van der Brug2021). Although the European character of the elections has increased in the last decade, national factors still play an outsized role (Braun Reference Braun2021). The Spitzenkandidaten processes of 2014 and 2019 did little to change this situation, as the Spitzenkandidaten remained largely unknown and irrelevant to people’s choices (Braun and Schwarzbözl Reference Braun and Schwarzbözl2019; De Wilde Reference De Wilde2020; Richter and Stier Reference Richter and Stier2022). In 2014, the candidates were barely visible in the national media spheres in Europe, because the candidates had to share the public sphere with national politicians who are not interested in promoting European candidates (Braun and Schwarzbözl Reference Braun and Schwarzbözl2019), leading to little or no voter mobilization (Schulze Reference Schulze2016). Richter and Stier reach similar conclusions and find that voters simply do not get enough exposure to the candidates in the media (Richter and Stier Reference Richter and Stier2022). However, Richter and Stier (Reference Richter and Stier2022) also find voter interest and willingness to learn about the Spitzenkandidaten. This suggests there is untapped potential that could be realized when levels of news exposure are sufficient (Gattermann and De Vreese Reference Gattermann and De Vreese2020).
An unintended legitimacy backlash?
Procedural fairness theory implies a double-edged sword: if the selection of leaders through the Spitzenkandidaten procedure is considered fair – in this context meaning the consideration of the citizens’ vote for a given lead candidate in the EP elections – there may be a bonus for the EU’s legitimacy if the Council respects the logic of the procedure. This legitimizing effect is unlikely to be achieved if the logic of the procedure is not followed. Although we are the first to research this in the context of the Spitzenkandidaten process, studies on deliberative minipublics find similar effects. Minipublics seem to only increase the legitimacy of a political process if recommendations from the minipublic are actually adopted (Boulianne Reference Boulianne2018; Germann, Marien, and Muradova Reference Germann, Marien and Muradova2024). Having the opportunity to voice their opinion only matters to citizens when they are also able to influence the decision-making process (Ulbig Reference Ulbig2008). Similarly, if the Council disregards the Spitzenkandidaten procedure, procedural fairness theory predicts a legitimacy backlash. If political elites explicitly disregard a participatory process, evaluations of fairness will likely decrease. Consequently, perceived legitimacy should be lower. Research on minipublics empirically demonstrates this phenomenon. When recommendations made by a minipublic are ignored by decision-makers, the resulting legitimacy beliefs can be lower than if no deliberative forum had taken place (Van Dijk and Lefevere Reference Van Dijk and Lefevere2023; Goovaerts, De Fine Licht, and Marienand Marien Reference Goovaerts, De Fine Licht and Marien2025). This means that the change in institutional setup decreased perceived legitimacy instead of increasing it or having no effect.
In our case, legitimacy beliefs may decrease more if the Spitzenkandidaten process were overridden than if the Council were to propose a president without it. In other words, the more inclusive the selection process is, the stronger the legitimacy backlash if the process is not followed to its logical conclusion. Similarly, a lack of negative reaction to overturning the process may suggest evidence against procedural fairness theory in this context. However, given the aforementioned doubts about the broader potential of the Spitzenkandidaten process – such as second-order election context, unknown and invisible candidates, etc. – citizens’ lack of a negative reaction could also represent a more general apathy toward the Spitzenkandidaten process and hence not necessarily disprove procedural fairness theory altogether. This brings us to our first research question:
RQ 1: Does the perceived legitimacy of the EU decrease when the Council proposes a candidate for Commission President who was not one of the Spitzenkandidaten?
A primary system for the EU
Primaries to select European party candidates could be another way to increase the EU’s throughput legitimacy, addressing many of the issues raised by critics of the Spitzenkandidaten process. Primaries would give Europeans an unprecedented opportunity to participate in EU politics, potentially increasing the perceived legitimacy of EU institutions in line with procedural fairness theory. With the current Spitzenkandidaten system, citizens in EU member states are only able to influence the election through the vote for one of the national parties. Given the large and complex party system at the EU level, this amount of participation might not be sufficient according to citizens’ beliefs in democratic values. Allowing citizens an avenue to directly influence candidate selection prior to the election could further create alignment between the moral expectations of democracy and perceptions of democracy in the EU institutions.
Primaries, as part of the Spitzenkandidaten process, have been used by several European parties in the past. In 2014, the European Greens held an online election (primary) for their two candidates. In the run-up to the 2019 elections, former Finnish Prime Minister Alexander Stubb campaigned across Europe to become the EPP group’s Spitzenkandidat. However, the party members elected Manfred Weber as their Spitzenkandidat at their congress. Primaries were not used by any of the party groups in the 2024 elections and thus seem to have been discarded as a selection procedure. The reason why the Europarties no longer use primaries is due to internal disagreements, rather than a common understanding of their impact on the legitimacy of the EU (Wolfs et al. Reference Wolfs, Put and Van Hecke2021). Arguably, the main conditions for the functioning of primaries were not met in the two cases mentioned. In the case of the 2014 Green primary, there was no significant campaigning by competing candidates across member states. In the case of the 2019 EPP primary, ordinary citizens were not allowed to vote for their preferred candidate. While the Europarties seem to be retreating from the idea of holding primaries, the question remains whether primaries could generate more interest in and legitimacy for European elections and the EU if they were properly organized.
Primaries can also be seen as strengthening the institutional legitimacy of the European Parliament. Compared to national systems, the European Parliament is in a constant power struggle with the European Council to determine the future of the Commission. In 2014, the Parliament quickly approved Jean-Claude Juncker as Commission President with a 3/4 majority. Although Hungary and the United Kingdom opposed his nomination, most other member state governments were unwilling to reject the Parliament’s unified position. No such unified position could be found in 2019. Faced with pressure from national governments, the Spitzenkandidaten who had the potential to be elected – Manfred Weber and Frans Timmermans – withdrew (Crum Reference Crum2023). We argue that this situation could have been different if Europeans had been more involved in the nomination of these candidates. Backed by a popular vote, many national parties participating in national governments might not have dared to question the legitimacy of the European candidates so openly.
In the literature on party leadership selection for political office, procedural fairness theory has received mixed reviews. For Belgium and Israel, there is limited evidence that primaries are associated with positive effects for democracy and increase citizens’ satisfaction with democracy (Shomer, Put, and Gedalya-Lavy Reference Shomer, Put and Gedalya-Lavy2016). Voters think more highly of candidates selected through primaries compared to those selected by elites and report a higher propensity to vote for a party if its leading candidate is chosen in a primary in Mexico (Ascencio and Chang Reference Ascencio and Chang2024). Yet, some scholars argue that primaries and other candidate selection intra-party processes have negative effects. For example, they may lead to less representativeness, less party unity, and more intra-party factionalism (Hazan and Rahat Reference Hazan and Rahat2010). Others show that holding primaries can have mixed effects or no significant effects at all. For example, Schwenk (Reference Schwenk2023) finds that Spanish voters perceive primary winners to be less corrupt but also less experienced and less competent than party leaders appointed or elected by other means. Wauters and Kern (Reference Wauters and Kern2021) find no effect of primaries on Belgian citizens’ perceptions of trustworthiness or their likelihood to vote for parties.
Finally, research in public opinion and comparative politics shows that political leaders are increasingly central to voter mobilization (Ferreira Da Silva, Garzia, and De Angelis Reference Ferreira Da Silva, Garzia and De Angelis2021). Weak or disliked leaders may therefore discourage participation, and primaries may help to prevent the nomination of such weak or disliked leaders as lead candidates. A primary and related stronger involvement of the public would be a new and important step towards personalizing European politics, which is still perceived by citizens as distant and elite-driven. In national contexts, the personalization of politics has been argued to have negative effects (Hazan and Rahat Reference Hazan and Rahat2010; Karvonen Reference Karvonen2010; Renwick and Pilet Reference Renwick and Pilet2016). In the case of the European Union, however, the underdevelopment of European parties and their lack of public recognition may change this assessment. Personalization might improve the potential for truly European campaigns that mobilize European citizens.
For the case of properly organized primaries, we formulate a second research question:
RQ 2: Do open primaries for the selection of Spitzenkandidaten have a positive effect on the perceived legitimacy of the EU?
Testing procedural fairness in a mixed-methods approach
Our research contributes to the literature on procedural fairness by examining a multi-country context, beyond hypothetical examples or small-scale deliberation forums. Furthermore, we contribute to the literature on EU legitimacy (Hobolt and de Vries Reference Hobolt and de Vries2016) by investigating the potential legitimating effects of institutional reform. We proceed by combining observational, quasi-experimental data with a survey experiment. Using two approaches compensates for the limitations of the individual designs. Quasi-experimental studies benefit from using real-world data tied to large-scale policy changes. As a result, we can test if the overturning of the Spitzenkandidaten process had immediate effects on the perceived legitimacy of the EU without having to extrapolate from a fictitious scenario in a survey or a laboratory. However, quasi-experimental settings have weaker experimental control. In survey experiments, researchers can control how respondents learn about a policy change, albeit at the cost of some realism. Specifically, we can expose all respondents to information about the Spitzenkandidaten process. In our first quasi-experimental study, it was unclear how many survey respondents were aware of von der Leyen’s nomination at the time of the survey. By complementing this with a second, experimental study, we can learn whether our results from the first study are due to indifference towards the process (if respondents’ attitudes do not change even when being exposed to institutional changes) or a lack of awareness of the real-life processes (if respondents’ attitudes change when being exposed to institutional changes).
Finally, in the absence of an agreed measurement strategy for the multifaceted concept of legitimacy, we opt to measure satisfaction with the Spitzenkandidaten process itself and satisfaction with democracy in the EU (cf. Lenowitz Reference Lenowitz2019). These factors measure the alignment of the EU with commonly accepted principles of democracy and the perception of the institutional quality of the Spitzenkandidaten process. This reflects the mechanism through which we expect the Spitzenkandidaten process to impact the perceived legitimacy of the EU: a positive evaluation of the Spitzenkandidaten process leads to stronger beliefs that the EU functions according to democratic principles. Therefore, instead of relying on a distant proxy for legitimacy, such as confidence, trust, or the perceived benefit of the EU, we measure key variables in the hypothesized process that leads to legitimacy.
Study 1: The (failed) 2019 EP Spitzenkandidaten procedure
As a first step in answering RQ1, we examine whether the failure of the Spitzenkandidaten process in 2019, in particular the broken promise to elect the winning Spitzenkandidat as the new Commission President, led to a negative reaction among European citizens. Procedural fairness theory would suggest that many citizens were not only disappointed with the specific outcome of the 2019 process but also more generally less satisfied with the functioning of democracy at the EU level. However, given the large body of research showing that interest in and knowledge of how the EU works remains low, one might remain skeptical about finding such negative reactions. Indeed, it seems equally plausible that the failure of the Spitzenkandidaten process in 2019 had no impact on satisfaction with democracy in the EU. To explore these possible public (non-)reactions to the failed process, we use unexpected events during survey design (UESD) (Muñoz, Falcó-Gimeno, and Hernández Reference Muñoz, Falcó-Gimeno and Hernández2020), drawing on data from the EUROPINIONS panel study in ten EU countries: Czech Republic, Denmark, France, Germany, Greece, Hungary, Poland, Spain, Sweden, and the Netherlands (Goldberg, Van Elsas, and Marquart Reference Goldberg, Van Elsas, Marquart, Brosius, De Boer and De Vreese2021).
The panel study consists of several waves per country (between 3 and 7 waves), of which the last wave was conducted in parallel in all ten countries and ran from 1 to 16 July 2019. On the evening of 2 July, all major news agencies reported that the European Council had nominated Ursula von der Leyen as President of the European Commission (Barigazzi, Herszenhorn, Bayer et al. Reference Barigazzi, Herszenhorn, Bayer, De la Baume and Momtaz2019). We therefore define respondents who completed the survey on 1 July as ‘untreated’ and respondents from 2 to 16 July as ‘treated’. That is, we compare respondents who could not have known about the heads of state’s decision to nominate von der Leyen with respondents who could potentially have heard about the news. Since von der Leyen was finally elected on 16 July, our treatment refers only to the nomination and not to the election itself.
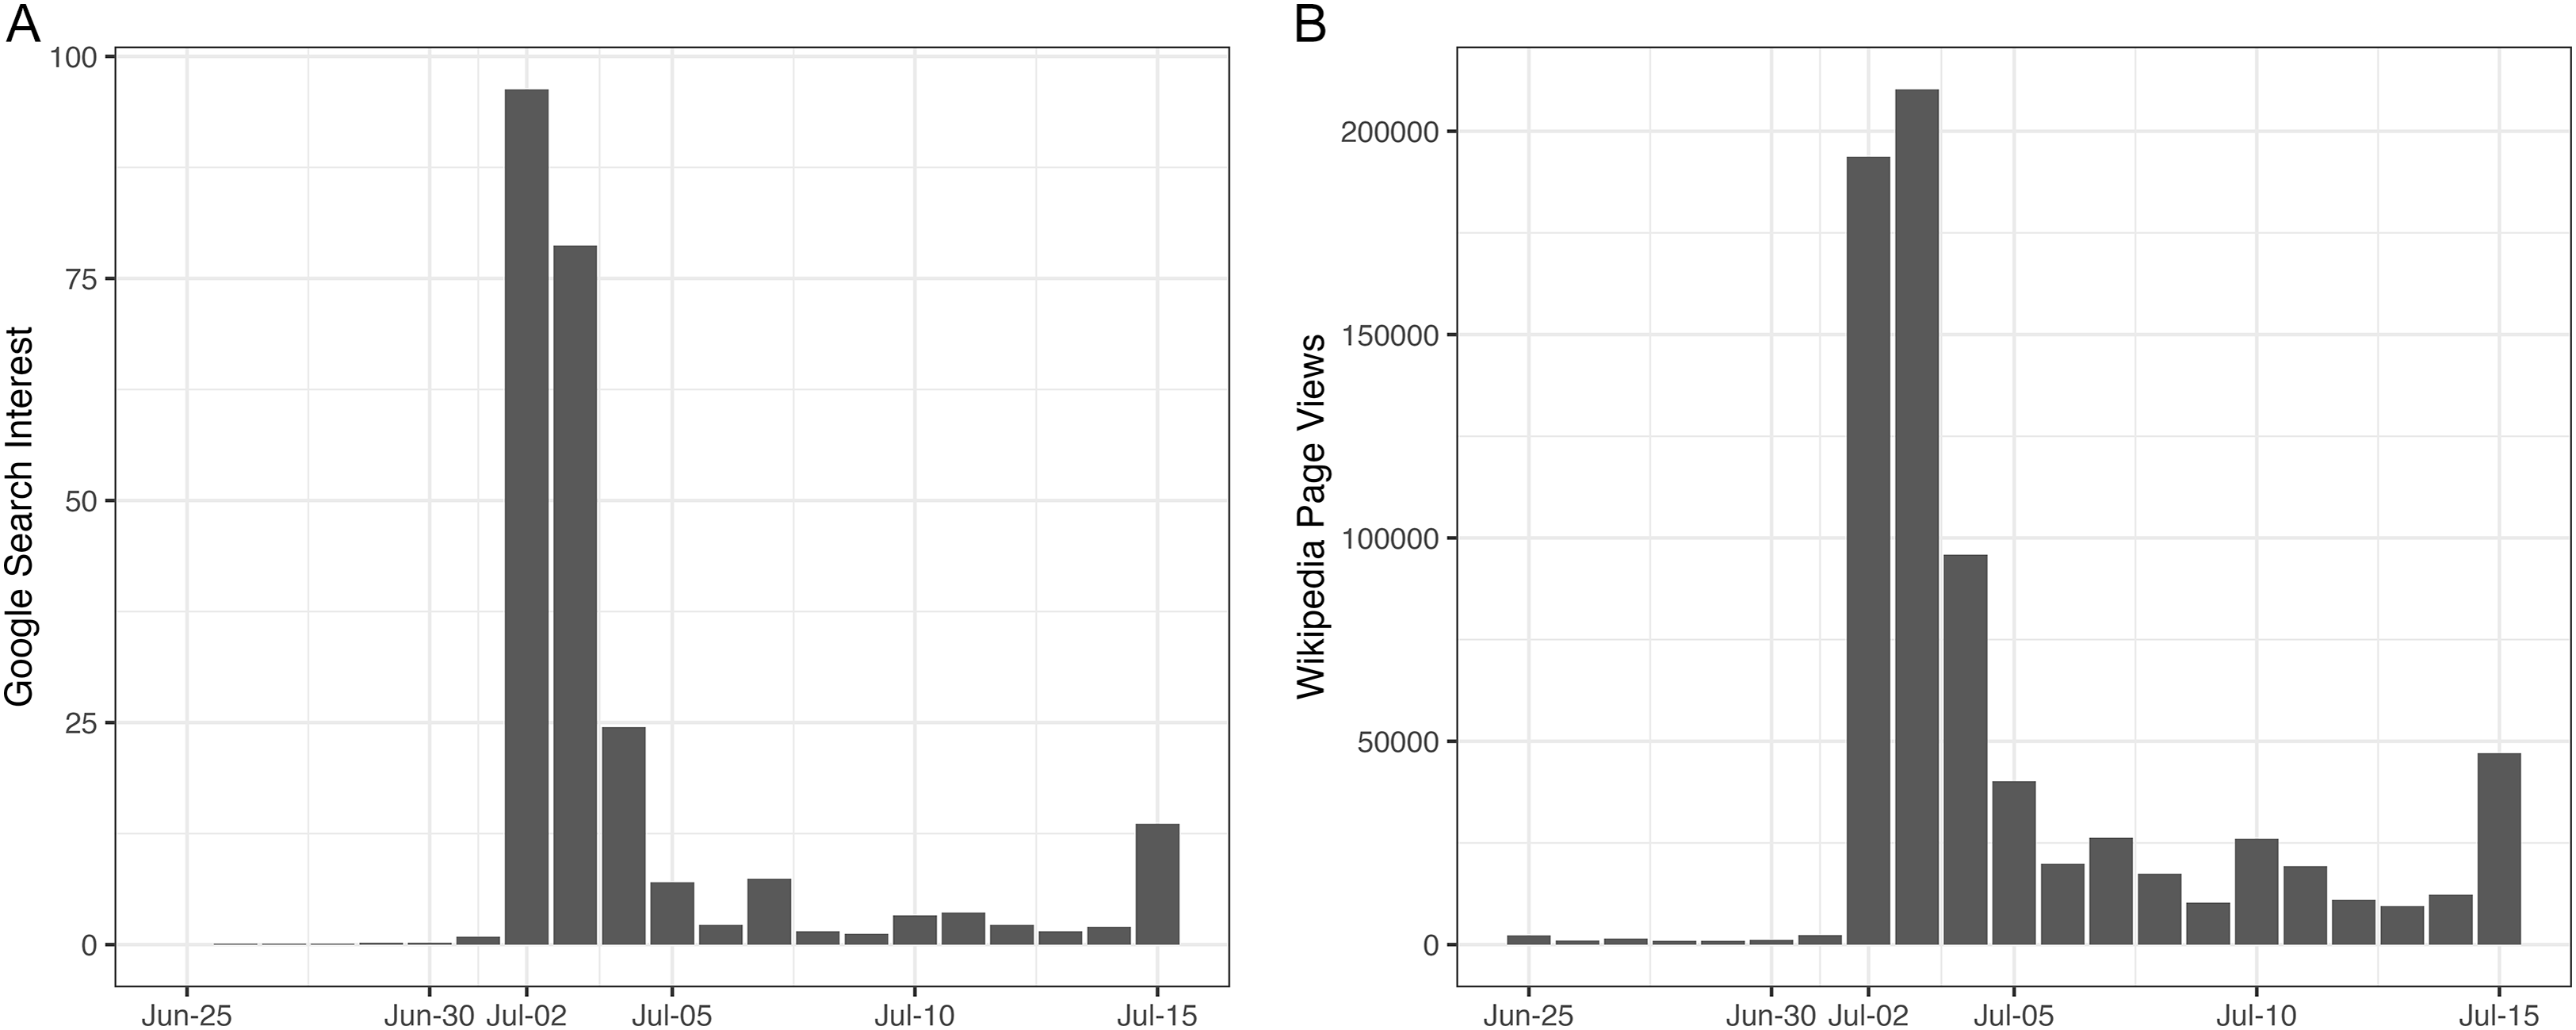
To get an idea of the information flow during these days, Figure 1 shows the sharp increase in (public) interest in von der Leyen on 2 July and thereafter. Both the search interest reported by Google (plot A) and the number of page views reported by the country-specific Wikipedia projects (plot B) show that, prior to the announcement, public interest in von der Leyen was very limited. To illustrate, we compare the Wikipedia page views and Google searches of von der Leyen with those of Donald Trump (see Figure A2 and Figure A3). Whereas the number of views for Donald Trump’s pages starts out at a higher level, they are dwarfed by the increase in attention towards von der Leyen, demonstrating the sharp increase in interest caused by the surprise nomination. A crucial assumption of the UESD design is that the key event, which defines the threshold between treated and untreated, occurs unexpectedly. Otherwise, survey respondents might have decided to wait before filling out the questionnaire. The data clearly show that von der Leyen’s nomination came as a surprise. It was only after almost 48 hours of negotiations that the leaders managed to reach a decision, indicating that von der Leyen’s nomination was not decided in advance. This reinforces our decision to count respondents interviewed on July 1 as ‘untreated’. The pooled sample of a total of 6296 respondents is then divided into 751 ‘untreated’ (respondents on 1 July) and 5545 ‘treated’ (on 2 July and later).
Plot A: Daily Google search interest in June/July 2019 (0–100 relative to the selected time window) for Ursula von der Leyen averaged across all 10 countries in the sample. Plot B: Daily page views of the Ursula von der Leyen page in June/July 2019 across all 10 language-specific Wikipedia projects.

In the absence of more specific time stamps in the survey data, it is reasonable to alternatively consider all respondents on 2 July as untreated as well, as it may have taken time for the news to reach citizens. Therefore, we replicate our analyses using this alternative time window, i.e., considering both 1 & 2 July respondents as ‘untreated’ (3448 untreated, 2848 treated).
Furthermore, it is possible that the timing of survey participation was not entirely random. More interested citizens tend to participate earlier when invited to surveys, leading to sample imbalances in terms of, for example, education, gender, political interest, or nationality (Muñoz et al. Reference Muñoz, Falcó-Gimeno and Hernández2020). Therefore, and in order to reduce imbalances in the analysis, we control for a set of pretreatment variables collected in earlier waves of the survey: age, gender, nationality, education, household income, left-right positioning, trust in the European Commission, interest in EU politics, general political knowledge, and knowledge about the EU, as well as dummy indicators for having heard about each candidate for European Commission President (see detailed operationalization in Table A1 in the Appendix). We interact all these variables with the treatment indicator and estimate average marginal effects based on OLS regressions. We run two such regressions, one for a more specific dependent variable measuring satisfaction with the EC President processFootnote 2 and one for more general satisfaction with democracy in the EU.Footnote 3 Both in combination help us understand the potential effects of the failure of the Spitzenkandidaten process on the perceived legitimacy of the EU. A comparison of the distribution of responses in both samples can be seen in Figure A1 in the Appendix.
Results
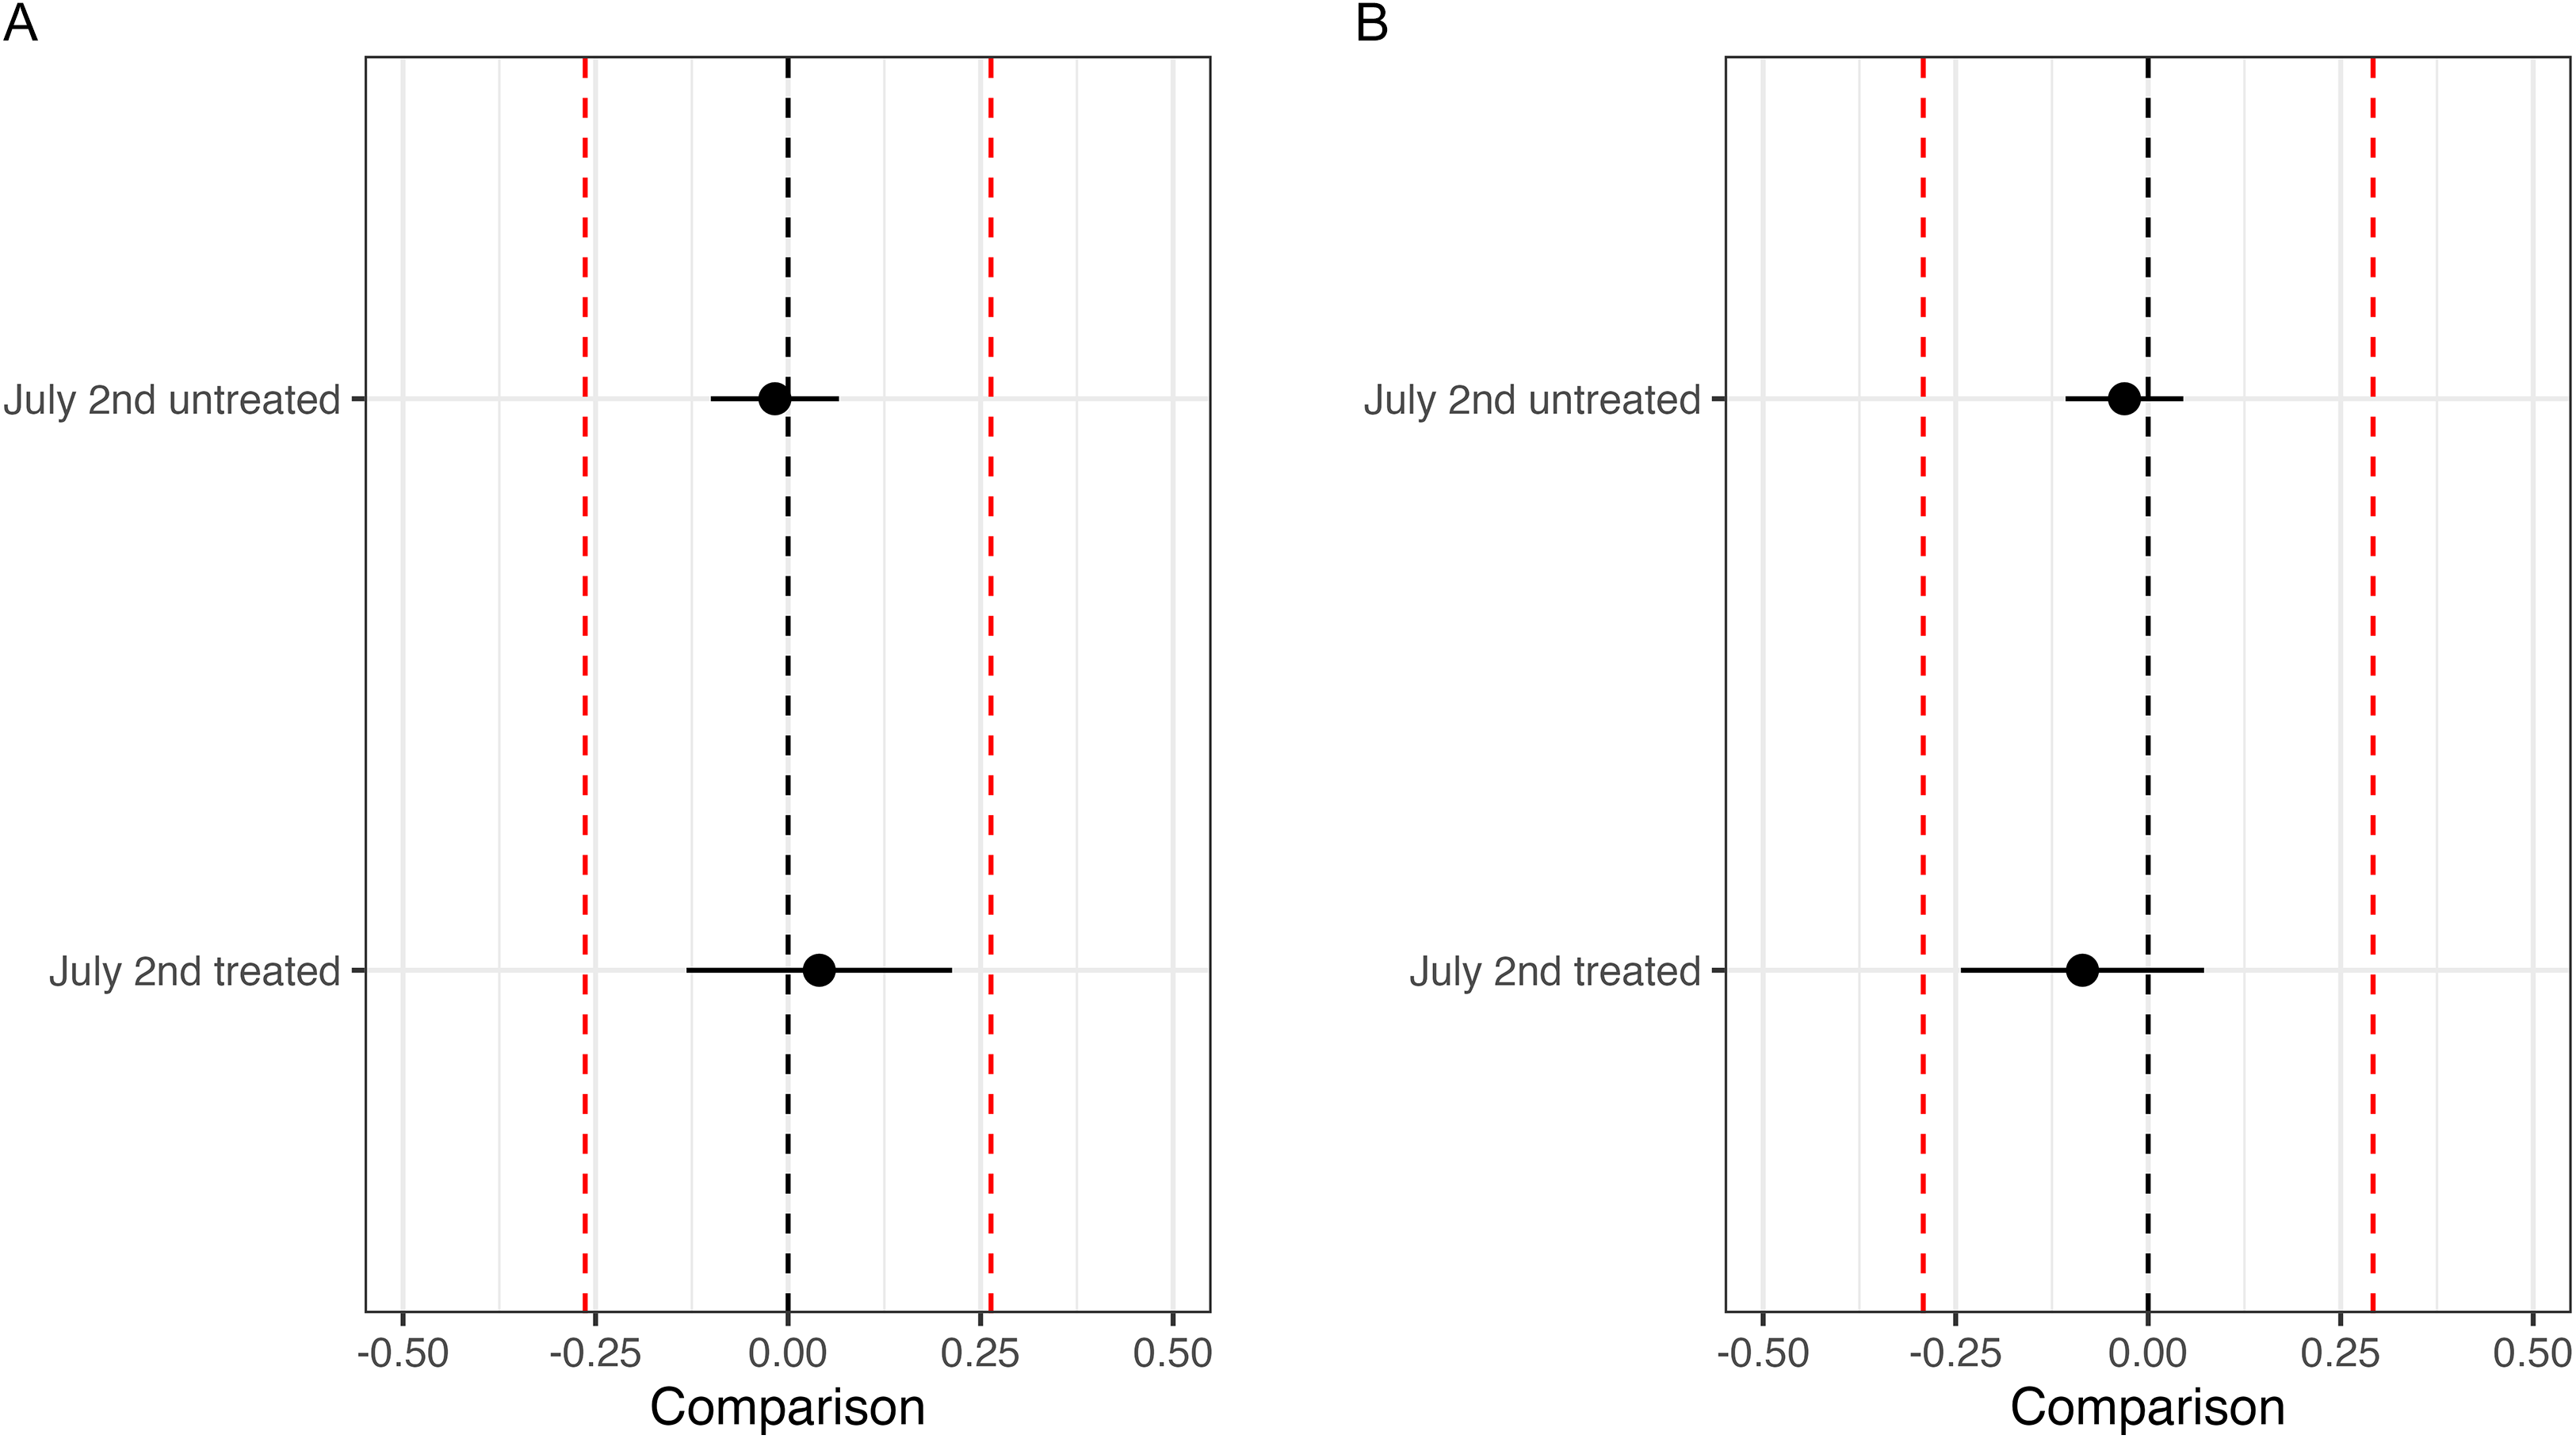
Our results show that there are no statistically significant differences between respondents before and after the announcement of von der Leyen’s nomination, i.e., between the treated and the untreated (independent of the two treatment codings for 2 July respondents). Figure 2 shows mean treatment effects together with a range of small effect sizes. For satisfaction with the EC president process, we find only a small, statistically insignificant difference indicating a positive effect (Average Marginal Effect (AME) July 2 treated = 0.04, P = 0.85, calculated from models in Table A3; AME July 2 untreated = −0.02, P = 0.68, calculated from models in Table A5). For satisfaction with EU democracy, we find a somewhat larger negative effect, which again is not statistically significant (AME July 2 treated = −0.08, P = 0.29, calculated from models in Table A3; AME July 2 untreated = −0.03, P = 0.44, calculated from models in Table A5). While we cannot say that the true effect is exactly 0, we can state that it is very likely not meaningfully large.Footnote 4
A: Marginal treatment effects on satisfaction with the process of the EC president selection, 95% confidence intervals. B: Marginal treatment effects on satisfaction with the way democracy works in the EU, 95% confidence intervals. Marginal effects are based on models reported in Tables A3 and A5. Both plots show effects for categorizing July 2 as ‘treated’ or as ‘untreated’. Dashed lines indicate a range of small effect sizes equivalent to Cohen’s d of < = 0.2.
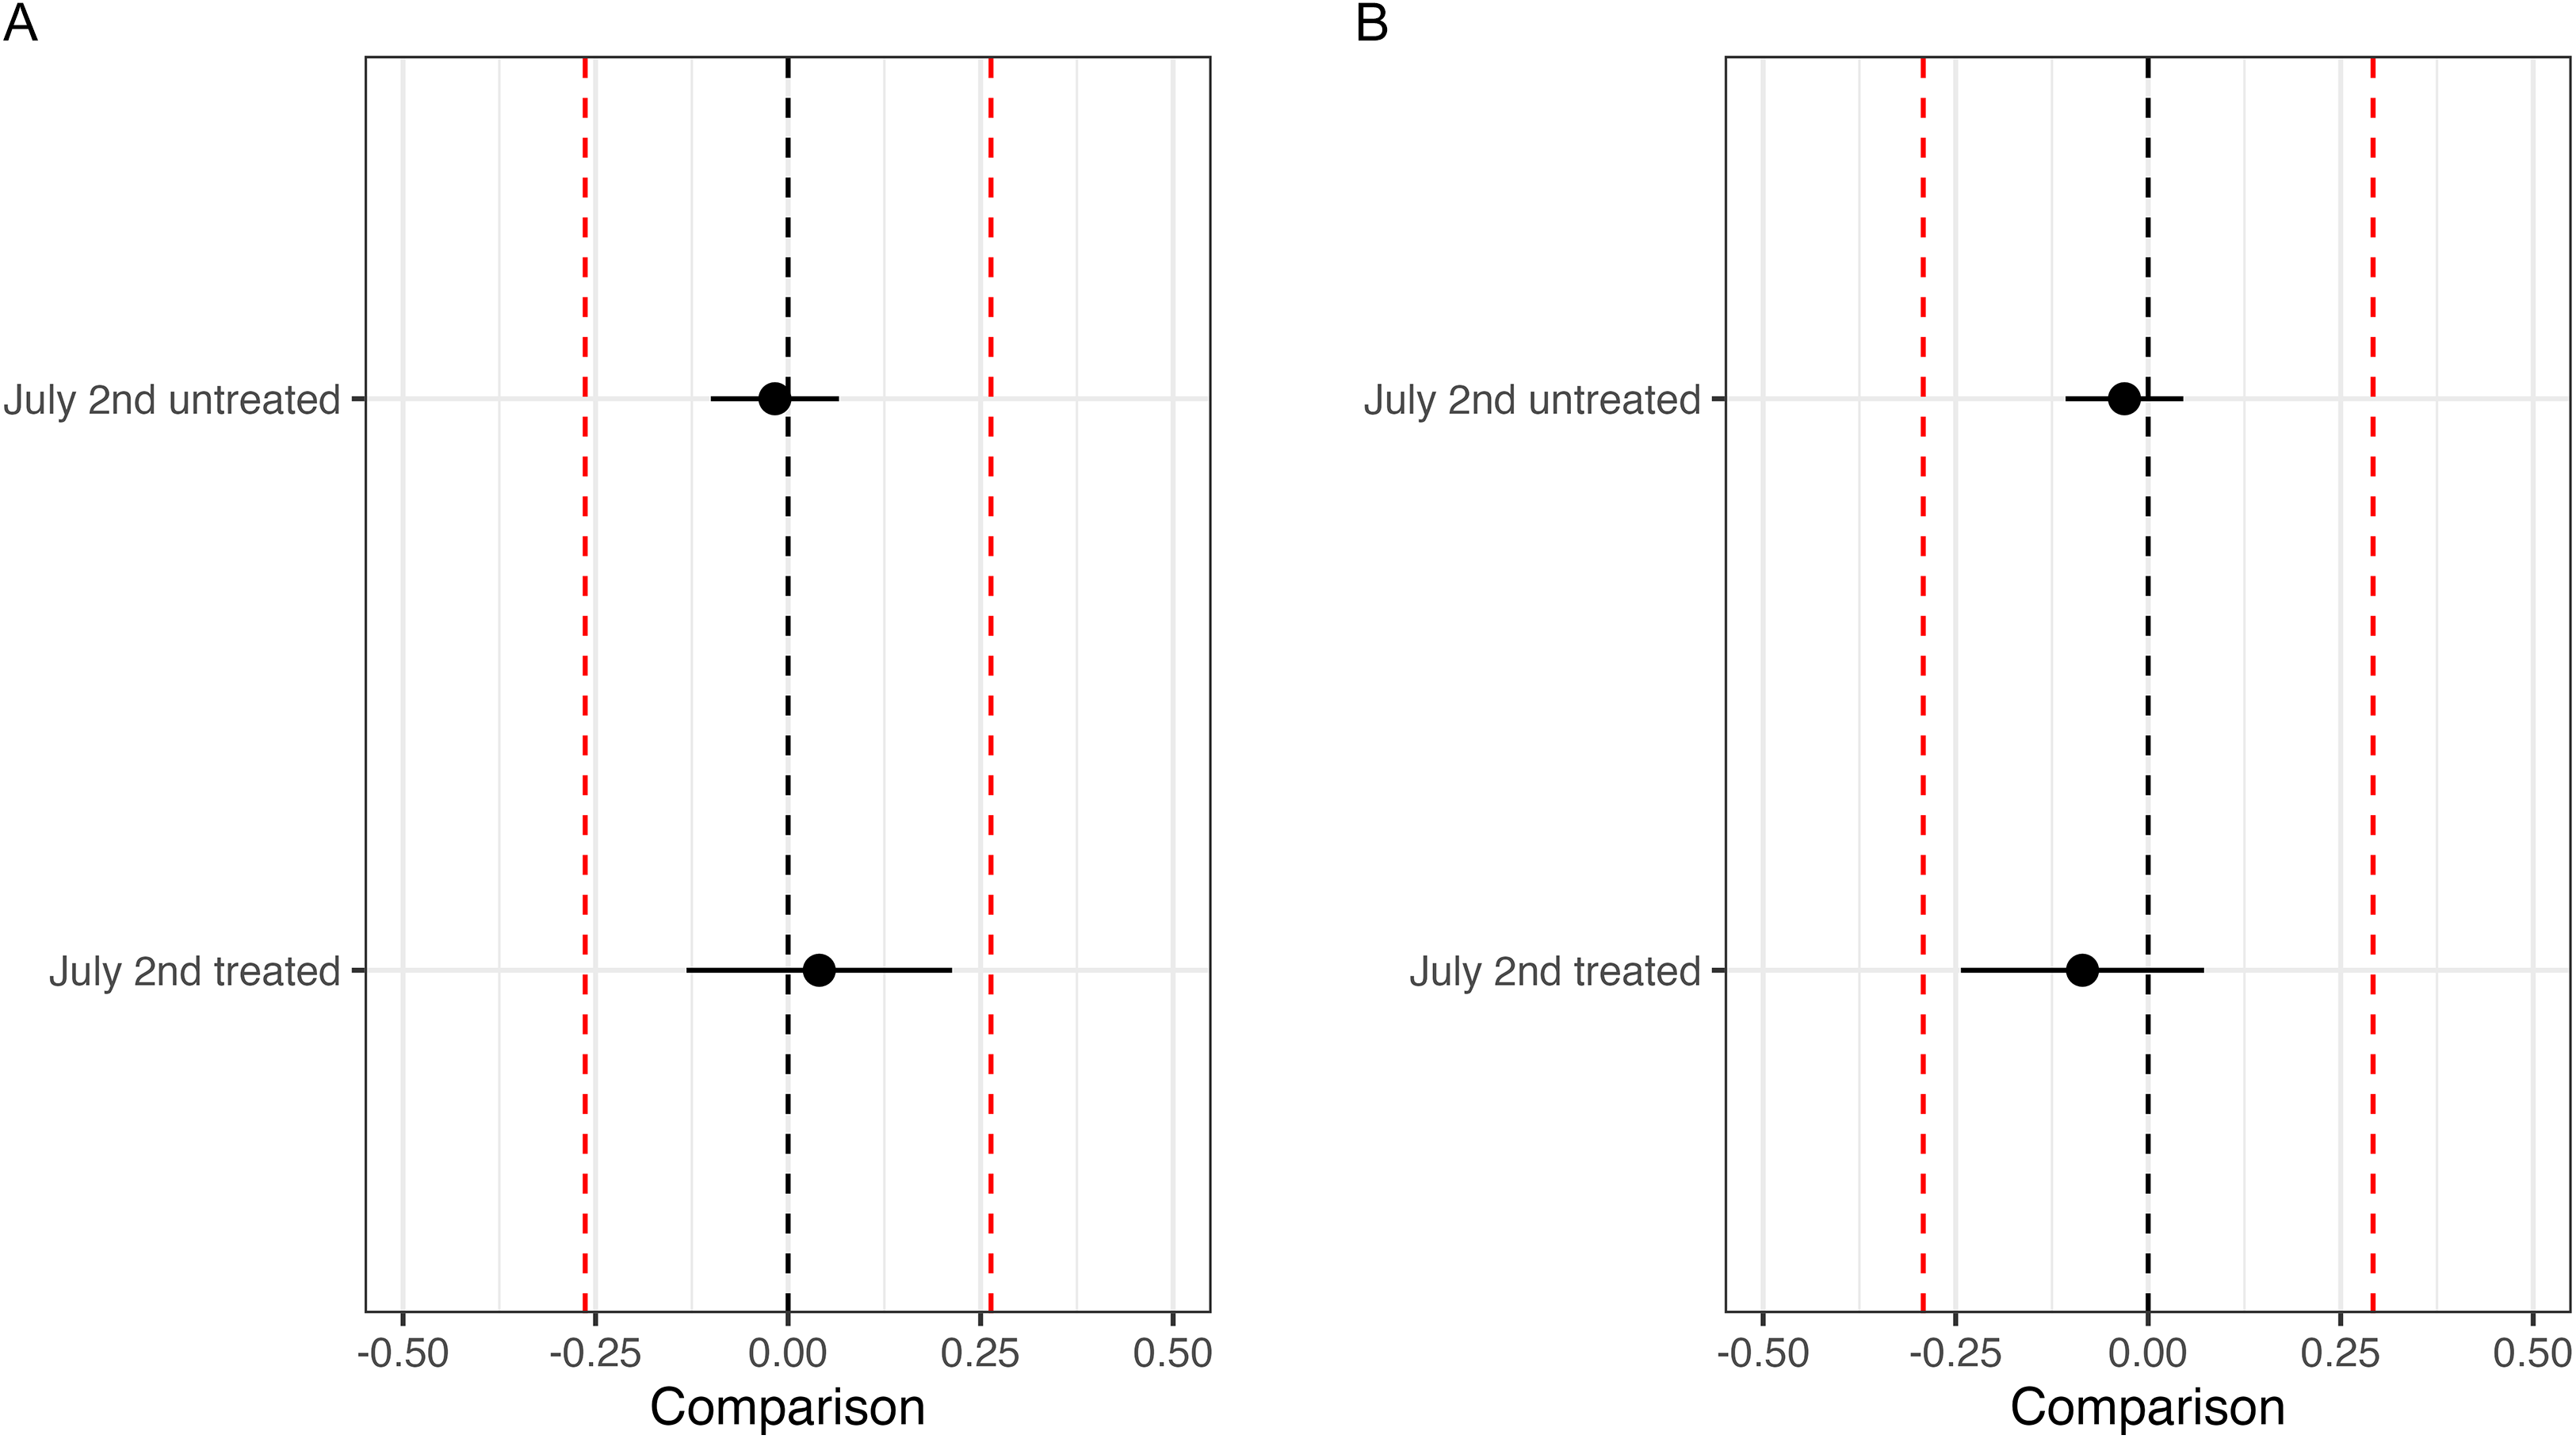
There are several possible explanations for our null findings. To begin with, our null findings are consistent with the earlier argument that most citizens either have little interest in the EU and/or little knowledge of how it works (or is supposed to work). More specifically, two related reasons may explain the null findings: first, there is a lack of information for citizens about the Spitzenkandidaten process as such or about the change in the selection process. It could be that – despite the announcement of von der Leyen as a candidate and the news coverage of it – the respondents were not aware of it. Second, there is a kind of apathy among citizens towards the selection process, i.e., the respondents may not have considered it as important in the first place, and/or they evaluate the selection via the EP (and the underlying election result) or via the member states as equally good/bad. We therefore test for heterogeneous effects through exploratory subgroup analysis.Footnote 5 Tables A6 and A8 in the Appendix report ANOVA tables testing interaction effects for our main models. After adjusting for multiple comparisons (Benjamini and Hochberg Reference Benjamini and Hochberg1995), we find no statistically significant interactions. Accordingly, we cannot reject the null hypothesis of no effect for any of the subgroups we include in the models. Therefore, even among respondents where one would expect the strongest effects (politically interested citizens and citizens with high levels of formal education), we fail to find statistically significant differences.
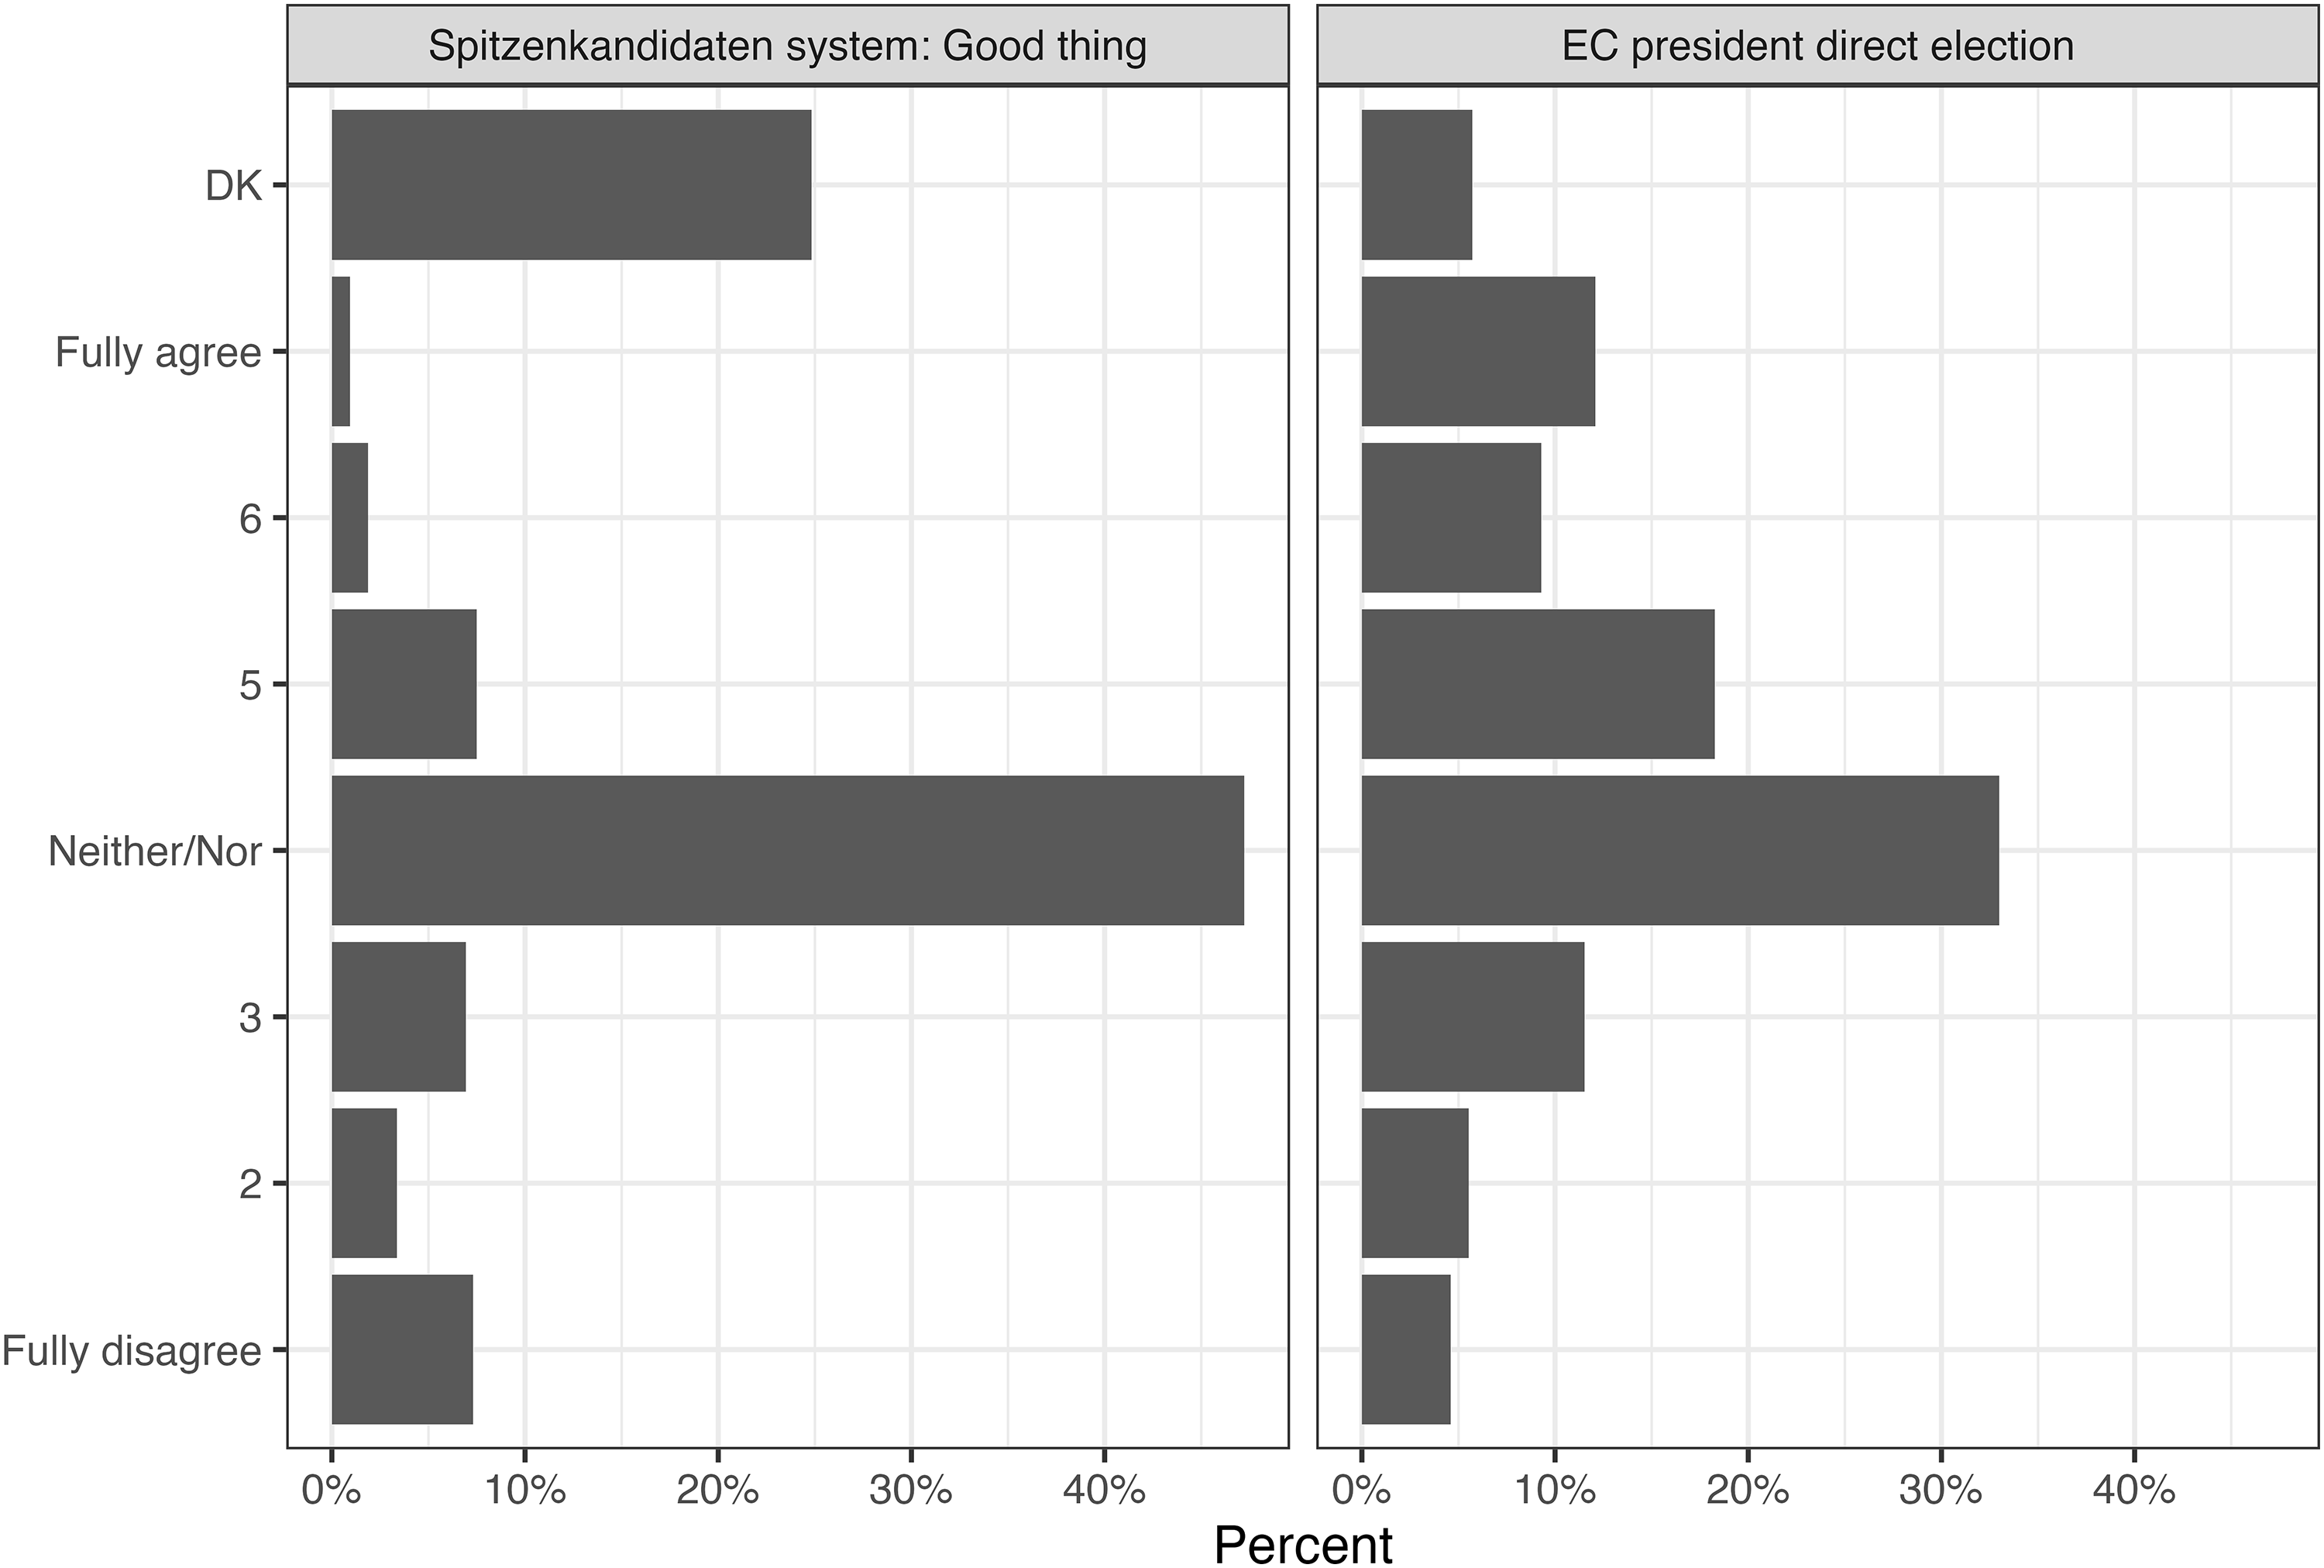
We further investigate, in an exploratory manner, the plausibility of both explanations using responses from the Dutch sample of the EUROPINIONS survey (see Figure 3, left plot).Footnote 6 Dutch respondents were asked one year before the EP elections (in June 2018) whether the Spitzenkandidaten system was a good thing.Footnote 7 Most respondents chose either to respond with the middle category, ‘Neither agree nor disagree’ (46.5%) or ‘Don’t know’ (23.2%), which indicates both apathy and lack of information. We analyze the middle category and the ‘Don’t know’ responses by regressing key covariates on a binary indicator that codes any other response as ‘1’. As Table A12 shows, highly educated respondents and respondents with high levels of EU knowledge and interest in the EU are more likely to report an opinion. A lack of information and awareness, therefore, makes respondents more unwilling to report strong attitudes about the Spitzenkandidaten process. These exploratory findings are consistent with the literature from the 2014 EP elections. Studies such as Hobolt (Reference Hobolt2014), Popa, Fazekas, Braun et al. (Reference Popa, Fazekas, Braun and Leidecker-Sandmann2020), and Schmitt, Hobolt, and Popa (Reference Schmitt, Hobolt and Popa2015) reported low levels of awareness and knowledge about the Spitzenkandidaten. While we did not focus specifically on knowledge about the Spitzenkandidaten, the absence of public reaction to the overturning of the Spitzenkandidaten process in 2019 – and the indications of apathy and lack of information in the Dutch subsample – points in a similar direction, namely that citizens do not really know and care about it. Therefore, the conclusion that ‘the elections have not brought about the genuine electoral connection between voters and EU policy-making that was hoped for’ by Hobolt (Reference Hobolt2014), 1530 still seems to hold.
Responses to two questions related to the Spitzenkandidaten process in the Dutch sample (12–24 June 2018).
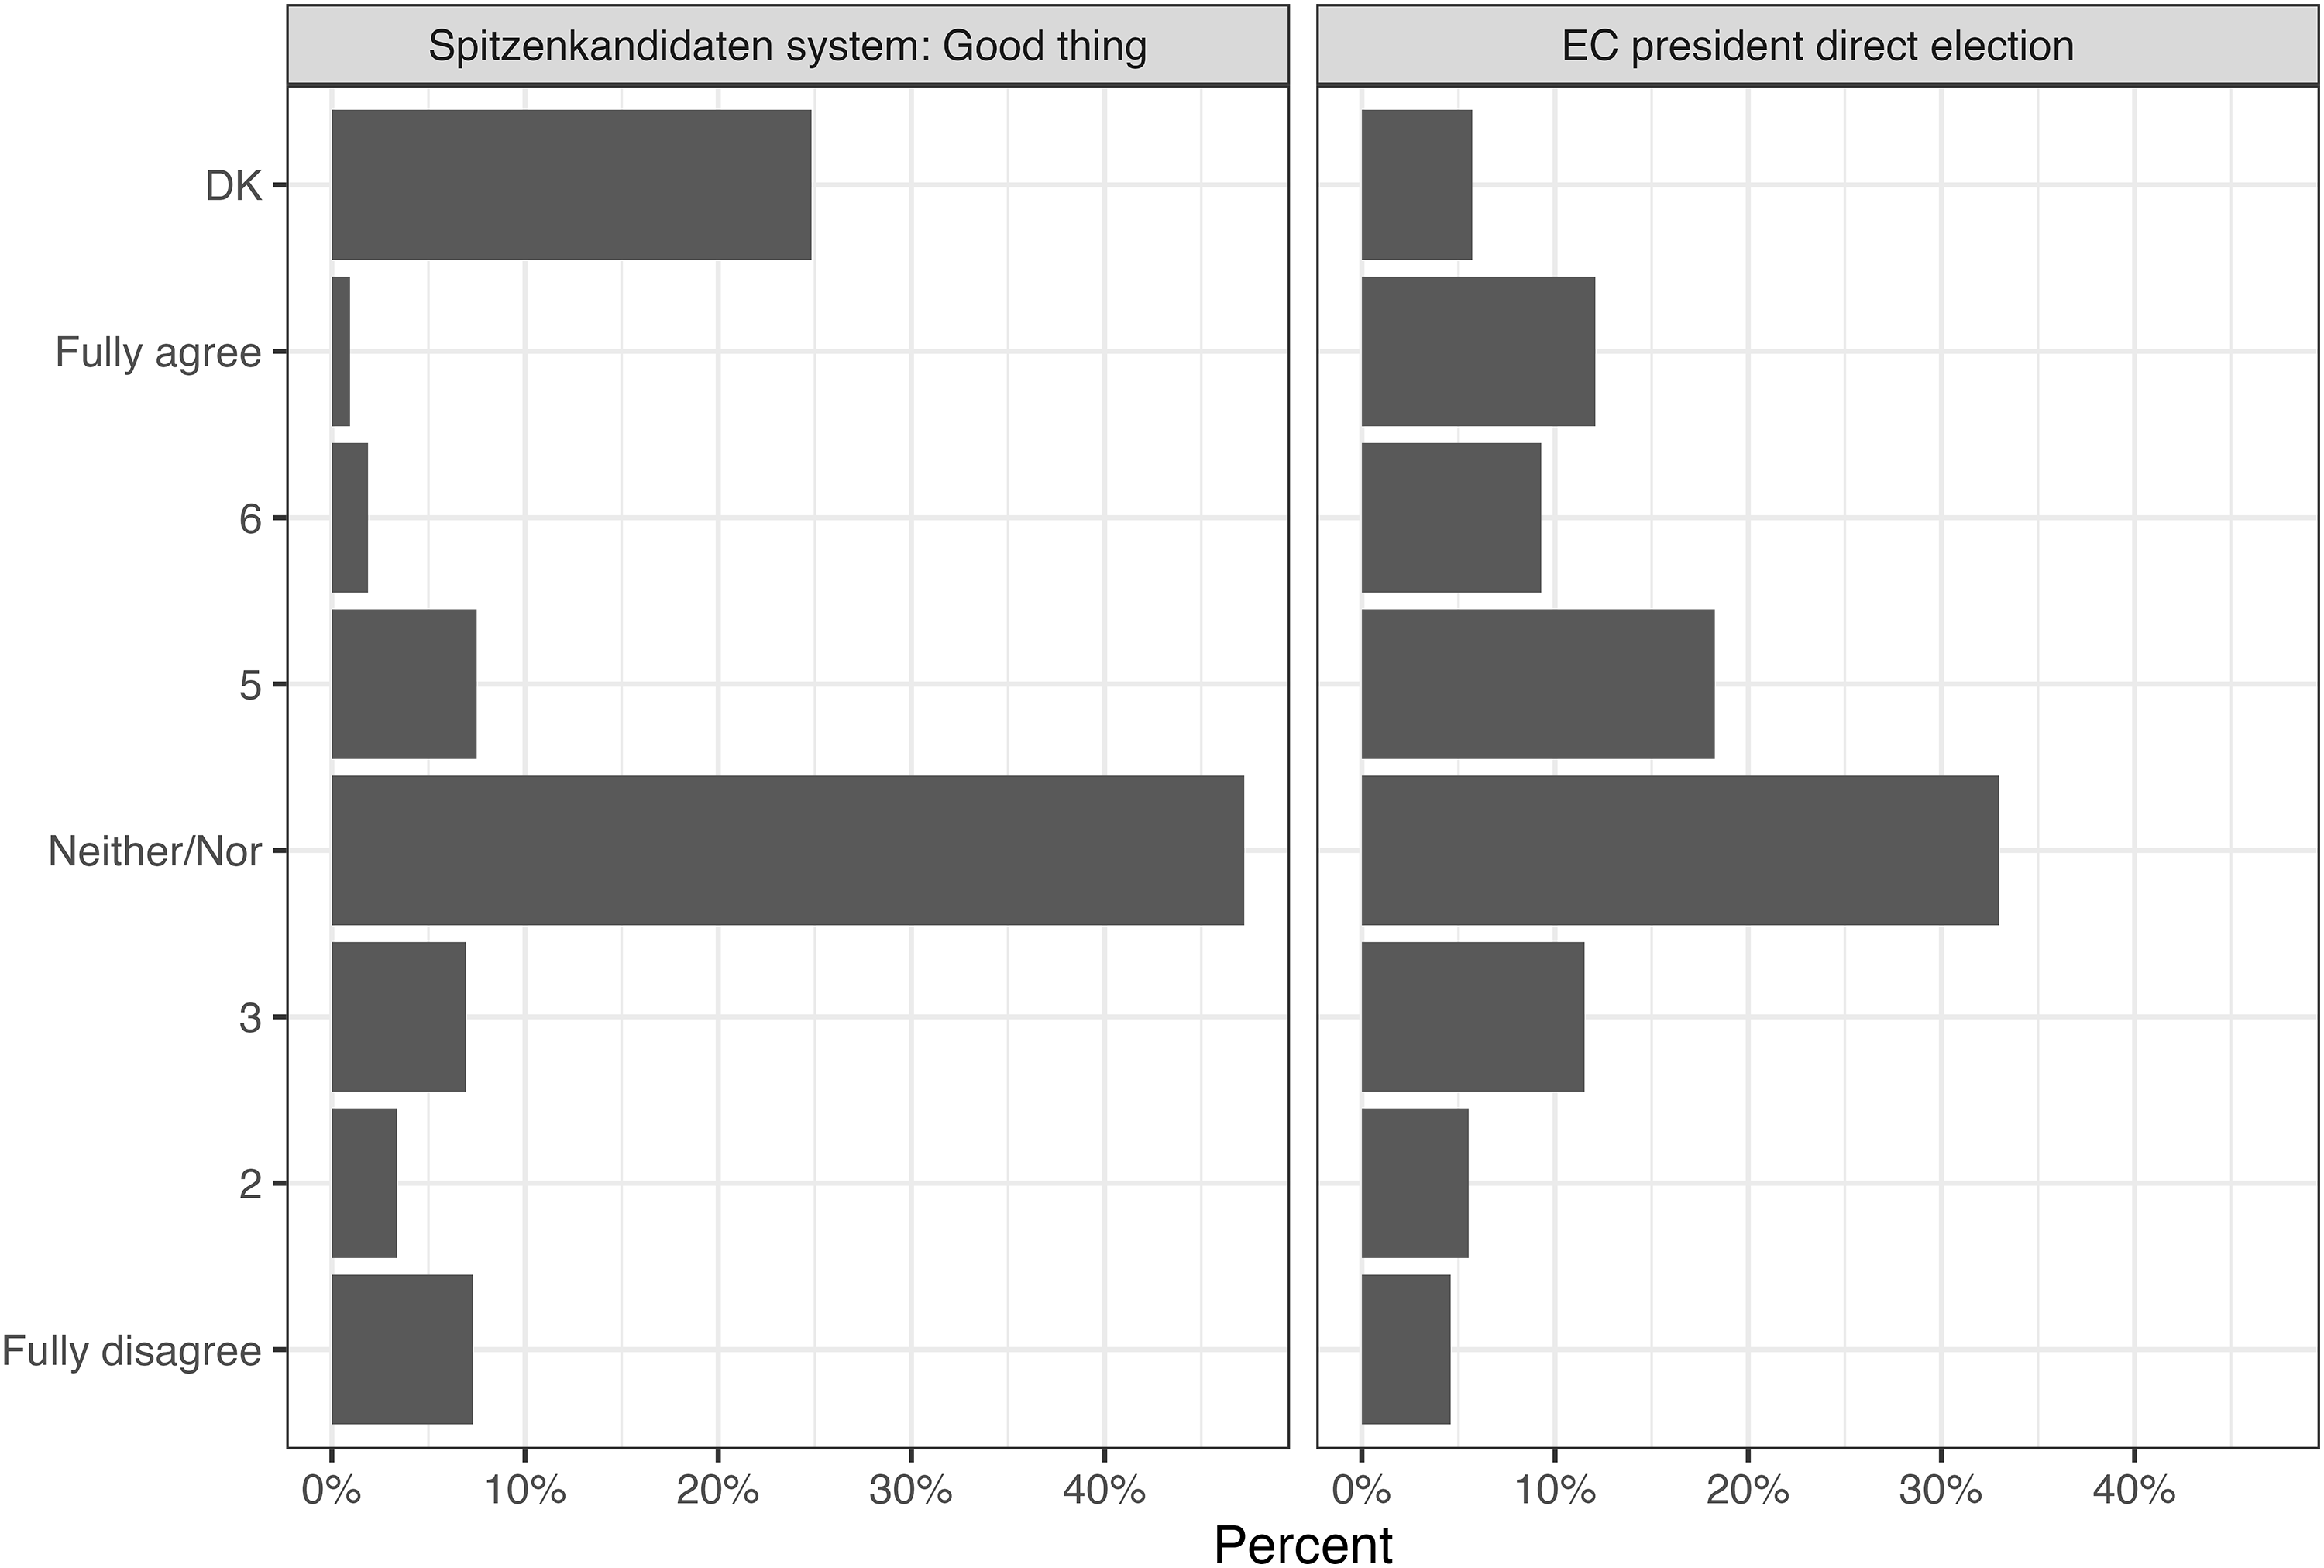
In contrast with this result, when the Dutch respondents were asked whether they would prefer a more direct way of electing the EC president,Footnote 8 citizens show much weaker patterns of apathy and have stronger opinions (again, Figure 3, right plot). The attitude towards direct elections of the Commission President seems less influenced by specific knowledge about the EU as compared to attitudes on the Spitzenkandidaten system (see Table A12). A negative correlation between trust in the Commission and the preference for direct elections indicates that direct elections could increase support for the Commission. Most respondents support the direct election of the EC president (40.7%). This suggests that citizens would, in principle, be in favor of a direct election system, but many are unaware of the existing system. This points towards a weakness in our first study. The treatment in this study is only the potential of learning about the decision to overrule the Spitzenkandidaten system. However, it is entirely possible that EU citizens did not know about the overruling at all, which would explain our null finding. Unfortunately, due to the unexpected nature of the event, there is no data from the final survey wave that could show how many people were aware of the treatment. This means that we cannot differentiate between indifference towards procedural fairness and a lack of awareness. Secondly, it could also be the weakness of the candidates that causes the lack of a backlash. If citizens are not attached to the candidates and do not know or care about them, they are less likely to react negatively if none of the candidates becomes head of the Commission.
Study 1 shows that the overturning of the Spitzenkandidaten process produced little to no negative consequences for the perceived legitimacy of the EU. This lack of a reaction seems universal across countries, social markers, and political beliefs. Nevertheless, we can only speculate as to why there has not been a strong backlash. Was it a lack of information about the overturning of the Spitzenkandidaten model? Was it the weakness of the candidates? Or do citizens simply care little about the ‘how’ of the selection process, even when they are informed and have a greater say in choosing the candidates? As our UEDS design does not allow us to investigate these potential explanations and causal pathways, we proceed with a second study to shed light on these issues.
Study 2: A primary system experiment as an alternative
To better understand the lack of a reaction towards the overruling of the Spitzenkandidaten process and to test the potential of a primary to increase the relevance of the process, we conducted a survey experiment in five EU countries (France, Germany, Italy, Poland, and Sweden) in the run-up to the 2024 EP elections. The five countries include four out of the five biggest EU member states (except Spain), parliamentary democracies and semi-presidential ones, richer and poorer member states, and newer and older ones, as well as member states from the north, west, east, and south of the EU. It thus provides a strong representation and variation among consequential electorates within the EU.Footnote 9
Data collection was conducted from 14 May to 6 June 2024, with a total sample size of 8774. The survey was implemented by YouGov using quota sampling for gender (2 levels), age (5 levels), and formal education (3 levels). After a series of questions on political preferences and attitudes, respondents were presented with a hypothetical scenario. Instead of directly asking respondents how they feel about the Spitzenkandidaten process, we informed them that they would be shown a scenario describing how their vote in the European Parliament elections will influence who becomes the new President of the European Commission. All scenarios described that the newly elected European Parliament will vote for a candidate for this position. The scenarios differed in what happens before and after this key step in the process. Table 1 shows the setup of our experiment.
Experimental design survey experiment

Respondents are randomly assigned to one of six groups.
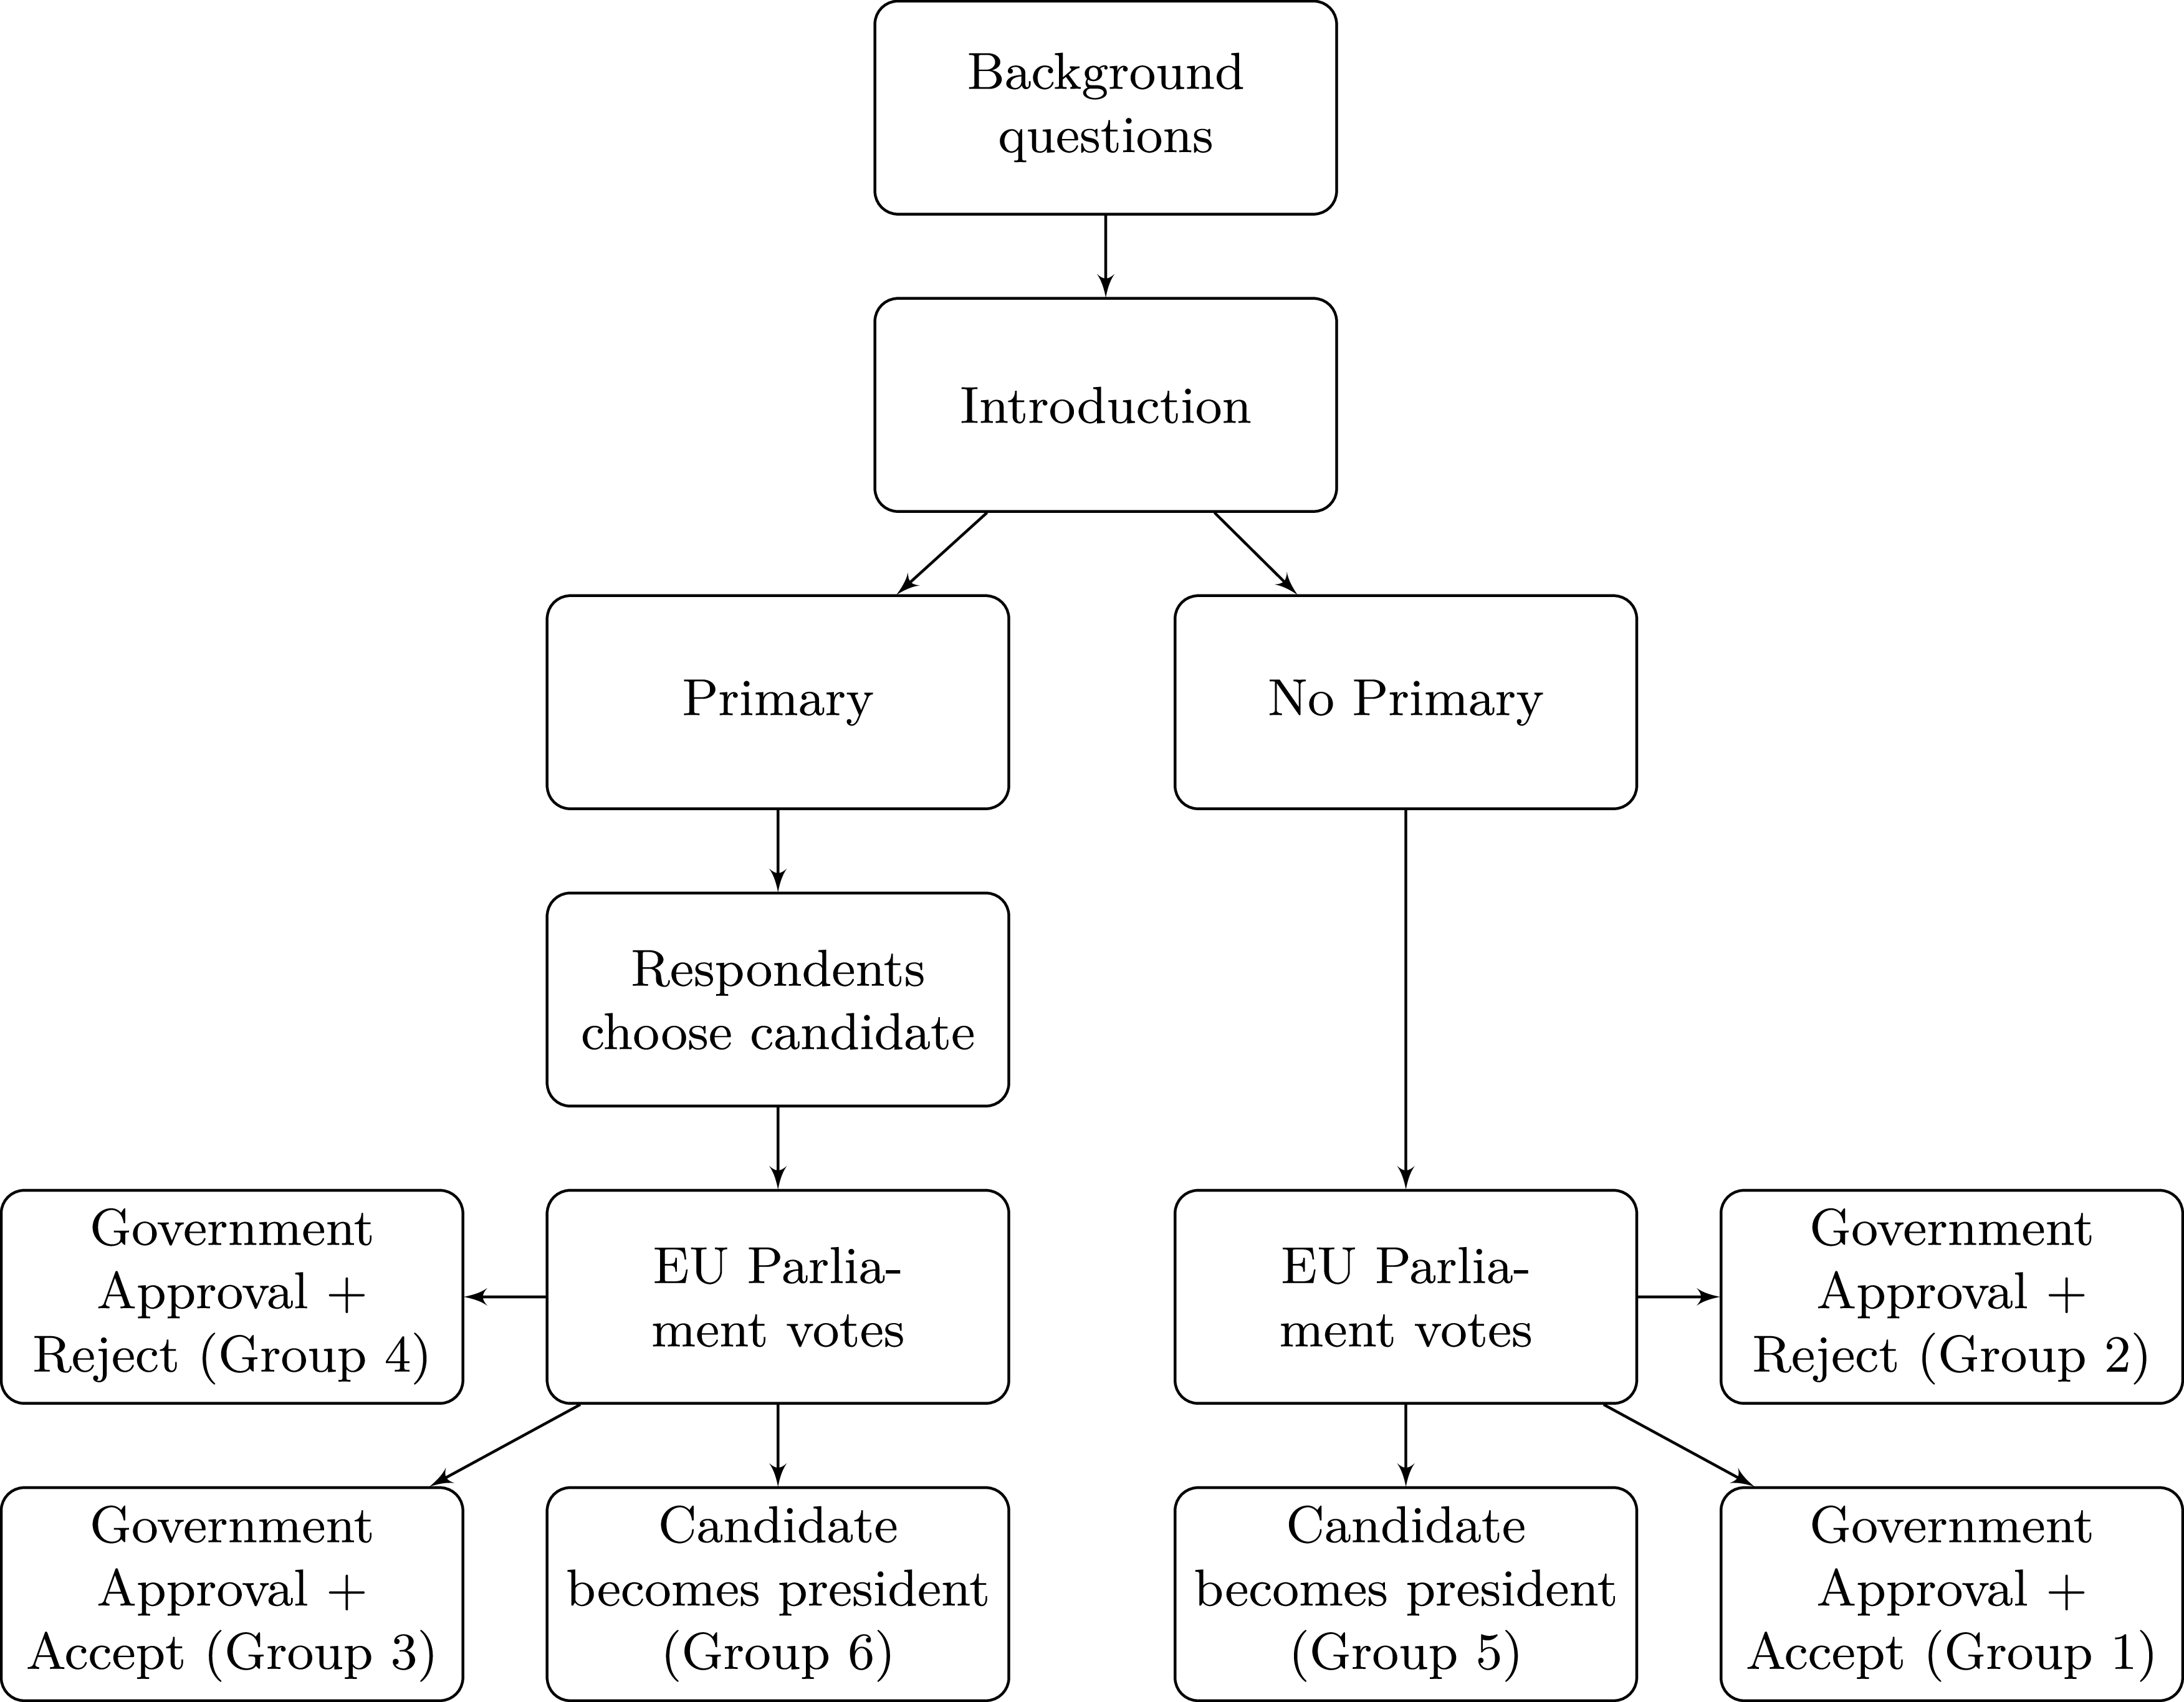
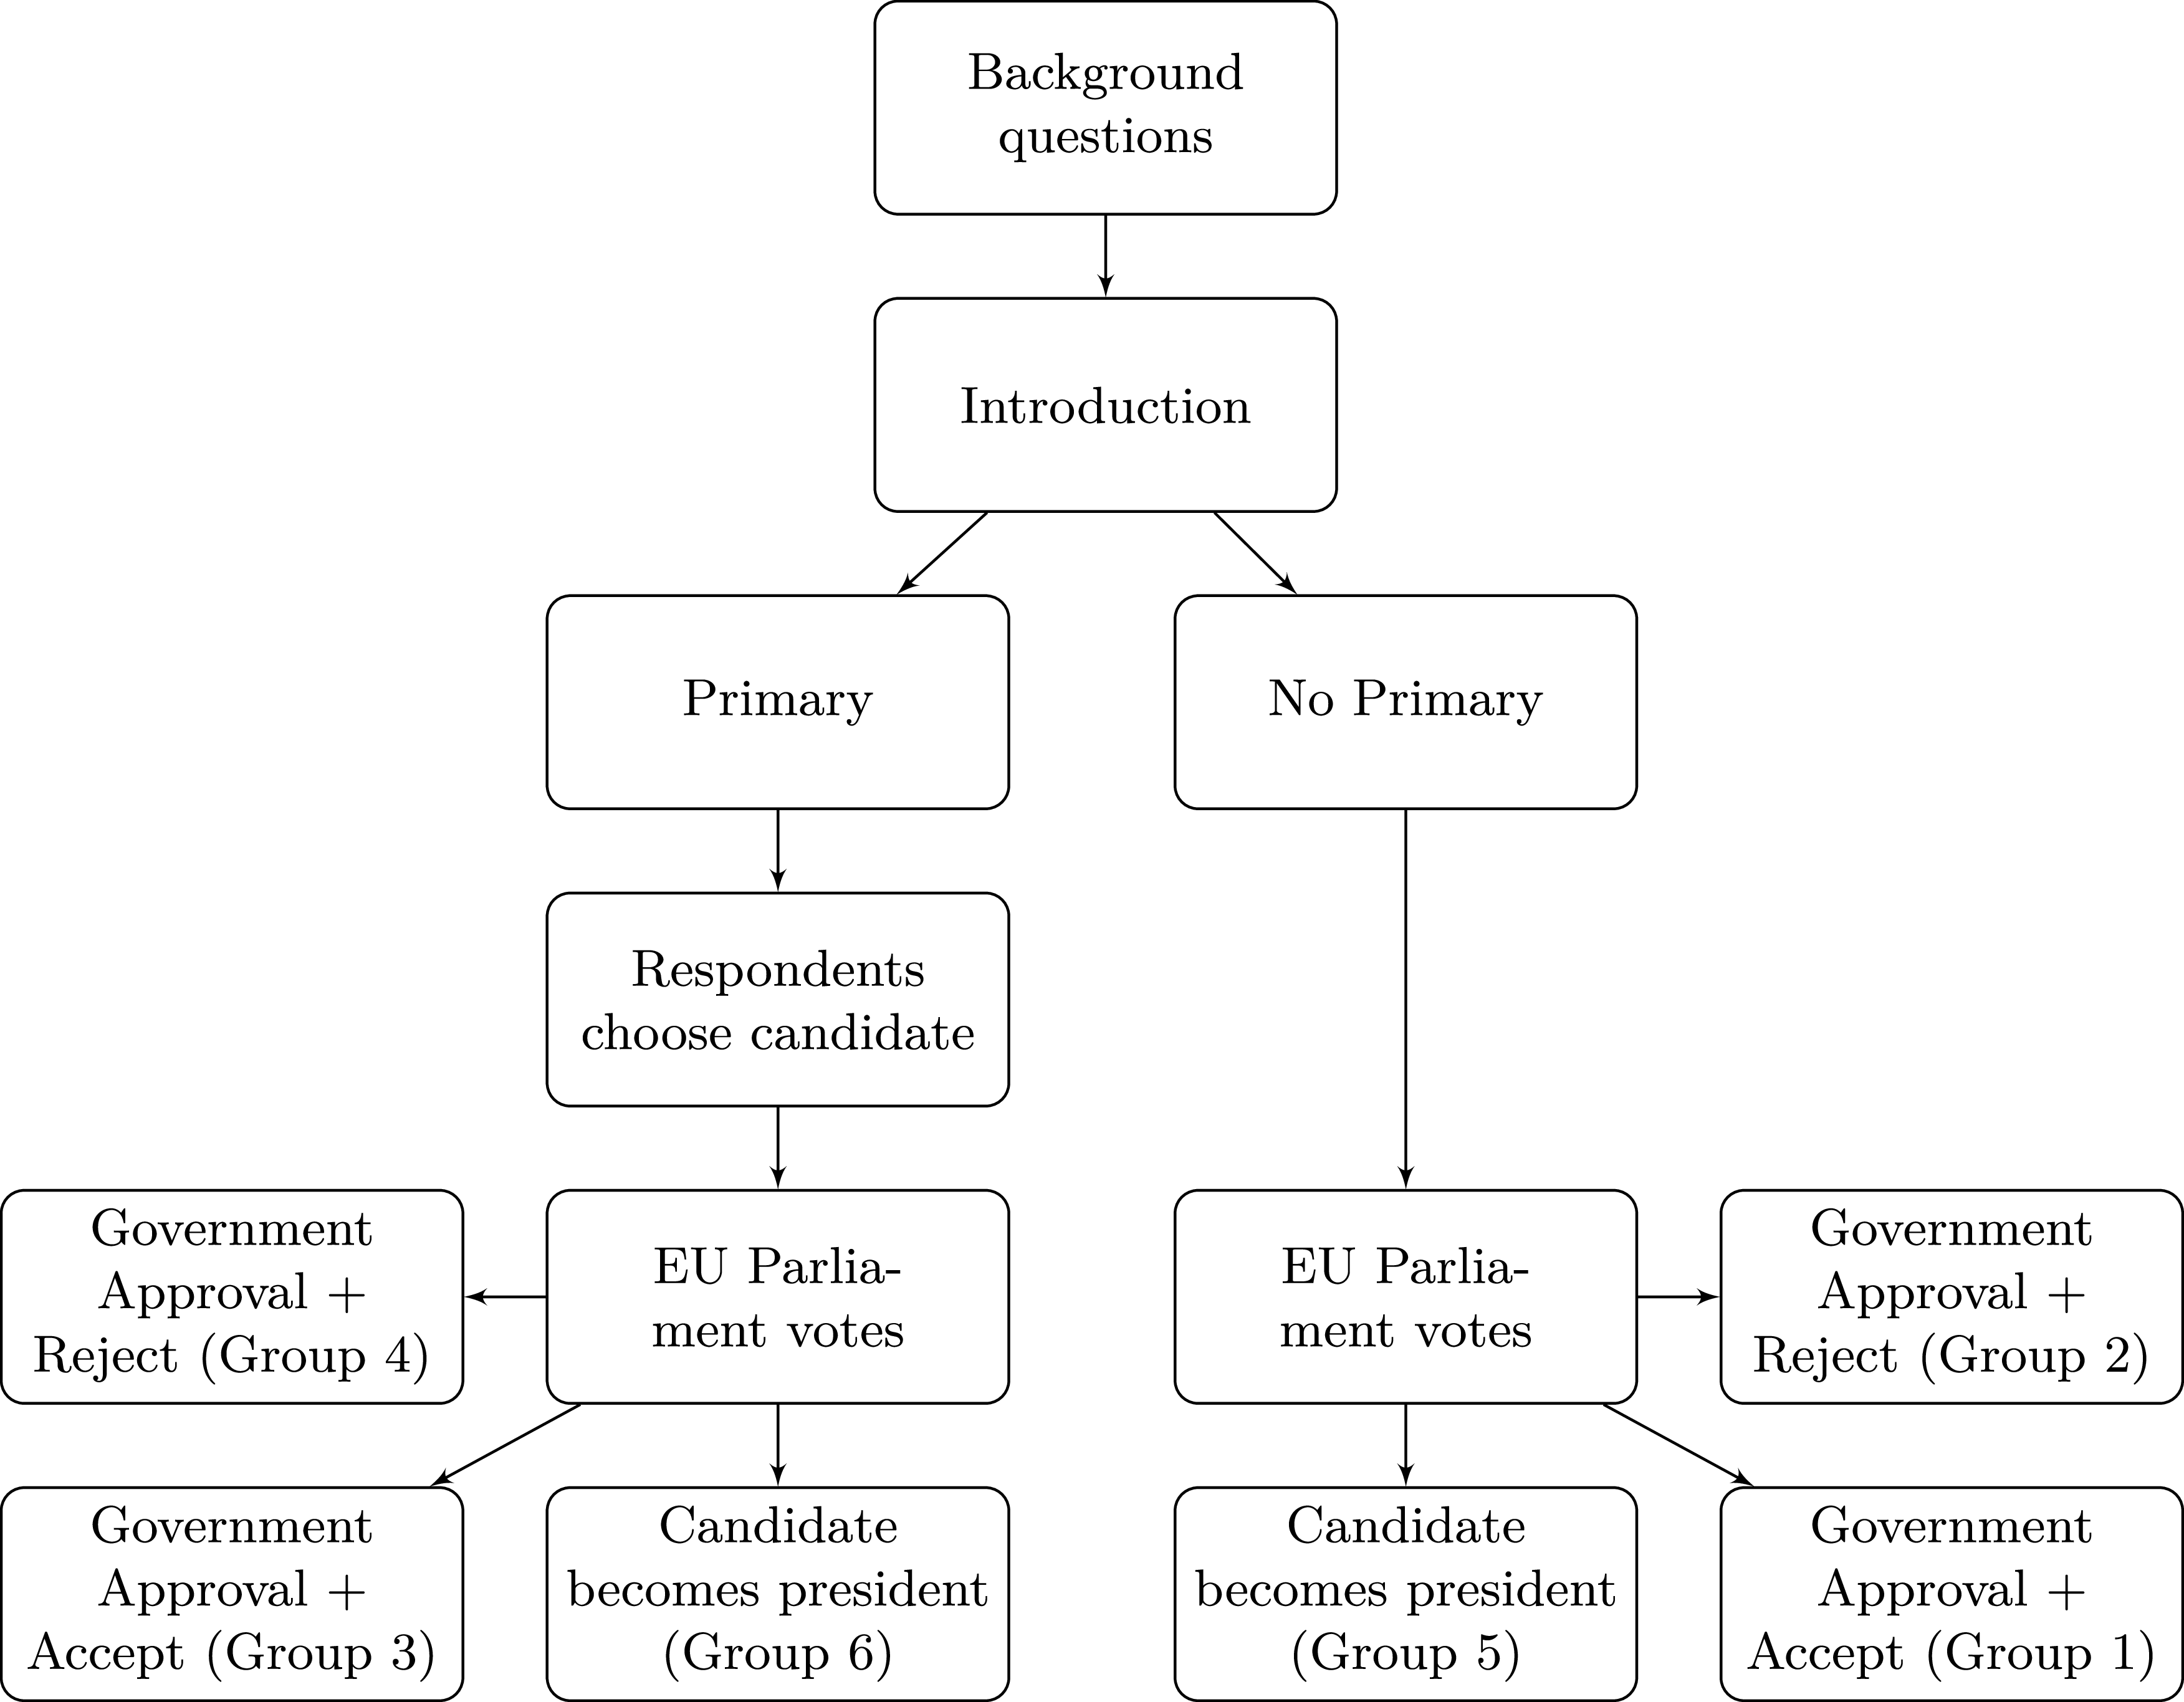
The experimental design varied two factors. First, we varied whether or not member state governments intervene in the process and the outcome of that intervention. This factor relates to our first overarching research question: Do citizens react negatively to the overruling of the Spitzenkandidaten process by the Council? In our treatment, either the member state governments are not mentioned at all and the chosen candidate becomes the new President of the European Commission directly (groups 5 & 6), or the member state governments have to approve the candidate beforehand. If they have to approve the candidate, they can either accept the vote of the European Parliament (groups 1 & 3) or they can reject it and elect another person as president (groups 2 & 4). If the governments of the member states accept the vote of the European Parliament, the situation is similar to the outcome of the 2014 process. However, when member states reject the candidate, the experimental scenario resembles the outcome of the process in 2019. This factor therefore leads to three options: governments are not mentioned, governments have to accept the candidate and do so, or governments have to accept the candidate but reject the candidate.
Second, we varied whether or not a primary takes place before the elections. This factor helps us answer our second overarching research question about the potential of a primary for the European elections. In this condition, respondents were informed that supporters of national parties will be able to decide who will be the leading candidate for their party group at the European level. To make this treatment as effective and engaging as possible, we not only informed respondents about this step but also asked them to choose a candidate themselves. Depending on previous information about the intended vote in the upcoming European elections (corresponding questions appeared earlier in the same data collection), we assigned respondents to party group-specific candidate lists. Most national political parties in EU member states belong to a party group at the European level, based on ideological proximity. National conservative parties are part of the EPP, social democratic parties are part of the S&D, and so on. A vote for a national party is thus associated with a vote for a European party group. In essence, we constructed a version of a primary election in which only Europeans belonging to a (national) party can decide on a common candidate, instead of everyone potentially having the right to vote in each primary election.
Each of the party-group-specific lists (see Section B.1 in the Appendix) consists of a European statesman/woman from the group, the official lead candidate of the corresponding European party, or the leader if the party did not have a lead candidate, and a celebrity who we believe shares the values represented by the party group. Participants were also allowed to freely name another candidate of their choice, answer ‘Don’t know’, or select the option that they did not want a lead candidate for their party group. We showed participants candidate lists based on their previously indicated national party choice for the European elections in order to maximize the possibility for voters to identify with a candidate of their choice. However, as a result, the exact candidates from which participants could choose varied depending on their party choice, introducing some noise into the experiment. We opted for greater engagement with the experimental stimuli over the clear effect of a single list of candidates, which may not be relevant to all respondents. Together, these two experimental factors create a 2x3 design. Figure 4 shows the respondent’s path through the scenario.
Outline of the experiment. The last step of the experiment corresponds to the six groups in Table 1.
After having gone through one of the six scenarios, respondents were asked two questions in a randomized order: satisfaction with the election process in this scenarioFootnote 10 and general satisfaction with democracy in the EU.Footnote 11 In what follows, and in line with Study 1, we focus on satisfaction with EU democracy and satisfaction with the process as our indicators of perceived EU legitimacy.Footnote 12
This experimental design is specifically constructed to study the following theoretically interesting quantities. We expect the same causal mechanisms to hold for both dependent variables.
-
1. The differences between the no-primary and primary conditions will inform us about the potential positive effects of including a primary in the Spitzenkandidaten process. This hypothesis is directly related to our RQ 2, which focuses on the potentially positive effects of primaries on EU legitimacy at the European level.
Hypothesis 1: Compared to the No Primary condition, the Primary condition has a positive effect on satisfaction.
-
2. The differences between the three different government choice conditions tell us how strongly people react to the Spitzenkandidaten system being (potentially) overruled by member state governments. This quantity essentially replicates the first, observational analysis (Study 1), but it equals the amount of information individuals have about the failure of the Spitzenkandidaten process. It therefore answers the question, ‘If everyone were informed about the decision of member state governments to overrule the European Parliament, how would the public react?’ The results of this hypothesis, together with Study 1, therefore help us to answer our RQ 1. We hypothesize that citizens prefer no role for governments in the selection of the president of the Commission. Requiring approval signals that the Spitzenkandidaten process is less impactful than it might seem at first. Furthermore, we hypothesize that this negative reaction is even stronger when governments move to reject the candidate.
Hypothesis 2a: Compared to No Government Approval, Government Approval with Governments Accepting the Candidate has a negative effect on satisfaction.
Hypothesis 2b: Compared to Government Approval with Governments Accepting the Candidate, Government Approval with Governments Rejecting the Candidate has a negative effect on satisfaction.
-
3. The differences between the government approval conditions, compared to the Primary and No Primary conditions, help us understand how the inclusion of a primary system changes the response to different government decisions. This allows us to evaluate whether the lack of reaction to the failure of the 2019 Spitzenkandidaten process is due to a lack of attachment to the candidates, not just a lack of information. We expect primaries to have an effect, especially when governments have very little say in the final choice of the EC president. When governments override the choice of the parliament, the pre-election primaries matter very little. We hypothesize that respondents recognize this and disregard primaries in this situation. This third hypothesis addresses and combines our two main research questions by testing the positive effect of primaries on EU legitimacy under adverse conditions.
Hypothesis 3: The Primary condition has a higher effect on satisfaction (more positive) in the No Government Approval conditions than in the Government Approval conditions.
All main hypotheses and exploratory analyses for this experiment have been preregistered.Footnote 13
Results
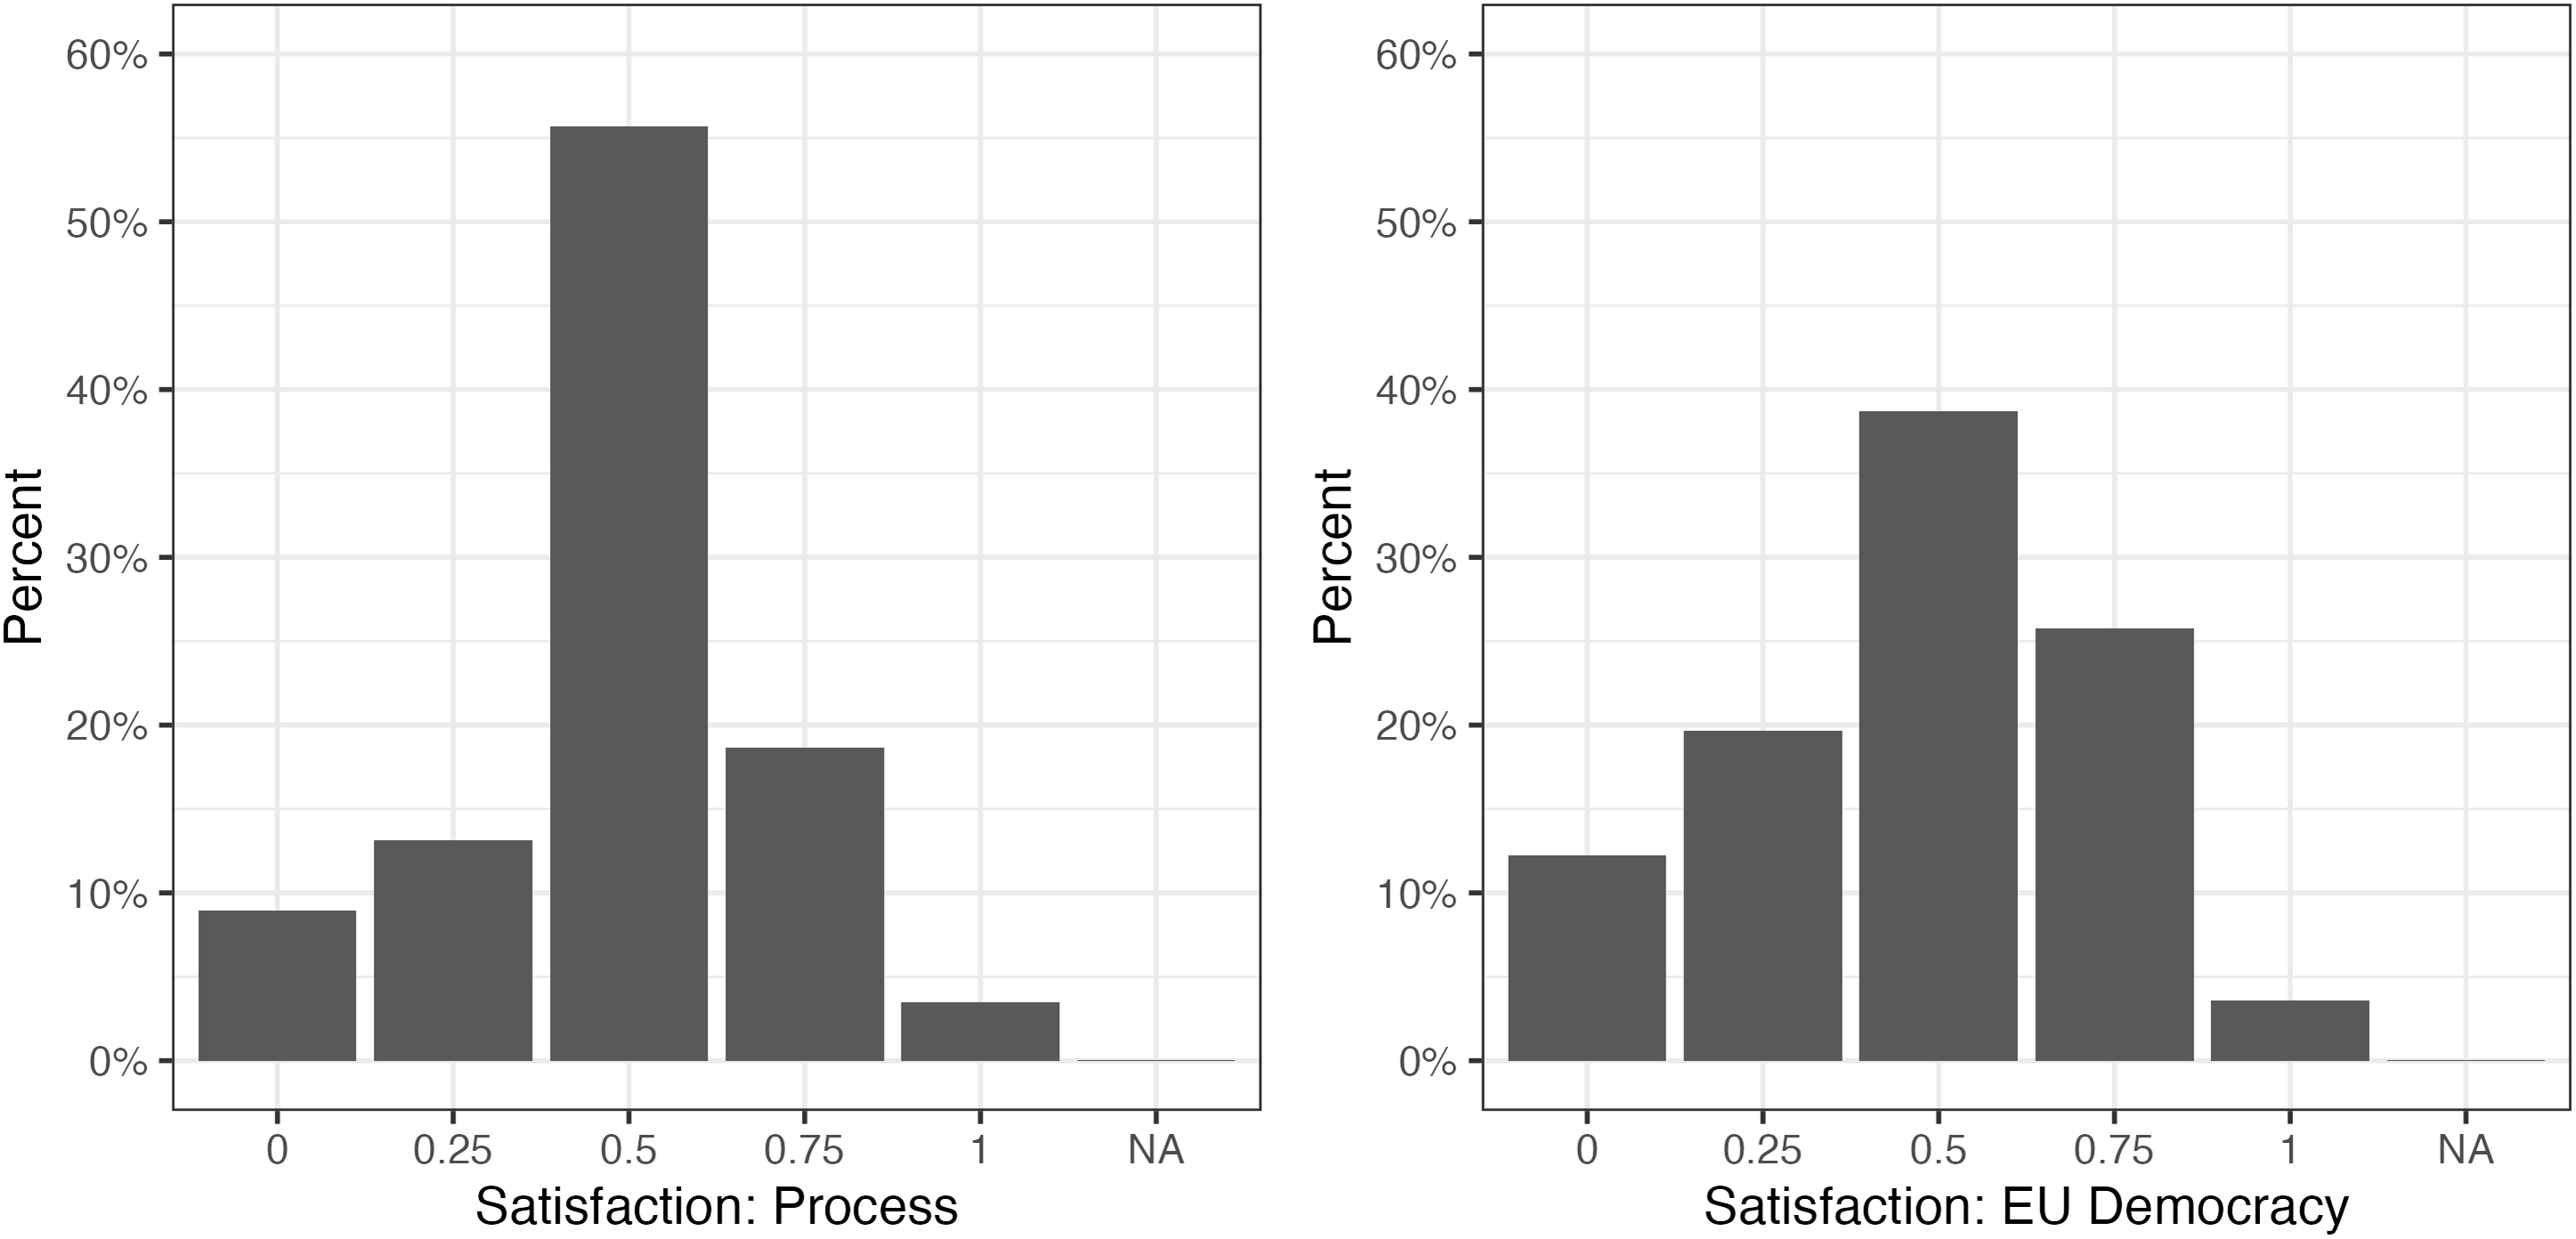
Figure 5 shows the distribution of the two dependent variables. We analyze these two dependent variables using separate OLS regressions. In all main analyses, we first run models that include only the two treatments and their interaction. Then, to increase precision, we include pretreatment covariates and interact them with the treatment factors. We report the results in terms of marginal effects, which allow us to test our hypotheses directly. In the following, we simplify our analyses by combining the no government choice and government accepts conditions, making interpretation of the results more straightforward. We combine both conditions because respondents seem to respond to them in the same way. Furthermore, the combined treatment variable clarifies the main difference between the experimental scenarios. Governments either reject the candidate or they do not. Whether or not they potentially have the power to do so matters less. Nevertheless, we adhere to our pre-registered hypotheses and report the results for all available conditions in Tables B6 and B7 in the Appendix.
Distribution of the two dependent variables. All variables were rescaled to the 0–1 range.
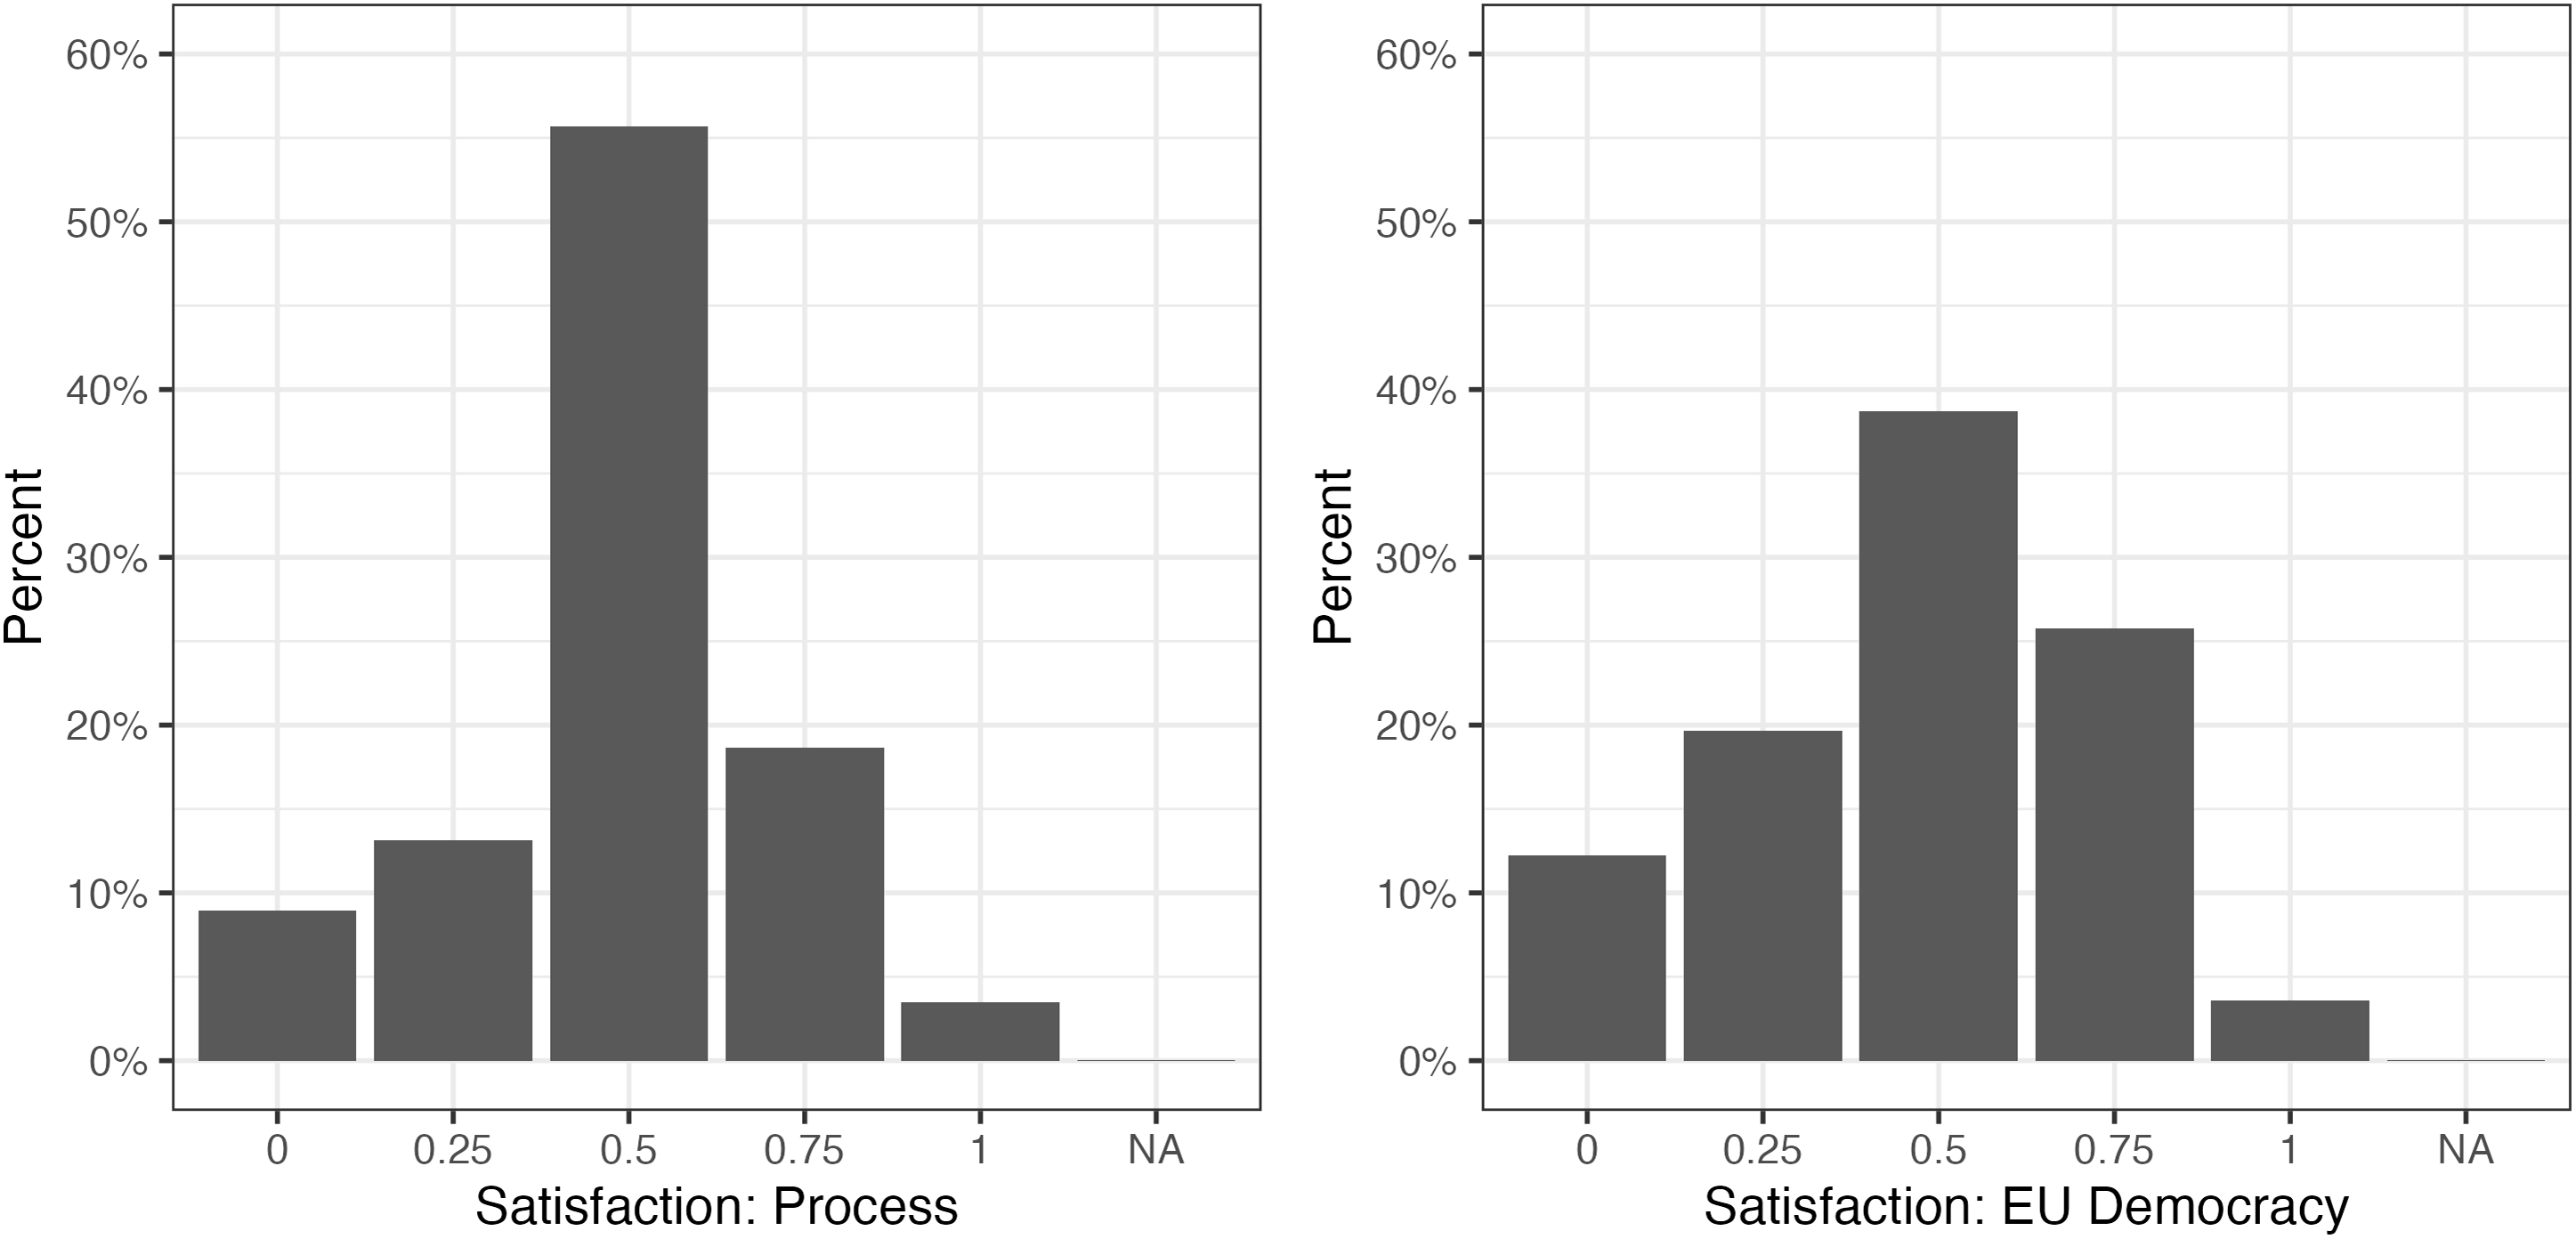
Table 2 shows the main effects of both treatment factors. In the first treatment respondents were either exposed to the primary in the scenario or not. Clearly, there is no significant effect of the primary condition overall. Therefore, we find no support for hypothesis 1. Due to the large sample size, we can rule out small, practically insignificant effects.
Marginal treatment effects

+ P < 0.1, *P < 0.05, **P < 0.01, ***P < 0.001. Generated from models in Table B5. Heteroskedasticity-robust standard errors in parentheses.
Turning to hypothesis 2, we find a statistically significant negative effect of governments rejecting the candidate for satisfaction with the process, but not on overall satisfaction with democracy in the EU. The effect on satisfaction with the process is in the expected negative direction.
Since we have recoded the dependent variables to range from 0 to 1, we can interpret the mean differences reported in Table 2 as differences in percentage points. Thus, the mean difference between government rejection and no government rejection on satisfaction with the Spitzenkandidaten process is about 3% points. This effect is very small and, we argue, not substantially interesting. We presented respondents with a scenario in which the governments of the member states did not accept the candidate from the Spitzenkandidaten process. Given that this treatment is necessarily more direct than the real situation because all respondents received complete information about the intervention of the member state governments,Footnote 14 the magnitude of the differences in satisfaction with the described process is surprisingly small. Such differences in satisfaction are unlikely to lead to a strong backlash in the public sphere. Following established guidelines, we can also interpret the effect size in comparison to other experiments in the social sciences (Gignac and Szodorai Reference Gignac and Szodorai2016; Funder and Ozer Reference Funder and Ozer2019). According to these standards, the largest effect we find, that of government rejection on satisfaction with the process, is very small (Cohen’s d for the mean difference = 0.11).
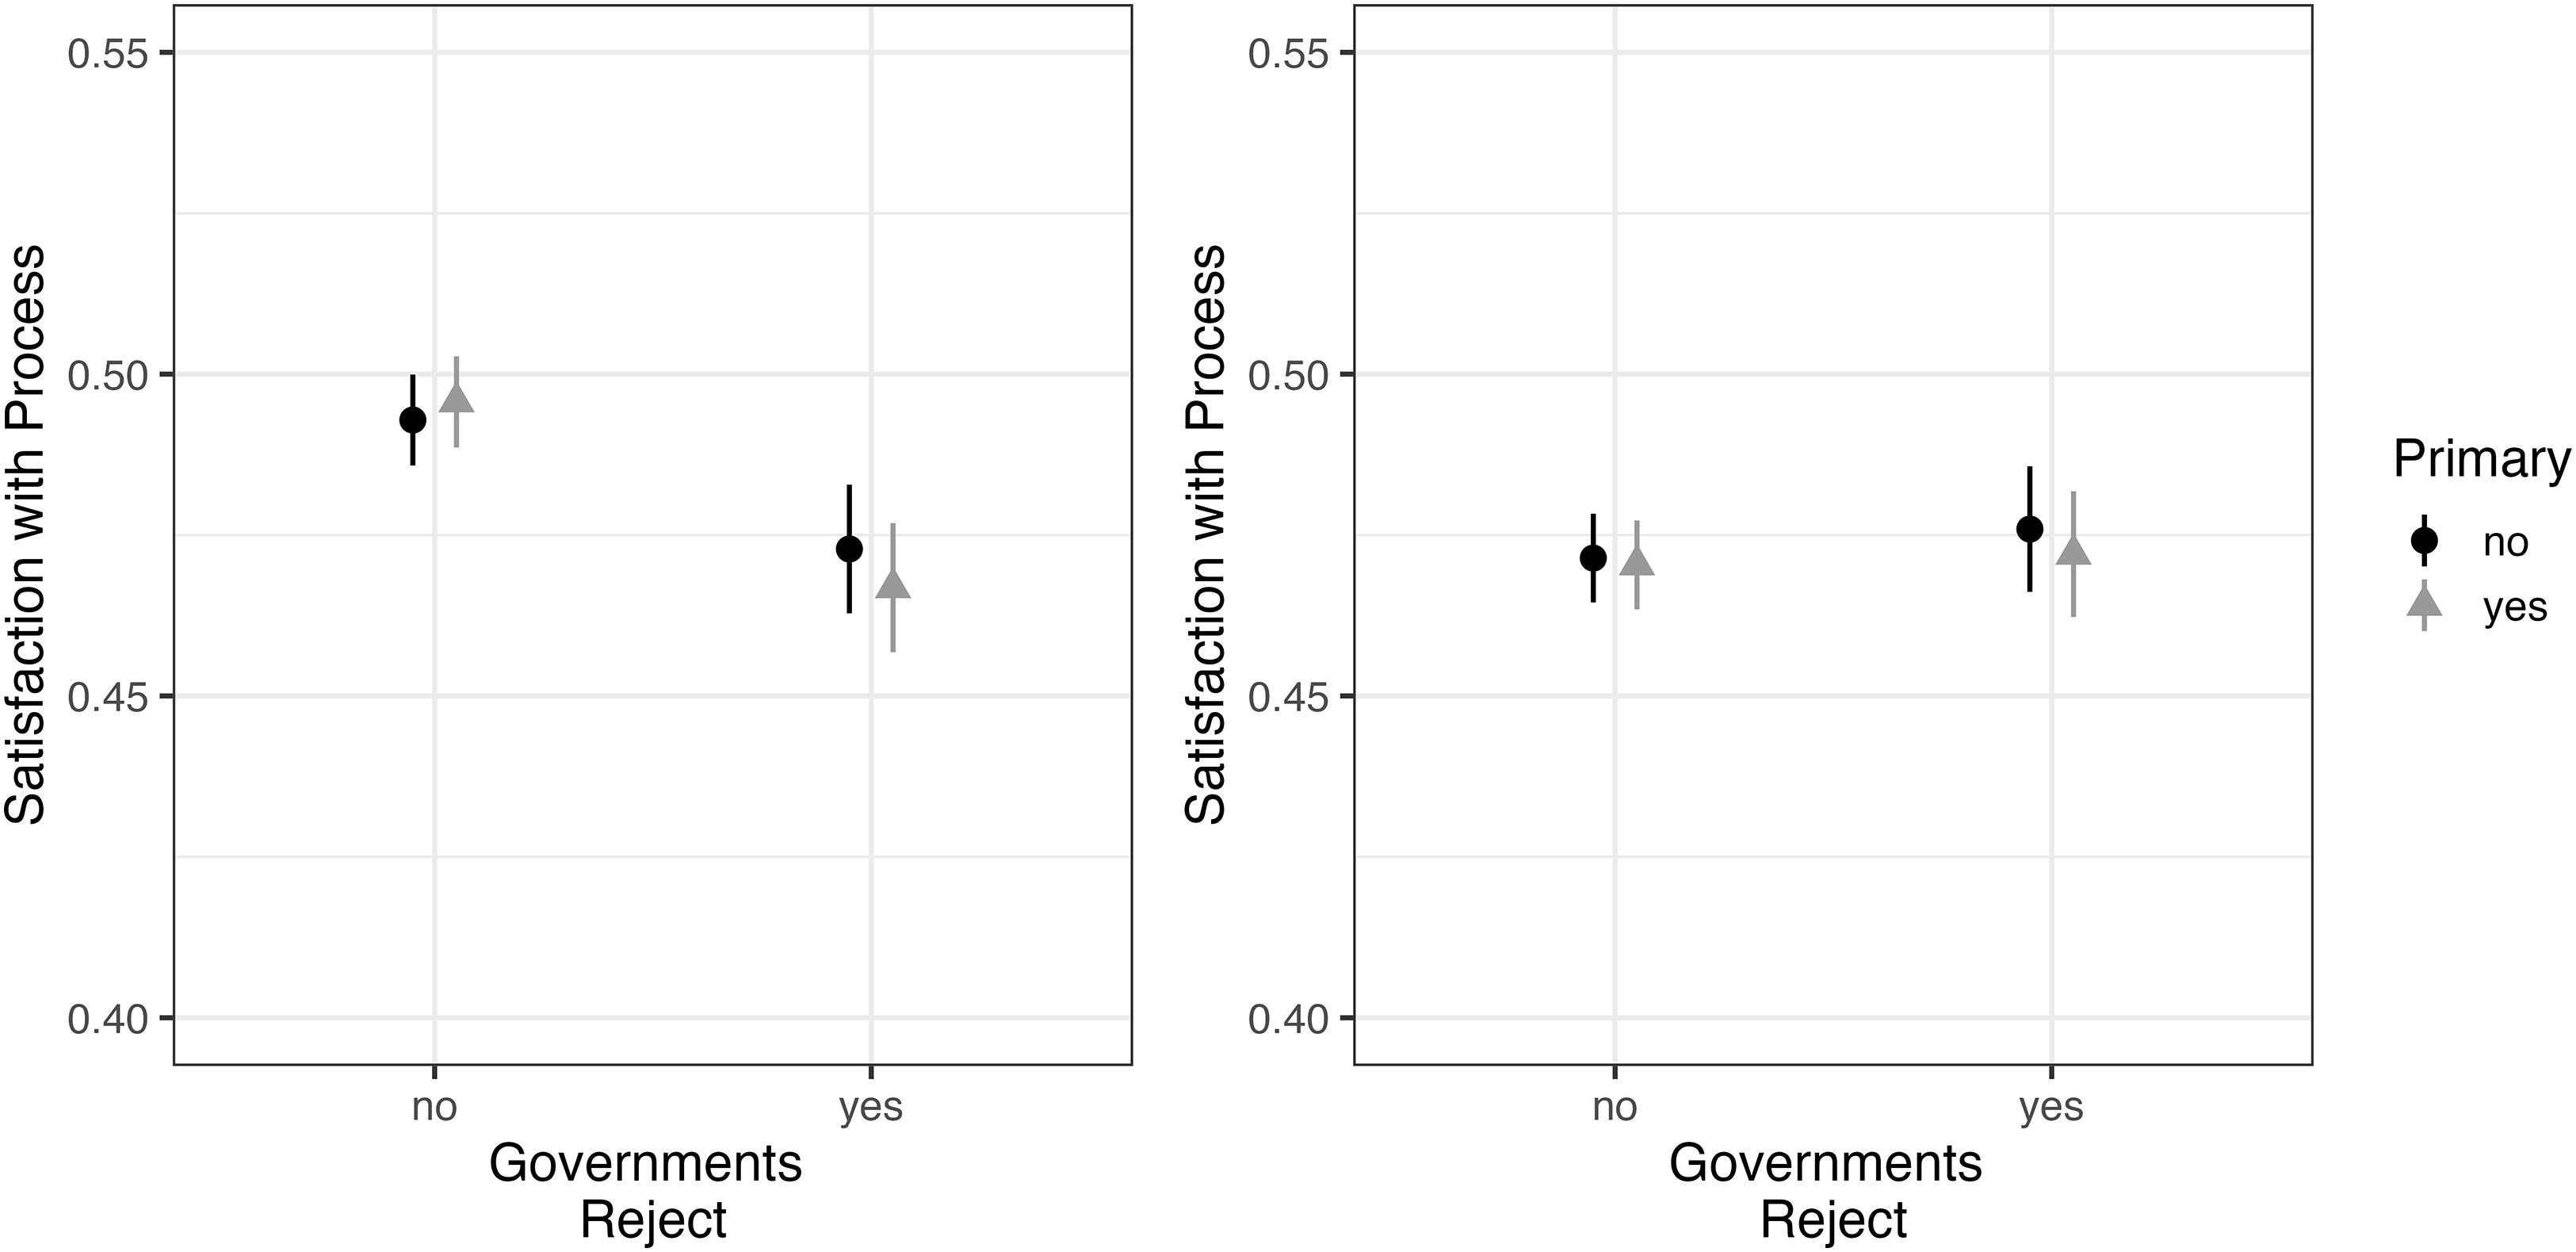
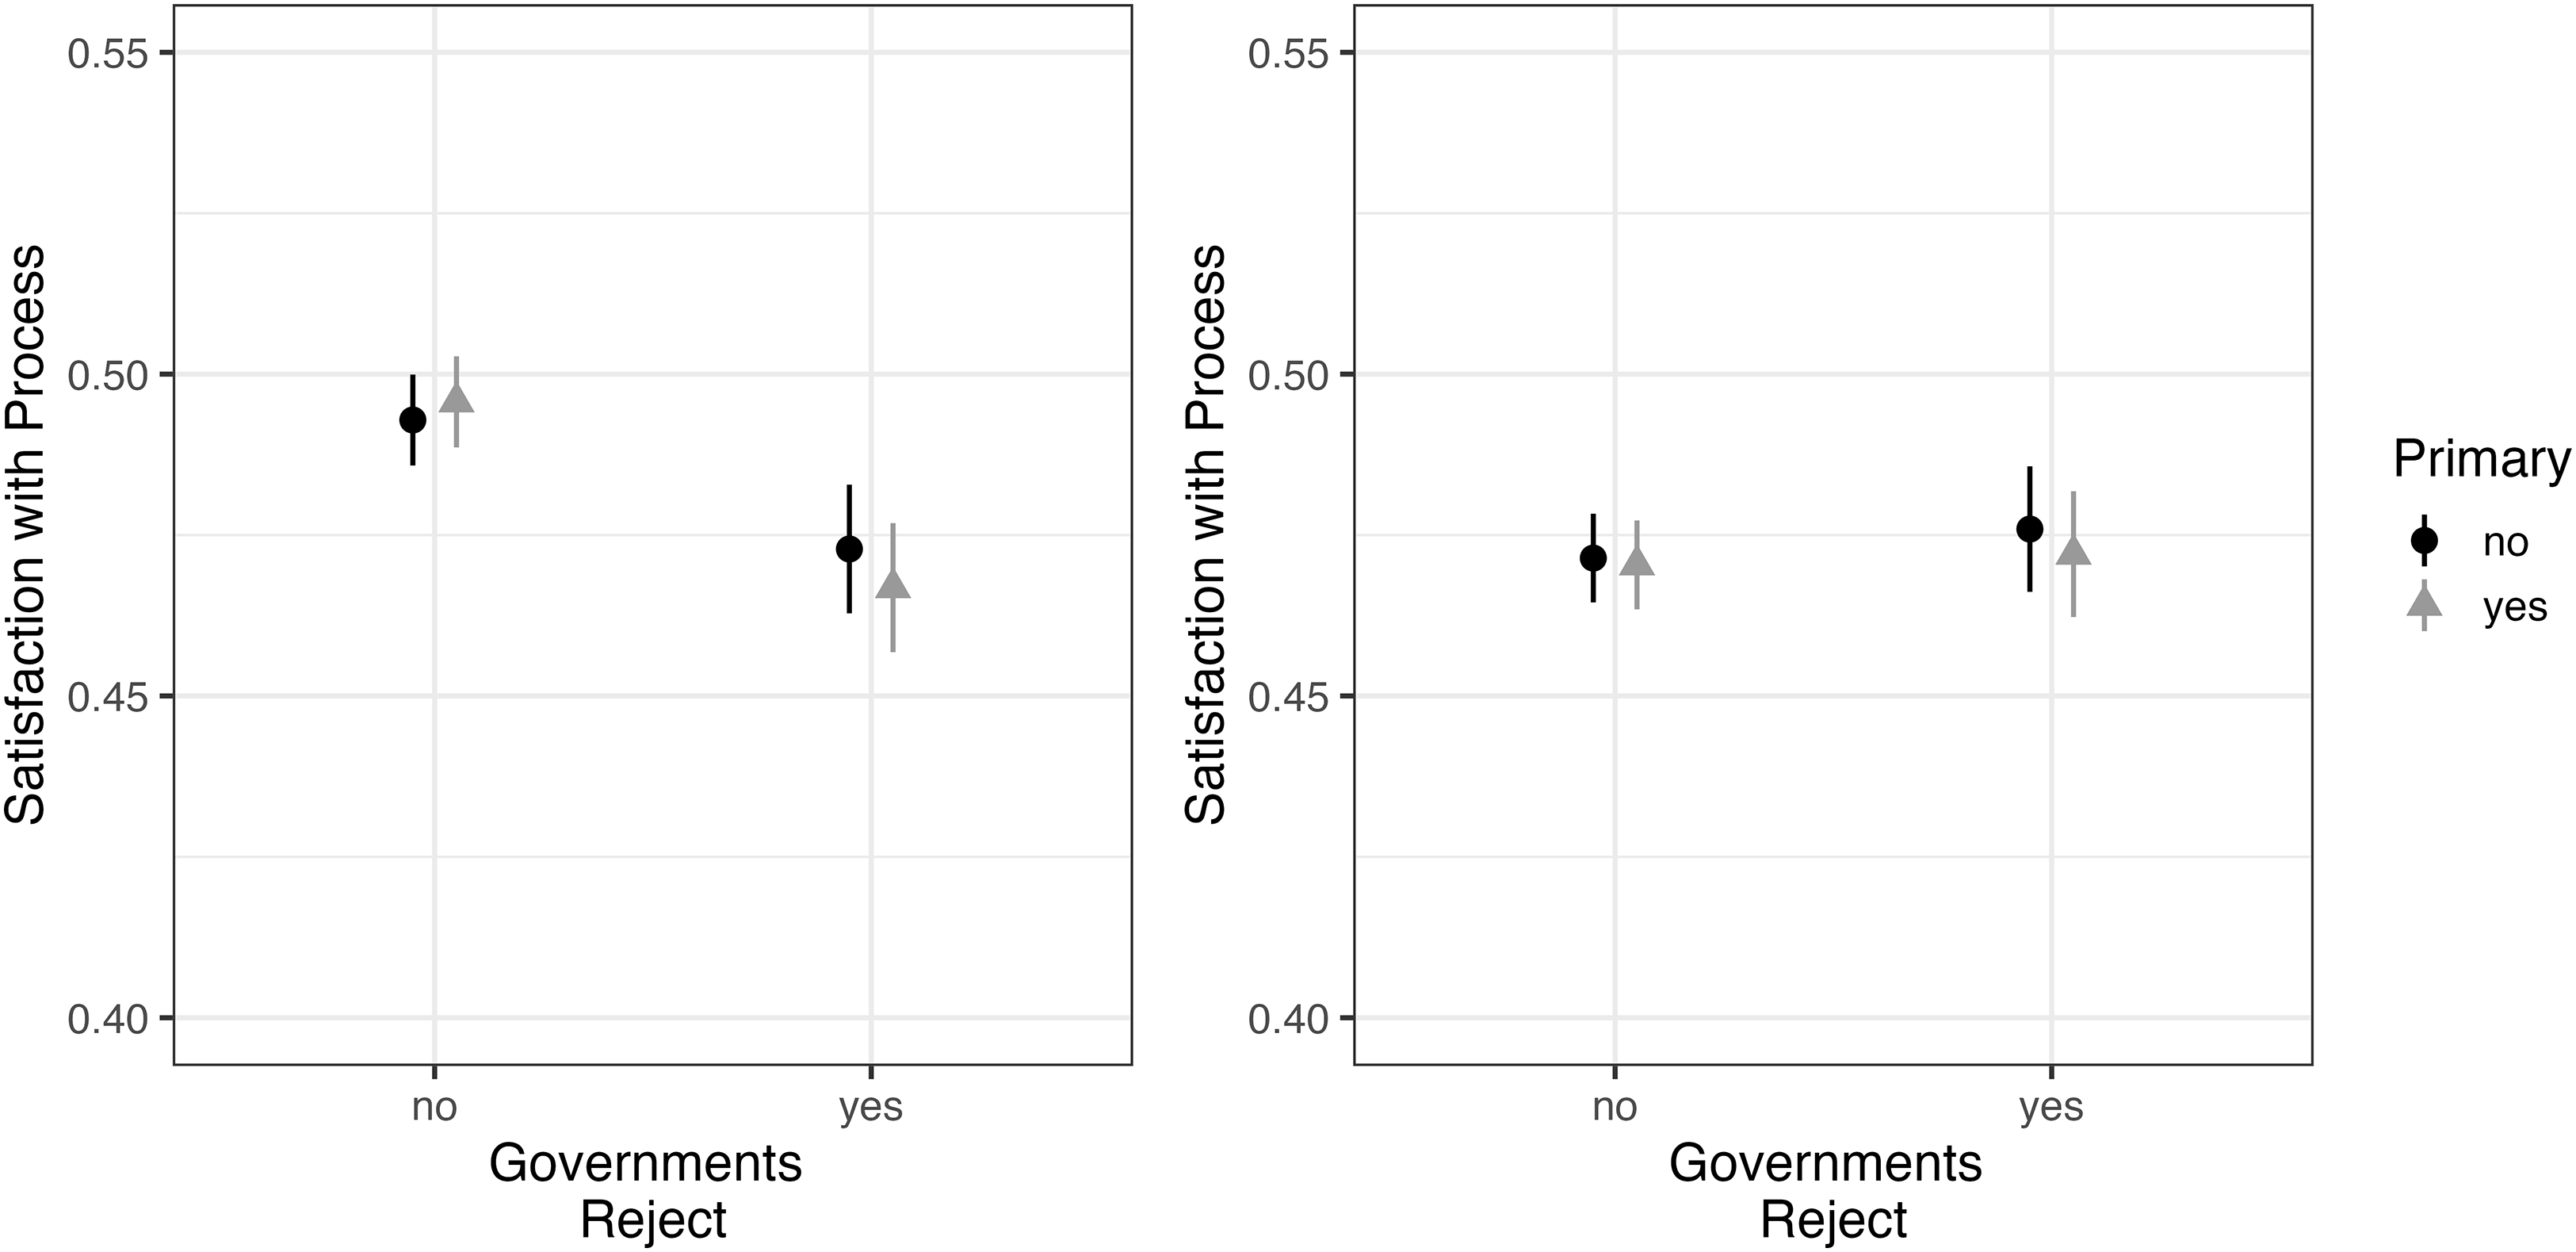
To test hypothesis 3, we examine interaction effects between the two experimental groups. To better understand our results, we plot the predicted means in Figure 6. In the pre-registered hypothesis, based on our theoretical reasoning, we predicted that there would be a positive effect of primary conditions in the ’no government’ and ’governments accept’ conditions, whereas this effect should be smaller in the ‘governments reject’ conditions. These are not the patterns we observe in the data. When looking at satisfaction with the process, there are no differences between the primary and no primary conditions. In rating their satisfaction, respondents appear to have focused solely on the actions of member states after the elections.
Estimated means generated from models reported in Table B5 with 95% confidence intervals.
Several factors could explain our null results for the primary treatment and the very small effect for the government intervention treatment. First, it is possible that many respondents did not pay attention during the experiment. For the primary treatment, however, this explanation is less plausible because respondents were asked to make an explicit choice (by choosing their preferred candidate). Since some respondents did not get to make a choice (either because they did not intend to vote in the EP elections or because their party could not be matched to an official candidate), we narrowed the sample to include only those who had the possibility to make a direct choice. The results do not change significantly (see Table B10). For the government intervention treatment, we did not include an explicit manipulation check. However, we can still investigate attentiveness to the survey as a whole. We excluded respondents who failed a pre-treatment attention check, as well as those who answered the pre-treatment questions either very quickly or very slowly (Read, Wolters, and Berinsky Reference Read, Wolters and Berinsky2022). Excluding respondents this way does not affect our main results (see Tables B8 and B9 in the Appendix). Thus, even among respondents for whom the treatment should be strongest, we observe only small effects.
Second, different characteristics of the respondents may also play a role, i.e., some citizens may consider the Spitzenkandidaten process to be fair because it is reminiscent of the way national leaders are chosen, while others may find it unfair for exactly the same reasons. Such a contrast in responses to the experimental treatment could potentially explain our null results in the overall mean differences. For example, while pro-EU citizens may support increased electoral accountability of the Commission President, anti-EU citizens or those who support a strictly intergovernmental EU may oppose the Spitzenkandidaten process because they see it as making the EU more federal. Plescia, Daoust, and Blais (Reference Plescia, Daoust and Blais2021) find that participating in and winning the election does not increase satisfaction with democracy among those with an exclusive national identity. A similar polarizing effect of Spitzenkandidaten on attitudes towards the EU is found by Popa, Rohrschneider, and Schmitt (Reference Popa, Rohrschneider and Schmitt2016). Therefore, it could be that pro-EU respondents react negatively to the government rejection condition, while anti-EU respondents react positively.
If we were to hypothesize about subgroup effects after examining the data, our results could be highly unreliable and irreproducible, potentially leading to ‘p-hacking’ (Ratkovic Reference Ratkovic, Druckman and Green2021). We therefore examine these and other heterogeneous treatment effects in a principled exploratory manner. Following the preregistered procedure, we find only minimal evidence of heterogeneous treatment effects. We also conduct a second investigation of subgroup effects by simply running OLS regressions with interaction effects directly. A more detailed description of this investigation can be found in Section B.7 in the Appendix.
The only subgroup that might play a role in both approaches is the level of formal education on satisfaction with the primary process. This interaction of education with the treatment variable is statistically significant only on the 0.1 level after correcting for multiple comparisons (P = 0.078) (see Table B13). However, given that we did not pre-register this alpha level, one should not over-interpret this result. In terms of country differences, although the treatment effects are statistically significant for some countries and not for others, the differences between these effects themselves are not significant, suggesting that the experiment produced similar results across all countries in our sample. For illustration purposes, we plot the marginal effects of the two treatments for each outcome across all covariates (see Section B.7 in the Appendix). Overall, we find no convincing evidence for heterogeneous effects. Therefore, we conclude that our results cannot be explained by opposing subgroup effects resulting in overall null effects.
Third, we can investigate whether or not the official candidates were popular choices in the primary experiment. If they are especially unpopular compared to alternatives, this might explain the lack of a reaction to the overturning of the Spitzenkandidaten system. Figure B4 shows that this is a plausible explanation. Only 23% of respondents chose the official candidate, making ‘Don’t Know’ and the stateswoman/man options more popular. Yet, even for respondents who made an explicit choice for a candidate (either a stateswoman/man or an official candidate), the effect of governments rejecting the candidate in the scenario remains small (3.1% points) (see Table B12).
In summary, our results provide no evidence that procedural fairness plays an important role for our two satisfaction measures. We do not find statistically significant differences whether or not we include a primary condition in our scenario. Furthermore, while we find statistically significant effects for member state government intervention in the process on one of the two outcomes, these differences are not substantially meaningful.Footnote 15 The results of the survey experiment are similar to the observational results of Study 1, which found no statistically significant effects of EU member state intervention in the Spitzenkandidaten process. The combination of these different sources of evidence provides additional confidence in our conclusions.
Discussion
One of the main goals of the Spitzenkandidaten process was to increase the legitimacy of the European Commission and the participation of European citizens. However, after the failure of the process in the 2019 European Parliament elections, one might be skeptical about whether the intended goals have been achieved. In this paper, we examine the Spitzenkandidaten process in European elections through the lens of procedural fairness theory. Specifically, we examined three main aspects: first, we investigated whether citizens reacted negatively to the 2019 European Council’s selection of von der Leyen, who was not a Spitzenkandidat. What’s more, citizens could react negatively to the idea that the European Council can and does use its powers to override the Spitzenkandidaten process in general. Second, we investigate whether citizens prefer a primary system in which they get to decide who becomes the Spitzenkandidaten of the European parties. Third, if primaries are important to citizens, they may increase the backlash caused by overriding the Spitzenkandidaten process. If citizens cared about procedural fairness, they would react more strongly when the Spitzenkandidaten candidates selected in primaries are ignored by member state governments.
Our analyses combine an observational study design, taking advantage of the surprise nomination of von der Leyen as Commission President in 2019, and an original survey experiment by varying different scenarios describing the impact of citizens’ votes in the 2024 European elections. The results of both studies show that Europeans care very little about the Spitzenkandidaten process and whether it follows a more transparent and inclusive process. Not only was there very little public backlash after von der Leyen’s nomination in 2019, but our survey experiment also shows that satisfaction with the Spitzenkandidaten process decreases only very slightly when the European Council overrides the process. These results show that the European Council’s decision to override the Spitzenkandidaten process does not cause a (large) backlash among European citizens. More generally, the Spitzenkandidaten process in its current form does very little to engage and convince citizens, despite support for direct elections of the European Commission President.
Beyond the current implementation of the process, we investigated whether a primary before the European elections could increase satisfaction with the process and satisfaction with EU democracy as a whole. In our survey experiment, we implemented such a hypothetical primary in an election scenario. Again, contrary to our expectations, our results show that primaries barely change citizens’ evaluations of the process. Moreover, respondents’ reactions remain muted even when a candidate they had previously chosen does not become Commission President because the Council chooses a new, previously uninvolved candidate. Overall, our results from both studies point to the same conclusion: there is very little potential for backlash, suggesting little or no attachment to the Spitzenkandidaten process. We therefore have reason to believe that citizens do not apply procedural fairness considerations to a meaningful extent in this particular EU governance situation.
These results are interesting in the context of the theoretical and empirical literature on procedural reforms aimed at increasing legitimacy. Our findings challenge the assumption that procedural fairness per se increases the EU’s legitimacy in the eyes of its citizens. Although citizens support the concept of the Spitzenkandidaten process and the direct election of the Commission President, they do not seem to react negatively when the process is disregarded. Thus, we should reconsider what citizens expect from EU-level democracy and how future European elections can address issues of accountability and participation beyond procedural reforms. The potential of the Spitzenkandidaten process, both in its current form and in a more participatory iteration, to enhance the legitimacy of the EU appears marginal at best. Consequently, we contribute to the discourse surrounding the impact of procedural reforms on beliefs about legitimacy and to the ongoing debate about the challenges to the EU’s legitimacy. Without sustained engagement with citizens, changes to political processes seem to matter very little in this context, even to the highly informed and interested.
Our studies have four main limitations that invite further research. First, the effects of overruling the Spitzenkandidaten process and of the introduction of a primary are both measured in the short term. It is possible that citizens may react (more) strongly to changes in procedural fairness only after years of socialization into new political institutions. Our approach, which measures respondents’ immediate reactions in both the observational study and the survey experiment, cannot account for these potential long-term effects. Such effects could be investigated in future time series studies or historical analyses. The same could be said of the role of candidates. In other contexts, citizens could strongly oppose the idea of ignoring very popular candidates. As with the long-term effects, the potential for procedural fairness to play a role should be studied further. Second, all scenarios in our survey experiment include the Spitzenkandidaten process. However, it is possible that citizens are more interested in the existence of the process than in its outcomes. We cannot rule out the possibility that the mere existence of the Spitzenkandidaten process is sufficient to satisfy citizens’ demands. Third, in our survey experiment, we created a primary scenario in which respondents could choose a candidate at the European level. It may be that primaries at the national level are more effective because national candidates are much more familiar to citizens. Future research could extend our survey experiment to such different institutional arrangements. Finally, our studies do not include a substantive policy dimension. Since we are primarily interested in changes in procedural fairness, we do not examine what candidates stand for in terms of substantive policies. More detailed policy information might increase the attachment to the chosen candidate and thus increase the backlash against the European Council’s intervention in the Spitzenkandidaten process. Research that extends our studies in this way, including studies specifically designed to test for heterogeneous effects, might tell us why we find negligible effects of procedural fairness on citizens’ evaluations of EU democracy.
Supplementary material
The supplementary material for this article can be found at https://doi.org/10.1017/S147567652610084X.
Data availability statement
Data for study 1 is available at the GESIS database: https://search.gesis.org/research_data/ZA5553
Data for study 2 can be accessed at the OSF repository: https://osf.io/j6a8u/overview?view_only=ea0de99a8a9f4a6380deb22e28b33d19.
Acknowledgements
We would like to thank our colleagues in the EVPOC research group and Katjana Gattermann for their feedback on earlier drafts of this manuscript. We would also like to thank the participants of the ‘Disinformation Campaigns and Narratives during the 2024 European Elections’ panel at the ECPR general conference 2024 for their valuable comments.
Financial support
No declaration.
Competing interests
No competing interests.
Ethical standards
No statement.




 Open access

