


Introduction
Following the discovery of a rapid rise of radiocarbon (14C) concentrations in tree rings of AD774/5 (M12) (Büntgen et al. Reference Büntgen, Lukas and Galván2018; Güttler et al. Reference Güttler, Adolphi and Beer2015; Miyake et al. Reference Miyake, Nagaya, Masuda and Nakamura2012; Park et al. Reference Park, Southon, Fahrni, Creasman and Mewaldt2017; Uusitalo et al. Reference Uusitalo, Arppe, Hackman, Helama, Kovaltsov, Mielikäinen, Mäkinen, Nöjd, Palonen, Usoskin and Oinonen2018), other similar Δ14C peaks have been studied, including AD 993/4 (Miyake et al. Reference Miyake, Masuda and Nakamura2013), 5480 BC (Miyake et al. Reference Miyake, Jull, Panyushkina, Wacker, Salzer, Baisan, Lange, Cruz, Masuda and Nakamura2017), ∼660 BC (O’Hare et al. Reference O’Hare2019; Park et al. Reference Park, Southon, Fahrni, Creasman and Mewaldt2017; Sakurai et al. Reference Sakurai, Tokanai, Miyake, Horiuchi, Masuda, Miyahara, Ohyama, Sakamoto, Mitsutani and Moriya2020), 813 BC (Jull et al. Reference Jull, Panyushkina, Miyake, Masuda, Nakamura, Mitsutani, Lange, Cruz, Baisan, Janovics, Varga and Molnár2018), AD 1052/1054 (Brehm et al. Reference Brehm, Bayliss, Christl, Synal, Adolphi, Beer, Kromer, Muscheler, Solanki, Usoskin, Bleicher, Bollhalder, Bollhalder, Tyers and Wacker2021; Terrasi et al. Reference Terrasi, Marzaioli, Buompane, Passariello, Porzio, Capano, Helama, Oinonen, Nöjd, Uusitalo, Jull, Panyushkina, Baisan, Molnar, Varga, Kovaltsov, Poluianov and Usoskin2020), 5410 BC (Miyake et al. Reference Miyake, Panyushkina, Jull, Adolphi, Brehm, Helama, Kanzawa, Moriya, Muscheler, Nicolussi, Oinonen, Salzer, Takeyama and Tokanai2021), AD 1279 (Brehm et al. Reference Brehm, Bayliss, Christl, Synal, Adolphi, Beer, Kromer, Muscheler, Solanki, Usoskin, Bleicher, Bollhalder, Bollhalder, Tyers and Wacker2021; Miyahara et al. Reference Miyahara, Tokanai and Moriya2022), 7176 BC (Brehm et al. Reference Brehm, Christl and Knowles2022; Paleari et al. Reference Paleari, Mekhaldi and Adolphi2022), 5259 BC (Brehm et al. Reference Brehm, Christl and Knowles2022), and 12351 BC (Bard et al. Reference Bard, Miramont and Capano2023). Since the initial discovery, several hypotheses have been proposed to explain their cause, including solar proton events (SPEs) (Jull et al. Reference Jull, Panyushkina, Lange, Kukarskih, Myglan, Clark, Salzer, Burr and Leavitt2014; Mekhaldi et al. Reference Mekhaldi, Muscheler and Adolphi2015; Melott and Thomas Reference Melott and Thomas2012; Miyake et al. Reference Miyake, Nagaya, Masuda and Nakamura2012; Usoskin et al. Reference Usoskin, Kromer, Ludlow, Beer, Friedrich, Kovaltsov, Solanki and Wacker2013), supernova (Miyake et al. Reference Miyake, Nagaya, Masuda and Nakamura2012), and gamma-ray explosions (Hambaryan and Neuhäuser Reference Hambaryan and Neuhäuser2013; Pavlov et al. Reference Pavlov, Blinov, Konstantinov, Ostryakov, Vasilyev, Vdovina and Volkov2013). However, with subsequent discoveries, the scientific consensus has shifted towards SPEs as the most likely explanation, a conclusion strongly supported by corresponding bipolar 10Be measurements from ice cores (Mekhaldi et al. Reference Mekhaldi, Muscheler and Adolphi2015). While SPE hypothesis accounts for most of the events, the ones dated to 5480 BC and 813 BC appear to have a longer duration. This has led to suggestions that these longer-lasting phenomena might be connected to special modes of grand solar minimum (Jull et al. Reference Jull, Panyushkina, Miyake, Masuda, Nakamura, Mitsutani, Lange, Cruz, Baisan, Janovics, Varga and Molnár2018; Miyake et al. Reference Miyake, Jull, Panyushkina, Wacker, Salzer, Baisan, Lange, Cruz, Masuda and Nakamura2017).
In this work, our focus is on the ∼660 BC peak and its comparison to other overlapping data sets and of AD774, in particular. The event is particularly intriguing as it also has an apparently longer rise time compared to most of the other events (Park et al. Reference Park, Southon, Fahrni, Creasman and Mewaldt2017). To explain this prolonged duration, a double SPE or an extended production period has been proposed (Park et al. Reference Park, Southon, Fahrni, Creasman and Mewaldt2017; Sakurai et al. Reference Sakurai, Tokanai, Miyake, Horiuchi, Masuda, Miyahara, Ohyama, Sakamoto, Mitsutani and Moriya2020). More exotically, Pavlov et al. (Reference Pavlov, Blinov, Frolov, Konstantinov, Koudriavtsev, Ogurtsov and Ostryakov2019) have suggested that the prolonged rise could have resulted from a solar system encounter with an interstellar gas cloud and the resulting compression of the heliosphere and enhanced galactic cosmic ray flux. To examine the ∼660 BC event in more detail, we use high-latitude tree rings from Finland, which previously have been found to be sensitive to such an event (Miyake et al. Reference Miyake, Hakozaki, Kimura, Tokanai, Nakamura, Takeyama and Moriya2022; Uusitalo et al. Reference Uusitalo, Arppe, Hackman, Helama, Kovaltsov, Mielikäinen, Mäkinen, Nöjd, Palonen, Usoskin and Oinonen2018). Variations in the shape of the Δ14C peak across geographical regions could provide valuable insights into the structure and type of the ∼660 BC event.
Samples and methods
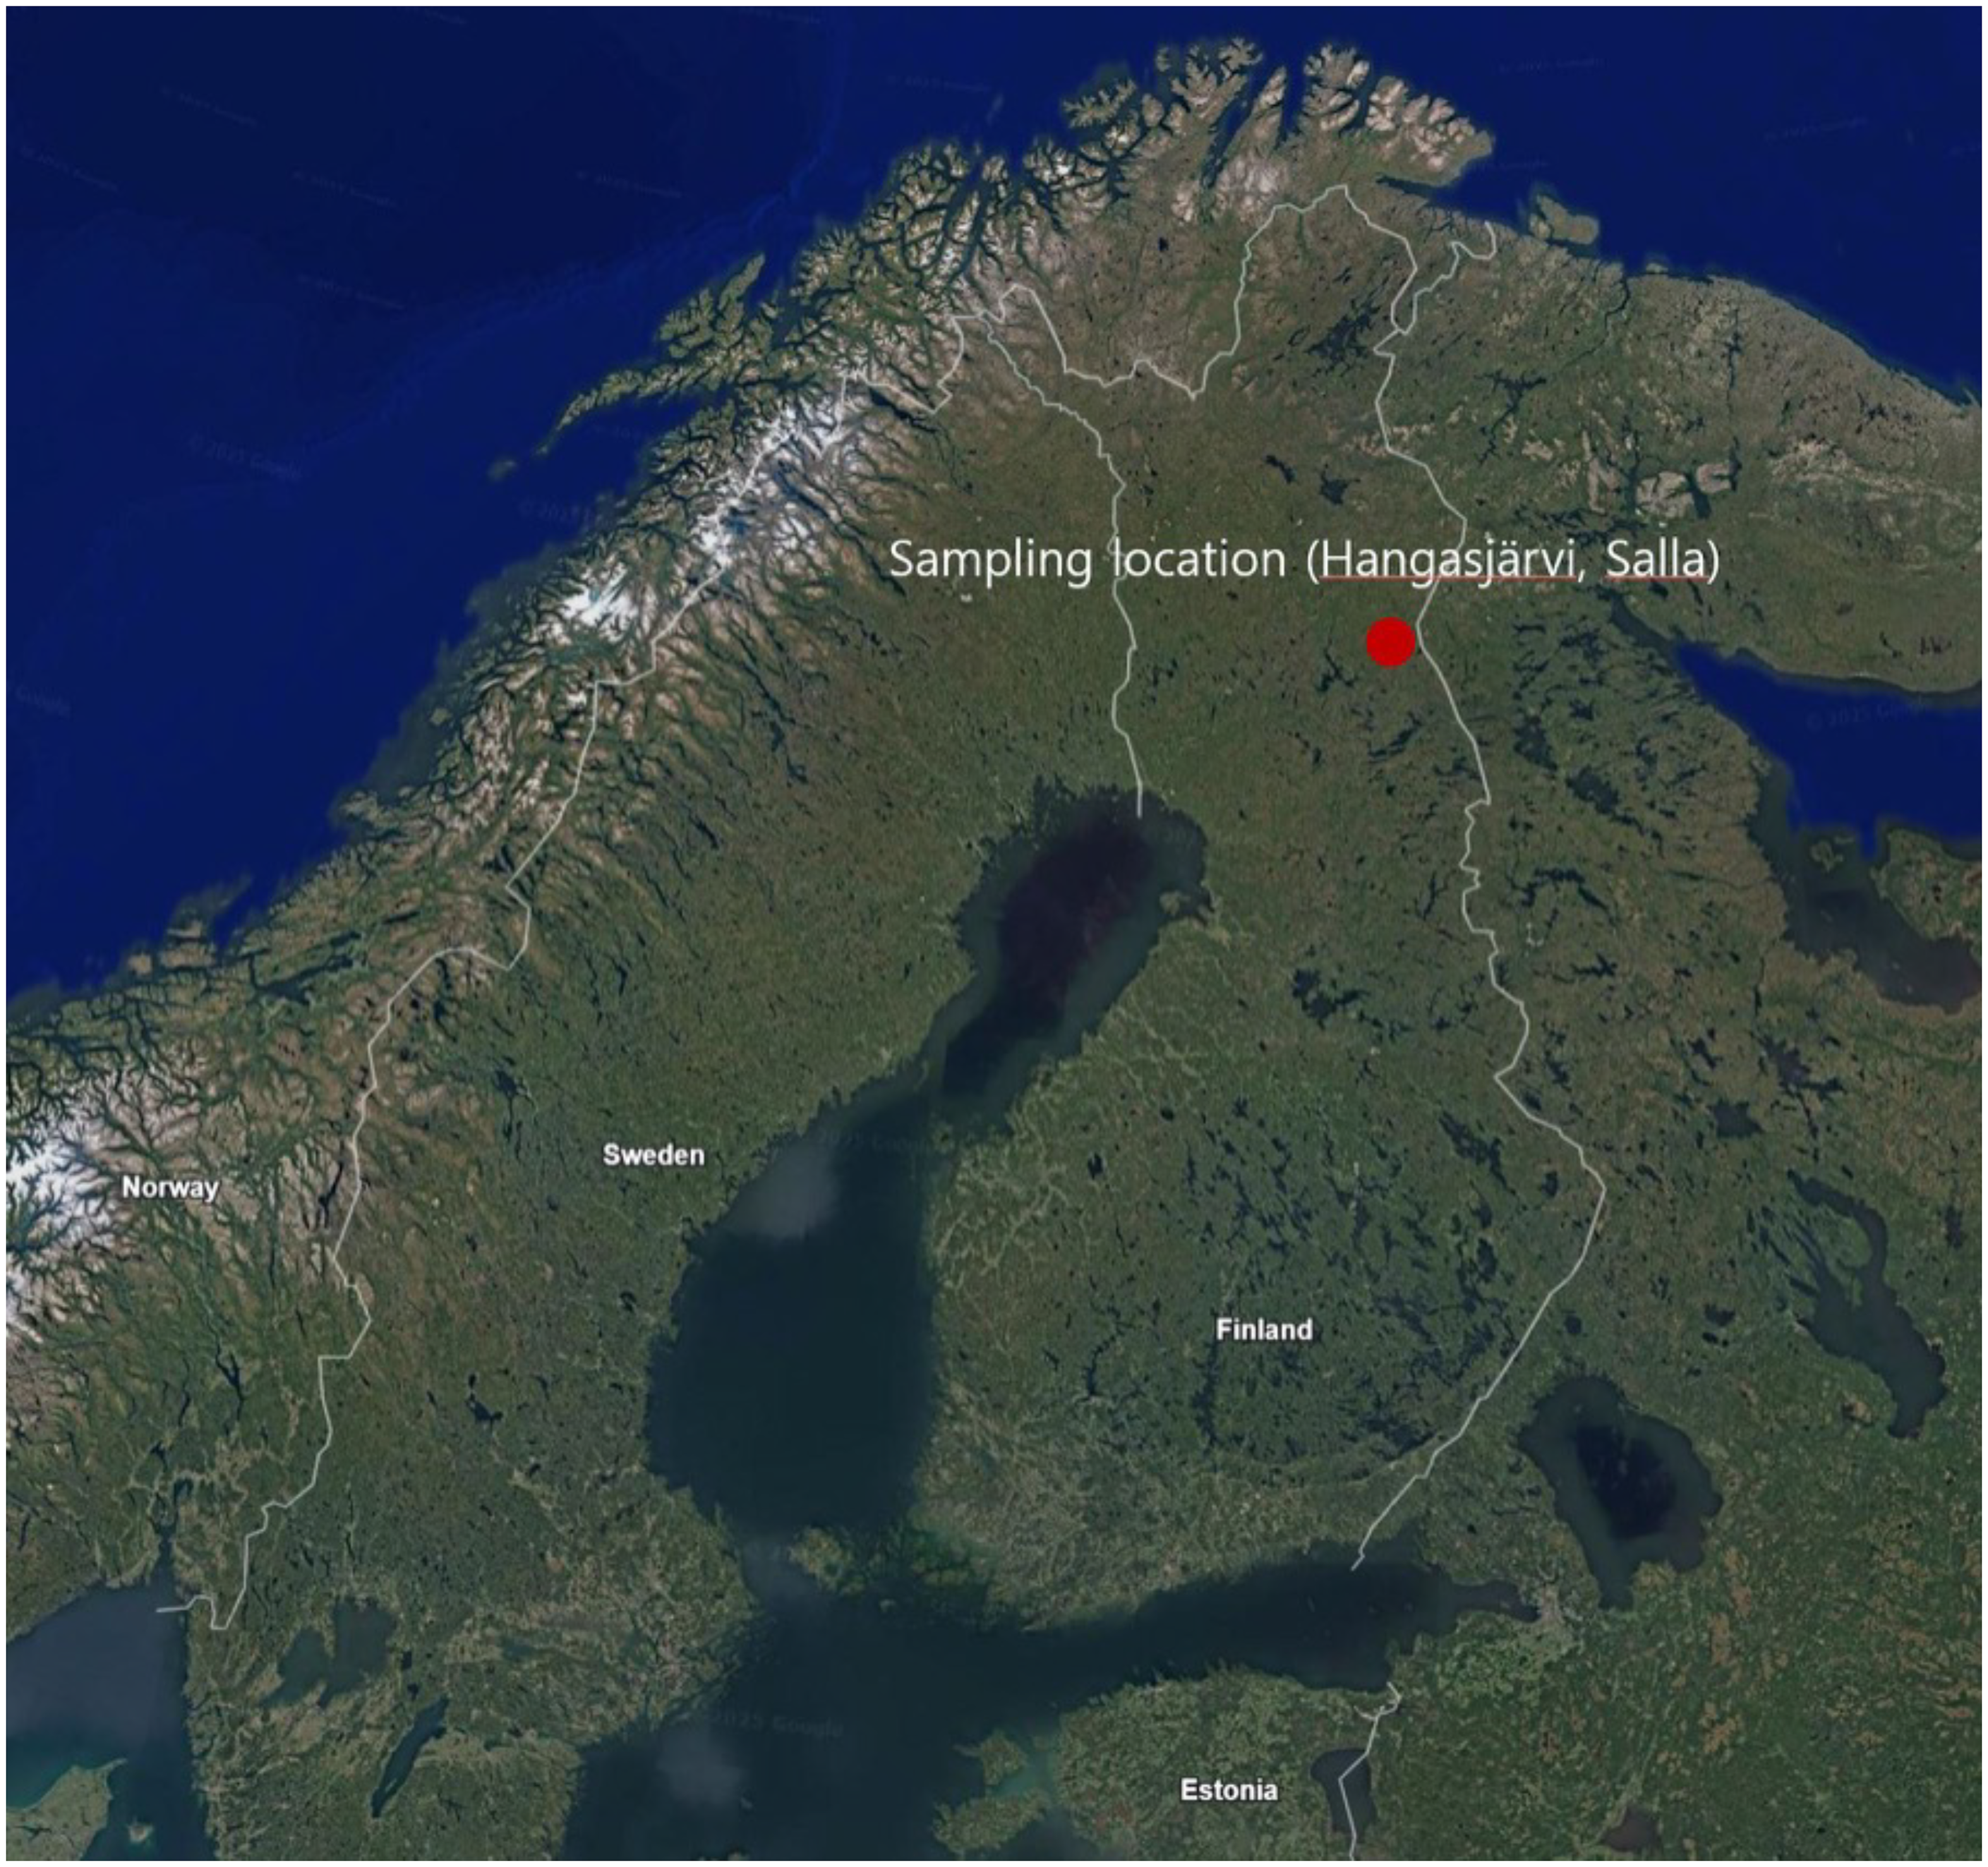
Tree-ring samples of Scots pine (Pinus sylvestris) were collected in Lapland (Hangasjärvi, Salla; 66.8°N, 28.7°E), Finland. In this region, the periods of earlywood (early June to early July; EW) and latewood growth (late June to late August, LW) are very short, thus recording tropospheric 14C contents within a very narrow time window. The collection, cross-dating, slicing, and cellulose extraction of the samples into α-cellulose are detailed in Uusitalo et al. (Reference Uusitalo, Arppe, Helama, Mizohata, Mielikäinen, Mäkinen, Nöjd, Timonen and Oinonen2022). This process was conducted by the Finnish Tree-Ring Research Consortium (FITRE) at the University of Helsinki and the Natural Resources Institute Finland. The α-cellulose samples were combusted, converted chemically to graphite targets, and measured for 14C using the accelerator mass spectrometry facility at the Korean Institute of Geoscience and Mineral Resources in Daejeon, Korea (Hong et al. Reference Hong, Park, Sung, Woo, Kim, Choi and Kim2010a, Reference Hong, Park, Kim, Woo, Kim, Choi and Kim2010b). The results are reported as decay-corrected Δ14C values, hereafter as Δ14C. To take into account potential baseline offsets in illustrations, the data was also normalized by shifting the mean Δ14C value of 4 years predating the anomaly (669–666 BC and AD 770–773) to Δ14C = 0 (see Tables S1 and S2).
The tree-ring data were supported by an 11-box global carbon cycle box model (Güttler et al. Reference Güttler, Adolphi and Beer2015) studies to estimate the amplitude and timing of the required 14C production. This simulation used a daily time resolution, in contrast to the monthly resolution used by other researchers, as the typical duration of a SPE is only a few days. In order to maintain a stable 14C amount in the troposphere, the annual production amount of 14C in the atmosphere is calculated to be 6.8kg, and this amount is used consistently during the simulation. However, this amount is modulated by the sinusoidal signal of the solar cycle with a period 11 years (Güttler et al. Reference Güttler, Adolphi and Beer2015), and is described as Pmod = PM+PS,C ·PM·sin (2π/T·y + φ), where T denotes the cycle-length (11 yr)., y is the year, PM is the average annual production amount of 14C in the atmosphere (6.8kg), PS,C is solar cycle amplitude adopted as 18% and φ is the phase. During the simulation, the solar cycle amplitude (PS,C) and phase (φ) are scanned. This simulation uses an oxidation time of 3.8 months for 14C, indicating the time required for the oxidation of 14C produced by SPE (Park et al. Reference Park, Seo, Hong, Park, Sung, Park and Kim2020). This oxidation time can cause a corresponding delay from the SPE occurrence to the time at which Δ14C signal appears in the tree rings. Previous studies have employed a 30% tropospheric production ratio for 14C (Güttler et al. Reference Güttler, Adolphi and Beer2015; Sakurai et al. Reference Sakurai, Tokanai, Miyake, Horiuchi, Masuda, Miyahara, Ohyama, Sakamoto, Mitsutani and Moriya2020). This value is appropriate for production driven by Galactic Cosmic Rays (GCRs), as their high energy facilitates deep penetration into the atmosphere. However, for solar cosmic rays (SCRs), it is likely an overestimation. Recent simulations indicate a more realistic range for SCR-induced production is between 0.54% and 12% (Golubenko et al. Reference Golubenko, Rozanov, Kovaltsov and Usoskin2022; Hyo Min and Junghun Reference Hyo Min and Junghun2022). Therefore, we adopt the upper bound of 12%. This value allows for significant tropospheric production, in line with previous analyses, while remaining within the realistic range based on the current best understanding of SCR-induced production.
Result and discussion
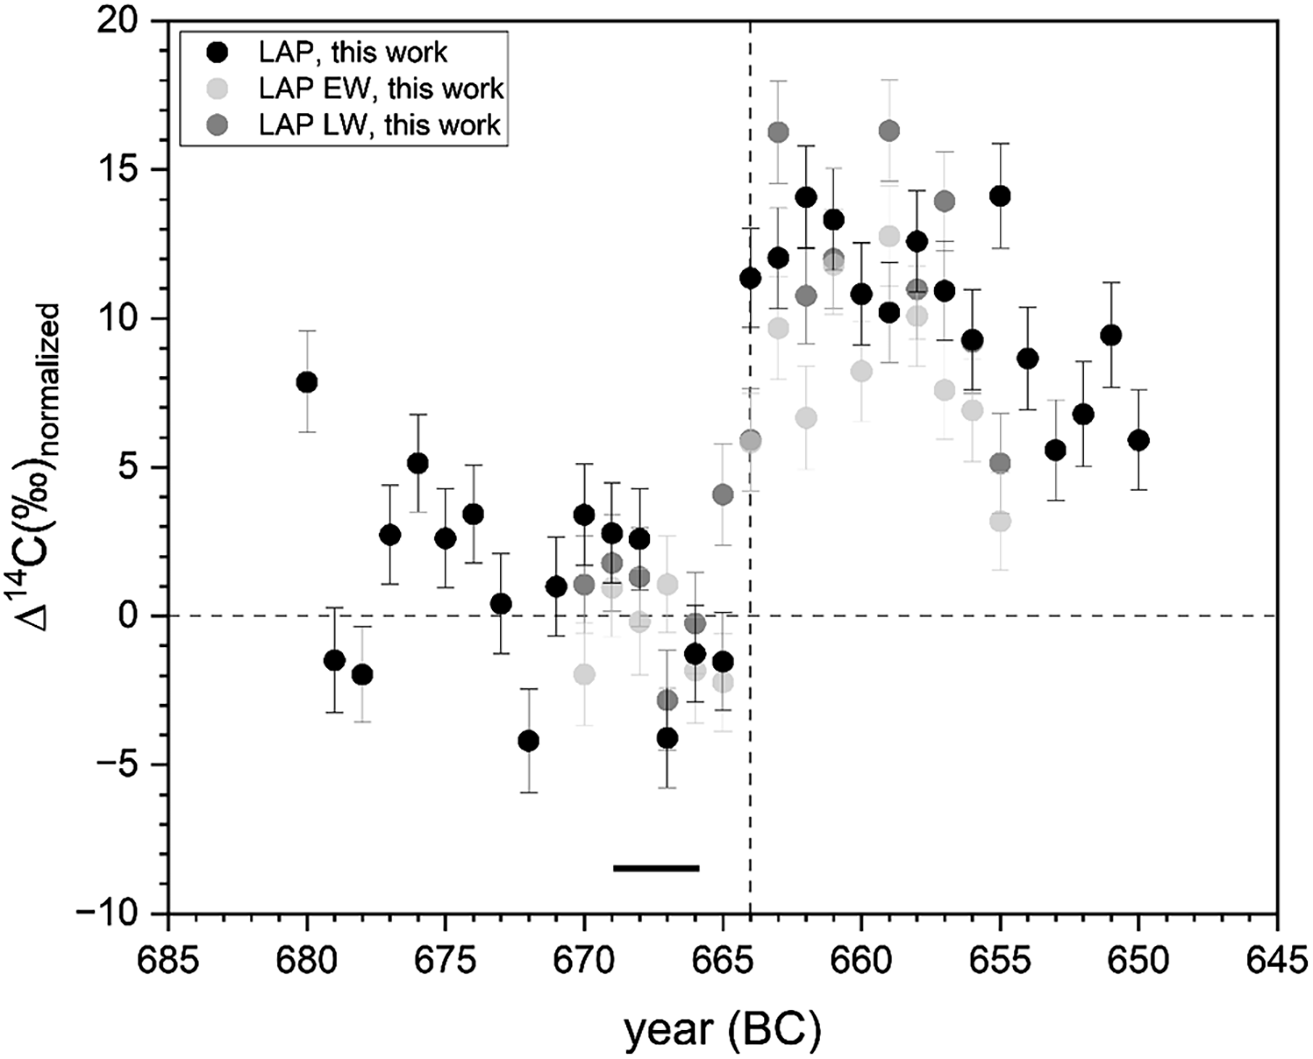
Δ14C values of annual (680–650 BC) and subannual (670–655 BC) tree-ring samples from Finland are given in Supplementary Information Tables S1 and S2 and depicted in Figure 2. There is a baseline difference between the Δ14C of annual and subannual tree-ring data, which has been normalized to zero using pre-event values (see Figure 2 captions). The subannual data show a slight increase of ∼5‰ already in latewood of 665 BC. The Δ14C values increase in both annual and subannual data in 664 BC and reach their maximum in 662–661 BC. The maximum is followed by a slow decline with occasional deviations, particularly in 655 BC when absolute annual and subannual values differ by ∼5‰, which in Figure 2 get amplified to nearly 10‰ due to normalization (see Table S2).
Tree-ring samples of Scots pine (Pinus sylvestris) were collected in Lapland (Hangasjärvi, Salla; 66.8°N, 28.7E, red dot), Finland.

Figure 1 Long description
The map displays Finland with a focus on the geographic region of Lapland. A red dot marks the sampling location for tree-ring samples of Scots pine (Pinus sylvestris) in Hangasjarvi, Salla, at coordinates 66.8 degrees North and 28.7 degrees East. The map highlights the borders of Norway, Sweden, and Estonia, providing a clear context of the sampling area within Finland. The purpose of the map is to illustrate the specific location where the tree-ring samples were collected for radiocarbon analysis.
Δ14C normalized of annual and subannual data from tree rings of Finnish Lapland (LAP) plotted against years (BC). The data has been normalized by setting the mean of 669–666 BC to equal to 0 to remove potential baseline differences. The dashed horizontal and vertical lines are for guiding the eye corresponding to the zero baseline and the year 664 BC, respectively. The horizontal solid line shows the years used for normalization.

Figure 2 Long description
A scatter plot presents normalized 14C values from tree rings in Finnish Lapland plotted against years BC. The data points are categorized into three groups: LAP, LAP EW, and LAP LW, represented by different shades of black and gray. The x-axis represents the years ranging from 685 BC to 645 BC, and the y-axis represents the normalized 14C percentage values ranging from -10 to 20. The data points show variations in 14C levels over time, with some clustering and gaps visible. A dashed horizontal line at 0 on the y-axis and a dashed vertical line at 664 BC on the x-axis serve as reference guides. A solid horizontal line indicates the years used for normalization. The plot reveals fluctuations in 14C levels, with notable peaks and troughs. All values are approximated.
Altogether, 11 out of 16 subannual measurement pairs show larger Δ14CLW compared to Δ14CEW by 0.3–5.1‰ (see Table S2). Such variation could be attributed to a multitude of factors. 14C concentrations in the troposphere are slightly higher during the period when latewood forms (August–September) than during earlywood (April–July), as the exchange between the stratosphere and troposphere is more pronounced during the spring/summer of the Northern Hemisphere (Nydal et al. Reference Nydal1968; Yasuike et al. Reference Yasuike, Yamada and Komura2008). For instance, seasonal variation causes 10-20% fluctuation of the tropospheric bomb peak (Hua et al. Reference Hua, Barbetti and Rakowski2013; Levin et al. Reference Levin, Kromer, Schoch-Fischer, Bruns, Münnich, Berdau, Vogel and Münnich1985) observed after the peak maximum. Fluctuation of similar magnitude would mean a 1.5–3‰ annual tropospheric 14C variation due to the ∼15‰ 660 BC event after the peak maximum. Thus, we suggest this trend of Δ14CLW > Δ14CEW is partly due to seasonal variation coupled to the peak intensity changes. Indeed, before the assumed SPE in 670–666 BC the LW-EW differences seem to be smaller, ranging from 0.3 to 1.7‰. Therefore, we propose that the ∼5‰ rise of Δ14CLW in 665 BC may not only be due to seasonal variation but it could include pure SPE-induced 14C increase, as well. This rise appears to form the leading edge of the increasing 14C signal that subsequently continues for several years.
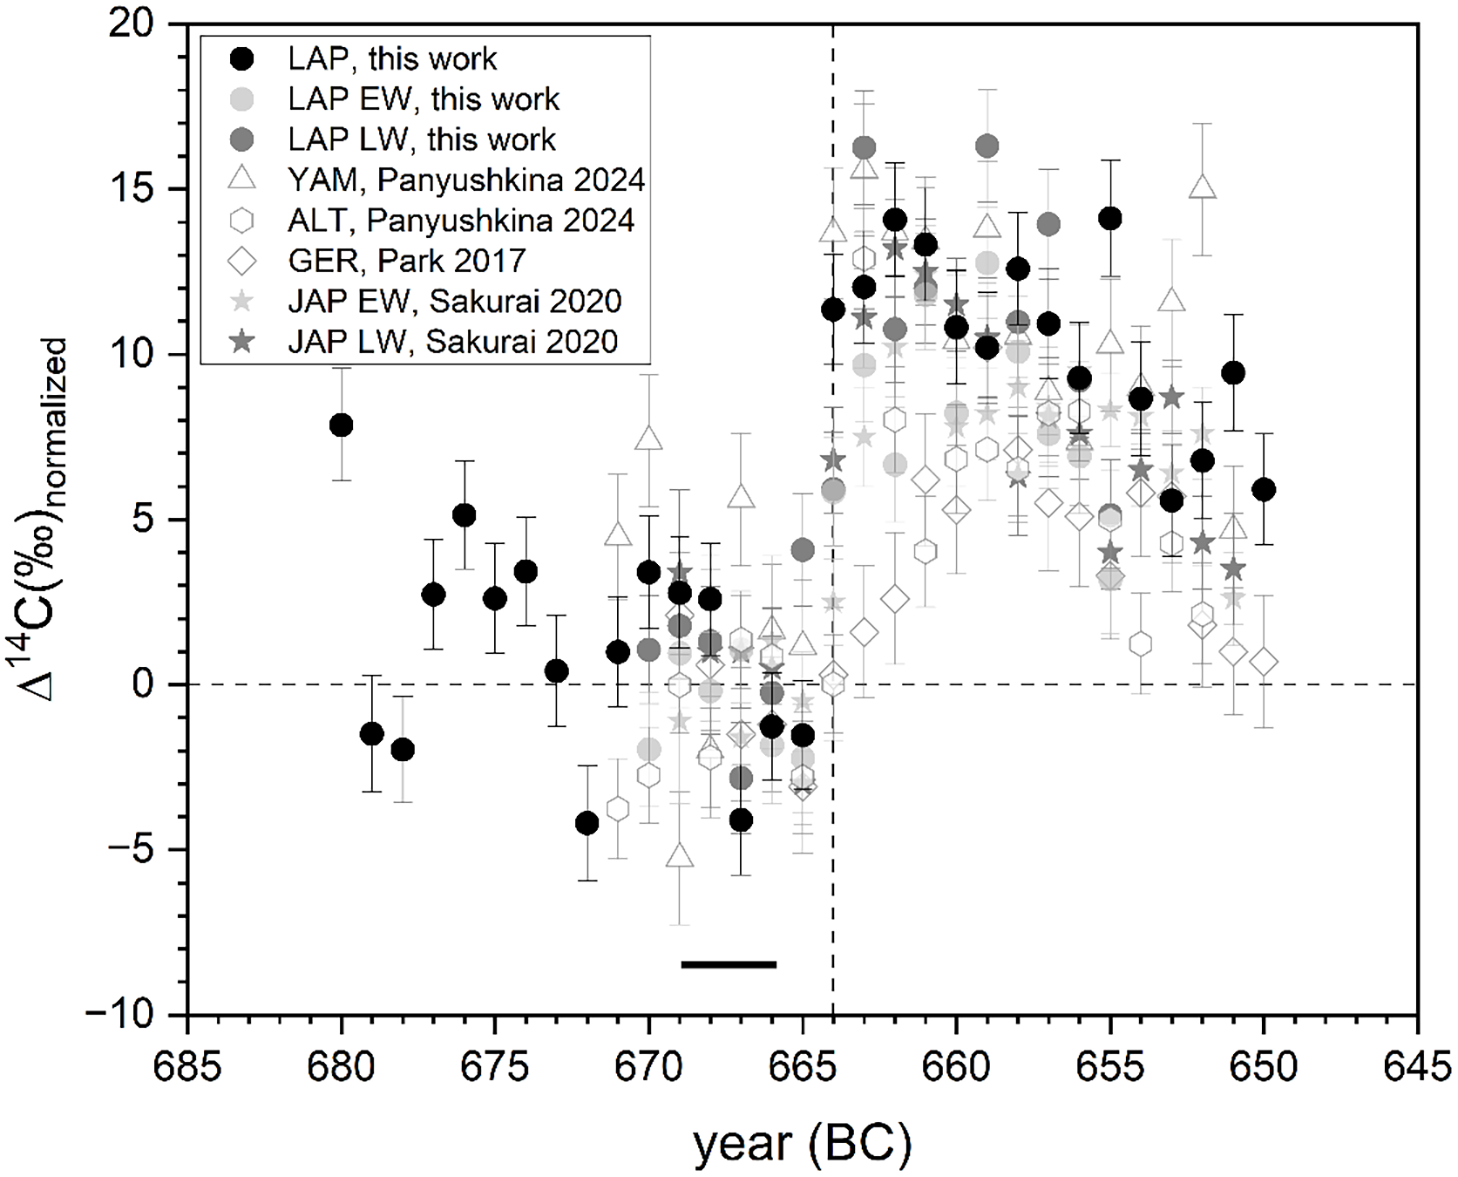
When normalized, high-latitude Δ14C data from Lapland (LAP) and Yamal (YAM; Panyushkina et al. Reference Panyushkina, Jull, Molnár, Varga, Kontul, Hantemirov, Kukarskih, Sljusarenko, Myglan and Livina2024) appear elevated compared to lower-latitude data from Altai (ALT; Panyushkina et al. Reference Panyushkina, Jull, Molnár, Varga, Kontul, Hantemirov, Kukarskih, Sljusarenko, Myglan and Livina2024), Germany (GER; Park et al. Reference Park, Southon, Fahrni, Creasman and Mewaldt2017), and Japan (JAP; Sakurai et al. Reference Sakurai, Tokanai, Miyake, Horiuchi, Masuda, Miyahara, Ohyama, Sakamoto, Mitsutani and Moriya2020), as shown in Figure 3. Furthermore, the 14C rise in the Lapland and Yamal data begins earlier than in the lower-latitude data: in 664 BC, values at LAP and YAM are 11–13‰ above the baseline, whereas values at the lower-latitude sites are only 0–7‰. We also note a difference in the baselines; without normalization, the Δ14C values before the event, particularly for ALT and GER, are clearly above 0‰, while lower values are observed at LAP and YAM. This feature is interesting in itself and leads to larger peak amplitude differences after normalization. Therefore, these data suggest that the high-latitude Δ14C rise seems to be faster and that the amplitude and full magnitude of the signal seem to be larger than at lower latitudes.
Annual and subannual results of LAP compared to datasets of Altai (ALT) and Yamal (YAM) (Panyushkina et al. Reference Panyushkina, Jull, Molnár, Varga, Kontul, Hantemirov, Kukarskih, Sljusarenko, Myglan and Livina2024), Germany (GER) (Park et al. Reference Park, Southon, Fahrni, Creasman and Mewaldt2017) and Japan (JAP) (Sakurai et al. Reference Sakurai, Tokanai, Miyake, Horiuchi, Masuda, Miyahara, Ohyama, Sakamoto, Mitsutani and Moriya2020). The data have been normalized by setting the mean of 669–666 BC to equal to 0 to remove potential baseline difference. The dashed horizontal and vertical lines are for guiding the eye corresponding to zero baseline and the year 664 BC, respectively. The horizontal solid line shows the years used for normalization.

Figure 3 Long description
A scatter plot compares radiocarbon concentrations in tree rings from various regions and years. The x-axis represents the year in B C, ranging from 685 to 645. The y-axis represents the normalized delta 14 C percentage, ranging from negative 10 to 20. The plot includes data points from multiple studies, including LAP, YAM, ALT, GER, and JAP, with different symbols and colors representing each dataset. The data points show variations in radiocarbon concentrations over time, with clusters and patterns indicating significant events. The dashed horizontal and vertical lines serve as guides for the zero baseline and the year 664 B C, respectively. The solid horizontal line indicates the years used for normalization. The plot highlights the differences and similarities in radiocarbon concentrations across different regions and time periods.
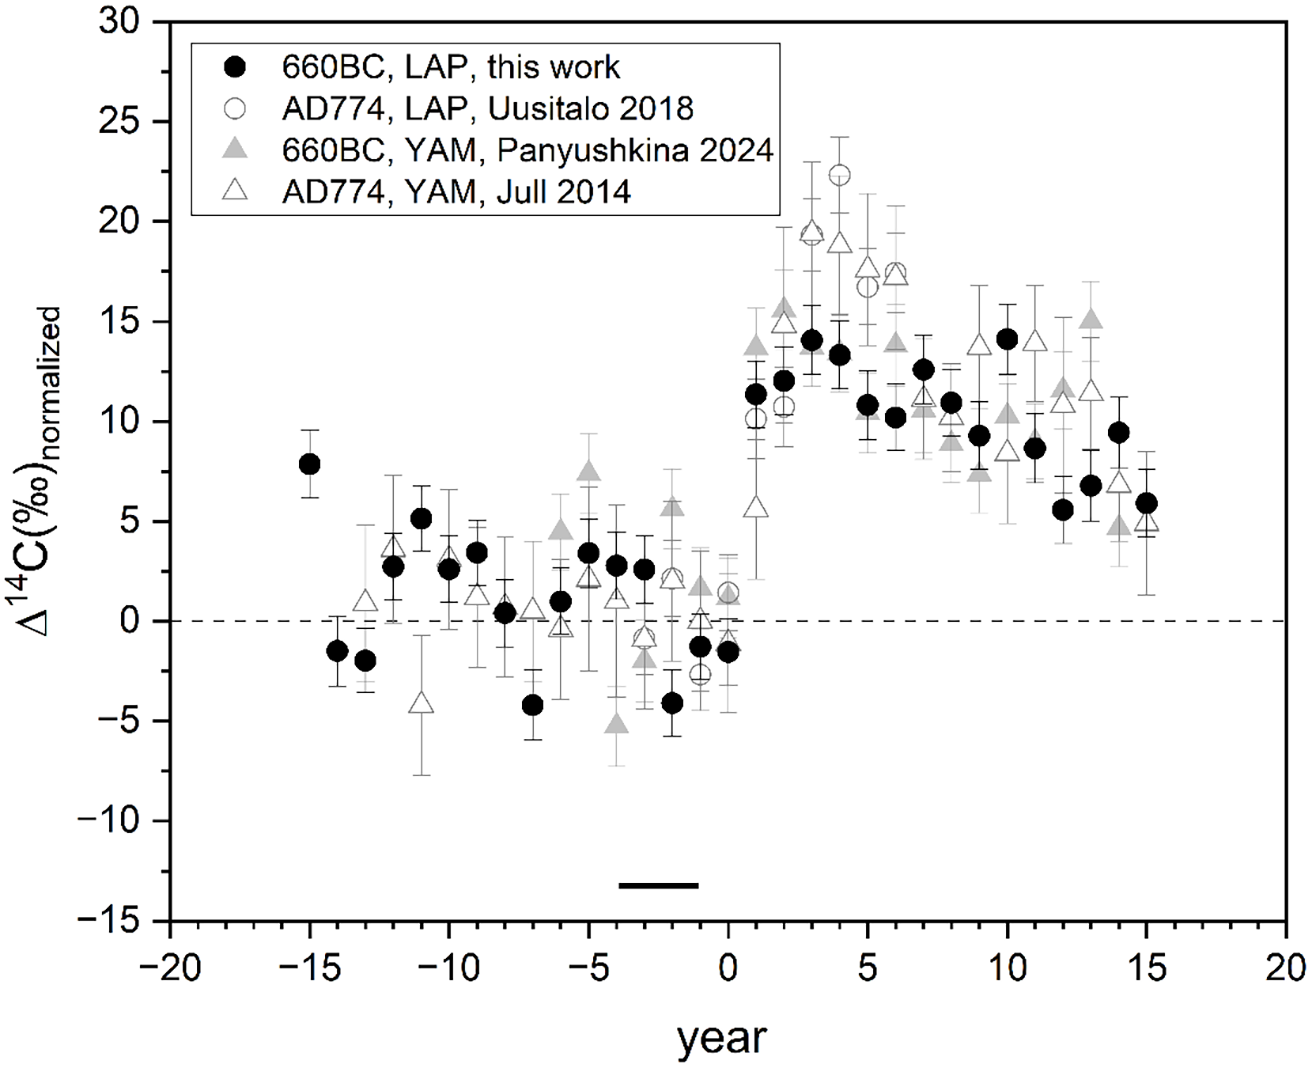
There are two possible explanations for the fast rise of the signal at high latitudes that may contribute in parallel. First, 14C produced in the high-latitude troposphere may directly affect Δ14C in the high-latitude tree rings. 14C is primarily produced in polar areas, with up to 12% possibly generated in the polar troposphere (Golubenko et al. Reference Golubenko, Rozanov, Kovaltsov and Usoskin2022; Hyo Min and Junghun Reference Hyo Min and Junghun2022). Second, fast high-latitude component of the stratosphere-troposphere exchange (Liang et al. Reference Liang, Douglass, Duncan, Stolarski and Witte2009) could support the similar observation, as pointed out recently for the AD 993 event (Miyake et al. Reference Miyake, Hakozaki, Kimura, Tokanai, Nakamura, Takeyama and Moriya2022) and discussed in relation to the transient offset of AD 1860s (Uusitalo et al. Reference Uusitalo, Golubenko, Arppe, Brehm, Hackman, Hayakawa, Helama, Mizohata, Miyake, Mäkinen, Nöjd, Tanskanen, Tokanai, Rozanov, Wacker, Usoskin and Oinonen2024). Such early increases have also been observed at high latitudes for the AD 774/775 event in Lapland (Uusitalo et al. Reference Uusitalo, Arppe, Hackman, Helama, Kovaltsov, Mielikäinen, Mäkinen, Nöjd, Palonen, Usoskin and Oinonen2018) and in Yamal (Jull et al. Reference Jull, Panyushkina, Lange, Kukarskih, Myglan, Clark, Salzer, Burr and Leavitt2014). Indeed, the rise of the annual 14C signal in 664 BC and in AD 774 is fast in both sites of LAP and YAM (Figure 4).
Comparison between Δ14C data of AD 774 (YAM: Jull et al. Reference Jull, Panyushkina, Lange, Kukarskih, Myglan, Clark, Salzer, Burr and Leavitt2014, LAP: Uusitalo et al. Reference Uusitalo, Arppe, Hackman, Helama, Kovaltsov, Mielikäinen, Mäkinen, Nöjd, Palonen, Usoskin and Oinonen2018) and ∼660 BC (YAM: Panyushkina et al. Reference Panyushkina, Jull, Molnár, Varga, Kontul, Hantemirov, Kukarskih, Sljusarenko, Myglan and Livina2024, LAP: this work) events at high latitudes. The data has been normalized by setting the mean of 669–666 BC to equal to 0 to remove potential baseline difference. The point of origin is placed at 665 BC and AD 773 for ∼660 BC and AD 774 events, respectively. The horizontal solid line shows the years used for normalization.

Figure 4 Long description
The line graph compares normalized delta 14C percentage values over time for events in 660 BC and AD 774 at high latitudes. The x-axis represents the year, ranging from negative 20 to positive 20, with the point of origin placed at 665 BC and AD 773 for the 660 BC and AD 774 events, respectively. The y-axis represents the normalized delta 14C percentage values, ranging from negative 15 to positive 30. The graph includes four data series: 660 BC, LAP, this work; AD 774, LAP, Uusitalo 2018; 660 BC, YAM, Panyushkina 2024; and AD 774, YAM, Jull 2014. Each data series is represented by different symbols: filled circles, open circles, filled triangles, and open triangles, respectively. The horizontal solid line indicates the years used for normalization. All values are approximated.
Taken together, the accumulating observational data suggests that for Miyake events, the increase in 14C begins earlier at high latitudes than at lower latitudes. These observations indicate fast partial transfer of polar 14C into the troposphere at high latitudes by direct tropospheric production or fast transfer across the tropopause, making it available for photosynthetic fixation by trees. In addition, full peak intensities and dilution of the 14C signal at lower latitudes are obtained when the mainly stratospheric air masses eventually reach the lower latitude troposphere with vast atmospheric volume. These components together would contribute to the observed full peak shape.
Previously, prolonged rise time of the ∼660 BC event has been attributed to two consecutive SPEs (Panyushkina et al. Reference Panyushkina, Jull, Molnár, Varga, Kontul, Hantemirov, Kukarskih, Sljusarenko, Myglan and Livina2024; Park et al. Reference Park, Southon, Fahrni, Creasman and Mewaldt2017; Sakurai et al. Reference Sakurai, Tokanai, Miyake, Horiuchi, Masuda, Miyahara, Ohyama, Sakamoto, Mitsutani and Moriya2020). Qualitatively, however, the peak shapes of the ∼660 BC and AD 774 events (Figure 4; Supplementary Figure S1 for EW-LW comparison) appear similar, with the AD 774 event displaying higher amplitude and magnitude. This challenges the idea of multiple SPEs as a cause of the ∼660 BC event’s peak shape. Moreover, no such double peaks have been proposed to explain the AD 774 event. Nevertheless, carbon cycle box model analyses were performed to see whether there would be any shape differences due to the assumption of two peaks. We hypothesized that SPEs are the cause of Δ14C peaks and conducted a detailed analysis of the SPEs producing the peak using an 11-box global carbon cycle model (Güttler et al. Reference Güttler, Adolphi and Beer2015).
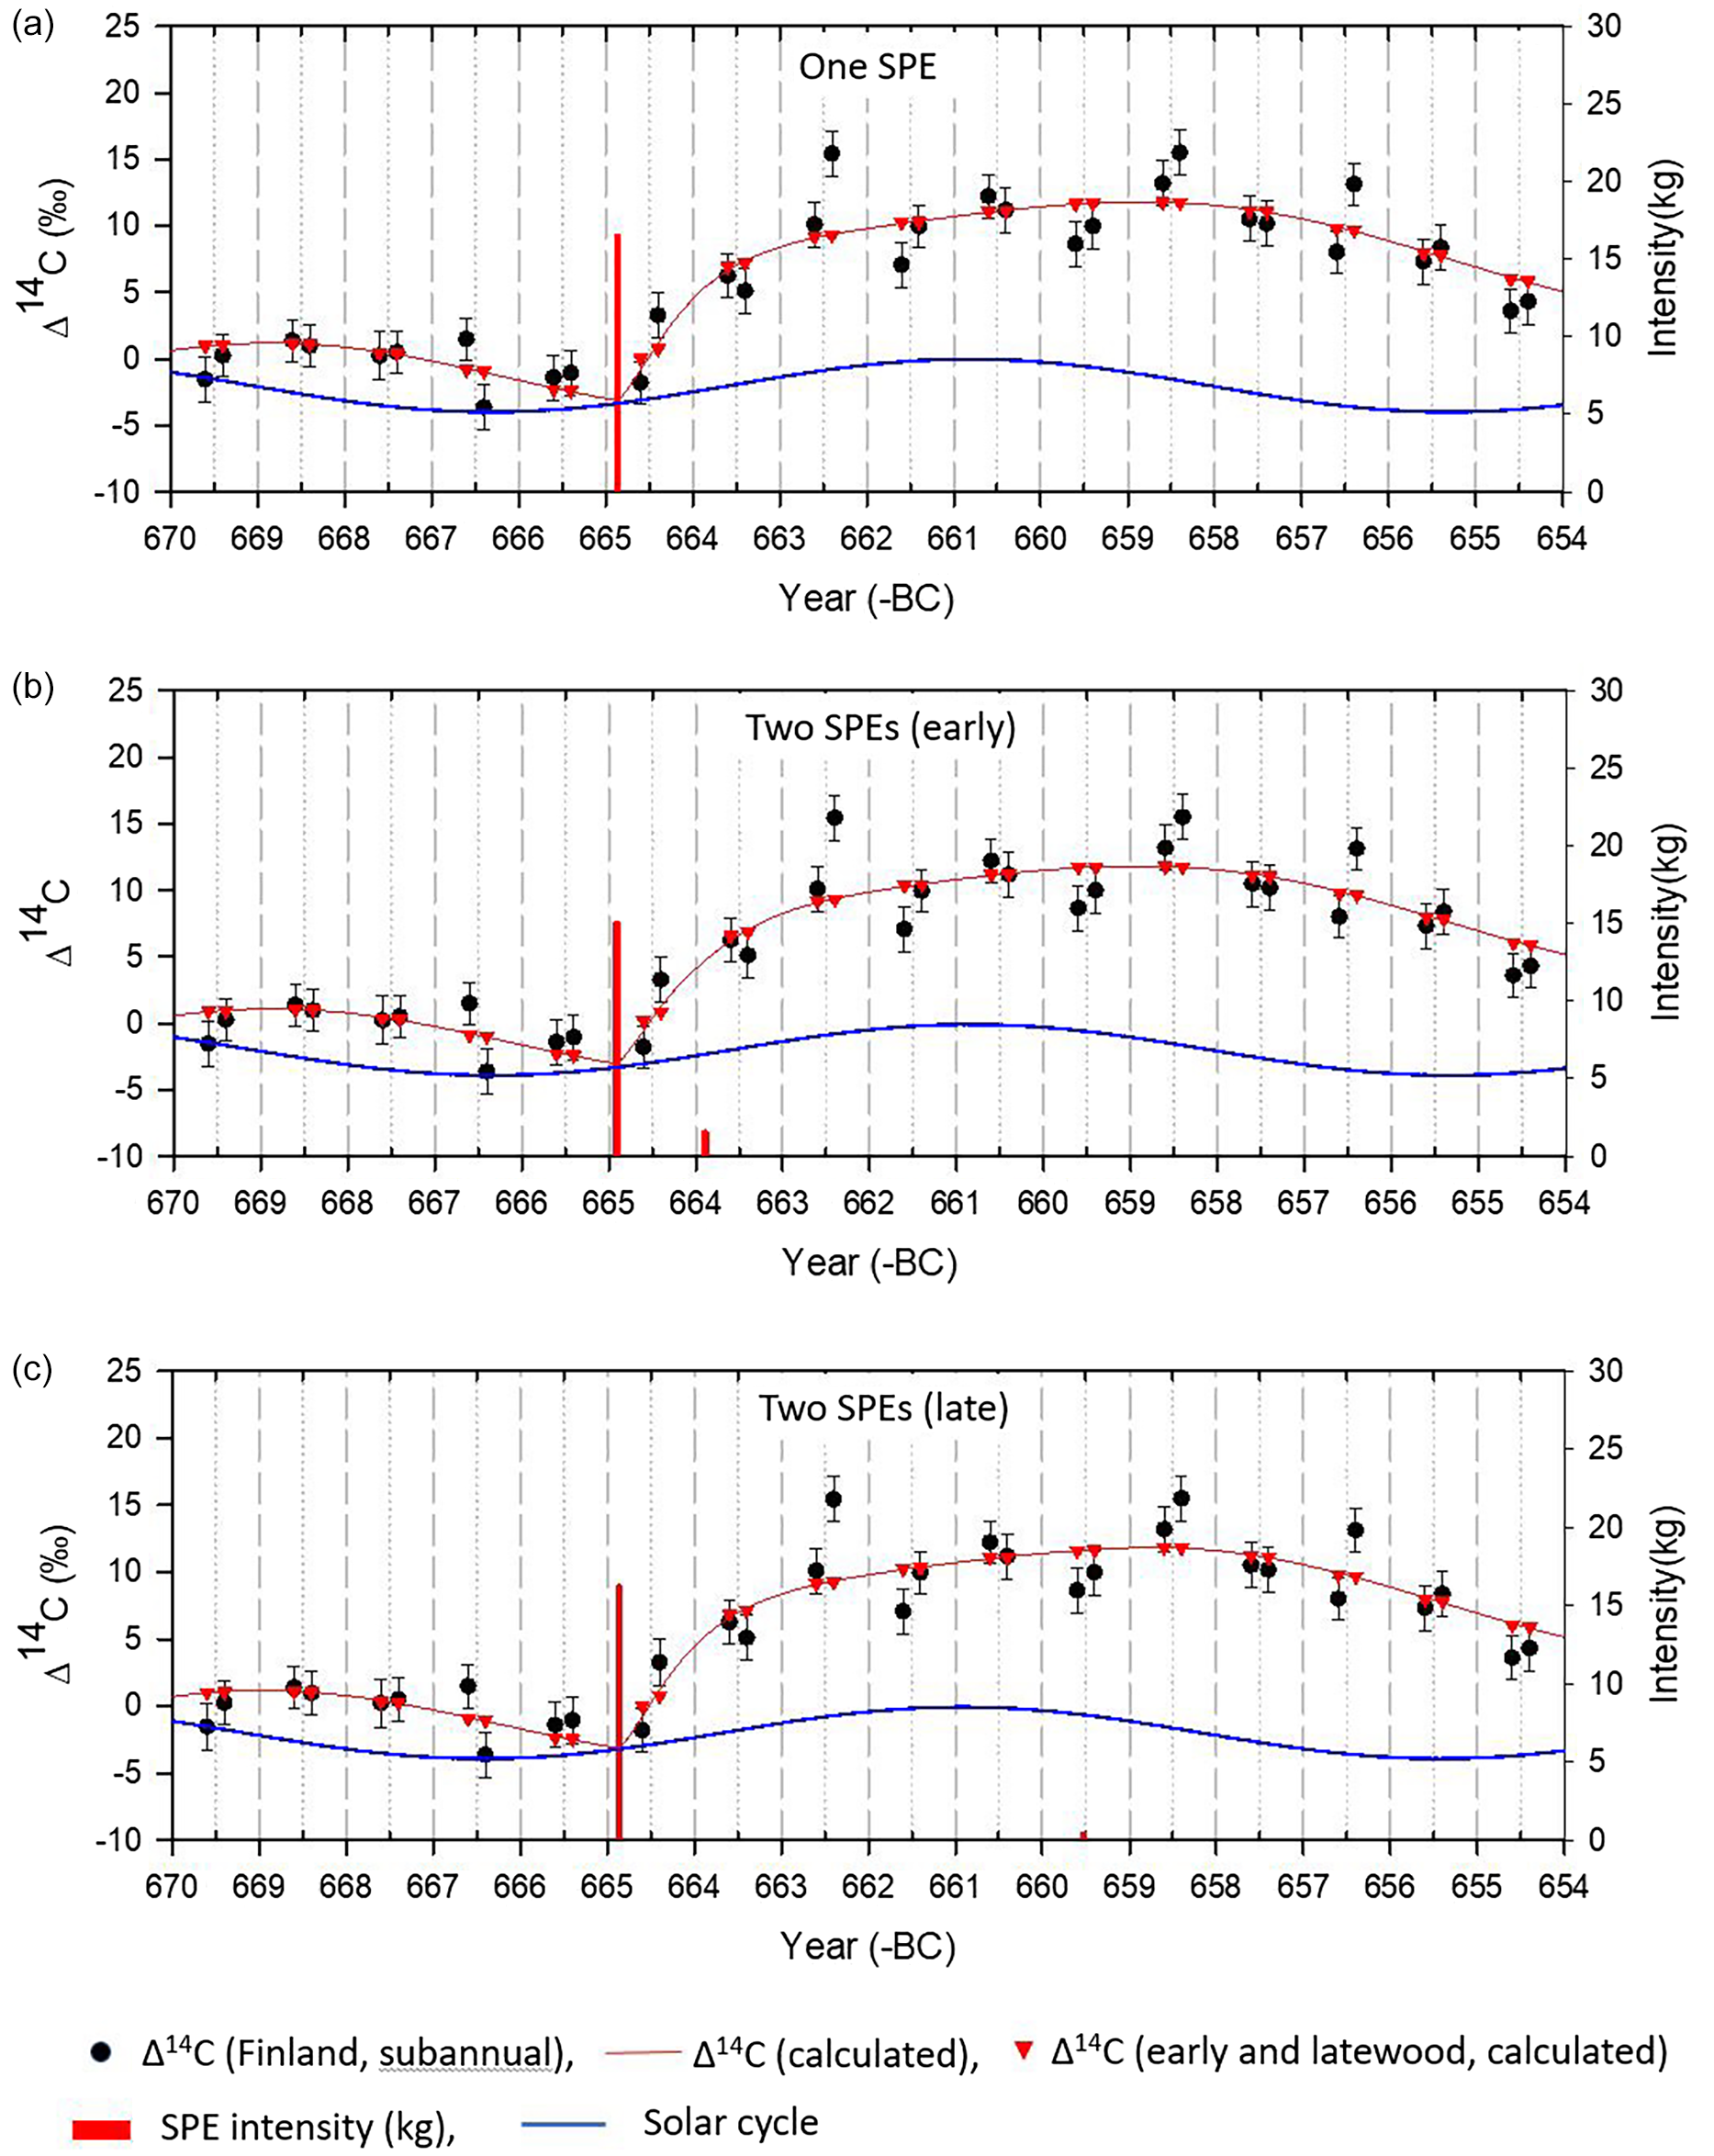
The simulation results for 1 or 2 SPEs are shown in the graphs of Figure 5 and Table S1. In all scenarios, the timing of the first SPE is assumed to be in February of 665 BC, thus earlier compared to previous analyses (Sakurai et al. Reference Sakurai, Tokanai, Miyake, Horiuchi, Masuda, Miyahara, Ohyama, Sakamoto, Mitsutani and Moriya2020). We assume that the duration of all SPEs is one or two days, although the scan range of the duration of SPEs is allowed to be up to 365 days. An SPE’s duration of one or two days is reasonable, as SPE durations are typically a few days in present times (Mewaldt et al. Reference Mewaldt, Cohen, Labrador, Leske, Mason, Desai, Looper, Mazur, Selesnick and Haggerty2005). Particularly, we point out that assuming longer SPE durations may not be consistent with the actual observations. Overall, the model calculations reproduce the observed peak shape extremely well.
The simulation result with one and multiple SPEs. Note that the intensity (14C produced in the atmosphere) of SPE in 660 BC of (c) is very small in the model calculation.

Figure 5 Long description
The line graph presents the simulation results of one and multiple solar proton events (SPEs) and their impact on atmospheric carbon-14 levels over time. The x-axis represents the years from 670 to 654 BC, while the y-axis on the left shows the delta carbon-14 percentage, and the y-axis on the right indicates the intensity of SPEs in kilograms. The graph includes three subplots: (a) One SPE, (b) Two SPEs (early), and (c) Two SPEs (late). Each subplot features data points for delta carbon-14 from Finland, subannual data, calculated delta carbon-14, early and latewood calculated delta carbon-14, SPE intensity, and the solar cycle. The data points are represented by black circles, red triangles, a red line for SPE intensity, and a blue line for the solar cycle. The simulation results show variations in atmospheric carbon-14 levels corresponding to different SPE scenarios. All values are approximated.
The small troposphere ratio (12%) assumed is essential to understand the 14C peak shape of the ∼660 BC event and the appearance of a fast Δ14C signal only at high latitudes. Since most (88%) 14C is produced in the stratosphere, the full mixing between stratosphere and troposphere takes longer. In other words, if the energy spectrum of the SPE660BC was softer than that of SPEAD774, the ∼660 BC peak may appear slightly delayed in comparison. Interestingly, the same mechanism could also help to explain the transient 14C offset observed between high- and mid-latitude trees around the Carrington event (Uusitalo et al. Reference Uusitalo, Golubenko, Arppe, Brehm, Hackman, Hayakawa, Helama, Mizohata, Miyake, Mäkinen, Nöjd, Tanskanen, Tokanai, Rozanov, Wacker, Usoskin and Oinonen2024). For a less energetic event with a soft energy spectrum, 14C production would occur almost exclusively in the high-latitude and -altitude stratosphere. This could significantly prolong the stratosphere-troposphere transport and mixing time, leaving a distinct signal only in the polar regions closest to the production, with its subsequent dilution into larger atmospheric volumes generating the offset observed between records. Unfortunately, a rigorous statistical validation of this hypothesis is not yet possible due to the lack of sufficient data.
χ2 values of all the three scenarios are almost identical (Table S3). Thus, the used carbon cycle box model is not sufficiently sensitive to clarify the number of SPEs behind the peak shape. This is in accord with our qualitative observation of the peak shape of ∼660 BC event: it is actually challenging to observe statistically meaningful differences between the high latitude data of ∼660 BC and AD 774 (Figure 4). On one hand, this suggests that more data on individual sites should be collected to obtain better statistical evidence on the peak shapes of Miyake events, similarly as performed for the AD 1860s by Uusitalo et al. (Reference Uusitalo, Golubenko, Arppe, Brehm, Hackman, Hayakawa, Helama, Mizohata, Miyake, Mäkinen, Nöjd, Tanskanen, Tokanai, Rozanov, Wacker, Usoskin and Oinonen2024). On the other hand, assuming a variable number of production pulses in carbon cycle box models may not be a fruitful approach for understanding the peak shapes, particularly at different latitudes. Latitude-dependent rise times and peak magnitudes do not necessarily indicate a number of production pulses, but tell more about the dynamics in the CO2 transfer from the production areas of 14C into the vast air masses in the troposphere and lower latitudes. Therefore, we urge for development of dynamic carbon cycle models to account for the potentially rapid polar transfer of stratospheric CO2 into the troposphere to be photosynthetically fixed. Such model could incorporate large-scale and slower stratosphere-troposphere exchange needed to characterize the dilution of 14C signal among larger volumes of air in subpolar troposphere.
Conclusions
The amplitude of the Δ14C peak at ∼660 BC observed in high-latitude trees from Finnish Lapland is about 15‰ and reaches its maximum around 662–661 BC. Subannual data show that Δ14C starts to increase in the latewood of 665 BC, which is earlier than at lower latitudes. After the baseline adjustment, the annual 664 BC Δ14C data show a more pronounced increase at high-latitude sites than at lower latitudes, mirroring what was observed for the AD 774 and AD 993 events and suggesting an involvement of a fast component for the polar stratosphere-troposphere exchange. Model simulations indicate that either one or two SPEs could account for the ∼660 BC peak, but they do not definitively distinguish between these scenarios. Overall, we note that for high latitudes, the shape of the peak appears very similar to that of the AD 774 event, challenging the need to invoke multiple SPEs or more exotic explanations and instead suggesting the combined influence of the event’s initial 14C production characteristics and subsequent atmospheric transport dynamics. Finally, although the commonly used carbon cycle box models are useful for understanding and quantifying the general peak behavior, they appear inadequate to explain regional differences, highlighting the need for more dynamic models.
Supplementary material
To view supplementary material for this article, please visit https://doi.org/10.1017/RDC.2026.10195
Acknowledgments
This research was supported by the Basic Research Project of the Korea Institute of Geoscience and Mineral Resources (KIGAM), funded by the Ministry of Science and ICT (GP2020-019). The work of Laboratory of Chronology and Natural Resources Institute Finland has been supported by the Research Council of Finland projects QUANOMAL and WELT (288083, 288267, 355266, 355268). LLM-based AI tools were used for writing assistance and grammar checking when preparing this manuscript.
Competing interests
The authors declare no conflicts of interest.


 Open access