





Introduction
Adverse childhood experiences (ACEs) are a major public health concern because they are common, socially patterned, and strongly associated with poorer mental and physical health across the life course (Hughes et al., Reference Hughes, Bellis, Hardcastle, Sethi, Butchart, Mikton, Jones and Dunne2017; Madigan et al., Reference Madigan, Deneault, Racine, Park, Thiemann, Zhu, Dimitropoulos, Williamson, Fearon, Cénat, McDonald, Devereux and Neville2023). In the United States, racially and ethnically minoritized children bear a disproportionate burden of adversity exposure, reflecting broader structural inequities that shape family resources, neighborhood conditions, and exposure to chronic stressors (Kauh, Read, & Scheitler, Reference Kauh, Read and Scheitler2021; Phelan & Link, Reference Phelan and Link2015; Sternthal, Slopen, & Williams, Reference Sternthal, Slopen and Williams2011; Zhang & Monnat, Reference Zhang and Monnat2022). These disparities have critical implications for health. Indeed, ACEs show a strong dose–response relationship with a wide range of adverse health outcomes and contribute significantly to later disease burden (Bellis et al., Reference Bellis, Hughes, Ford, Ramos Rodriguez, Sethi and Passmore2019), suggesting that unequal exposure to adversity may translate into unequal biological risk. A growing body of evidence suggests that one pathway through which early adversity becomes embedded is epigenetic age acceleration (EAA) (Raffington & Belsky, Reference Raffington and Belsky2022; Slavich & Cole, Reference Slavich and Cole2013). Despite this progress, reliance on cumulative ACE scores has limitations. Although summing adversities has been useful for documenting dose–response associations, for example, it treats qualitatively different stressors as interchangeable, obscuring heterogeneity in adversity type and configuration and potentially leading to misclassifications of which youth are at greatest biological risk (Felitti et al., Reference Felitti, Anda, Nordenberg, Williamson, Spitz, Edwards, Koss and Marks1998; Meehan et al., Reference Meehan, Baldwin, Lewis, MacLeod and Danese2022).
A more informative approach is to examine how adversities cluster in lived experience. Expanding the ACE framework to include social-contextual adversities such as poverty and neighborhood disadvantage is especially important because these exposures disproportionately affect marginalized children and are independently associated with adverse health outcomes (Cronholm et al., Reference Cronholm, Forke, Wade, Bair-Merritt, Davis, Harkins-Schwarz, Pachter and Fein2015; Zhang & Monnat, Reference Zhang and Monnat2022). In addition, ACEs rarely occur in isolation. Rather, they often co-occur and may act synergistically, meaning that person-centered approaches such as latent class analysis (LCA) are better suited than cumulative counts for characterizing adversity (Alley, Gassen, & Slavich, Reference Alley, Gassen and Slavich2025; Briggs, Amaya-Jackson, Putnam, & Putnam, Reference Briggs, Amaya-Jackson, Putnam and Putnam2021; Zhang, Merrin, & Slavich, Reference Zhang, Merrin and Slavich2024; Zhang & Monnat, Reference Zhang and Monnat2022). LCA is useful in this regard because it classifies individuals into unobserved subgroups based on shared patterns of responses across multiple observed variables (Collins & Lanza, Reference Collins and S. T2009), making it well-suited to examining how adversity configurations cluster within populations and how these configurations relate to health outcomes.
One pathway through which early adversity may become biologically embedded is DNA methylation (DNAm), an epigenetic process involved in regulating gene activity across development (Martin et al., Reference Martin, Ghastine, Lodge, Dhingra and Ward-Caviness2022; Slavich & Cole, Reference Slavich and Cole2013; Slavich, Mengelkoch, & Cole, Reference Slavich, Mengelkoch and Cole2023). DNAm-based epigenetic clocks are molecular indicators of biological aging, but they do not all capture the same process. First-generation clocks were trained primarily on chronological age, whereas newer measures such as PhenoAge, GrimAge, and DunedinPACE are more closely tied to physiological dysregulation, morbidity and mortality risk, or pace of aging and appear more sensitive to social adversity (Belsky et al., Reference Belsky, Caspi, Corcoran, Sugden, Poulton, Arseneault, Baccarelli, Chamarti, Gao, Hannon, Harrington, Houts, Kothari, Kwon, Mill, Schwartz, Vokonas, Wang, Williams and Moffitt2022; Levine et al., Reference Levine, Lu, Quach, Chen, Assimes, Bandinelli, Hou, Baccarelli, Stewart, Li, Whitsel, Wilson, Reiner, Aviv, Lohman, Liu, Ferrucci and Horvath2018; Lu et al., Reference Lu, Binder, Zhang, Yan, Reiner, Cox, Corley, Harris, Kuo, Moore, Bandinelli, Stewart, Wang, Hamlat, Epel, Schwartz, Whitsel, Correa, Ferrucci and Horvath2022; Raffington & Belsky, Reference Raffington and Belsky2022). In pediatric samples, these measures may detect early physiological divergence before overt disease emerges, making late childhood and adolescence important periods for studying the biological embedding of adversity (Raffington & Belsky, Reference Raffington and Belsky2022; Shonkoff et al., Reference Shonkoff, Boyce, Bush, Gunnar, Hensch, Levitt, Meaney, Nelson, Slopen, Williams and Silveira2022).
Although emerging research links ACEs to EAA in children and adolescents (Colich, Rosen, Williams, & McLaughlin, Reference Colich, Rosen, Williams and McLaughlin2020), prior studies have several limitations. First, prior pediatric research has often relied on first-generation clocks whose sensitivity to social adversity is limited (Marini et al., Reference Marini, Davis, Soare, Zhu, Suderman, Simpkin, Smith, Wolf, Relton and Dunn2020). Second, prior work has largely focused on narrowly defined, singular types of ACEs rather than empirically derived, co-occurring adversity patterns (Chang et al., Reference Chang, Meier, Maguire-Jack, Davis-Kean and Mitchell2024). As a result, little is known about how real-world configurations of adversity relate to biological aging in children and adolescents – a critical gap in understanding early biological embedding. Third, prior research reveals significant racial/ethnic and sex-based variation in both ACE patterns and biological aging trajectories, yet most studies have not examined these dimensions jointly (Alley et al., Reference Alley, Gassen and Slavich2025; Briggs et al., Reference Briggs, Amaya-Jackson, Putnam and Putnam2021; Del Toro et al., Reference Del Toro, Freilich, Rea-Sandin, Markon, Wilson and Krueger2023; Zhang et al., Reference Zhang, Merrin and Slavich2024; Zhang & Monnat, Reference Zhang and Monnat2022). For instance, Zhang and Monnat (Reference Zhang and Monnat2022) found that the majority of Black and Hispanic adolescents in the Future of Families and Child Wellbeing Study (FFCWS) were classified into high-socioeconomic adversity classes, whereas most White adolescents fell into a comparatively low-adversity class – suggesting that adversity configurations are socially patterned and racially/ethnically differentiated. Sex and racial differences in biological aging are also evident. Girls tend to exhibit accelerated biological development compared to boys (Belsky, Reference Belsky2019; Ellis, Reference Ellis2004; McCrory et al., Reference McCrory, Fiorito, McLoughlin, Polidoro, Cheallaigh, Bourke, Karisola, Alenius, Vineis, Layte and Kenny2019), and racially minoritized children and adolescents show more accelerated biological aging than their White counterparts (Del Toro et al., Reference Del Toro, Freilich, Rea-Sandin, Markon, Wilson and Krueger2023). Moreover, threat-related adversity has been related to accelerated aging, whereas deprivation-related domains show mixed findings, suggesting that ACE–EAA associations may also depend on adversity type and configuration (Colich et al., Reference Colich, Rosen, Williams and McLaughlin2020; Sumner et al., Reference Sumner, Colich, Uddin, Armstrong and McLaughlin2019). Taken together, these patterns underscore the need for person-centered, sociodemographically stratified approaches.
To address these gaps, we examined prospectively measured ACEs from ages 3 to 9 and their associations with DNAm-based biological aging at ages 9 and 15, as well as change from age 9 to 15 using residualized change scores, in a large, racially diverse urban birth cohort. Ages 9 and 15 were selected because they capture two developmentally distinct windows – late childhood prior to peak pubertal onset and mid-adolescence during active hormonal reorganization – enabling us to examine whether adversity-related biological embedding emerges early, consolidates, or shifts across a period of substantial neuroendocrine change (Essex et al., Reference Essex, Shirtcliff, Burk, Ruttle, Klein, Slattery, Kalin and Armstrong2011; Roberts & Lopez-Duran, Reference Roberts and Lopez-Duran2019). We used LCA to identify patterns of co-occurring adversity and adopted an intersecting race–sex analytic approach to account for heterogeneity in both adversity exposure and biological aging. Guided by prior work, we hypothesized that (a) distinct ACE classes would emerge within intersecting race–sex groups; (b) youth in more adverse classes would tend to show accelerated biological aging; and (c) these associations would vary across race/ethnicity, sex, developmental timing, and epigenetic clock, with female participants showing greater biological sensitivity to adversity than males. By integrating expanded ACE measurement, person-centered modeling, and multi-clock assessment of biological aging, this study examines whether intersections of adversity patterning, race/ethnicity, sex, and developmental timing improve identification of early biological risk.
Method
Study design and participants
Data were drawn from the Future of Families and Child Wellbeing Study (FFCWS), a population-based birth cohort study that oversampled low-income and single-parent families. The FFCWS followed 4,898 children born to parents in large United States (U.S.) cities between 1998 and 2000. The sample and design have been described in detail elsewhere (Reichman, Teitler, Garfinkel, & McLanahan, Reference Reichman, Teitler, Garfinkel and McLanahan2001). The current analytic sample included 1,655 participants who met the following criteria: (a) their mother or primary caregiver (hereafter mother) provided data on ACEs at least once during the 3-, 5-, and 9-year follow-up waves; (b) epigenetic clock data were available at ages 9 and 15; and (c) participants identified as Non-Hispanic Black (hereafter Black), Hispanic, or Non-Hispanic White (hereafter White), as participants from other racial/ethnic groups were excluded because sample sizes were too small for stratified analyses. Missing data on covariates were handled using multiple imputation. Sample characteristics are presented in Table 1. Because FFCWS data are deidentified and publicly available, our institutional review board determined that analysis of these data was non-human subjects research not requiring institutional review board approval.
Characteristics of the sample stratified by sex and race/ethnicity

Table 1. Long description
The table consists of seven columns: Characteristic, NH Black females (n = 428), NH Black males (n = 401), Hispanic females (n = 234), Hispanic males (n = 250), NH White females (n = 172), NH White males (n = 170), and p-value. For Age (Wave 5), means and standard deviations are: NH Black females 9.41 (0.45), NH Black males 9.37 (0.38), Hispanic females 9.53 (0.42), Hispanic males 9.49 (0.37), NH White females 9.37 (0.32), NH White males 9.36 (0.44), p-value less than .001. For Age (Wave 6): NH Black females 15.58 (0.64), NH Black males 15.62 (0.63), Hispanic females 15.57 (0.69), Hispanic males 15.53 (0.68), NH White females 15.42 (0.55), NH White males 15.41 (0.55), p-value less than .001. Maternal smoking during pregnancy is divided into No, Yes, and Missing. For ‘No’: NH Black females 341 (79.7 percent), NH Black males 324 (80.8 percent), Hispanic females 209 (89.3 percent), Hispanic males 220 (88.0 percent), NH White females 120 (69.8 percent), NH White males 124 (72.9 percent), p-value less than .001. For ‘Yes’: NH Black females 86 (20.1 percent), NH Black males 77 (19.2 percent), Hispanic females 25 (10.7 percent), Hispanic males 29 (11.6 percent), NH White females 51 (29.7 percent), NH White males 46 (27.1 percent). For ‘Missing’: NH Black females 1 (0.2 percent), NH Black males 0 (0.0 percent), Hispanic females 0 (0.0 percent), Hispanic males 1 (0.4 percent), NH White females 1 (0.6 percent), NH White males 0 (0.0 percent). Maternal age at birth: NH Black females 24.49 (5.51), NH Black males 24.61 (5.68), Hispanic females 25.21 (5.71), Hispanic males 24.56 (5.84), NH White females 27.30 (6.57), NH White males 27.80 (6.54), p-value less than .001. DNA processing technique is split into 450K and EPIC. For 450K: NH Black females 210 (49.1 percent), NH Black males 194 (48.4 percent), Hispanic females 79 (33.8 percent), Hispanic males 92 (36.8 percent), NH White females 69 (40.1 percent), NH White males 61 (35.9 percent), p-value less than .001. For EPIC: NH Black females 218 (50.9 percent), NH Black males 207 (51.6 percent), Hispanic females 155 (66.2 percent), Hispanic males 158 (63.2 percent), NH White females 103 (59.9 percent), NH White males 109 (64.1 percent). Proportion immune cells (Wave 5): NH Black females 0.96 (0.10), NH Black males 0.96 (0.11), Hispanic females 0.98 (0.07), Hispanic males 0.97 (0.09), NH White females 0.98 (0.07), NH White males 0.96 (0.11), p-value .019. Proportion immune cells (Wave 6): NH Black females 0.93 (0.14), NH Black males 0.92 (0.16), Hispanic females 0.95 (0.11), Hispanic males 0.95 (0.11), NH White females 0.96 (0.09), NH White males 0.96 (0.10), p-value less than .001. Low birth weight is divided into No, Yes, and Missing. For ‘No’: NH Black females 365 (85.3 percent), NH Black males 346 (86.3 percent), Hispanic females 215 (91.9 percent), Hispanic males 227 (90.8 percent), NH White females 150 (87.2 percent), NH White males 154 (90.6 percent), p-value .083. For ‘Yes’: NH Black females 51 (11.9 percent), NH Black males 40 (10.0 percent), Hispanic females 15 (6.4 percent), Hispanic males 17 (6.8 percent), NH White females 19 (11.0 percent), NH White males 12 (7.1 percent). For ‘Missing’: NH Black females 12 (2.8 percent), NH Black males 15 (3.7 percent), Hispanic females 4 (1.7 percent), Hispanic males 6 (2.4 percent), NH White females 3 (1.7 percent), NH White males 4 (2.4 percent). Pubertal development (1 to 5): NH Black females 2.92 (0.83), NH Black males 2.97 (0.75), Hispanic females 2.91 (0.74), Hispanic males 2.98 (0.65), NH White females 2.92 (0.66), NH White males 3.04 (0.50), p-value .439. Table notes clarify that p-values for continuous outcomes are from one-way analysis of variance, and for categorical outcomes from Pearson’s chi-squared test. M is mean, S D is standard deviation, 450K refers to Methylation 450K arrays, EPIC to Illumina Infinium Methylation EPIC.
Note: p-values for continuous outcomes reflect results of omnibus test of one-way analysis of variance across race/ethnicity and sex sub-groups. p-values for categorical outcomes reflect results of Pearson’s Χ 2 test. NH = Non-Hispanic; SD = standard deviation; 450K = Illumina Infinium Human Methylation450K arrays; EPIC = Illumina Infinium MethylationEPIC.
Measures: adverse childhood experience indicators
We included 12 ACE indicators spanning conventional and expanded domains (Cronholm et al., Reference Cronholm, Forke, Wade, Bair-Merritt, Davis, Harkins-Schwarz, Pachter and Fein2015; Hughes et al., Reference Hughes, Bellis, Hardcastle, Sethi, Butchart, Mikton, Jones and Dunne2017; Zhang et al., Reference Zhang, Merrin and Slavich2024; Zhang & Monnat, Reference Zhang and Monnat2022), primarily reported by mothers/fathers/primary caregivers, unless otherwise noted, when the focal child was 3, 5, and 9 years old on average. ACE indicator wording and coding thresholds are available in the Supplemental Methods. Each ACE was coded dichotomously to indicate exposure to a specific ACE by age 9 if respondents reported experiencing that ACE in at least one of the three data collection waves. Consistent with prior ACE studies using FFCWS, ACE indicators were coded as missing if the mother reported living with the child for less than half of the previous year to avoid potential bias (Zhang et al., Reference Zhang, Merrin and Slavich2024; Zhang et al., Reference Zhang, Liu, Wang and Vasilenko2023).
Outcomes
We assessed biological aging using three epigenetic clocks derived from DNA methylation data: GrimAge, PhenoAge, and DunedinPACE. These second-generation clocks (GrimAge and PhenoAge) and third-generation clock (DunedinPACE) have been shown to predict morbidity and mortality better than earlier first-generation clocks and to be sensitive to social disadvantage.
Saliva samples were collected from focal children during in-home visits at the 9-year and 15-year follow-up waves (Bendheim-Thoman Center for Research on Child Wellbeing [CRCW] and the Department of Molecular Biology, Princeton University and the Population, Neurodevelopment and Genetics Program, University of Michigan, 2023). DNA methylation was analyzed using Illumina Infinium MethylationEPIC (EPIC) and Illumina Infinium Human Methylation450K (450K) arrays, which were used to generate the three epigenetic clocks. Both the age 9 and 15 clocks were processed simultaneously to minimize batch effects and improve technical reliability, key concerns for longitudinal measures (Raffington & Belsky, Reference Raffington and Belsky2022).
For GrimAge and PhenoAge, designed to estimate biological age, we calculated the residuals by regressing the clock age on chronological age. Positive residuals indicate accelerated biological aging or EAA, whereas negative values suggest slower aging. Since DunedinPACE directly measures the pace of aging, no further transformations were needed. Complete details on data collection and processing can be found elsewhere (CRCW and the Department of Molecular Biology, Princeton University and the Population, Neurodevelopment and Genetics Program, University of Michigan, 2023).
Covariates
We included several a priori covariates. Child chronological age at saliva sample collection was included in all models. Child sex (male vs. female), as reported by the mother at baseline, was used as a stratification variable rather than included as a covariate. Models were additionally adjusted for maternal age at birth, maternal smoking during pregnancy (never vs. any smoking), low birth weight (yes vs. no), DNAm processing technique (EPIC vs. 450K), and estimated immune and epithelial cell proportions in saliva.
Statistical analysis
We used latent class analysis (LCA) to identify patterns of co-occurring ACEs before age 9 (Aim 1). We then applied the manual three-step Bock–Croon–Hagenaars (BCH) method to estimate biological aging across latent classes, adjusting for covariates (Aim 2). Analyses followed a multiple-group framework across intersecting race–sex groups. Measurement invariance was tested within LCA to determine whether class structures were comparable across groups (Morin, Meyer, Creusier, & Biétry, Reference Morin, Meyer, Creusier and Biétry2016). When invariance criteria were met, groups were pooled and analyzed using multiple-group LCA to enable cross-group comparisons. When invariance was not met, subgroup-specific models were retained, and comparisons were limited to within-group estimates (see Supplemental Methods). All analyses were conducted in R, with LCA estimated using the MplusAutomation package (Hallquist & Wiley, Reference Hallquist and Wiley2018).
Results
Latent classes of adverse childhood experiences
A two-class solution provided the best fit across all six intersecting race–sex groups, supporting configural invariance, a prerequisite for valid cross-group comparisons of ACE classes in relation to biological aging (Morin et al., Reference Morin, Meyer, Creusier and Biétry2016). Model fit statistics and details of model selection are presented in eTables 1 and 2 and the Supplemental Methods. Further examination of class structures across the six intersecting groups indicated that class structures were qualitatively comparable between females and males within each racial/ethnic group, but not across racial/ethnic groups. This supported structural invariance by sex within each racial/ethnic group, justifying sex-stratified multiple-group models within each racial/ethnic group. Accordingly, quantitative comparisons of ACE classes across sexes were conducted within each racial/ethnic group using three separate multiple-group, two-class models for Black, Hispanic, and White participants.
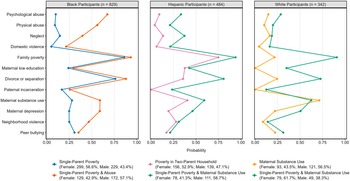
Figure 1 presents the two latent classes identified for each racial/ethnic group. Among Black participants, the larger class, Single-Parent Poverty (63.7%), was marked by high probabilities of parental divorce or separation and poverty. The smaller class, Single-Parent Poverty & Abuse (36.3%), showed similarly high probabilities of parental divorce or separation and poverty, but higher probabilities of psychological and physical abuse. Among Hispanic participants, the larger class, Poverty in Two-Parent Household (61.0%), was characterized by high probabilities of poverty and low probabilities of parental divorce or separation. The smaller class, Single-Parent Poverty & Maternal Substance Use (39.0%), was characterized by high probabilities of parental divorce or separation, poverty, and maternal substance use. Among White participants, the larger class, Maternal Substance Use (62.6%), was characterized by high probabilities of maternal substance use. The smaller class, Single-Parent Poverty & Maternal Substance Use (37.4%), was characterized by a high likelihood of parental divorce or separation, poverty, and maternal substance use.
Item-response probabilities and class prevalence estimates for race-specific adverse childhood experiences (ACE) latent classes among Black, Hispanic, and White participants.

Figure 1. Long description
The left panel shows Black participants (n equals 829) with two classes: Single-Parent Poverty (blue) and Single-Parent Poverty and Abuse (orange). The x-axis is probability from 0 to 1, y-axis lists adverse experiences: psychological abuse, physical abuse, neglect, domestic violence, poverty, maternal low education, divorce or separation, paternal incarceration, substance use, depression, neighborhood violence, peer bullying. Class 2 has higher probabilities for psychological abuse, physical abuse, neglect, domestic violence, and substance use compared to Class 1. Panel B in the middle shows Hispanic participants (n equals 484) with Class 1: Poverty in Two-Parent Household (pink) and Class 2: Single-Parent Poverty and Maternal Substance Use (green). Class 2 has higher probabilities for maternal low education, divorce or separation, paternal incarceration, and substance use. Panel C at the bottom shows White participants (n equals 342) with Class 1: Maternal Substance Use (amber) and Class 2: Single-Parent Poverty and Maternal Substance Use (green). Class 2 shows higher probabilities for poverty, maternal low education, and divorce or separation. Legends to the right of each panel specify class names and gender breakdowns. Neighborhood violence and peer bullying have lower probabilities across all groups and classes.
Comparisons of biological aging by ACE classes
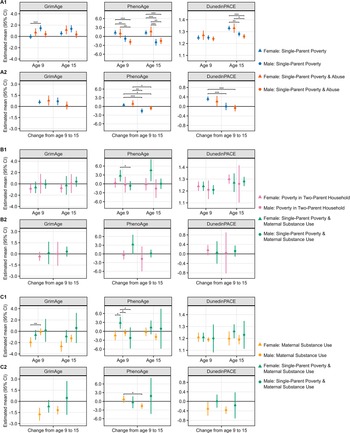
Results from the primary model are shown in eTables 3–8, and Figure 2 provides a visual summary of group-specific clock estimates across latent classes and cross-sex comparisons for Black, Hispanic, and White participants.
DNAm-based biological aging outcomes across race-specific adverse childhood experiences (ACE) latent classes by sex. Panels A–C show Black (A; n = 829), Hispanic (B; n = 484), and White (C; n = 342) participants. Subpanels A1–C1 display model-estimated means and 95% confidence intervals for biological aging outcomes at ages 9 and 15, whereas subpanels A2–C2 display change from age 9 to 15. For GrimAge and PhenoAge, plotted values represent epigenetic age acceleration estimates residualized for chronological age; DunedinPACE values represent pace of biological aging estimates. Brackets indicate FDR-corrected significant differences between latent classes. *p < .05, **p < .01, ***p < .001.

Figure 2. Long description
From top-left to bottom-right, the layout consists of three rows labeled A, B, and C for Black, Hispanic, and White participants. Each row contains three bar graphs: GrimAge, PhenoAge, and Dunedin P A C E. The x-axis in each graph shows Age 9 and Age 15. The y-axis shows mean clock estimate values. Four colored bars represent latent classes: female class 1, female class 2, male class 1, and male class 2, with class definitions provided in the legend at the right. Error bars indicate standard errors. Statistical significance is marked with asterisks above bars. In panel A, Black participants show significant differences between classes for GrimAge and PhenoAge at both ages, and for Dunedin P A C E at age 15. Panel B, Hispanic participants, display fewer significant differences, mainly in PhenoAge at age 9. Panel C, White participants, show significant differences in PhenoAge at age 9. For White female class 2, estimates and errors are scaled by 0.5. The legend defines each class by household and maternal factors.
Black participants
Within-sex comparisons. At all time points, biological aging did not significantly differ between Black females in the Single-Parent Poverty and Single-Parent Poverty & Abuse classes (all FDR ps > .19; eTable 3). A similar pattern was observed for Black males (all FDR ps > .07).
Between-sex comparisons. For GrimAge EAA, females in the Single-Parent Poverty class showed lower estimates than males in the same class at age 9 (M difference = −1.47, FDR p < .001; eTable 4 and Figure 2), with no other GrimAge comparisons reaching significance. For PhenoAge EAA, females in the Single-Parent Poverty class exhibited significantly higher estimates than males in both classes across all comparison points – age 9, age 15, and change from age 9 to 15 (FDR ps < .05). Females in the Single-Parent Poverty & Abuse class showed a similar pattern, with the exception of one age 9 comparison against males in the Single-Parent Poverty class (M difference = 1.79, FDR p = .10). For DunedinPACE, females in the Single-Parent Poverty class exhibited significantly more rapid biological aging than males in both classes at age 15 (FDR ps < .006) and for the change from age 9 to 15 (FDR ps < .001). Females in the Single-Parent Poverty & Abuse class additionally showed more rapid DunedinPACE than males in the same class at age 15 (M difference = 0.06, FDR p = .02), though no other comparisons for this class reached significance (FDR p > .07).
Hispanic participants
Within-sex comparisons
At all time points, biological aging did not significantly differ between Hispanic females in the Poverty in Two-Parent Household and Single-Parent Poverty & Maternal Substance Use classes (all FDR ps > .05; eTable 5). We observed a similar pattern for Hispanic males (all FDR ps > .53).
Between-sex comparisons
For GrimAge EAA, although Hispanic females tended to have lower estimates than their male counterparts across classes and time points, none of these differences reached statistical significance (all FDR ps > .43; eTable 6). For PhenoAge EAA, females in the Single-Parent Poverty & Maternal Substance Use class had higher estimates than males in the same class at age 9 (M difference = 3.39, FDR p = .04). At age 15, both comparisons involving females in this class versus males in either class approached, but did not survive, FDR correction (FDR ps = .06), and no other class comparisons for PhenoAge reached significance (FDR ps > .17). For DunedinPACE, no cross-sex comparisons reached statistical significance at either time point or for longitudinal change (all FDR ps > .90).
White participants
Within-sex comparisons
Biological aging did not significantly differ between White males in the Maternal Substance Use and Single-Parent Poverty & Maternal Substance Use classes across all outcomes (all FDR ps > .31; eTable 7). Among White females, however, participants in the Maternal Substance Use class had lower PhenoAge EAA than those in the Single-Parent Poverty & Maternal Substance Use class at age 9 (M difference = −4.23, FDR p = .02), though this difference was not significant at age 15 (FDR p = .66) or for the change from age 9 to 15 (FDR p = .61). No other within-sex comparisons reached significance.
Between-sex comparisons
Results are shown in eTable 8 and Figure 2. For GrimAge EAA, females in the Maternal Substance Use class showed lower estimates than males in the same class at age 9 (M difference = −1.84, p < .001, FDR p = .006), though this difference did not persist at age 15 (M difference = −1.40, p = .02, FDR p = .07), and no other GrimAge comparisons reached significance. For PhenoAge EAA, females in the Single-Parent Poverty & Maternal Substance Use class had higher estimates than males in both classes at age 9 (vs. Maternal Substance Use: M difference = 3.36, p = .006, FDR p = .02; vs. Single-Parent Poverty & Maternal Substance Use: M difference = 5.12, p = .01, FDR p = .02), and higher estimates than males in Maternal Substance Use at age 15, but did not reach statistical significance after FDR correction (M difference = 3.19, p = .02, FDR p = .10). For DunedinPACE, White females in the Single-Parent Poverty & Maternal Substance Use class showed nominally higher estimates than White males in the Maternal Substance Use class at age 15 and for change from age 9 to 15, but neither comparison survived FDR correction (FDR ps = .11 and .15, respectively).
Discussion
Although ACEs are well-established predictors of later mental and physical health problems, less is known about how adversity becomes biologically embedded during development. To address this issue, we examined whether patterns of co-occurring ACEs were associated with DNAm-based biological aging across late childhood and adolescence within intersecting race–sex groups. Specifically, we characterized how ACEs are patterned across intersecting race–sex groups and whether these patterns differentially predict epigenetic aging in a large, racially diverse, population-based birth cohort of youth. To our knowledge, this is the first longitudinal study to examine whether intersecting race–sex-specific ACE patterns are differentially associated with DNAm-based biological aging across late childhood and adolescence. Several key findings emerged.
First, as hypothesized, we identified distinct ACE profiles within each racial/ethnic group. Class structures were qualitatively similar across females and males within racial/ethnic groups but not across racial/ethnic groups. Using multiple-group latent class analysis and multidimensional ACE indicators, we identified clustered patterns of adversity that varied both across and within racial/ethnic groups. This person-centered approach highlights heterogeneity in developmental contexts shaping adversity exposure among U.S. youth. Poverty was prominent across groups, and parental separation was common in several classes, consistent with prior work, but these experiences clustered differently across racial/ethnic groups, underscoring that ACE configurations are socially patterned and may have distinct implications across contexts (Crouch, Hanson, Saunders, Kilpatrick, & Resnick, Reference Crouch, Hanson, Saunders, Kilpatrick and Resnick2000; Zhang et al., Reference Zhang, Merrin and Slavich2024; Zhang & Monnat, Reference Zhang and Monnat2022). For example, Hispanic youth were more often characterized by a Poverty in Two-Parent Household class, whereas White youth were often characterized by a Maternal Substance Use class. These differences suggest that the developmental meaning of adversity may depend not only on burden but also on how adversities co-occur within broader sociocultural contexts.
Second, building on these distinct ACE profiles, we examined whether biological aging differed by ACE classes within racial/ethnic groups. Among Black participants, contrary to expectations, within-sex differences between ACE classes were not evident. Instead, differences between females and males were more consistently observed. Notably, Black females exhibited higher PhenoAge EAA than males across ACE classes, both cross-sectionally at age 9 and longitudinally at age 15, including greater change over time. A similar pattern emerged for DunedinPACE, although statistical significance was limited to age 15 and differences were more pronounced for the Single-Parent Poverty class. These findings are consistent with the hypothesis that girls may exhibit greater sensitivity to early adversity than boys (Ellis, Reference Ellis2004), even when exposed to broadly similar forms of adversity.
These findings can be interpreted within broader models of stress and development. For example, life history theory proposes that early environmental harshness and unpredictability may calibrate development toward faster maturation, particularly when early cues signal heightened risk or constrained future opportunity (Belsky, Reference Belsky2019; Ellis, Reference Ellis2004). Similarly, stress-embedding models posit that repeated activation of stress-responsive systems may become biologically embedded, contributing to accelerated aging (Miller, Chen, & Parker, Reference Miller, Chen and Parker2011). Finally, Social Safety theory posits that exposure to social threat promotes inflammation, which can accelerate biological aging (Slavich, Reference Slavich2020, Reference Slavich2022; Slavich et al., Reference Slavich, Roos, Mengelkoch, Webb, Shattuck, Moriarity and Alley2023). Consistent with these models, prior research suggests that threat-related adversity is more consistently associated with accelerated biological aging, whereas deprivation-related exposures show more heterogeneous associations, particularly among males (Colich et al., Reference Colich, Rosen, Williams and McLaughlin2020; Sumner et al., Reference Sumner, Colich, Uddin, Armstrong and McLaughlin2019). From this perspective, the observed pattern may reflect not only differences in exposure but also sex-linked variation in how adversity is biologically internalized.
Importantly, ACE indicators in this study, while expanded, do not directly capture structural racism-related exposures, such as discrimination or institutional inequity, which are known to shape the adversity contexts for Black youth. Consistent with the weathering hypothesis, sustained exposure to structurally patterned stressors may accelerate physiological deterioration through increased allostatic load (Geronimus, Hicken, Keene, & Bound, Reference Geronimus, Hicken, Keene and Bound2006). The elevated PhenoAge EAA observed among Black females may therefore reflect cumulative physiological burden that measured ACEs only partially capture. Whether these patterns reflect adaptive developmental calibration, cumulative wear, or both remains an open question.
The mechanisms underlying these sex differences likely involve interacting biological and social pathways. Biological sex mechanisms – including HPA axis differences, immune function, and pubertal timing – may increase physiological sensitivity to stress among females (Hodes & Epperson, Reference Hodes and Epperson2019; Tiwari & Gonzalez, Reference Tiwari and Gonzalez2018). At the same time, gendered social processes such as coping styles, trauma appraisal, and social support may further shape these differences (Belsky, Reference Belsky2019; Ellis, Reference Ellis2004; Rickard, Frankenhuis, & Nettle, Reference Rickard, Frankenhuis and Nettle2014; Zhang, Slopen, Binns, & Cuevas, Reference Zhang, Slopen, Binns and Cuevas2026). Because sex was operationalized as assigned at birth, these pathways cannot be disentangled and warrant further investigation.
Third, among White youth, within-sex comparisons showed that females in the Single-Parent Poverty & Maternal Substance Use class had higher PhenoAge EAA at age 9 than those in the Maternal Substance Use class, although this difference did not persist at age 15 or for longitudinal change. No comparable differences were observed among males. The pattern is consistent with theory suggesting greater female sensitivity to environmental harshness (Belsky, Reference Belsky2019; Ellis, Reference Ellis2004) and with evidence that ACE-related differences in biological aging may be more evident among females than males (Zhang et al., Reference Zhang, Slopen, Binns and Cuevas2026). The attenuation of this association over time may reflect developmental changes in DNAm or shifting biological embedding processes across adolescence rather than cumulative effects. Consistent with this interpretation, DNAm correlates of early adversity do not necessarily persist uniformly into adolescence, and distinct adversity-related methylation patterns may emerge later in development (Lussier et al., Reference Lussier, Zhu and B. J.2023). Notably, sensitivity analyses adjusting for caregiver-reported pubertal development relative to peers did not alter these findings (eTables 13 and 14), suggesting that differential pubertal timing alone is unlikely to explain the attenuation of the age-9 effect. More broadly, this interpretation is consistent with longitudinal evidence from the same FFCWS cohort showing less accelerated epigenetic aging among White youth between ages 9 and 15 relative to racially minoritized youth (Del Toro et al., Reference Del Toro, Martz, Freilich, Rea-Sandin, Markon, Cole, Krueger and Wilson2024), as well as with findings that school-level manifestations of structural racism predicted faster epigenetic aging among Black, but not White, youth across the same developmental period (Martz et al., Reference Martz, Benner, Goosby, Mitchell and Gaydosh2024). Taken together, these findings suggest that, for White females, the co-occurrence of poverty and maternal substance use may be associated with a detectable difference in late childhood that is not sustained across adolescence.
Finally, across racial/ethnic groups, two broad patterns emerged. First, PhenoAge EAA was the most consistent indicator of biological aging differences associated with ACE classes in this cohort, whereas findings for GrimAge EAA and DunedinPACE were less consistent. This pattern aligns with prior work suggesting that PhenoAge EAA, but not GrimAge EAA, is associated with abuse in adolescence (Chang et al., Reference Chang, Meier, Maguire-Jack, Davis-Kean and Mitchell2024) and adulthood (Rampersaud et al., Reference Rampersaud, Protsenko, Yang, Reus, Hammamieh, Wu, Epel, Jett, Gautam, Mellon and Wolkowitz2022). This likely reflects differences in clock construction, with PhenoAge trained on clinical markers capturing systemic physiological dysregulation (Levine et al., Reference Levine, Lu, Quach, Chen, Assimes, Bandinelli, Hou, Baccarelli, Stewart, Li, Whitsel, Wilson, Reiner, Aviv, Lohman, Liu, Ferrucci and Horvath2018), whereas GrimAge incorporates DNAm-based surrogates for smoking and plasma proteins and was optimized to predict mortality risk (Lu et al., Reference Lu, Quach, Wilson, Reiner, Aviv, Raj, Hou, Baccarelli, Li, Stewart, Whitsel, Assimes, Ferrucci and Horvath2019). As such, PhenoAge may be more sensitive to early or midlife physiological perturbations, whereas GrimAge may better capture processes linked to later-life morbidity and mortality, though direct evidence for developmental differences in sensitivity remains limited. Second, several comparisons suggested higher PhenoAge EAA among females than males, contrasting adult patterns in which males typically show greater epigenetic age acceleration than females (McCrory et al., Reference McCrory, Fiorito, McLoughlin, Polidoro, Cheallaigh, Bourke, Karisola, Alenius, Vineis, Layte and Kenny2019; Zhang et al., Reference Zhang, Slopen, Binns and Cuevas2026). This suggests that sex differences in biological aging may be developmentally patterned. Although these biomarkers are not clinical endpoints, the observed differences may reflect early divergence in health-risk trajectories that could widen across development if adversity remains unaddressed. From a prevention perspective, these findings suggest that moving beyond cumulative ACE scores toward more precise identification of adversity configurations may improve identification of youth who could be prioritized for prevention efforts. Overall, these findings highlight the importance of intersectional, person-centered, and longitudinal approaches in understanding how adversity becomes biologically embedded across development.
Strengths and limitations
This study has several strengths. First, we used a multiple-group latent class approach across intersecting race–sex groups and, where supported by invariance testing, conducted sex-stratified models within racial/ethnic groups to capture the heterogeneity in ACE patterns beyond singular types of adversity or cumulative ACE scores. Second, we formally tested measurement invariance in the latent class models, which strengthened the validity of group comparisons. Third, we focused on a pediatric cohort and used second- and third-generation epigenetic clocks (PhenoAge, GrimAge, and DunedinPACE), helping address urgent calls to identify early-life biomarkers of adversity (Shonkoff et al., Reference Shonkoff, Boyce, Bush, Gunnar, Hensch, Levitt, Meaney, Nelson, Slopen, Williams and Silveira2022).
Several limitations should also be noted. Although the study used a large, racially diverse, urban birth cohort, the sample oversampled low-income families, and findings may not generalize to more socioeconomically advantaged, rural, or culturally distinct populations. In addition, because ACE class structures differed across racial/ethnic groups, classes were not directly comparable across groups. Furthermore, although the ACE indicators used in this study span conventional and expanded domains, they do not directly capture structural racism-related exposures, such as discrimination, segregation, or institutional inequity, which may contribute to biological aging. In addition, sex was operationalized as assigned at birth, preventing distinction between biological and gender-related processes. Next, biological aging estimates were derived from saliva, which may not capture tissue-specific changes associated with adversity. Finally, although the study was longitudinal, it remained observational and therefore cannot support causal inference.
Conclusion
In conclusion, we found that ACEs clustered differently across racial/ethnic groups and that their associations with DNAm-based indicators of biological aging in adolescence varied by sex, developmental timing, and clock type. The clearest pattern emerged for PhenoAge: among Black participants, females showed higher PhenoAge estimates than males across classes and time points, whereas within-sex class differences were limited. Among White participants, females in the Single-Parent Poverty & Maternal Substance Use class showed higher PhenoAge estimates in late childhood than those in the Maternal Substance Use class, but this difference did not persist into mid-adolescence or longitudinal change. By contrast, findings for GrimAge and DunedinPACE were less consistent. Taken together, these results suggest that an intersectional, person-centered framework may help identify heterogeneity in early biological risk beyond cumulative ACE scores while also highlighting that associations between adversity and epigenetic aging in youth may be modest, clock-specific, and developmentally contingent.
Supplementary material
The supplementary material for this article can be found at http://doi.org/10.1017/S0033291726104619.



 Open access

