

Introduction
The Greenland ice sheet (GrIS) exhibits a dramatic melt and mass loss trend that is likely to continue with rapid warming of the Arctic region (Reference Fettweis, Tedesco, Van den Broeke and EttemaFettweis and others, 2011; Reference ShepherdShepherd and others, 2012; Reference McGrath, Colgan, Bayou, Muto and SteffenMcGrath and others, 2013). Since the 1990s, GrIS surface ablation has nearly doubled from ∼250–264 (±26–45) Gt a−1 to ∼400–429 (±57) Gt a−1 (Reference FettweisFettweis, 2007; Reference EttemaEttema and others, 2009; Reference Van den BroekeVan den Broeke and others, 2009; Reference Mernild and ListonMernild and Liston, 2012) and would have been 100% larger if mass loss was not offset by increased snowfall and refreezing (Reference Van den BroekeVan den Broeke and others, 2009). Surface meltwater runoff is estimated from modeling studies to continue growing in importance (Reference Mernild, Liston, Hiemstra and ChristensenMernild and others, 2010; Reference Robinson, Calov and GanopolskiRobinson and others 2012; Reference Franco, Fettweis and ErpicumFranco and others, 2013). Greenland rivers draining the GrIS will likely follow circum-Arctic trends of increasing river discharge (Reference Overeem and SyvitskiOvereem and Syvitski, 2010).
The potential consequences of continued meltwater losses from the GrIS are far-reaching. Perhaps of greatest concern is the raising of sea levels. Should the 1992–2009 average mass loss rate of +21.9 ± 1 Gt a−1 from the GrIS alone continue, global sea level will rise +9 ± 2 cm by 2050 (Reference Rignot, Velicogna, Van den Broeke, Monaghan and LenaertsRignot and others, 2011). Meltwater and sediment reaching the oceans by rivers influence physical (Reference DriesschaertDriesschaert and others, 2007; Reference StraneoStraneo and others, 2011; Reference Bamber, Van den Broeke, Ettema, Lenaerts and RignotBamber and others, 2012) and biological properties of Greenland’s marine environment (Reference Rysgaard, Vang, Stjernholm, Rasmussen, Windelin and KiilsholmRysgaard and others, 2003; Reference ArendtArendt and others, 2011; Reference Hudson, Overeem, McGrath, Syvitski, Mikkelsen and HasholtHudson and others, 2013).
Exactly how much GrIS surface melt infiltrates and refreezes rather than escaping to the ocean is still unclear (Reference VernonVernon and others, 2013). Melt is spreading to higher regions of the ice sheet, into the dry snow zone, but radar surveys and thermistor readings in boreholes provide evidence that much of this melt refreezes locally in the firn and snowpack (Reference Pfeffer, Meier and IllangasekarePfeffer and others, 1991; Reference Harper, Humphrey, Pfeffer, Brown and FettweissHarper and others, 2012). Significant retention of meltwater englacially or subglacially has been inferred even for a small low-lying ice-marginal catchment without any potential water storage in firn (Reference RennermalmRennermalm and others, 2013). It is clear that surface melting is increasing over the GrIS, and the response of the Greenland ice-marginal rivers to warming may shed light on the buffering effect of meltwater storage.
Unfortunately, direct measurements of river runoff along the Greenland coast are sparse, partly due to the difficulty of installing and maintaining gauging stations around the periphery of the ice sheet. Additionally, most rivers in Greenland have braided channels with unstable banks, which make it challenging to estimate discharge from water-level measurements. Estimating discharge from water level requires a calibrated relationship between river velocity, width and depth. It is difficult to measure velocities in the coexisting anabranches of a braided river network, and it is problematic to assume the channel does not scour over the season. Yet braided, shallow channels, which rapidly expand and contract with different flow regimes, can potentially be suitable for discharge quantification from inundation (Reference Ashmore and SauksAshmore and Sauks, 2006).
Here we investigate an approach for measuring proglacial river dynamics from NASA’s Moderate Resolution Imaging Spectroradiometer (MODIS) surface reflectance data, and compare this remote technique with ground-based time-lapse camera data. We calibrate the satellite data against observed discharge records on two braided river systems in West Greenland: the Watson River near Kangerlussuaq, and the Naujat Kuat River near Nuuk (Fig. 1). Both are ice-marginal rivers influenced by melt of the GrIS (Reference McGrath, Steffen, Overeem, Mernild, Hasholt and Van den BroekeMcGrath and others, 2010). Site-specific relations allow reconstruction of discharge over the entire 12 year span of the MODIS record. Once we establish relations, we can evaluate the annual river dynamics of these two systems and place them in the context of the melt dynamics in their respective catchments on the GrIS.
River braidplains of (a) the Watson River draining into Kangerlussuaq fjord, and (b) the Naujat Kuat River draining into Ameralik fjord. Gauging-station locations are marked with white circle; the position of the time-lapse camera is marked with a star. The inset map (c) indicates the location of both proglacial rivers along the West Greenland ice margin.

Our observation period includes the extreme melt summer of 2012. Ninety-nine percent of the GrIS experienced melt conditions on 12 July 2012 (Reference NghiemNghiem and others, 2012), including the highest-altitude and -latitude areas (Reference McGrath, Colgan, Bayou, Muto and SteffenMcGrath and others, 2013). The extreme melt event resulted in extensive flooding in both river systems; the bridge over the Watson River, which is the only bridge over a meltwater river in Greenland, was damaged by the high flows. This rare event provides an opportunity to scrutinize the image-based methods under conditions that make in situ observations exceptionally challenging.
Theory on Discharge Measurements
Around the world, river discharge, Q (L3 T−1), is calculated – at specific river cross-sections where width, w (L), depth, d (L), and velocity, v (L T−1), are known – by the mass continuity equation
Conversely (and traditionally), discharge can be related by empirical power functions to the mean velocity, width and depth at a particular river cross section (Reference Leopold and MaddockLeopold and Maddock, 1953).
Equation (1) dictates that ack = 1 and b + f + m = 1.
At the vast majority of river monitoring sites, water level, or ‘stage’, is recorded frequently, whereas the water velocity and channel cross-sectional geometry are surveyed only periodically to establish a stage–discharge relation, then used for discharge predictions.
The empirical relation between channel width and discharge is especially relevant for braided rivers, which typically contract and expand with varying discharge. In Eqn (2), the exponent b represents the sensitivity of the braidplain’s channel widths to changes in discharge. Here we present an approach using a reach-averaged inundation, I, which represents the wetted area, A w, over the total area, A total, of the braidplain:
A reach-average quantification ought to be a more robust metric of hydraulic geometry than single cross-sectional data. Using an entire reach smooths possible extreme values at individual cross sections (Reference StewardsonStewardson 2005). Inundation lends itself to be imaged remotely (Alsdorf and Lettenmeier 2003; Reference Brakenridge, Nghiem, Anderson and MicBrakenridge and others 2007). Reference Smith, Isacks, Bloom and MurraySmith and others (1996, 1997) pioneered this approach for large Arctic river braidplains. We here propose to establish and test inundation–discharge relations for smaller-scale proglacial rivers.
Methodology
Watson River and Naujat Kuat River catchments
We delineated both river catchments based on calculations of the local hydrostatic pressure field (Reference Lewis and SmithLewis and Smith, 2009; Cuffey and Patterson, 2010) using surface elevation from Reference Howat, Negrete and SmithHowat and others (2014) and basal topography from Reference Bamber, Layberry and GogineniBamber and others (2001). Contributing area was calculated with a D-infinity approach (Reference TarbotonTarboton, 1997) in the RiverTools software package. This delineation method takes into account that water pressure equals ice overburden pressure, but it is limited by the resolution of the basal topography. Furthermore, it assumes uniform water flow at the base of the ice sheet, whereas, more likely, water will be flowing in a channelized system, so any delineation carries uncertainty.
The Watson River is an ice-marginal river (Fig. 1a) dominantly controlled by melting of the GrIS (Reference McGrath, Steffen, Overeem, Mernild, Hasholt and Van den BroekeMcGrath and others, 2010; Reference Hasholt, Mikkelsen, Nielsen and LarsenHasholt and others, 2013; Table 1). Its catchment area over the GrIS was found to be 3640 km2, with 20% located above the regional glacier equilibrium-line altitude (ELA) and reaching a maximum elevation of 1860 m.
Catchment characteristics of both river drainage basins

The Naujat Kuat River (Fig. 1b) drains a mixed catchment composed of 63–75 % tundra. The remaining area over the GrIS, entirely located below the regional ELA, was 460 km2 in the early 2000s, and ∼356 km2 after a drainage diversion was built in 2004 (Reference Weidick and CitterioWeidick and Citterio, 2011; Reference Hudson, Overeem, McGrath, Syvitski, Mikkelsen and HasholtHudson and others, 2013). The diversion is downstream of our gauging station and thus does not affect the measured discharge. Its impact on the inundated braidplain is minor.
In situ river discharge measurements
The Watson River gauging station is located at 66°57′54″ N, 50°51′50″ W, where two bedrock channels were blasted through a bedrock sill in the town of Kangerlussuaq (Figs 1a and 2a). The ice-sheet margin is ∼22 km upstream. Two bridges cross both adjacent channels, allowing for complete and continuous observation of water level. The northern channel is deepest and experiences flow through spring and summer, whereas water only starts to run in the southern channel when the water level exceeds a certain threshold (Fig. 2b).
(a) Overview photo of the Watson River gauging station location near the town of Kangerlussuaq, West Greenland. The northern channel is deepest, the southern channel is active only at high water level. (b) Cross sections of northern and southern channels measured with repeat soundings in relatively low flow conditions in 2007 (as published in Reference Mernild and HasholtMernild and Hasholt, 2009), September 2009, May 2010 and October 2010. Surveys were performed directly upstream (east) and downstream (west) of the bridge. The thick black lines are averaged to be used as the representative profile for discharge calculations. The variable thickness of bed load on the northern channel bottom introduces a significant component of uncertainty in the stage–discharge calculations.

River stage was measured every 20 min in 2007, and every 5 min ever since, using redundant pressure sensors. The reported measurement error for the pressure sensors is ±1 cm. Stage was corrected for barometric pressure variations by subtracting atmospheric pressure as measured from a paired, in situ, baro-diver (an instrument for accurate barometric compensation). During high water the river surface water level varies by ±25 cm due to turbulence. We propagate these two uncertainties in the stage measurements and find the error in the water-level measurements contributes ±10% uncertainty to the discharge calculations. Repeat surface velocity measurements with a float were obtained at various river stages each year. The standard deviation of repeat velocity measurements – the contribution of velocity to the uncertainty in discharge measurements – was ±7.5% (Reference Hasholt, Mikkelsen, Nielsen and LarsenHasholt and others, 2013). The errors in water-level and velocity measurements together amount to an uncertainty in the discharge estimations of ±17.5%.
However, an added component of the uncertainty in discharge calculations results from the determination of the cross-sectional area of the river profile. Eight soundings between 2009 and 2011 in low flow conditions in May and October show that channel depth varies by ∼2m due to a layer of bed sediment of variable thickness (Fig. 2b). Soundings on either side of the bridge obtained in May 2010 were considered most representative of the river cross section for intermediate and high flow conditions, while the average of multiple surveys was used for low flow discharge calculations (Reference Hasholt, Mikkelsen, Nielsen and LarsenHasholt and others, 2013). A deepest possible channel profile was measured by penetrating a sharp long iron rod through the sediment to bedrock (Fig. 2b). This deepest possible river cross section defines an upper limit in the discharge calculations (+45%) (Reference Hasholt, Mikkelsen, Nielsen and LarsenHasholt and others, 2013). However, it is unlikely this deepest profile represents average flow conditions; at times of average flow some of the bedrock profile is covered with sandy bed material and pebbles or cobbles. These uncertainties, combined, result in fitted stage–discharge relations for low and high flow conditions with a relative error of estimation (REE) of ±17%. This REE carries the implicit assumption that the hydraulic profile does not contribute to the uncertainty. However, using the deepest possible cross section in the discharge calculations we calculate that the uncertainty has an upper limit of +45% (Reference Hasholt, Mikkelsen, Nielsen and LarsenHasholt and others, 2013; Fig. 3).
Stage–discharge relationship for the Watson River (modified after Reference Hasholt, Mikkelsen, Nielsen and LarsenHasholt and others, 2013) for low flow conditions (flow is restricted to the northern channel) and for intermediate to high flow conditions (flow occupies both the northern and southern channels; see Fig. 2). Discharge is calculated from simultaneous measurements of water height and velocity collected for different flow states in 2008, 2009, 2010 and 2011. Relative error of estimation is 17%; additional uncertainty can amount to ∼45% due to unknown scouring to the deepest possible river profile (dotted line).

The extraordinary flood of 10–14 July 2012 forced us to extrapolate the stage–discharge relation 13% beyond the previously observed maximum. After the bridge was damaged on 11 July, two new shallow channels formed in the sandy side-walls; these additional strands were estimated to be ∼1.5 and ∼2.5 m deep respectively at maximum flow (the two original bedrock channels are assumed unchanged). The cross-sectional area of the new channels was estimated from time-stamped photographs, and the resulting discharge added to the discharge calculated on the basis of the stage–discharge relation for the original channels. Given that the share of water discharged through the new channels is relatively minor, this makes a negligible contribution to the overall uncertainty.
Another, more remote, gauging station was installed at a bedrock constriction along the Naujat Kuat River (64°12′45″ N, 50°12′22″ W) in 2011, about 11 km from the GrIS margin. The braidplain downstream of the ice margin is ∼1.5 km wide (Figs 1b and 3). Downstream of the station, the braidplain narrows to 0.7 km, then widens again towards the river mouth. The station is equipped with a Campbell SR50a sonic ranger, and samples river stage height, H, above an arbitrary zero, H 0, every 60 min. The sonic ranger measurements are corrected for fluctuations in local air temperature to correct for variations in speed of sound in air, as specified by the manufacturer. The reported operational accuracy for a Campbell SR50 sonic ranger is ±2.54 cm, but the turbulence of the water below the sensor may be as high as ±25 cm, which is the more significant component of the uncertainty of the stage measurement.
We repeatedly measured water velocity with the float method and water surface slope during site visits in June 2010, July 2011 and August 2012. To obtain a cross-sectional profile at the gauge, a three-dimensional (3-D) model of the river bedrock constriction was reconstructed from four photographs taken on 6 April 2012 during extremely low flow. The camera position was changed little between the images, so only the geometry of the foreground, directly downriver from the sensor, could be reliably triangulated. The photographs were processed with the structure-from-motion packages Bundler and Patch-based Multi-view Stereo Software (PMVS) to calculate a dense, relatively oriented point cloud (424 632 points) (Fig. 4a). To scale the model, we compared the distance to the water surface measured by the water-level sensor on the day the images were acquired with the equivalent measurement in the point cloud (scale factor ∼25.55). Direct measurement of two other easily identified features – a 0.73 m rock step (scale ∼28) and a 4 m boulder (scale ∼25) – were in close agreement with this result. We calculate an error of ±10%, based on the roughness of the turbulent water surface used to determine the reference height and the small angle between the source images. Additional uncertainty stems from the unseen profile below the water. We estimated the additional possible depth to be between 0 and 3 m (a generous upper limit considering the low flow conditions in April). To produce a final two-dimensional (2-D) cross-sectional profile, the point cloud was sampled along a perpendicular line transect, and simplified to a polyline for use in subsequent modeling (Fig. 4b).
Overview 3-D model of the Naujat Kuat River gauging station near Nuuk based on photos taken in April 2012. The black circle indicates the position of the sonic sensor (SR50) used for measuring river stage. (a) Cross section reconstructed from the 3-D model of the bedrock constriction (black line) and the simplified 2-D polyline for input into the fluid-mechanical modeling (dotted lines). Significant uncertainty in the stage–discharge calculations results from the unknown depth of the 2-D profile below the water level (estimated between 0 and 3 m).

At the Naujat Kuat River, our sparse in situ stage–discharge measurements were supplemented with modeled stage–discharge estimates using a fluid mechanics based model (Reference Kean and SmithKean and Smith, 2005, Reference Kean and Smith2010). This approach is useful for (new) gauging sites with flows that are too dangerous to measure with a current meter or acoustic Doppler current profiler. The numerical model uses channel geometry, channel roughness and water surface slope to calculate a cross-sectional velocity field to determine discharge from stage observations. Channel roughness is explicitly based on field measurements of the geometry of roughness elements, which in the Naujat Kuat River include flutes in the bedrock surface (up to 20 cm high) and boulders in the channel bed (up to 1.5 m high). We ran this model repeatedly over the observed range of stages for both the shallowest and deepest estimated 2-D cross sections as derived from the photogrammetry (Fig. 4b). For each cross section a set of sensitivity experiments were performed over a range of channel roughness and slope values (Table 2), and the resulting modeled velocities were compared with in situ velocity observations to select the most likely stage–discharge relationship and establish uncertainty ranges (Fig. 5). The stage–discharge relationship for selected experiments with parameterization resulting in a best match to the observed velocities has a REE of only ±1.4% (Fig. 5). However, due to the sparse observational record, the unknowns in the cross-sectional area, and uncertainty in the cross-section roughness parameterization, the wider range of sensitivity experiments indicate that uncertainty in the discharge may be much larger (REE over all numerical experiments is ±56% (Fig. 5)).
Stage–discharge relationship for the Naujat Kuat River derived from comparison of in situ data and sensitivity experiments with a fluid mechanics model (Reference Kean and SmithKean and Smith, 2005, Reference Kean and Smith2010; Table 2). Model experiments were done for shallow and deep profiles (Fig. 4b) and a range of channel roughness and surface water slopes (Table 2). In situ velocity measurements during field visits in June 2010, July 2011 and August 2012 were used to optimize the parameterization of the model (best fit H–Q relationship in black circles). The error of estimation for the stage–discharge relationship calculated using all sensitivity experiments is 56%.

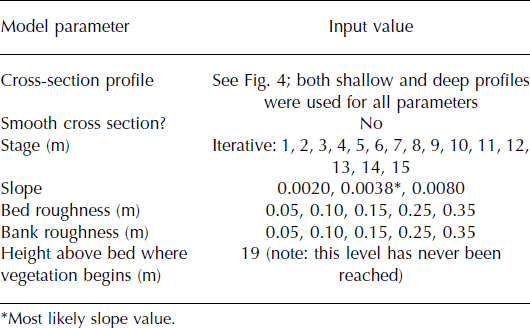
Input parameters for theoretical stage–discharge model by Reference Kean and SmithKean and Smith (2005, Reference Kean and Smith2010). Stage is iteratively increased from 1m to 15 m. Sensitivity experiments were done for bed and bank roughness and water surface slope
MODIS Terra satellite imagery
We use the MODIS sensor aboard the NASA Terra satellite to investigate West Greenland rivers on a daily timescale, clouds permitting. Daily summer MODIS MOD09GA atmospherically corrected surface reflectance products for 2000–12 are automatically processed. We monitored the darkness of several optically deep, non-turbid lakes near the rivers as a preliminary estimate of scene cloudiness, then manually checked scenes for cloud contamination. Our processing uses near-infrared band 6 (1628–1652 nm), and results in 500 m resolution cloud-masked reflectance data. At that resolution, even main channels, which typically range from 150 to 300 m width, are not resolved. Using near-infrared wavelengths guarantees a strong contrast between the very dark reflectance of water (R ∼ 0) and bright reflectance of dry land (R max ∼ 0.3). Field measurements with a handheld ASD Spectoradiometer show that turbid meltwater reflectivity in the near-infrared wavelengths indeed approximates zero: we find R meltwater = 0.00118 averaged over ten locations. R max is similarly established from in situ handheld ASD Spectoradiometer measurements of dry sand on the glacial outwash braidplain (at 20 locations, >10 samples each). These data provide the basis for a MODIS-derived proxy of inundation, IRS , for a selected number of river braidplain gridcells.
where Ri is reflectivity of near-infrared wavelength light (MODIS band 6) for gridcell i, R max is reflectivity of dry sand in near-infrared wavelength light (MODIS band 6) and n is the total number of selected gridcells in each river braidplain. We define 42 and 27 gridcells respectively in regions covering the active braidplain near the mouths of both rivers. This amounts to a total measured area of 10.5 km2 and 6.75 km2 for the Watson and Naujat Kuat rivers respectively.
Time-lapse imagery
From 18 April to 22 August 2012 (most of the summer melt season), a calibrated time-lapse camera we installed at ∼420 m elevation overlooking the Watson River (66°58′39″ N, 50°45′51″ W) photographed the braidplain every hour. The camera was a Nikon D200 with a Nikon AF Nikkor 24 mm f/2.8 D lens and a light-sensitive timer mounted on a tripod bolted to bedrock. The camera was installed with the onboard clock set to the local time zone (UTC-2), and drifted −0:12:13 over the summer, expected over such a long period (Welty and others, Reference Welty, Bartholomaus, O’Neel and Pfeffer2013) and too small to be of consequence to our analysis.
Bedrock and braidplain features on the 12 July 2012 time-lapse photograph were matched to an EO-1 Advanced Land Imager (ALI) image from the same day, and used as control points to orient and position the camera. To avoid the visible registration issues between the ALI imagery and the ASTER Global Digital Elevation Model, only features along the coastline and in the braidplain were used. These were assigned an altitude of 10 m, the average elevation of the braidplain.
The river system experiences large variability between low spring and fall season flows and peak summer flows (Fig. 6). Rather than use inferior automated classification methods, we manually traced the water-filled channels in each of 97 best-quality daily time-lapse photographs spanning 15 May–20 August 2012 (due to difficulties of interpretation, we omitted images with significant snow coverage in April and early May). The boundary pixels of the water mask in each image were converted to world coordinates (by projecting the camera rays onto a horizontal plane with an altitude of 10 m) and used to construct a map of river inundation on each day.
Selected imagery of the time-lapse camera overlooking the braidplain of the Watson River in 2012. Inundation is shown for 17 May, 29 June, 12 July and 17 August 2012. The 12 July image coincides with the most extreme surface melt observed over the GrIS over the entire satellite record. See Supplementary Material (http://igsoc.org/hyperlink/15j012_supp.mp4) for complete time-lapse movie of Watson River dynamics over 2012.

Modeled GrIS surface melt flux (RACMO2/GR)
Meltwater fluxes for our two river catchments have previously been modeled by the surface mass-balance output of the high-resolution climate model RACMO2/GR for 1958–2010 (Ettema and others Reference Ettema2009; Bamber and others Reference Bamber, Van den Broeke, Ettema, Lenaerts and Rignot2012). RACMO2/GR boundary conditions originate from global reanalysis data of the European Centre for Medium-Range Weather Forecasts. Ettema and others (Reference Ettema2009) tested model surface mass-balance results against a comprehensive dataset of Greenland-wide local surface mass-balance measurements (n = 265, R 2 = 0.95; each record was at least >3 years). Model results were also compared against monthly regional Gravity Recovery and Climate Experiment (GRACE) measurements and it was found that predicted surface mass balance was robust on a Greenland-wide scale (Van den Broeke and others, Reference Van den Broeke2009). However, direct comparison to river runoff has not been done before. Instead, a best approximation of runoff was reconstructed from a set of measurements along the K-transect in West Greenland in the Watson River drainage area (Ettema and others, Reference Ettema2009) and combined with melt area estimates (Fettweiss and others, 2011) to produce an estimated uncertainty in ice-sheet runoff of 20% (Bamber and others Reference Bamber, Van den Broeke, Ettema, Lenaerts and Rignot2012). We compare total summer river discharge of two river catchments with modeled RACMO2/GR runoff over precisely the same delineated drainage areas on the GrIS.
Results
Inundation–discharge relations from MODIS reflectance
We directly correlate the MODIS proxy for inundation with observed discharge data for the Watson (2007–12) and Naujat Kuat (2011–12) Rivers. Combining all data for the Watson River yields the inundation–discharge (I–Q) relation (Fig. 7a):
We use this relation and linear interpolation to fill in data for cloudy days, which cause significant gaps in our satellite-derived records. Despite these cloudy periods, MODIS-based total annual discharges agree well with the total discharge from in situ observations (from 86% of total summer discharge in 2009 to 96% in 2011; Table 3).
Inundation–discharge relations for both rivers derived from analysis of MODIS band 6 inundation and observed discharge for available cloud-free days over 2007–12 and 2011–12 for (a) the Watson River and (b) the Naujat Kuat River.

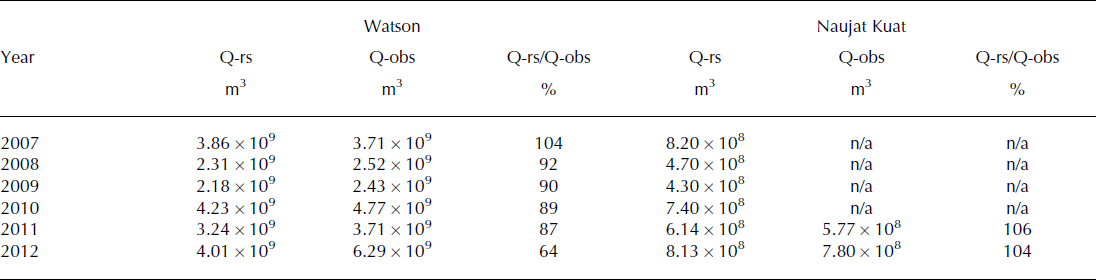
Comparison of total summer discharge volume reconstructed from MODIS data analysis (Q-rs) with the total summer volume from in situ observations (Q-obs) for both the Watson River and the Naujat Kuat River
Combining all available data for the Naujat Kuat River yields the following I–Q relation (Fig. 7b):
Again, the MODIS-based total summer discharge volume is in good agreement with the direct observations of discharge (106% of summer discharge in 2011, and 104% in 2012; Table 3).
For both river systems, we use exponential curves to fit the I–Q relation, representing the braidplain channels rapidly expanding at fairly low river flow initially, then deepening during the highest flow. The I–Q relation for the Watson River underestimates a rare, extreme event (Fig. 7a; Table 3).
Inundation–discharge relation from time-lapse imagery
The time-lapse derived inundation of the Watson River braidplain in 2012 tracks the observed discharge closely (see Supplementary Material (http://igsoc.org/hyperlink/15j012_supp.mp4) for a time-lapse video of Watson River dynamics in summer 2012). A distinct network of a few small channels exists early in the season (17 May 2012; Fig. 6a) before high summer discharge at the end of June 2012 greatly expands the inundation area, but the further increase to discharge during the most extreme flood ever measured in the Watson River only results in a modest increase to inundation area. Waning river flows in late August are reflected once again in a smaller inundated area on the braidplain (Fig. 6d).
Figure 8 shows how the inundation reconstructed from the time-lapse imagery closely matches the observed discharge variation over the summer. The inundation as reconstructed from MODIS imagery captures the overall seasonal pattern, but misses important discharge fluctuations due to periods of cloud cover. The inundation–discharge relations (Fig. 8c) resulting from time-lapse and MODIS imagery specifically for summer 2012 are
As before, these relations are used to predict total summer discharge and are compared to the total summer discharge calculated from the in situ observations. The time-lapse record achieves an 88% match with in situ observations (for 29 May to 22 August 2012), and the total summer discharge reconstructed from the MODIS proxy amounts to 83% of the total volume from in situ observations (for 29 May to 7 September 2012).
(a) Observed discharge, Watson River, 2012. (b) Inundation of Watson braidplain based on time-lapse camera and MODIS. (c) Inundation–discharge relations for both methods for 2012.

The time-lapse record of inundation captures the two large meltwater events (around 12 July and 7 August 2012) more accurately than the MODIS record. This difference can partly be attributed to cloud cover, which prohibits satellite-based estimates altogether, and the low resolution of MODIS band 6 (∼ 500 m). The exceptionally high water level on the braidplain during the flood likely prohibited the common rapid drying of the braidplain sands with decreasing discharge (∼ days 193–200 in Fig. 8). Water-saturated sand has a much lower reflectivity in the near-infrared wavelengths, and thus will contaminate the retrieval and result in an overestimation of river discharge. On the other hand, on a photograph it is considerably easier to classify both dry sand and wet sand as exposed braidplain surface area. Both methods tend to overestimate the discharge in the early part of the summer and underestimate the discharge following peak flow, likely due to adjustment of the channel geometry during peak flow.
Discharge predictions based on MODIS reflectance for 2000–12
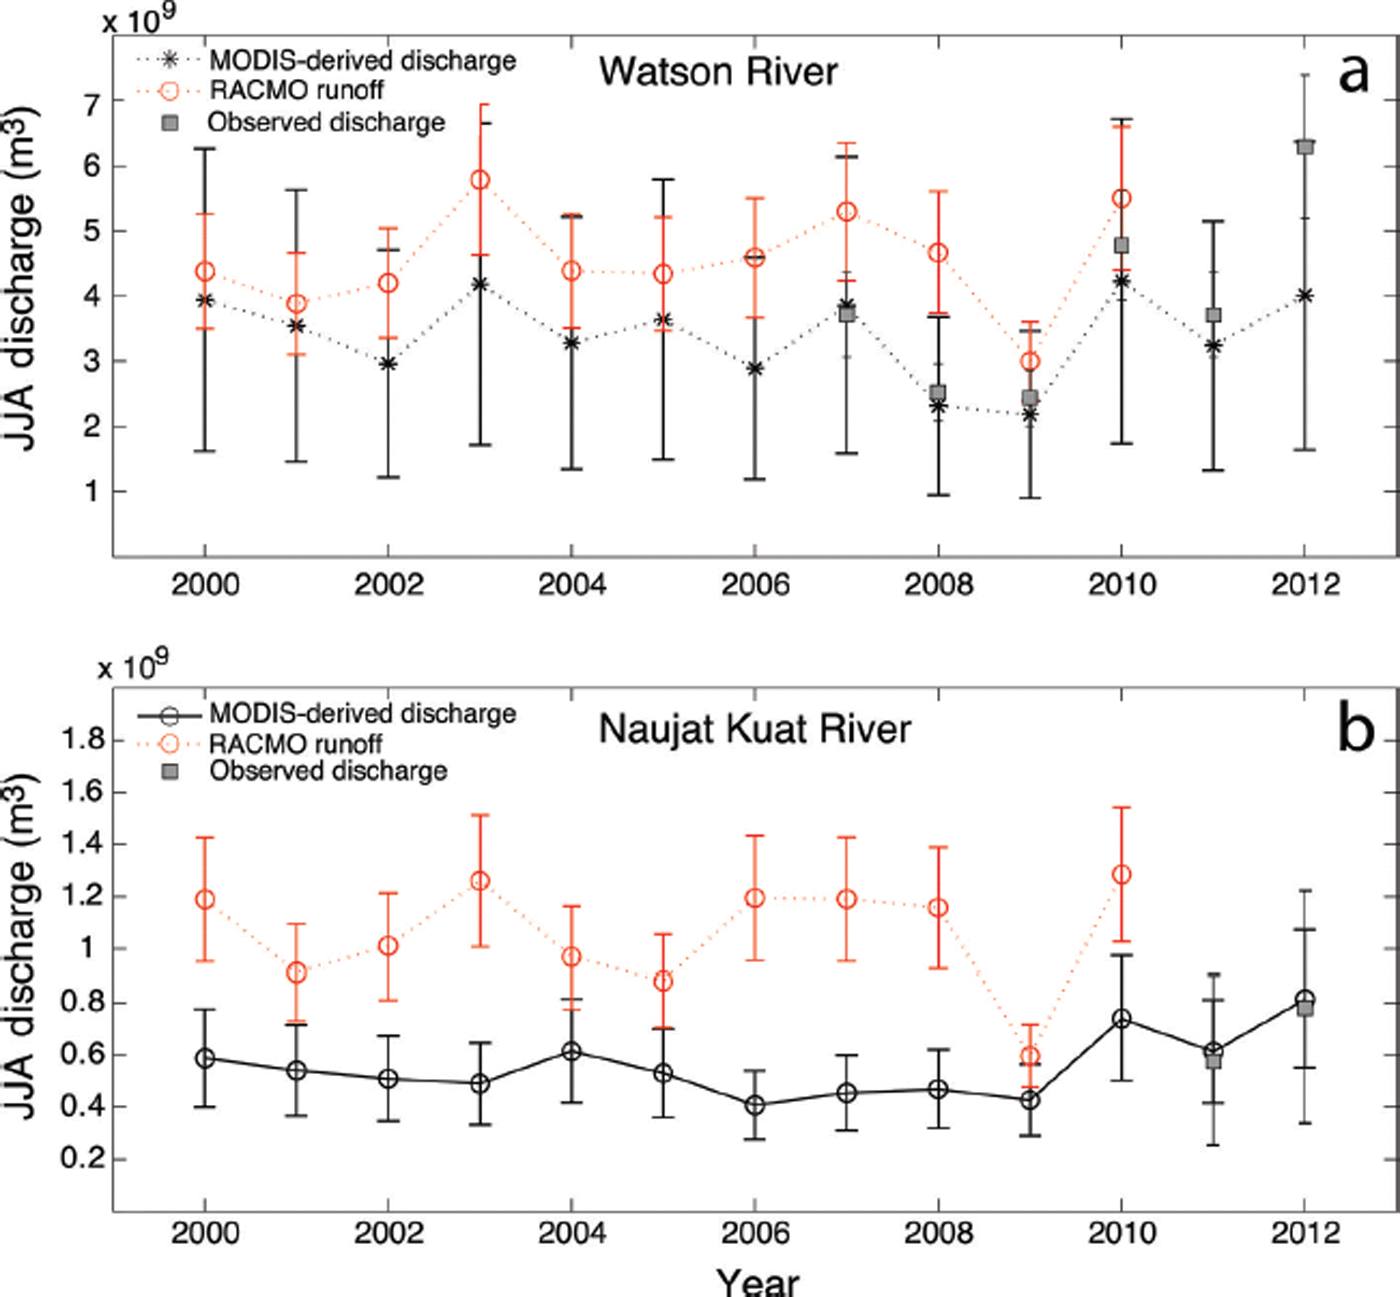
We employed the established relations for both river systems and used all cloud-free MODIS imagery of the 2000–12 record to establish river inundation; we then interpolated between the cloud-free days for all years. Our technique allows for measurement over the snow-free season exclusively, as snow cover greatly affects the MODIS reflectance. To standardize our comparisons, we use the cumulative discharge over days 150–250 (29 May to 7 September) of each year. Figure 9 depicts the time series of reconstructed total summer discharge for the Watson and Naujat Kuat Rivers, with the estimated errors based on the established I–Q relations. Known warm years with expected high discharges, like 2007 (+15%), 2010 (+ 26%) and 2012 (+20%), are indeed high river discharge years as observed by satellite. However, high discharge also occurred at the Watson River in the early 2000s, most notably in 2000 (+17%) and 2003 (+25%). The interannual variation is less pronounced at the Naujat Kuat River, but 2000 (+12%), 2010 (+22%) and 2012 (+31%) are all high-discharge summers in this river system. Notably, total summer discharge shows no significant upward trend over the 12 year record, neither for the Watson River nor for the Naujat Kuat River.
Time series of total summer discharge over June–July and August for 2000–12 reconstructed from MODIS-derived inundation, and established inundation–discharge relations. Neither river system shows a significant trend over the period of MODIS observations.

Annual discharge in comparison to modeled meltwater runoff for 2000–12
We contrast the trends of the 1958–2010 RACMO2/GR modeled meltwater runoff and the 2000–10 MODIS-derived river discharge. Figure 10 shows the long-term increase in modeled summer meltwater runoff for both river outlets. According to RACMO2/GR, summer meltwater flux increased +4.7% per decade for the outlet cell near the Watson River, while the outlet co-located with the Naujat Kuat River increased +4.4% per decade. Over 2000–10, meltwater generated in the Watson drainage increased to +7.9% per decade, whereas meltwater generated in the Naujat Kuat drainage increased to +4.7% per decade, relatively similar to its long-term average.
Long-term RACMO2/GR model estimates of total meltwater runoff over June–July–August (JJA) for two river catchments over 1958–2010 (Reference Bamber, Van den Broeke, Ettema, Lenaerts and RignotBamber and others, 2012). Trend lines are calculated over the entire long-term data record and, for 2000–10, the time period covered by MODIS observations. Note the acceleration of GrIS surface melt draining through the Watson River over the 2000s compared to the long-term increase. In contrast, the increases in surface meltwater draining through the Naujat Kuat River have remained constant.

The comparison of RACMO2/GR estimates with MODIS-reconstructed cumulative river discharge for 2000–10 shows interannual variation is comparable, indicating that the two methods independently capture variability in water flux between years (Fig. 11). RACMO2/GR predicts a consistently (on average, 38%) higher summer meltwater flux for the Watson River catchment than the river discharge reconstructions would suggest. This discrepancy is also evident for the Naujat Kuat River catchment, and possibly even larger.
Comparison of RACMO2 modeled surface meltwater fluxes over June–July–August with MODIS-derived river discharge over 2000–12.
Discussion
Our analysis shows that remotely sensed MODIS band 6 data can be successfully used to extend summer discharge for Greenland proglacial river systems far beyond what is available from short-term in situ observations, and that MODIS-derived summer discharges closely match observed discharge totals. Interannual variability of the MODIS-derived estimates over the last decade matches the pattern of modeled meltwater runoff for co-located outlets.
The newly developed remote-sensing technique has inherent limitations: (1) cloud cover results in significant periods of missing data; (2) snow on the river braidplain perturbs MODIS reflectance and thus limits the method to snow-free periods; (3) incision and avulsion of anabranching channels alter inundation–discharge relations, resulting in a scattered response over the aggregated datasets; and
(4) during high flow, narrow braidplains can become entirely flooded, at which point further increases in discharge no longer increase the inundation area and are therefore ‘invisible’ to the satellite. The extreme melt year of 2012 provided a clear example of such flooding for the Watson River system, making this limitation of the technique more apparent.
The MODIS-derived discharge estimates for each individual day for either river catchment have a large uncertainty, as calculated from the REE in the inundation–discharge relations (Fig. 9). However, the comparison of the total summer river discharge from the MODIS-based reconstructions with the total observed discharge totals shows a good match (Fig. 11) and provides support for the significant difference between the reconstructed river discharge and modeled runoff (Fig. 11).
Other satellite sensors can be used to avoid some of the described difficulties of the MODIS sensors in measuring river inundation from space (Reference SmithSmith, 1997). For example, the Advanced Microwave Scanning Radiometer – Earth Observing System (AMSR-E) is used to map inundation in large Arctic river systems (Reference Brakenridge, Nghiem, Anderson and MicBrakenridge and others, 2007). It has the distinct advantage of using the microwave brightness temperature, which is not hampered by cloud cover. However, the AMSR-E sensor provides a low-resolution product (typical pixel dimension is 12.5–25 km) and is thus less applicable for river systems bounded by narrow fjords. Analysis of near-infrared wavelength Landsat 7 archival imagery (1999–2013) provides high-resolution inundation maps and allows much more detailed spatial mapping of individual river channels and activation of certain outlets at distinct glacier snout locations, but this imagery is limited to on average about three images per summer (Reference HudsonHudson, 2015). The development of quantitative remote sensing of river discharge is currently undergoing rapid innovation (Reference Gleason and SmithGleason and Smith, 2014), and application to all major Greenland rivers is now a possibility.
Conclusions
We hindcast summer discharge for two rivers along the west GrIS margin over the last 13 years. These results considerably lengthen available time series, from 2007 for the Watson River and 2011 for the Naujat Kuat River. Neither river shows a significant upward trend in discharge over the last decade, although this may be partly caused by the technique missing the highest discharge events. While 2010 and 2012 do stand out as high discharge years, our proxy data indicate that equivalently high discharge occurred in 2000 and 2003.
Comparison between reconstructed river discharge and modeled RACMO2/GR meltwater runoff for both catchments reveals that while patterns of interannual variability are in good agreement, the RACMO2/GR estimates are consistently higher than both in situ (Reference Hasholt, Mikkelsen, Nielsen and LarsenHasholt and others, 2013) and MODIS-derived discharge. This discrepancy could be related to the problematic delineation of on-ice catchments and possible ‘leakage’ to unresolved bedrock-controlled pathways, but there are other possible mechanisms worth exploring.
For instance, a time delay of over a month could exist between melt production and release at the ice margin (Reference RennermalmRennermalm and others, 2013). RACMO2/GR has no lag between melt and runoff, nor any englacial routing. We cannot entirely disregard this mechanism since the MODIS reconstructions are limited to the snow-free season, generally early September in West Greenland. However, in September–October 2007–11, the measured river discharge was far too low to account for a delayed drainage of as much as ∼40% of the June–July–August total water volumes.
The fact that the discrepancy is greater in warmer years, but the stored water volume stays in the same relative range over the 13 year period, suggests a net overestimation of runoff draining the ice sheet. That RACMO2/GR does not model evaporation of meltwater could cause the observed bias. Recently, however, large meltwater storage components have been observed in the snow and firn of the percolation zone (Reference Harper, Humphrey, Pfeffer, Brown and FettweissHarper and others, 2012; Reference ForsterForster and others, 2014), and these could likely be an explanation for the discrepancies between modeled runoff and observed river discharge. RACMO2/GR includes water retention and refreezing components, but it is possible that there is greater englacial and subglacial storage and snowpack retention during the melt season than is estimated within the model. It is noteworthy that neither catchment shows a change in the discrepancy over the last 13 years. A decrease of the storage component might be expected as the aquifer gradually saturates, especially since both catchments have little to no area above the ELA, but we have yet to find any changes to the storage component.
Despite the inherent limitations and uncertainties of the satellite-derived river discharge records, they allow us to investigate ice-sheet drainage mechanisms in more detail. Specifically, they allow independent assessment of meltwater runoff and have implications for our understanding of surface meltwater, on-ice aquifers and the pathways of meltwater to the global ocean.
Acknowledgements
This study was funded through US National Science Foundation Office of Polar Programs (NSF-OPP) Award 0909349 and NASA-NEWS (NNX13AC38G). We thank CH2M HILL Polar Field Services for logistic support. Michael Rosing contributed local expertise to the field study at the Naujat Kuat River. Ursula Rick, Aaron Zettler-Mann, Katherine Barnhart, Albert Kettner and Leif Anderson assisted with fieldwork. We thank Jason Kean for sharing his stage–discharge model, and Janneke Ettema and Michiel van der Broeke for sharing the RACMO2 model results. Larry Smith and an anonymous reviewer provided valuable suggestions.


