


Introduction
Barley (Hordeum vulgare L.) is the fourth most important cereal crop in the world after wheat, rice and corn, which is produced in more than 100 countries (Giraldo et al., Reference Giraldo, Benavente, Manzano-Agugliaro and Gimenez2019). Barley can be successfully cultivated in adverse climatic conditions of drought, salinity and alkalinity. It is usually used as human food and animal feed and is superior to wheat because it does not contain gluten (Chandra et al., Reference Chandra, Khippal, Prajapat, Barman, Singh, Rai, Ahlawat, Verma, Kumari and Singh2023). In Iran, barley ranks second after wheat, both in terms of area (1.75 million hectares) and production (3.2 million tons). However, the current production status meets only about 50% of Iran’s barley grain demands and is globally recognised as one of the largest barley importers in recent years (Alasti et al., Reference Alasti, Zeinali, Soltani and Torabi2022). Iran is climatically located in arid and semi-arid regions, in which the most covered soils of the lands have deficiency and surplus in organic matter and salinity (EC>4 dS/m), respectively (Madani et al., Reference Madani, Hashemi and Azadi2016). Therefore, in such a stressful environment, the use of stress-tolerant crops such as barley is inevitable. However, to develop new cultivars in breeding programmes that can address the needs of farmers, industry and consumers, they should have high performance along with good quality. Assessing the performance and stability of new genotypes in variable rainfed environments is an urgent need to increase the climate change resilience of crops (Laidig et al., Reference Laidig, Piepho, Rentel, Drobek, Meyer and Huesken2017). The evaluation performance of new genotypes in in-station conditions is usually under control (i.e. proper crop management). Thus, based on the type of applied technologies and management, the results of management methods may be very different in in-station from those conducted in on-farm conditions. However, on-farm trials can provide farmers with useful practical information about crop management (Tanaka, Reference Tanaka2021). Previous research results indicated a high difference between the output of in-station and on-farm trials, which should be addressed in breeding programmes (Morris and Bellon, Reference Morris and Bellon2004; Clarke et al., Reference Clarke, Clarke and Pozniak2010; Mohammadi et al., Reference Mohammadi, Abdolahi, Mohammadi, Elahi and Yari2016; Beres et al., Reference Beres, Rahmani, Clarke, Grassini, Pozniak, Geddes, Porker, May and Ransom2020).
In Iran, barley is cultivated on about 1.5 million ha, and out of this, about one million ha is under dryland agriculture, which is being challenged by unpredictable extreme weather conditions, and these occurrences have become more frequent in recent years. However, very limited research has been conducted to address the agronomic performance of wheat cultivars under CA in dryland conditions to explore genotype by tillage interactions and to recommend appropriate CA packages in dryland agricultural systems in Iran.
Roohi et al. (Reference Roohi, Mohammadi, Niane, Niazian and Niedbała2022) in a three-year study of barley in Iran reported that rainfed barley genotypes under CA system produced yields equal to, or better than, the conventional tillage (CT), while the reduced tillage (RT) system decreased their performance by 4.9%. In a meta-analysis conducted by Van den Putte et al. (Reference Van den Putte, Govers, Diels, Gillijns and Demuzerea2010), the effects of NT and CT on grain yield in different crop species, including spring and winter barley at 47 European sites, were studied. They reported a reduction in grain yield in NT compared to CT and attributed this reduction to inappropriate crop rotation and the use of fewer inputs. Similarly, a literature review based on studies conducted by Ogle et al. (Reference Ogle, Swan and Paustian2012) reported that crop productivity can be reduced in NT, particularly in wet climate conditions. Fischer et al. (Reference Fischer, Santiveri and Vidal2002) with wheat in Mexico and Yau et al. (Reference Yau, Sidahmed and Haidar2010) with barley, chickpea and safflower in Lebanon found that the effects of various tillage treatments varied markedly with years and crops. Morell et al. (Reference Morell, Lampurlanes, Alvaro-Fuentes and Cantero-Martinez2011), in a 14-year study of barley in Spain, reported higher mean yields under NT compared to CT in dry seasons. In a three-year study in Iran, Mohammadi et al. (Reference Mohammadi, Jalal Kamali and Gathala2021) found wheat cultivars, depending on the year and rotation, performed better in CT than in NT, with grain yield superiority varying from 4 to 35%. Mrabet et al. (Reference Mrabet, Moussadek, Fadlaoui and van Ranst2012) found superior yields for wheat (up to 146% higher) in rotation with chickpeas and lentils under NT compared to CT. Significant genotype × tillage interactions have been reported on wheat (Honsdorf et al., Reference Honsdorf, Mulvaney, Singh, Ammar, Burgueño, Govaerts and Verhulst2018; Ruisi et al., Reference Ruisi, Saia, Badagliacca, Amato, Frenda, Giambalvo and Di Miceli2016; Mohammadi et al., Reference Mohammadi, Jalal Kamali and Gathala2021). Trethowan et al. (Reference Trethowan, Mahmood, Zulfiqar, Oldach and Gutierrez Garcia2012) demonstrated that wheat grain and straw quality were affected by the tillage interaction with genotype, while some studies reported no significant genotype × tillage interactions in wheat (Carr et al., Reference Carr, Horsley and Poland2003; Khorami et al., Reference Khorami, Kazemeini, Afzalinia and Gathala2018). Most of the crop improvement programmes are carried out utilising CT; thus, cultivars improved for CT conditions may not show better performance under conservation agriculture (CA) conditions (Kumudini et al., Reference Kumudini, Grabau, Van Sanford and Omielan2008; Newton et al., Reference Newton, Guy, Bengough, Gordon, McKenzie, Sun, Valentine and Hallett2012; Knapp and van der Heijden, Reference Knapp and van der Heijden2018; Mohammadi et al., Reference Mohammadi, Jalal Kamali and Gathala2021). To fully benefit from CA, it is needed to improve adapted cultivars to CA (Joshi et al., Reference Joshi, Chand, Arun, Singh and Ortiz2007; Kumar et al., Reference Kumar, Singh, Piggen, Haddad, Ahmad and Kumar2011; Herrera et al., Reference Herrera, Verhulst, Trethowan, Stamp and Govaerts2013). All these results indicate that the yield response to tillage methods for different crop varieties is not that simple. Factors such as genetics, environment and management play an essential role in crop performance under CA conditions.
However, little is known about genotype × tillage interaction for rainfed barley under different tillage management, particularly in farmers fields. Thus, this study aimed to answer this question whether the released cultivars under CT system in-station can be recommended also for CA in farmers’ conditions. The other objectives were to (i) evaluate the agronomic performance of barley genotypes under different tillage systems in farmers’ fields; (ii) identify traits linked to improved yield under different tillage systems that can be targeted by breeding programmes and (iii) to provide suggestions to help farmers use resources more efficiently and sustainably for the agronomic practices considering environmental issues.
Materials and methods
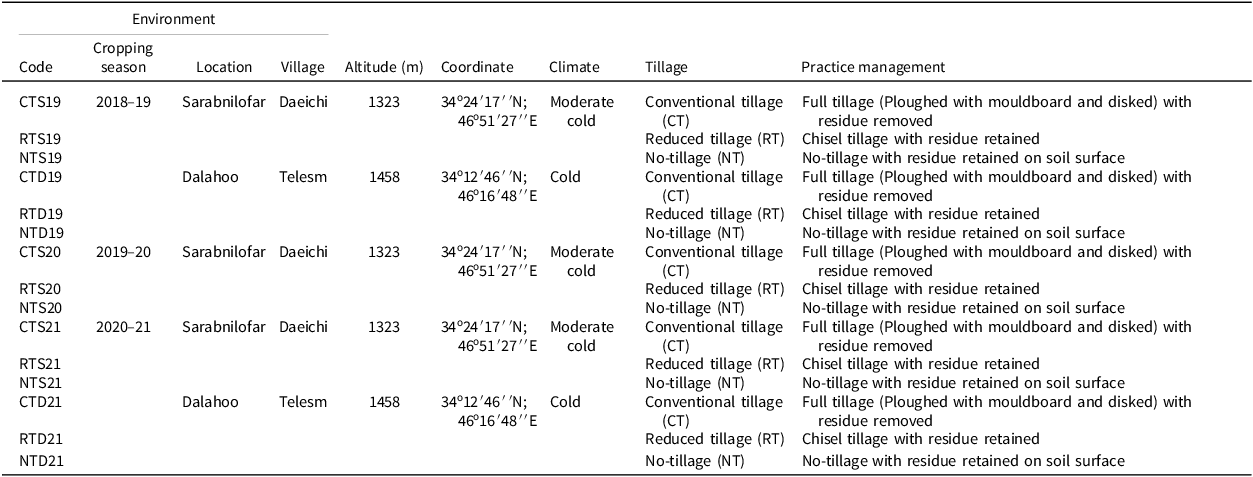
Five barley genotypes, consisting of four cultivars (Abidar, Sararood1 and Nader originated from Iran and Efes-3 originated from Turkey) and one advanced breeding line (Yea168.4/Ywa605.5… originated from ICARDA), were investigated for their agronomic performances under three tillage systems of CT (mouldboard ploughing), RT (chiselling ploughing with residue cover) and NT (no-tillage with residue cover) in farmers’ fields conditions across two locations of Sarabnilofar and Dalahoo, Kermanshah province in western Iran, and three growing seasons (2018–21). More details on treatments and environments are presented in Table 1. The trials were planted in fields that were cropped with chickpeas last season. The experiment was a split-plot design in each location. Genotypes as sub-plots were planted in the three tillage methods as main plots. Each experimental plot had 13 rows with a length of 35 metres, and the distance between rows was 17.5 cm (79.6 m2). Askeh-2020, a no-till planter, was used for planting plots in the three systems. The plant density for each variety was 400 seeds per square metre, and the planting date was early October. Weeds were controlled with herbicide applications, followed by hand-weeding, if needed. At planting, 100 kg/ha of both urea (46% N) and superphosphate (46% P2O5) fertilisers were applied.
Description of test environments (tillage system-location-year) in the study
Descriptive statistics for traits studied of barley genotypes under different tillage systems, locations and years
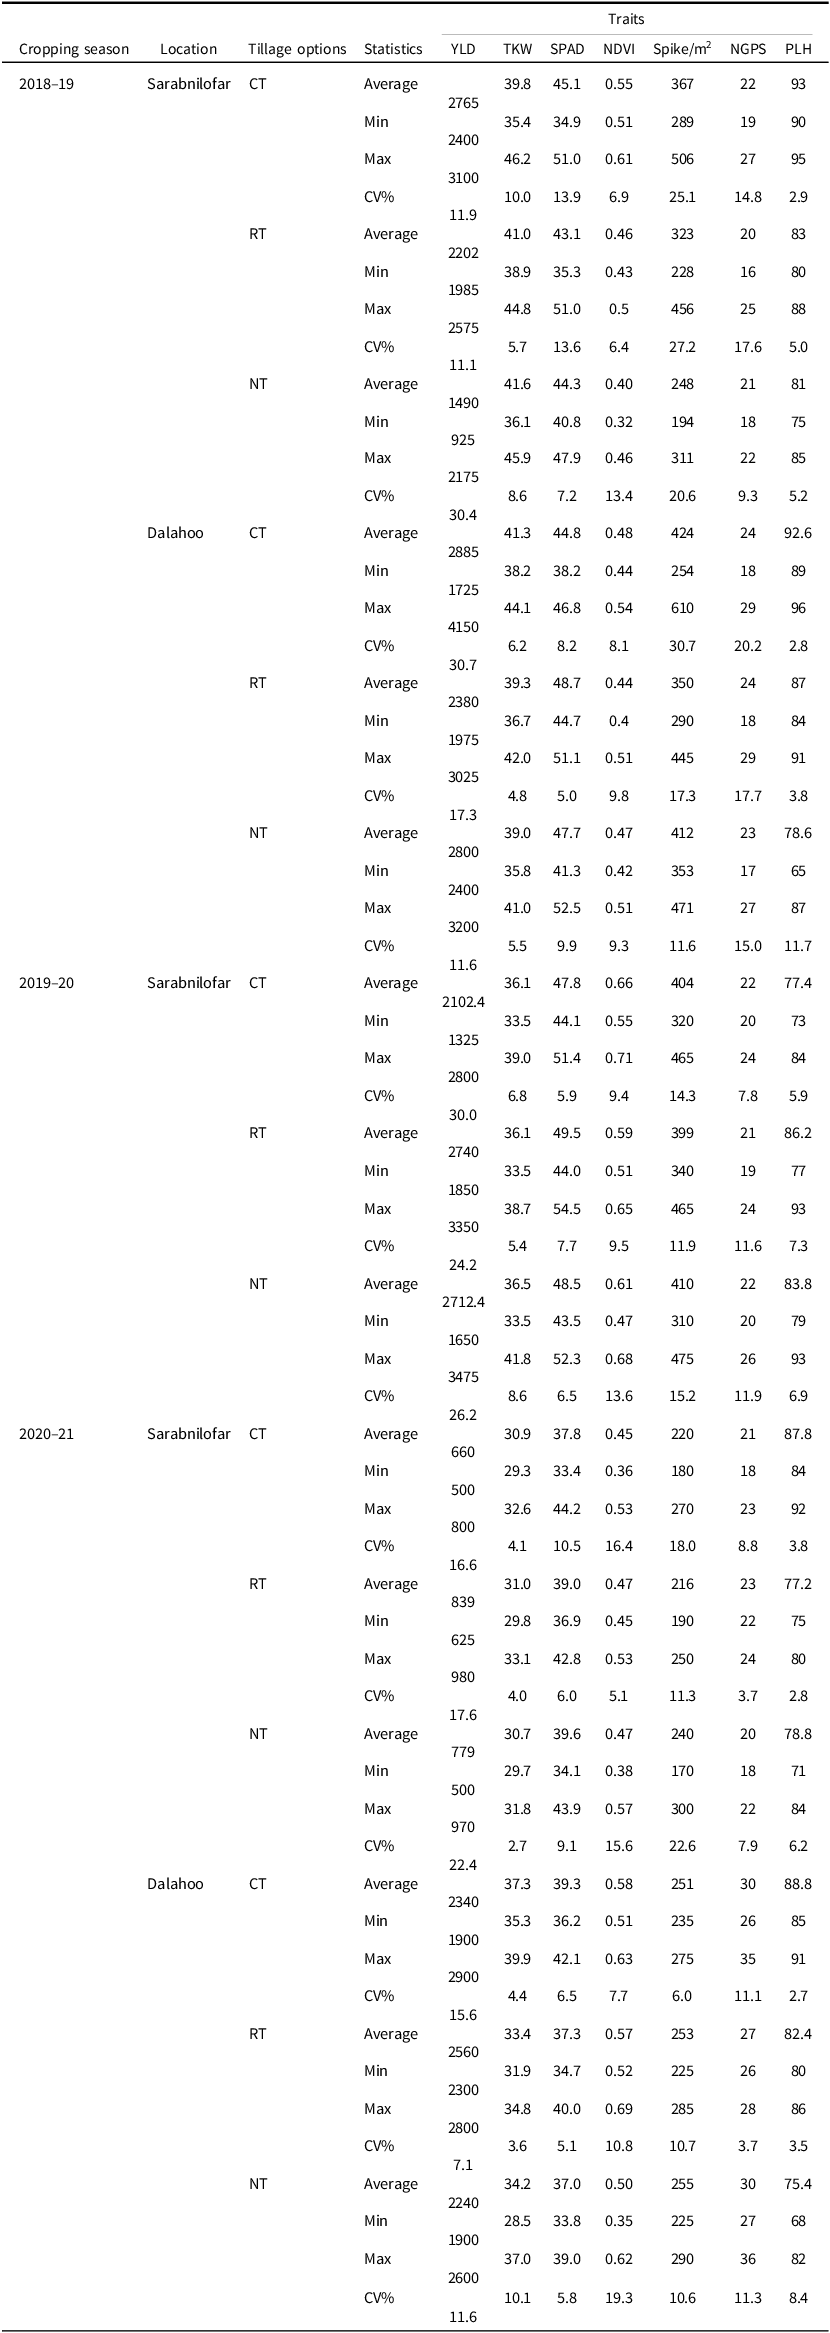
CT: conventional tillage; RT: reduced tillage; CA: no-tillage; Min: minimum, Max: maximum, CV: coefficient of variation
YLD: grain yield; TKW: 1000-kernel weight; SPAD: SPAD reading (chlorophyll content); NDVI: normalised difference vegetation index; Spike/m2: number of spikes per square metre; NGPS: number of grains per spike; PLH: plant height
The normalised difference vegetation index (NDVI) was recorded at the anthesis stage (175 days after planting) for each plot using a Trimble GreenSeeker handheld crop sensor. SPAD reading was measured for three randomly flag leaves at the anthesis stage for each genotype using a chlorophyll metre (Minolta Co. Ltd., Tokyo, Japan). At the physiological maturity stage (210 days after planting), for three randomly selected plants, plant height (PLH) was recorded as the height of the main stem of the plant from the soil surface to the tip of the spike in centimetres (cm). Number of grains per spike (NGPS) was recorded based on five randomly selected spikes per plot at the maturity stage. The number of spikes per square metre (spike/m2) was counted from 3 samples per one square metre for each combined treatment (genotypes × tillage methods) and 1000-kernel weight (TKW) was calculated for each combined treatment. After the ripening stage, grain yield was measured by harvesting five random samples of 1 × 2 square metres from the treatments. The grain yield was measured in kilograms (kg) per plot and then converted to kg per hectare (kg ha−1).
The collected data were first checked for outliers and normality before statistical analysis. Several basic statistics, such as minimum, maximum, mean and coefficient of variation (CV%), were used to explain the phenotypic variability for the testing genotypes in each tillage method, year, and locations. The variation and distribution of phenotypic values of the studied characteristics were summarised in box plots which presented the distribution of data using the mean, minimum, maximum, and 1st and 3rd quartile values in the 5th and 95th percentiles after removing outliers. Box plots were made in Excel. Genotype-by-trait (GT)-biplot analysis, as described by Yan and Rajcan (Reference Yan and Rajcan2002), was used to graphically analyse the GT data in each environment and to assess trait relationships and trait characteristics of genotypes in each and across tillage systems. The enotype and genotype by environment (GGE) biplot, as described by Yan and Tinker (Reference Yan and Tinker2006), was applied to investigate the adaptation of genotypes to different tillage systems and the stability performance of genotypes in different environments. The GT-biplot and GGE-biplot analyses were performed using the package of GEA-R (Pacheco et al., Reference Pacheco, Vargas, Alvarado, Rodríguez, Crossa and Burgueño2016).
Results
Weather conditions
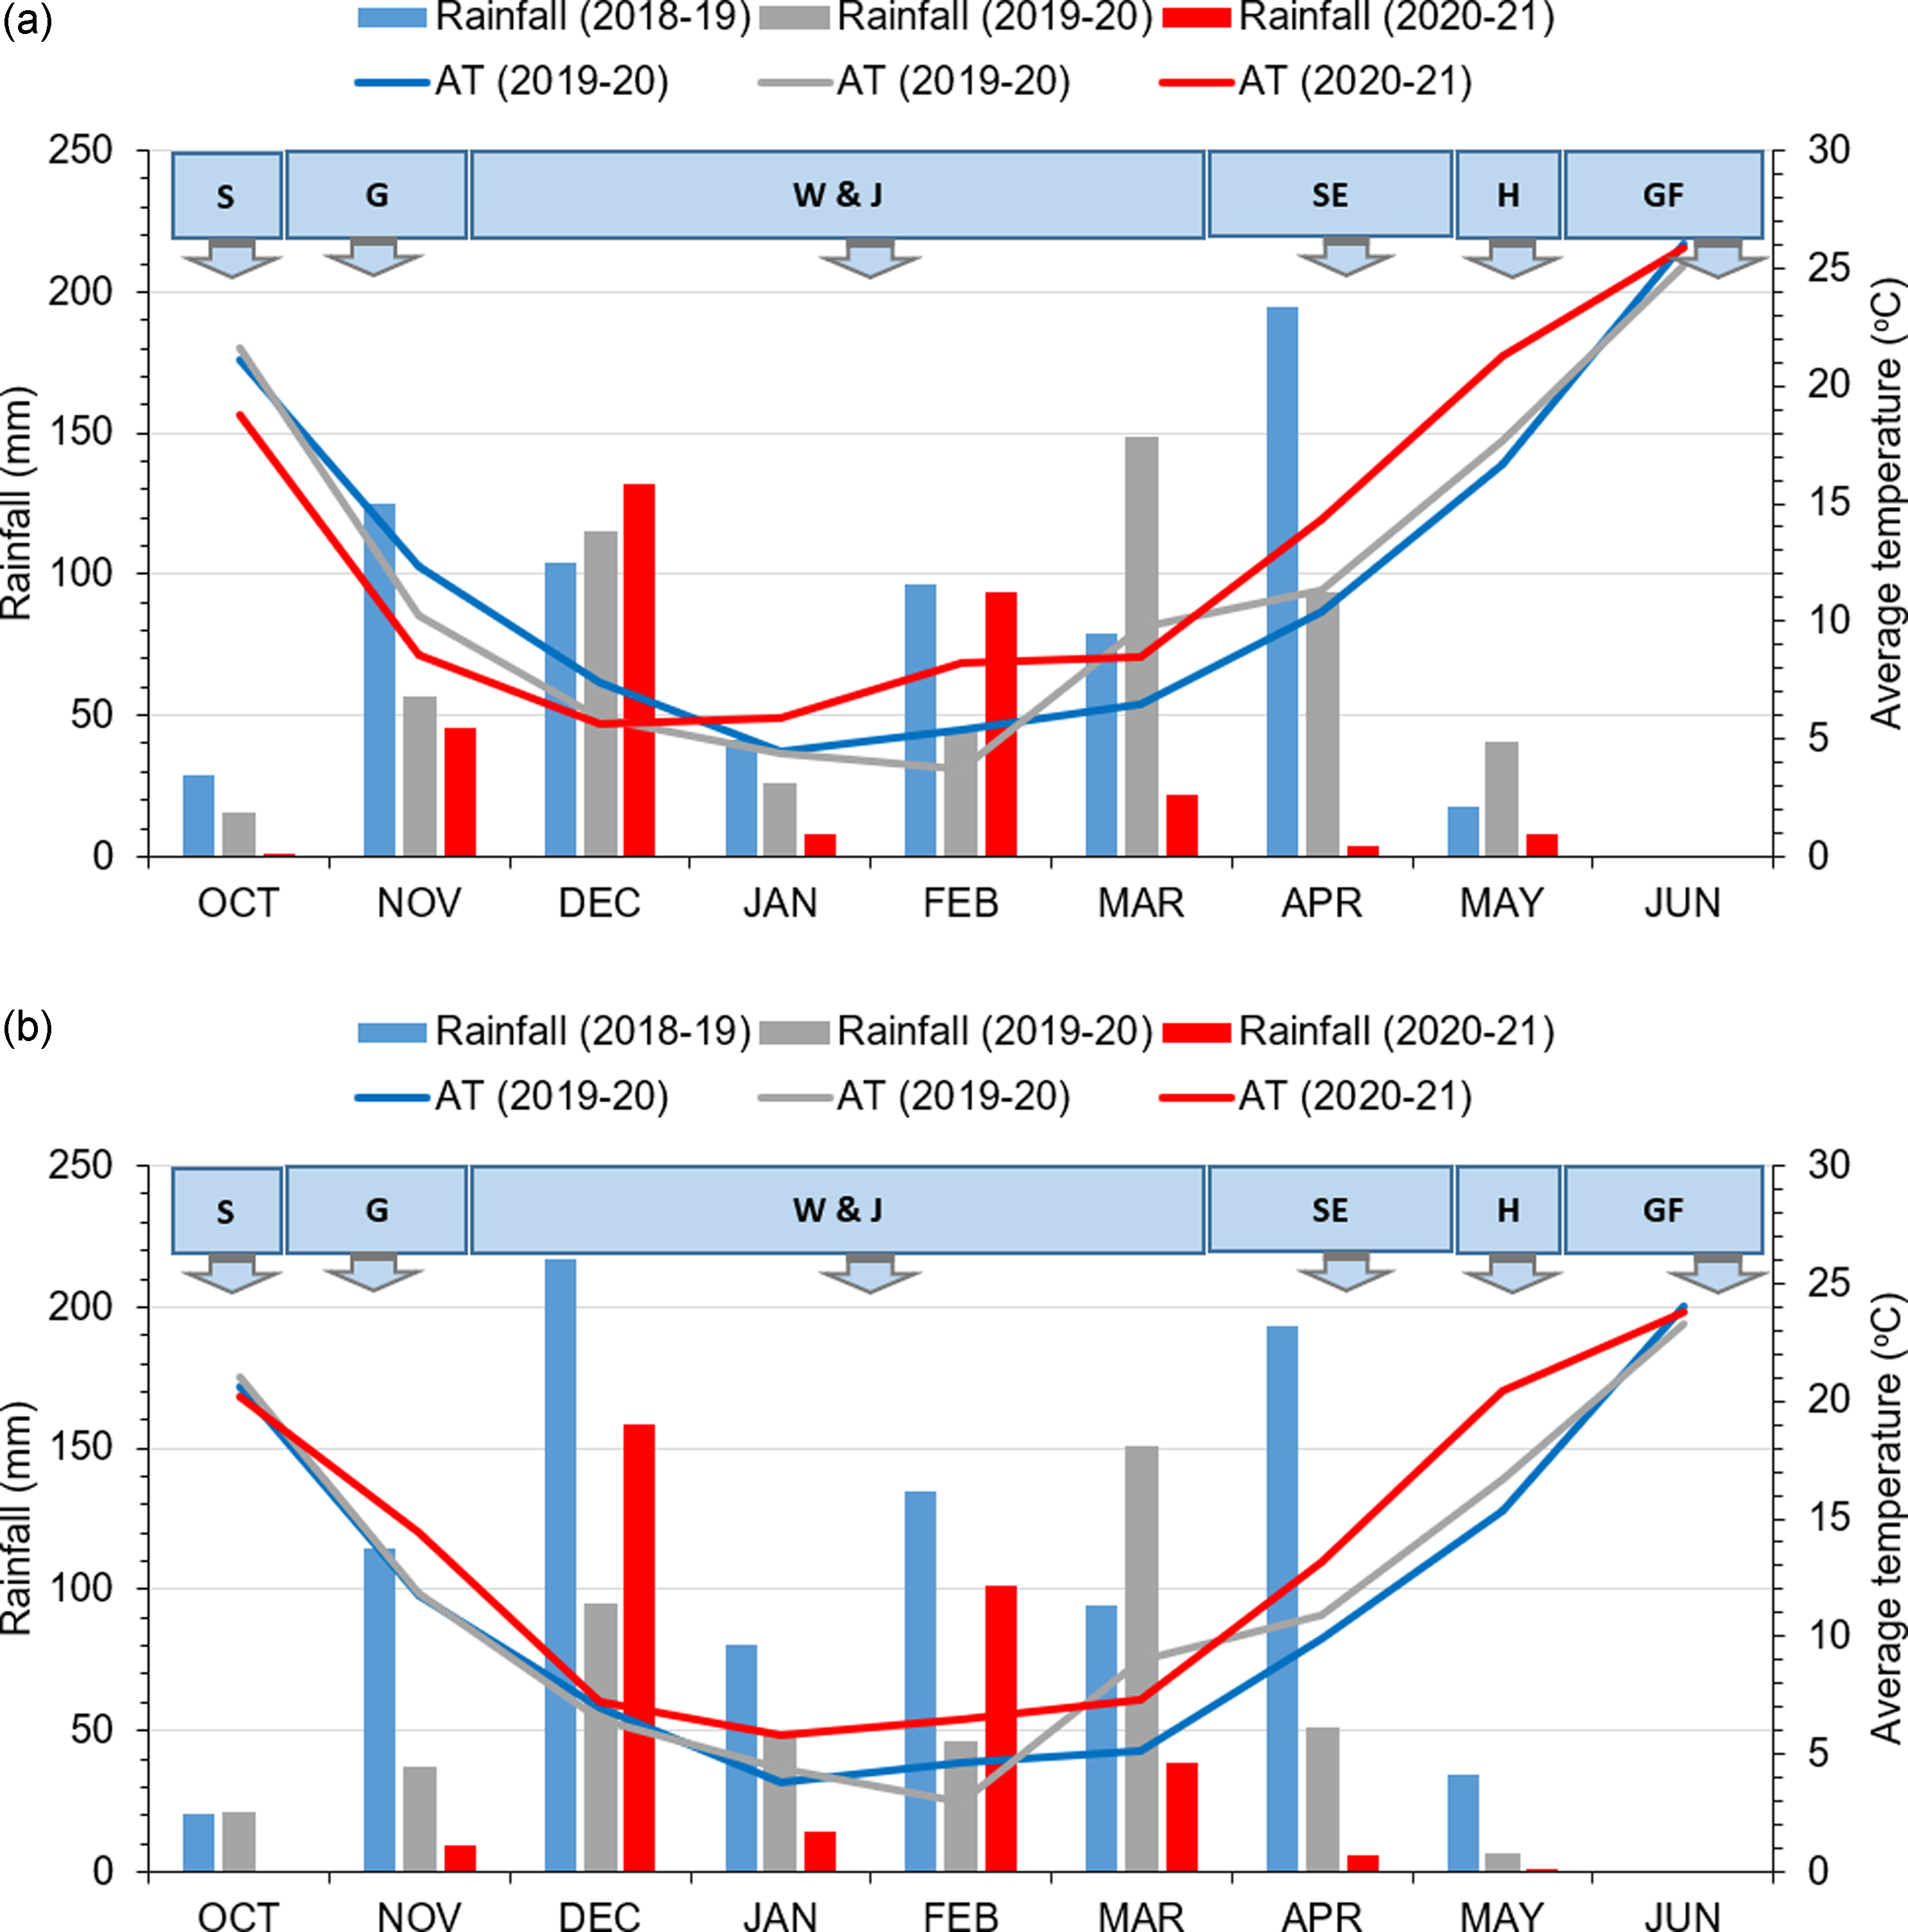
The amount and distribution of monthly rainfall were remarkably varied between locations and during the growing seasons, which resulted in different growth circumstances and the wide range observed for grain yields and other studied traits at each location (Figure 1). The year 2020–21 was the driest with precipitation equal to 313 mm in Sarabnilofar and 328 mm in Dalahoo, while the highest amount of precipitation was recorded in 2018–19 with 688 mm in Sarabnilofar and 909 mm in Dalahoo. In 2019–20, the crops in Dalahoo received 454 mm of rainfall, which was slightly lower than the average long-term annual precipitation, and the crops in Sarabnilofar received 537 mm, which was higher than the long-term average annual precipitation. However, no precipitation occurred in June when the crop plants were in the grain-filling stage. Thus, the crop is faced with water stress until harvest. However, most of the rainfall was received in winter in all three growing seasons, which coincided with plant growth inactivity. No marked changes in monthly average temperature were observed over the years, but the stage of grain filling coincided with high daily temperature and high terminal drought stress (Figure 1).
Monthly rainfall distribution and average temperature (AT) in Sarabnilofar (a) and Dalahoo (b) locations across three cropping seasons. S: sowing; G: germination; W: wintering; J: jointing; SE: stem elongation; H: heading; GF: grain filling.
Descriptive of traits data in tillage methods/locations/years
Descriptive of traits studied for barley genotypes are presented in Table 2. In 2018–19 in Sarabnilofar location, the maximum CV% was for grain yield under NT followed by the number of spikes under RT and CT. The lowest CV% was for PLH in all three tillage methods. The order of ranked for mean yield for tillage methods was CT, RT and NT, with average values of 2765, 2202 and 1490 kg/ha, respectively. The highest TKW was expressed by genotypes under NT, followed by RT and CT. The highest SPAD, NDVI, spike/m2, NGPS, and PLH were observed for genotypes under CT.
In 2018–19 in Dalahoo, the highest CV% (30.7%) was recorded for grain yield and spike/m2 under CT, and for NGPS under CT (20.2) and RT (17.7%). Genotypes performed well under CT (2885 kg/ha), followed by NT (2800 kg/ha) and RT (2380 kg/ha). Genotypes in CT showed the highest TKW, NDVI, number of spikes and PLH, while the best SPAD was observed under RT, followed by NT and CT and genotypes in CT and RT had the best NGPS.
In 2019–2020 in Sarabnilofar, grain yield in all tillage methods had the maximum CV% ranging between 24.2% and 30.0%, while TKW, SPAD and PLH in all tillage managements had the minimum CV%. Genotypes under RT showed the highest mean yield (2740 kg/ha) and then, NT (2712 kg/ha) and CT (2102 kg/ha) ranked 2nd and 3rd. TKW was the highest (36.5 g) under NT, while it was the same for genotypes under RT and CT (36.1 g). The number of spikes for genotypes was the highest under NT and the lowest under RT. Genotypes exhibited highest NDVI in CT, followed by NT and RT, while showing the highest plant stature under RT, followed by NT and CT.
In 2020–21, in the location of Sarabnilofar, spike/m2 showed the highest CV% (30.4%) under NT, while under RT and CT, grain yield (17.6%) and spike/m2 (18.0%), respectively, showed the highest CV%. Genotypes expressed the highest mean yield under CT (2765 kg/ha), followed by RT (2202 kg/ha) and NT (1490 kg/ha). The highest TKW was recorded under NT (41.6 g), followed by RT (41.0 g) and CT (39.8 g). Genotypes expressed the highest values for SPAD, NDVI, number of spikes, NGPS and PLH under CT.
In 2020–21, CV% was the highest for NDVI (19/3%) under NT in Dalahoo, followed by grain yield under CT (15.6%) and NT (11.6%). CV% was lowest for PLH (2.7%) under CT, followed by PLH (3.5%) and TKW (3.6%) under RT. Genotypes showed the highest mean performance in RT (2560 kg/ha), and then followed by CT (2340 kg/ha) and NT (2240 kg/ha). In CT condition, TKW, SPAD, and NDVI for the genotypes were the highest. Spike/m2 was the highest under NT, while NGPS was highest under CT and NT, and the highest plant stature was recorded for genotypes under RT.
Distribution of phenotypic variation in traits studied
Figure 2 presents the distribution of phenotypic values in traits studied among barley genotypes, tillage options, locations and years. The response of genotypes to different treatments was varied. Breeding line Yea168 expressed the highest mean yield, while Abidar exhibited the lowest value (Figure 2a). The highest grain yield was recorded in CT (2150 kg/ha), followed by RT (2144 kg/ha) and NT (2004 kg/ha). Grain yield for genotypes was higher in Dalahoo than in Sarabnilofar location. Genotypes exhibited the lowest mean performance in the third growing season as they received lower rainfall and were exposed to severe drought stress (Figure 1), but in the first and second growing seasons, genotypes performed well but did not have a significant difference in grain yield.
Box plots based on traits studied for genotypes, tillage options, locations and years. The box range denotes the interquartile range, with the line in the middle of the box denoting the median. Both whiskers denote a quarter of the sample each. Cross points referred to the mean values. CT: conventional tillage; RT: reduced tillage; CA: no-tillage.
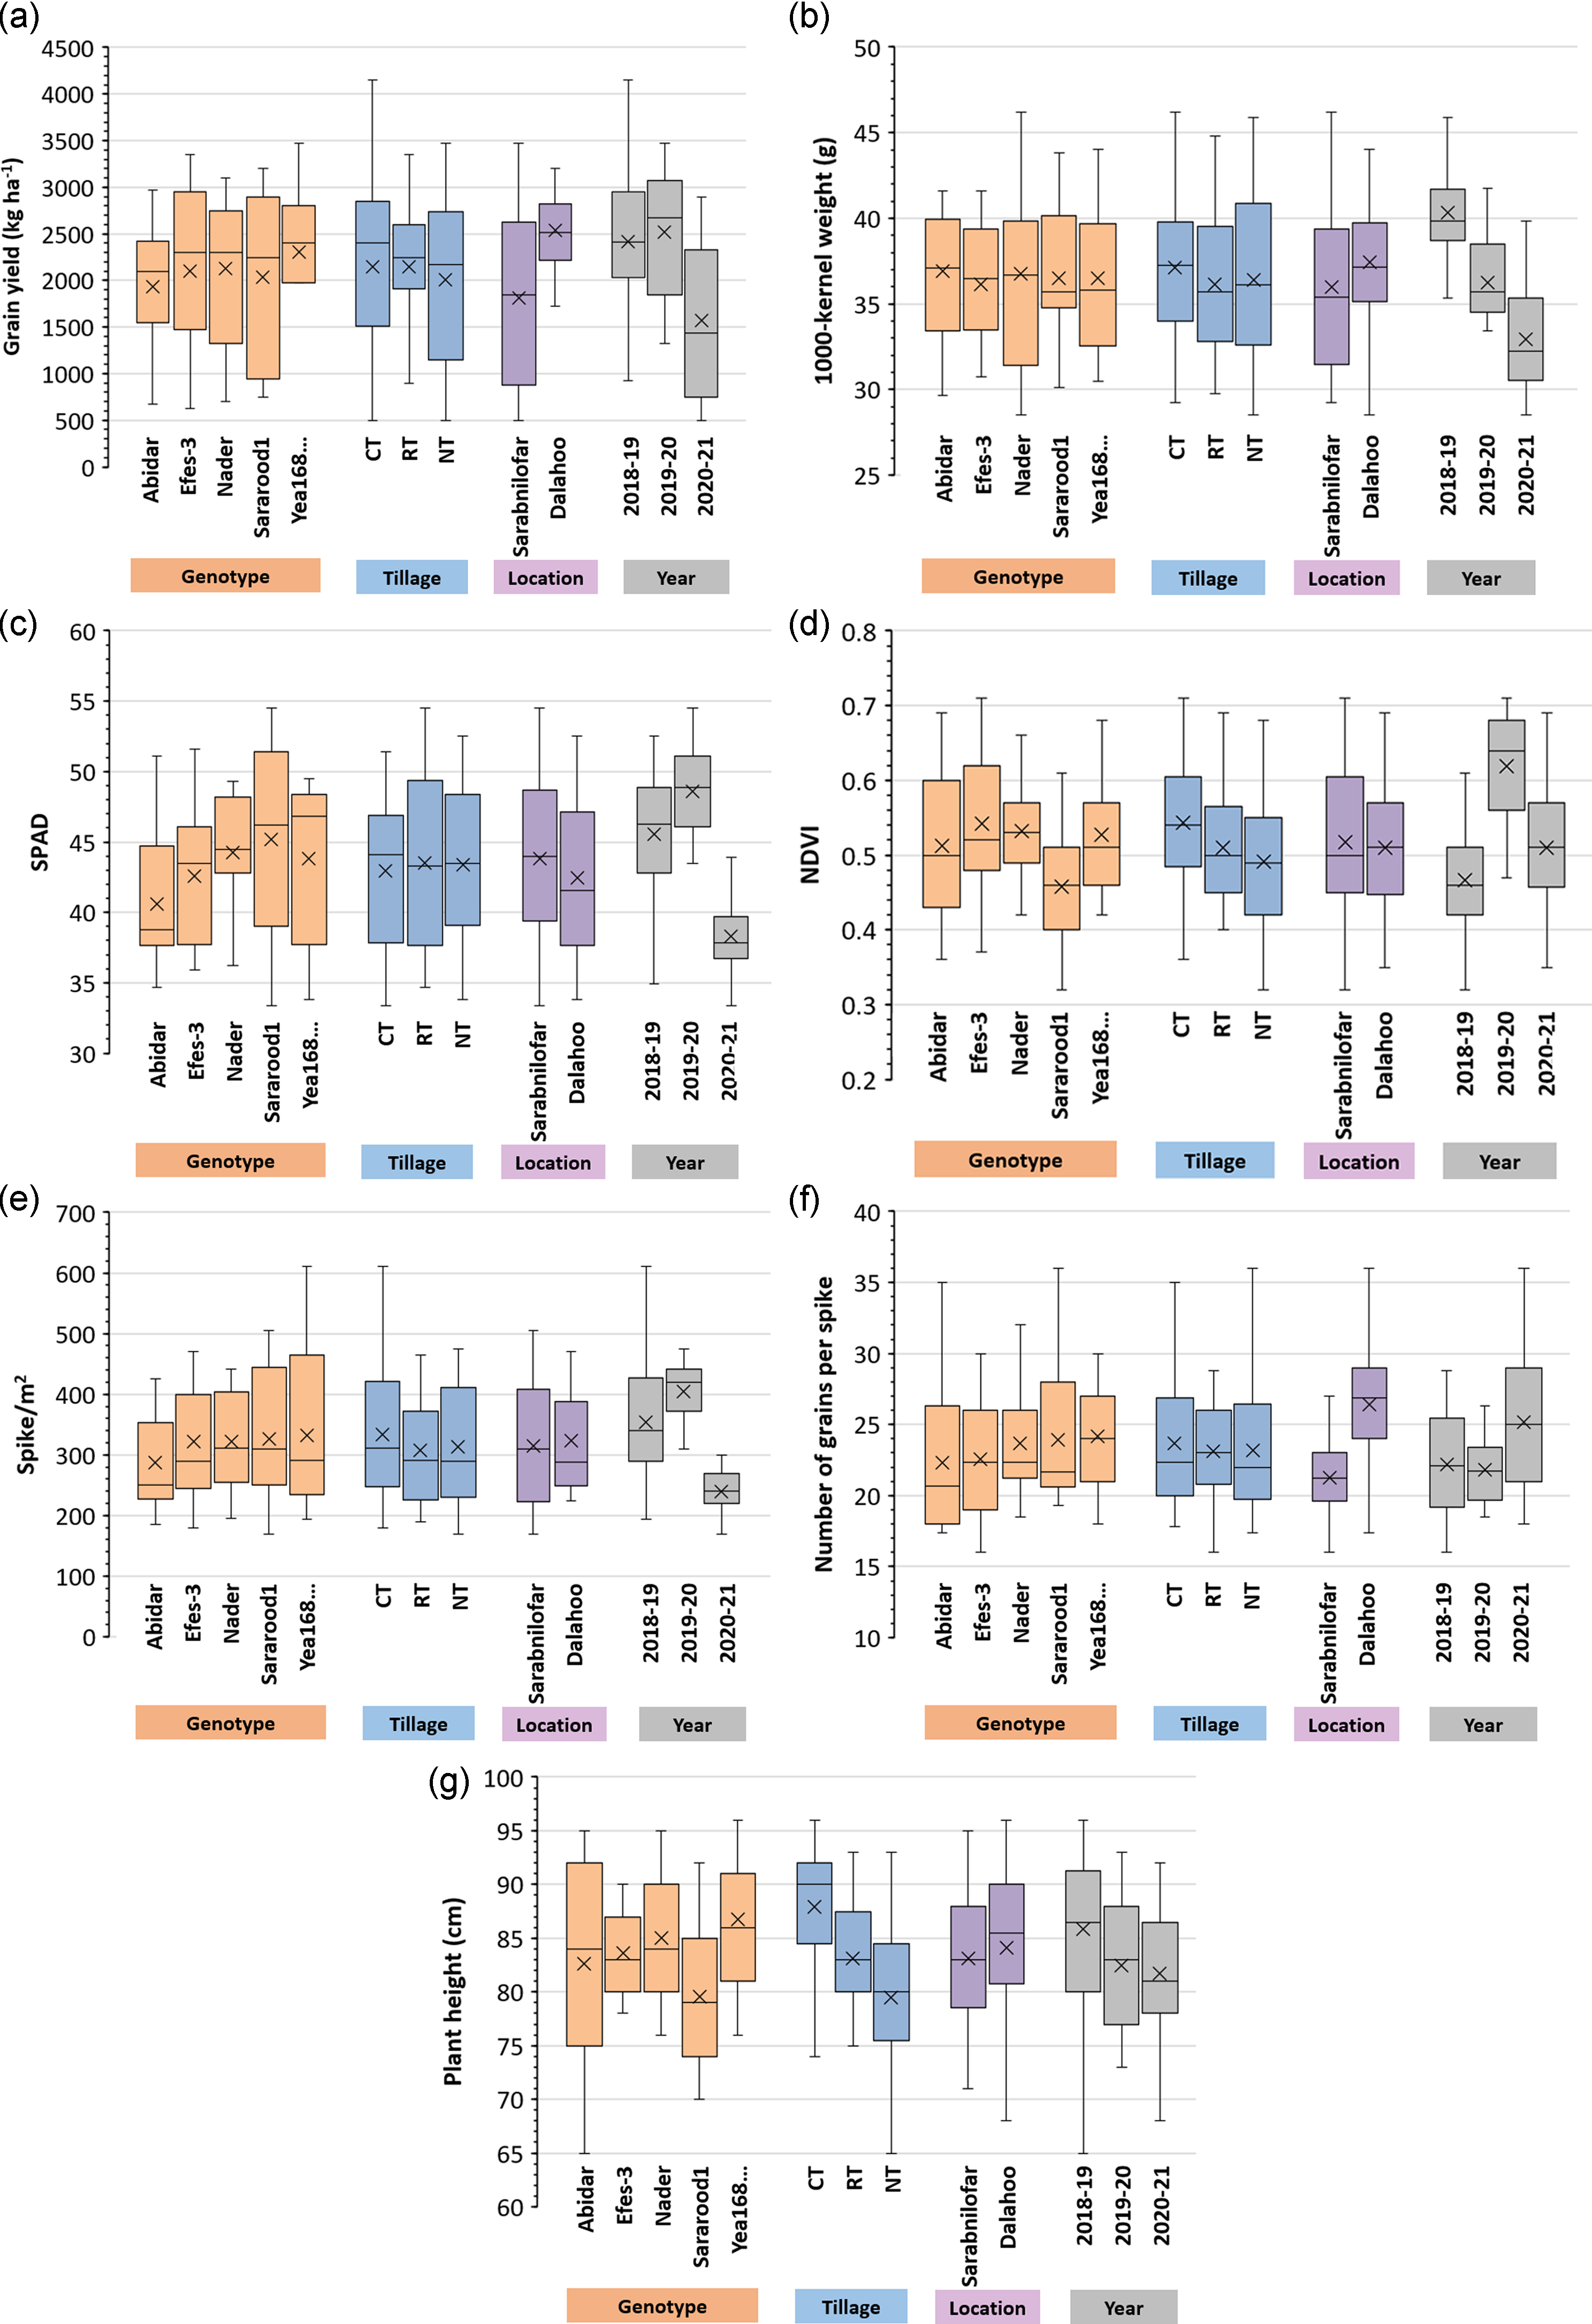
TKW was the highest for the Abidar cultivar and was the lowest for Efes-3 (Figure 2b). Nader cultivar also expressed the highest mean for TKW, and with the highest instability and range value. The TKW was highest in CT, and then in NT and RT. The lowest range value was observed in RT. It was expressed higher in Dalahoo than in Sarabnilofar location. Genotypes exhibited the highest TKW in 2018–19, followed by the 2019–20 and 2020–21.
In the case of SPAD reading (chlorophyll content), high considerable variation was detected between genotypes, locations, and years (Figure 2c). Sararood1 cultivar, followed by Nader cultivar and breeding line Yea168, expressed the highest SPAD at anthesis stage, while Abidar cultivar showed the lowest value of SPAD. In the case of tillage methods, SPAD for genotypes was slightly higher in NT and RT than in CT. The SPAD value for genotypes in Sarabnilofar was higher than in Dalahoo. Years showed a high difference in SPAD reading. In 2020–21, the SPAD reading of genotypes was the lowest, while in 2019–20 and 2018–19, genotypes expressed the highest SPAD value.
A high difference in NDVI between genotypes was detected in the post-flowering stage (Figure 2d). Genotype Efes-3, followed by Nader and Yea168, had the highest NDVI, and the lowest NDVI was for Sararood1 (a barley cultivar with early in heading and maturity). Genotypes exhibited higher NDVI under CT than RT and NT, and among genotypes, Efes-3 showed the highest NDVI under NT. Higher NDVI values were recorded in Dalahoo with wide-range values compared to Sarabnilofar. The genotypes showed the highest NDVI with narrow-range values in 2019–20, and in 2020–21, genotypes expressed higher values compared to 2018–19.
Genotypes expressed significant variation for spikes/m2 (Figure 2E). Compared to other genotypes, Yea168 had the highest spikes/m2 with a wide range of values. The spikes/m2 were the lowest for the Abidar with narrow-range values. The highest spikes/m2 were recorded in CT. The highest spike/m2 with narrow-range values was also obtained in Sarabnilofar. The highest spike/m2 was recorded in 2019–2020 followed by 2018–2019 with a higher amount of precipitation, in comparison to 2020–2021 with a lower amount of precipitation in comparison with the normal condition.
The highest NGPS was recorded for breeding line Yea168, followed by Sararood1 and Nader cultivars, while the lowest value was recorded for Abidar with a high-range value across environments (Figure 2F). The highest NGPS was recorded for genotypes in CT. The range value for NGPS in RT was less than the other tillage methods. Genotypes in Dalahoo showed the highest NGPS. Genotypes exhibited the highest NGPS in 2020–2021 with high-range values across environments, followed by 2018–19 and 2019–20 with narrow-range values across environments.
A high difference in PLH was observed among genotypes (Figure 2G). The breeding line Yea168 expressed the highest PLH. The PLH was the least for the Sararood1. Efes-3 expressed high PLH with narrow-range value, while Abidar with high PLH showed the highest range value and instability in plant stature across environments. The genotypes expressed the highest plant stature under CT, followed by RT and NT. The PLH exhibited low variability under RT compared to other tillage methods. The genotypes showed slightly higher plant stature in Dalahoo than in Sarabnilofar. Genotypes exhibited highest plant stature in 2018–19, followed by in 2019–20 and 2020–21.
Tillage × location × year interaction for grain yield of barley genotypes
Figure 3 shows the average performance of barley genotypes in tillage treatments in different years and locations. Grain yield in 2018–19 was the highest, as it received higher rainfall than the optimum condition (Figure 1). In this situation, a notable difference was observed between the tillage treatments in Sarabnilofar, and the highest mean yields belonged to CT (2765 kg/ha), followed by RT (2202 kg/ha) and NT (1490 kg/ha). A significant variation was also observed in productivity between tillage systems in Dalahoo, and the genotypes performed well in CT (2885 kg/ha) than in NT (2800 kg/ha) and RT (2380 kg/ha).
Tillage × location × year interaction for grain yield of barley genotypes. The bars with the same letter at each location are not significant at 5% probability level. CT: conventional tillage; RT: reduced tillage; NT: no-tillage.
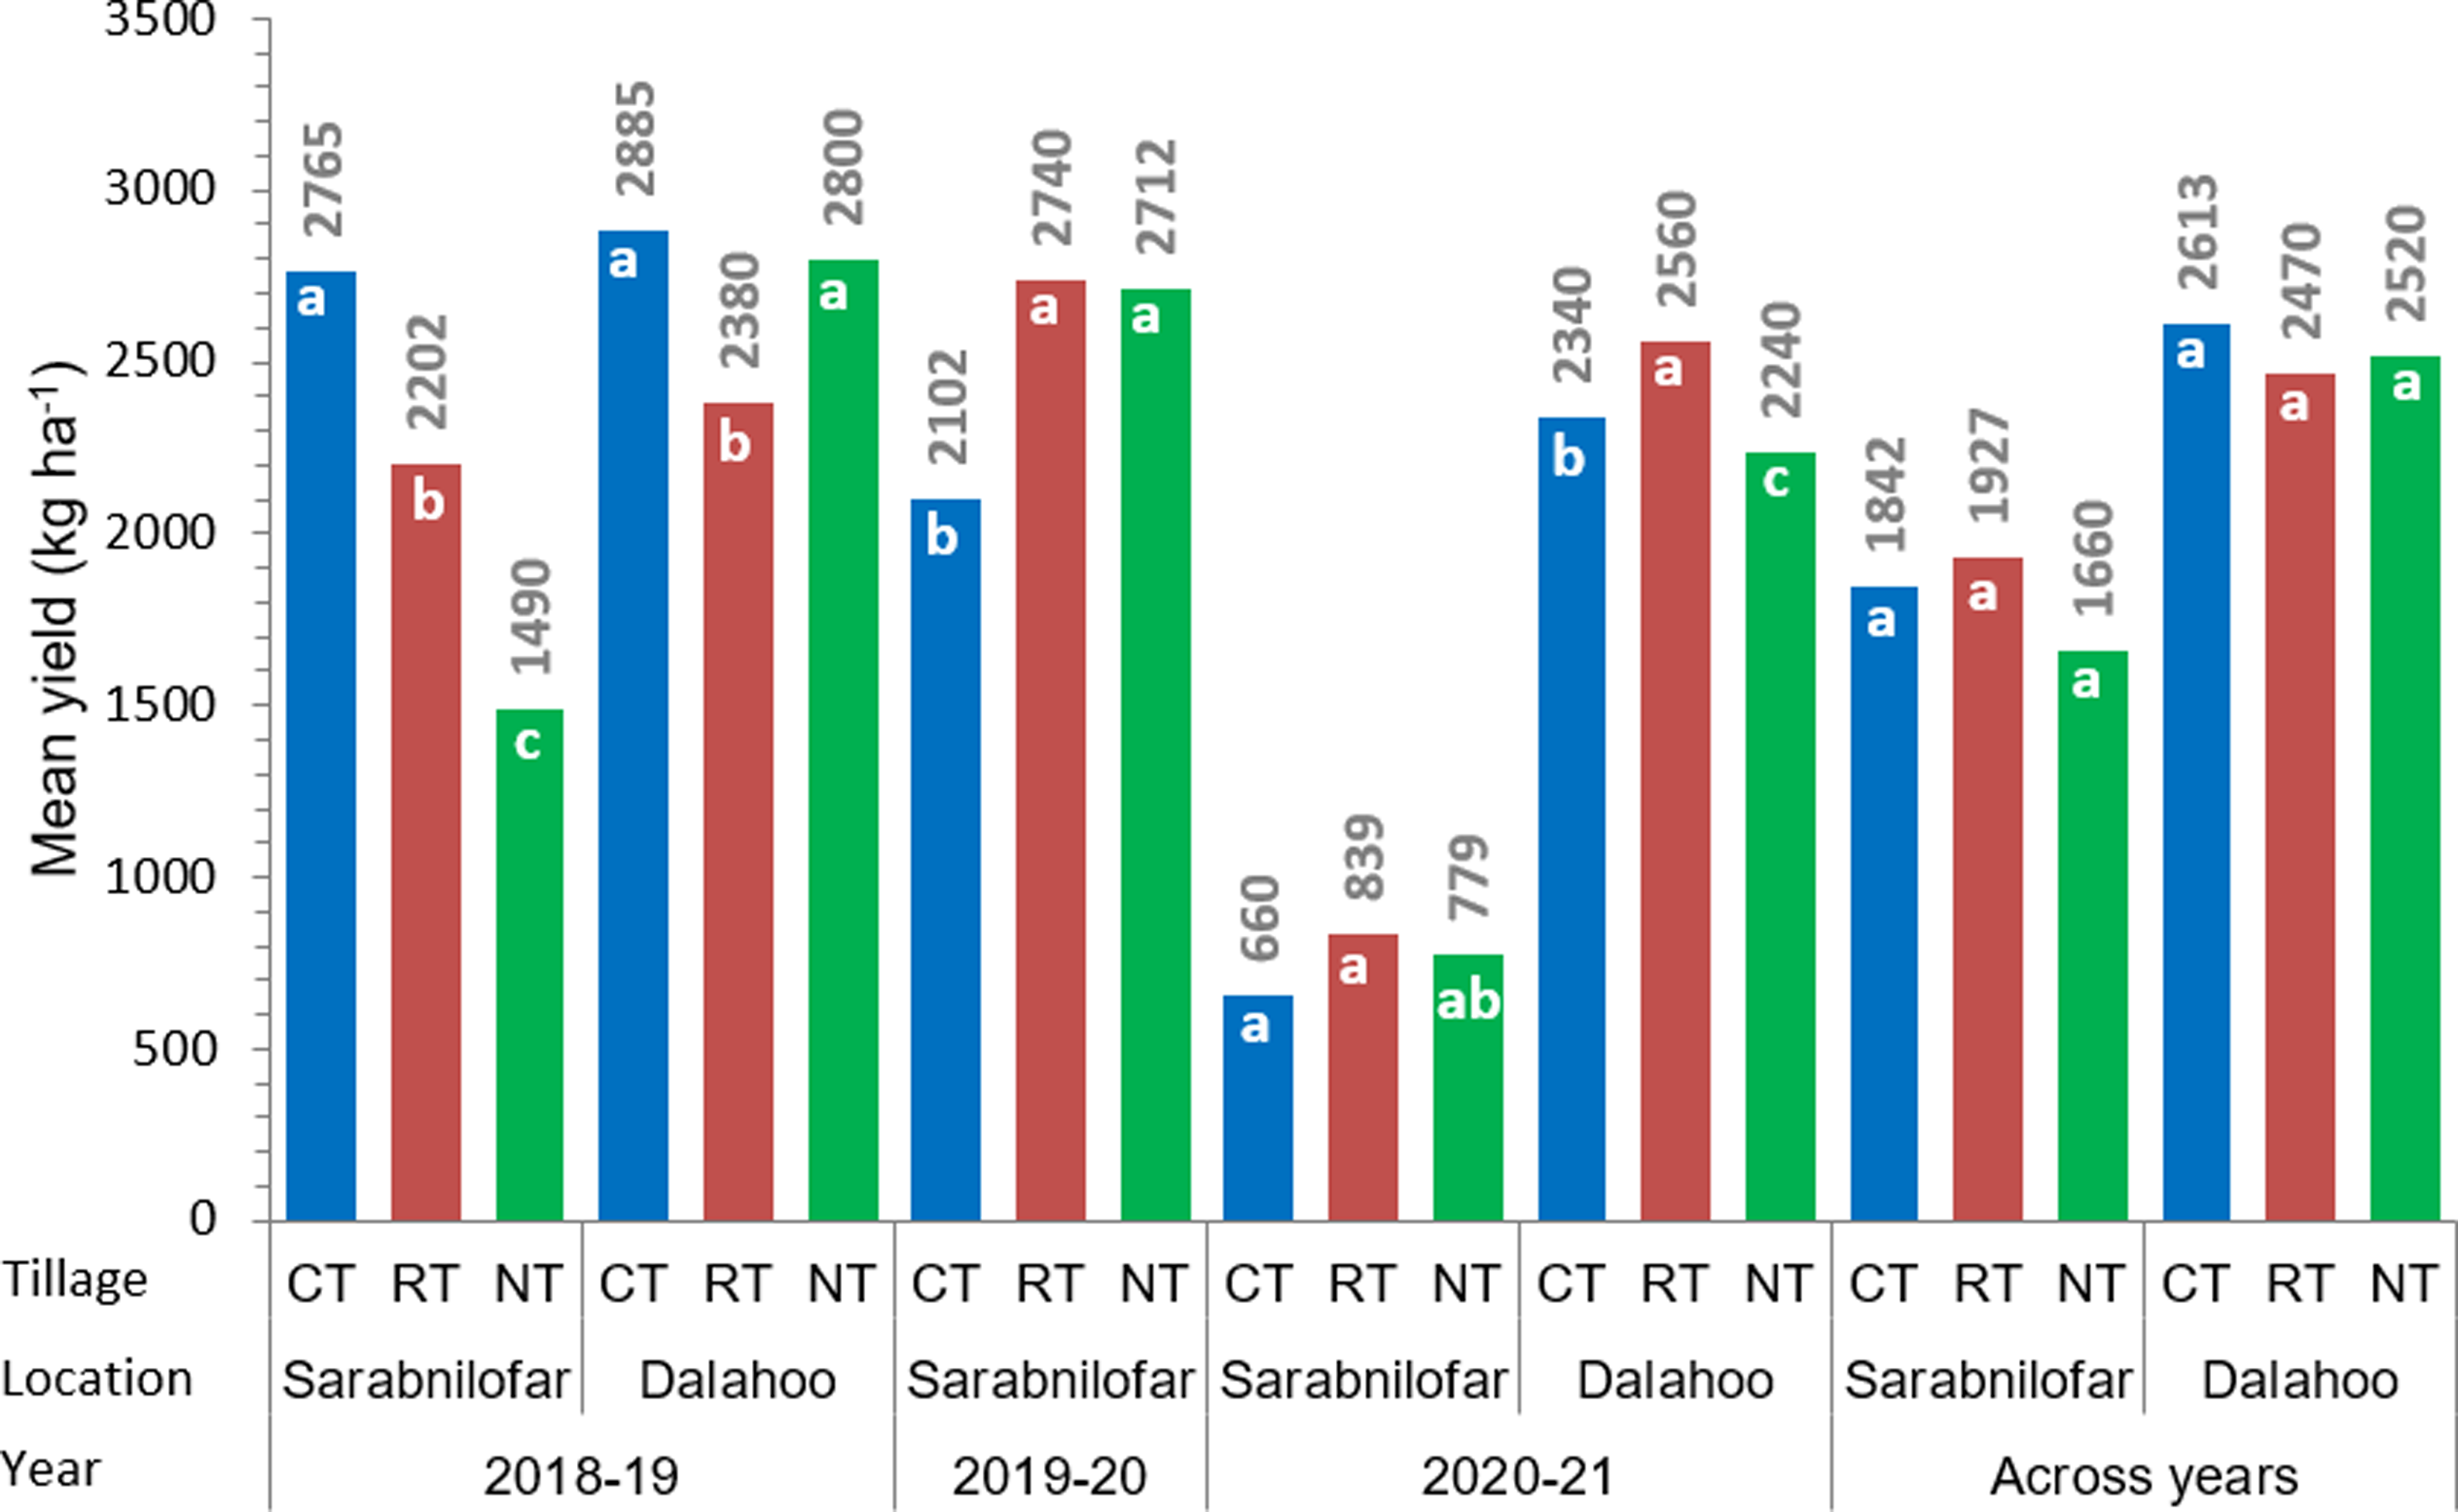
In 2019–20 in Sarabnilofar, the genotypes’ performance was significantly influenced by tillage systems. The genotypes performed best in RT (2740 kg/ha), followed by CT (2102 kg/ha) and NT (1446 kg/ha). In 2019–20 in Sarabnilofar due to severe drought, the mean performance of barley genotypes was most affected by drought in comparison to Dalahoo. Therefore, in RT, genotypes had the highest mean yield (839 kg/ha), followed by NT (779 kg/ha) and CT (660 kg/ha), while in Dalahoo, genotypes performed well and produced highest yield in CT (2613 kg/ha), followed by NT (2520 kg/ha) and RT (2470 kg/ha). Across locations and years, no significant difference was observed between the average yield of genotypes in different tillage options and genotypes had highest performance in CT (2613 kg/ha), followed by NT (2520 kg/ha) and RT (2470 kg/ha) (Figure 3), which shows about 5.8% and 3.6% higher yield under CT in comparison with RT and NT, respectively.
Genotype × tillage interaction for grain yield
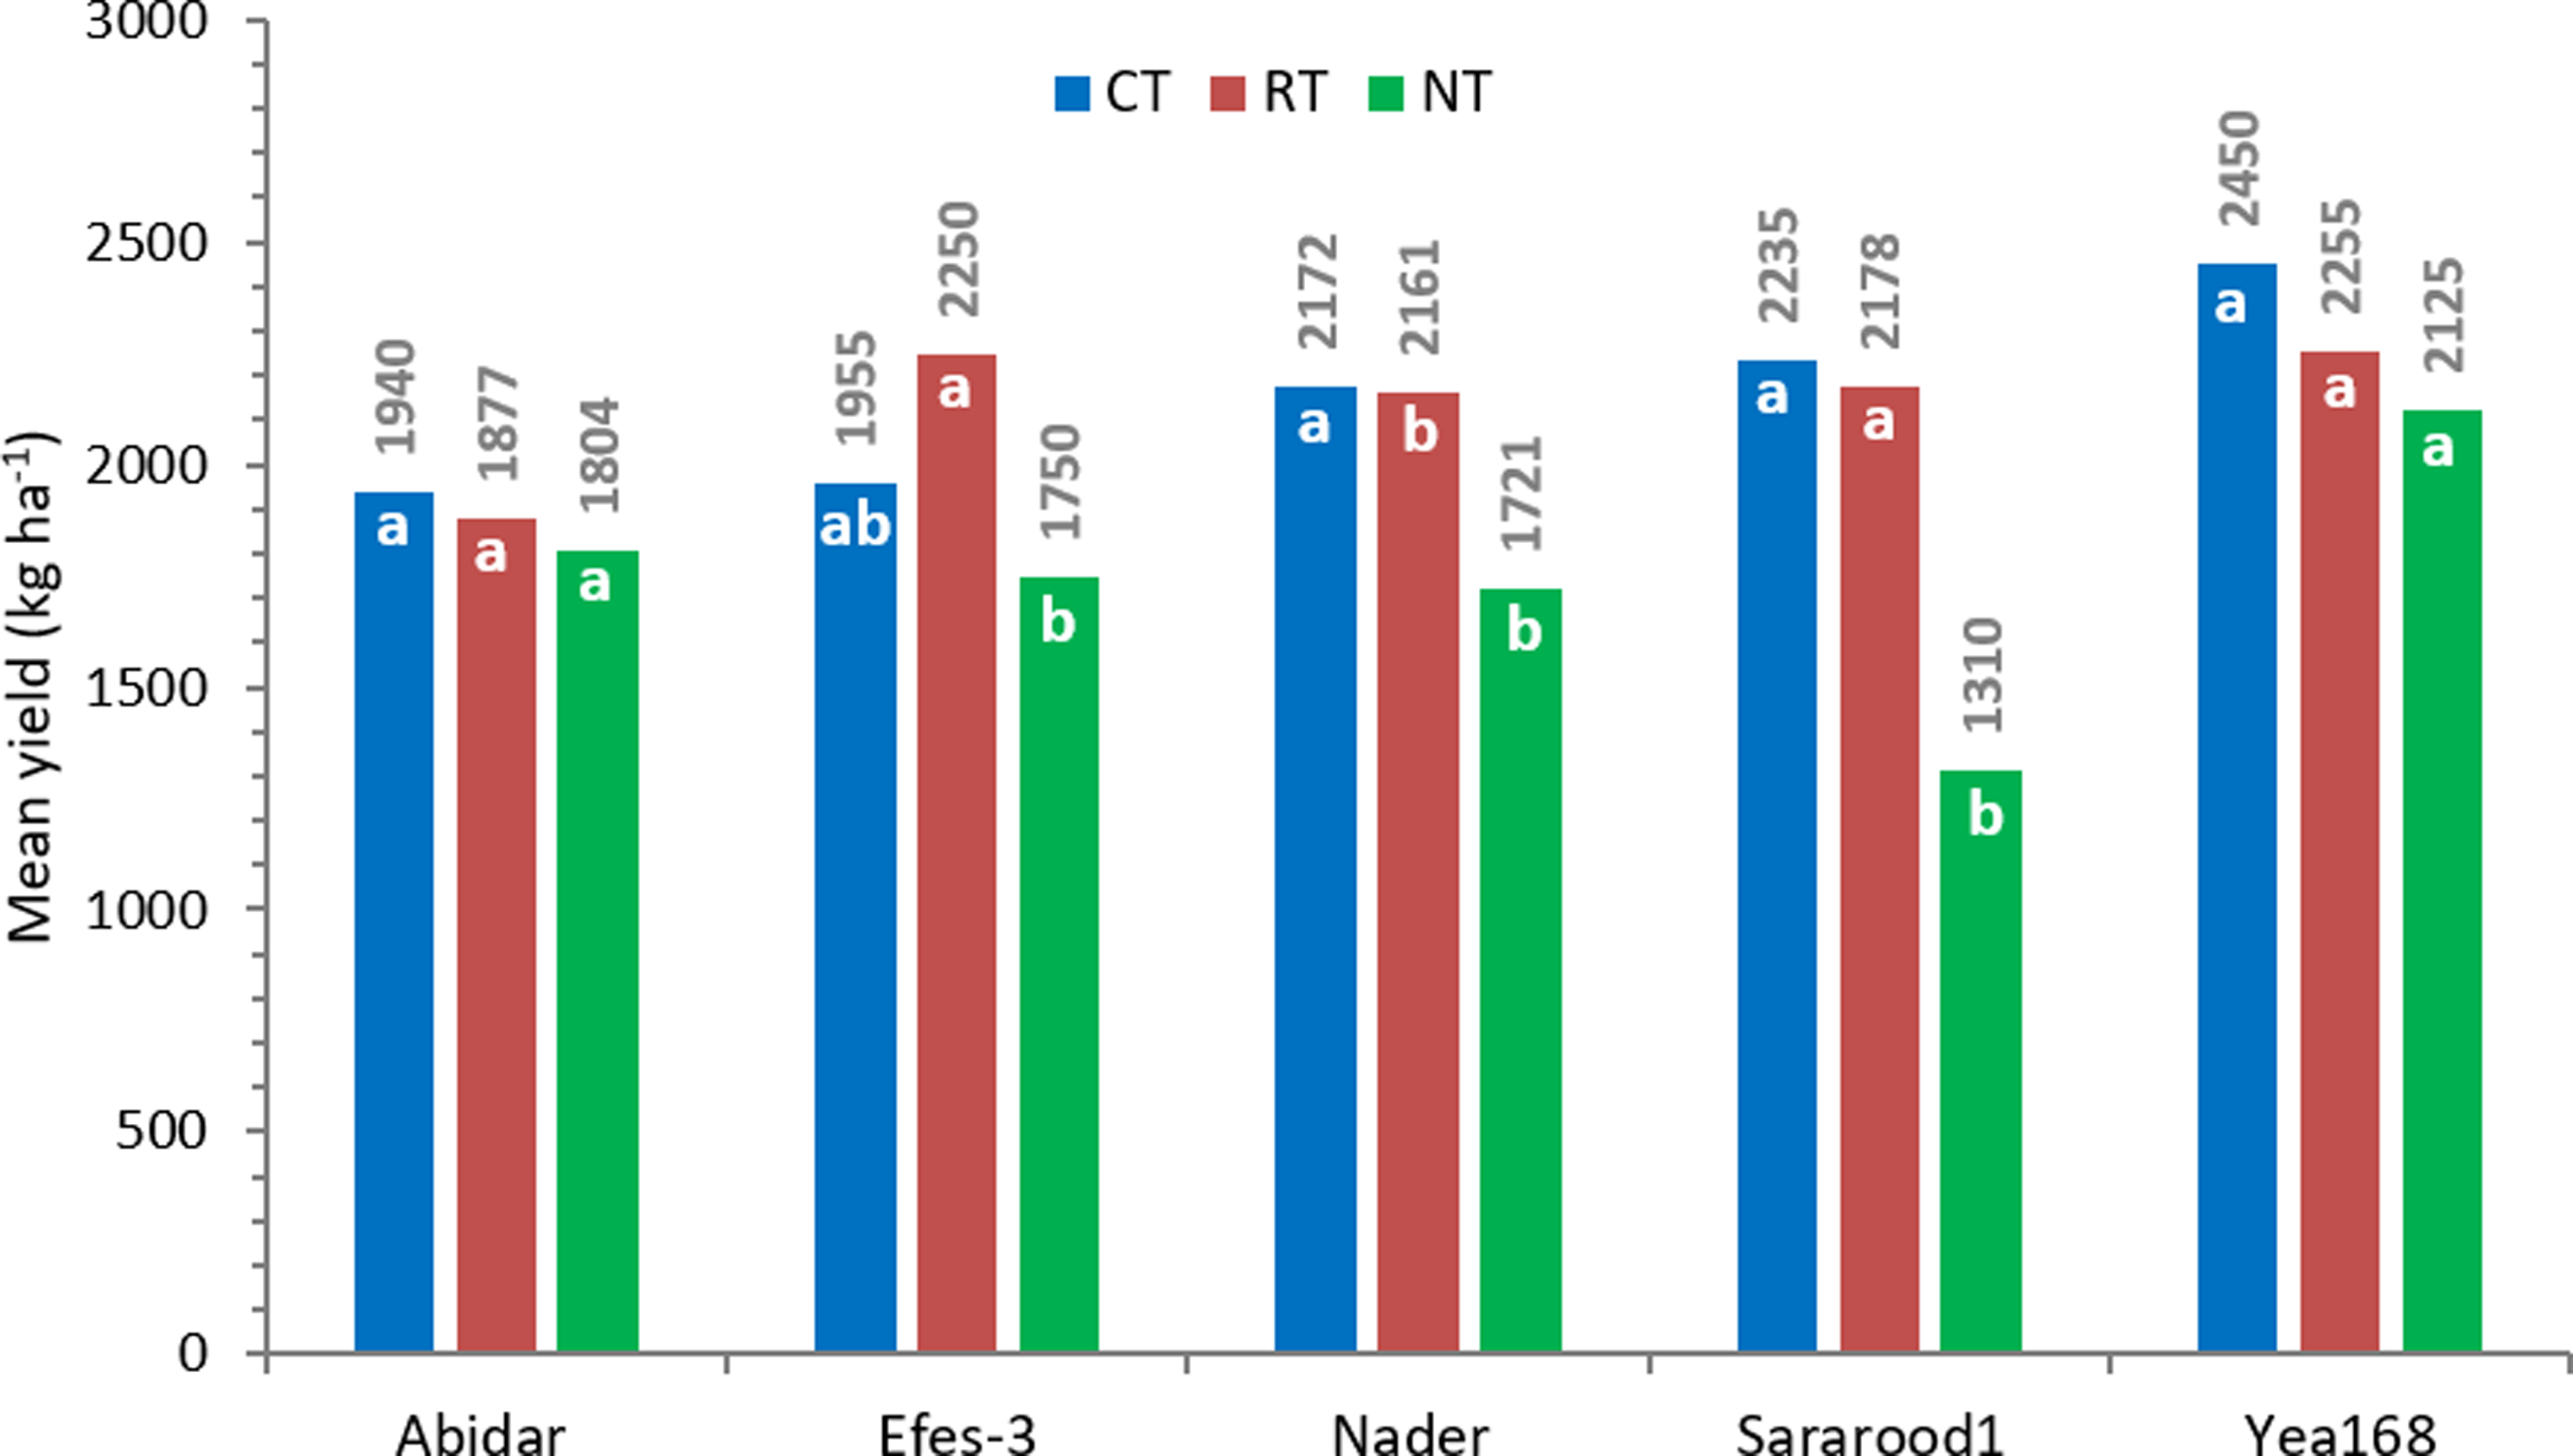
The performance of barley genotypes varied between tillage systems (Figure 4). The highest mean performance was obtained for breeding line Yea168 under CT (2450 kg/ha), while Sararood1 exhibited lowest productivity under NT (1310 kg/ha). The Sararood1, Nader and Abidar cultivars performed well in CT, while Efes-3 performed well in NT. The Abidar did not significantly interact with all three tillage systems, while Nader and Sararood1 did not interact significantly with CT and RT. Other investigated genotypes were significantly different in their adaptation to tillage systems.
Cultivar x tillage interaction for grain yield of barley genotypes across locations and years. CT: conventional tillage; RT: reduced tillage; NT: no-tillage. The bars with same letter at each cultivar are not significant at 5% probability level.
Tillage systems-based GT-biplot approach
To study the trait characteristics of barley genotypes and the relationships between studied traits, a graphical GT-biplot analysis was made based on the GT matrix data for each and across tillage systems (Figure 5). The total variation in percentage that was explained by GT-biplots for CT, RT, NT and across tillage options were 81.15%, 86.94%, 91.05% and 82.37%, respectively. In the case of CT (Figure 5a), genotypes were divided into five sections and traits into two sections. Grain yield, spike/m2 and SPAD were separated in one section, and the breeding line Yea168 was the winner for the best combination of these traits. The next section included TKW, PLH, NGPS and NDVI, for which Nader was the winner. Sararood-1, Efes-3 and Abider were divided into sections without any attributes. In RT condition (Figure 5b), traits are divided into three sections and genotypes are divided into four sections. The breeding line Yea168 had the best-combined levels in terms of grain yield and PLH. Sararood1 variety had a high combination of TKW, spike/m2, SPAD and NGPS and Efes-3 expressed the highest NDVI. In the case of NT condition (Figure 5c), traits fell into four sections and genotypes into five sections. The breeding line Yea168 expressed the highest combined level for grain yield, spike/m2 and PLH. Efes-3 genotype showed the highest values for TKW and NDVI. Sararood1 cultivar expressed the highest NGPS and Nader cultivar had the highest SPAD. Across tillage options (Figure 5d), traits and genotypes were divided into three sections. The breeding line Yea168 expressed the highest combined level for grain yield, spike/m2, PLH and NDVI. Abider variety showed the highest value for TKW, and Sararood1 variety expressed the highest combination of SPAD and NGPS.
‘Which-for-what’ patterns of GT-biplot for seven traits of five barley genotypes under CT (a), RT (b), NT (c) and across tillage options (d). YLD: grain yield; TKW: 1000-kernel weight; SPAD: SPAD reading (chlorophyll content); NDVI: normalised difference vegetation index; Spike/m2: number of spikes per square metre; NGPS: number of grains per spike; PLH: plant height.
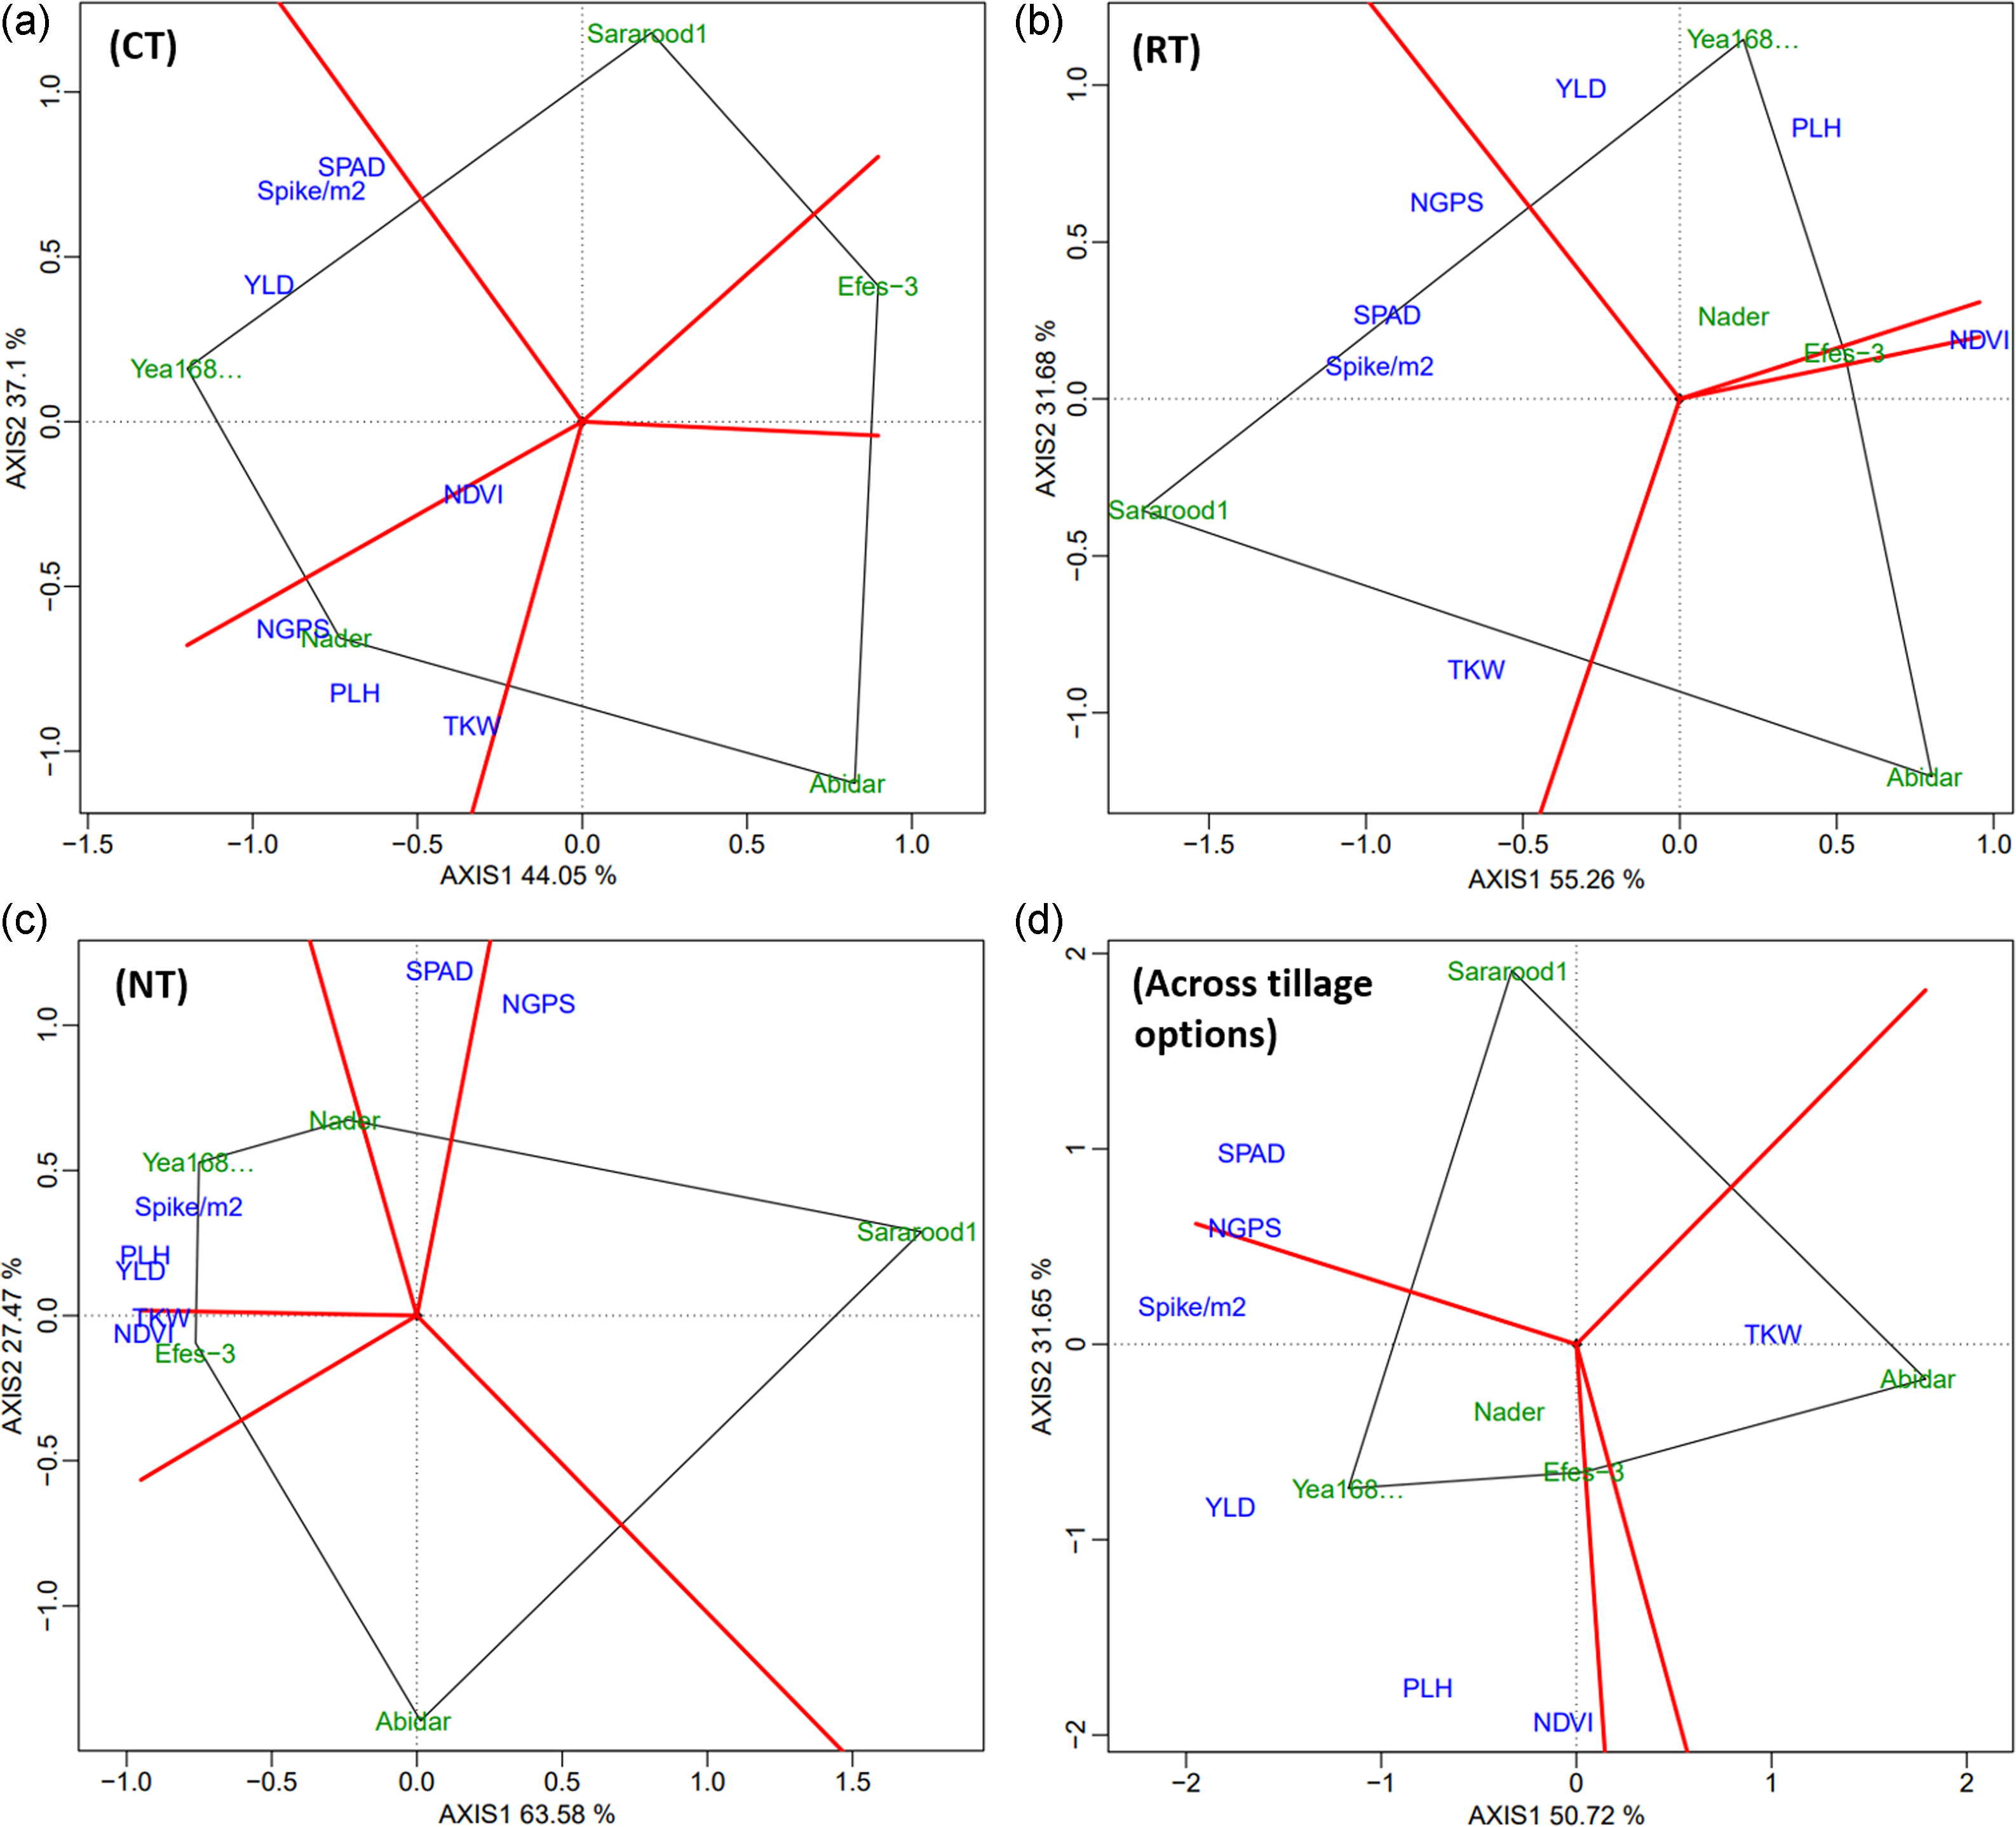
Table 3 shows the correlation coefficient between the studied traits in each and throughout tillage system. Relationships of traits were slightly different from one tillage system to another. In the CT condition, spike/m2 (r = 0.74; P < 0.01) and SPAD (r = 0.43; P < 0.05) positively and significantly correlated with mean yield, while NDVI showed a negative significant correlation (r = −0.45; P < 0.05) with mean yield. A significant positive correlation was also observed between SPAD with spike/m2 (r = 0.65; P < 0.01) and PLH (r = 0.44; P < 0.05). Under NT condition, TKW (r = 0.75; P < 0.01), spike/m2 (r = 0.73; P < 0.01) and SPAD (r = 0.50; P < 0.05) showed significant and positive correlations with mean yield. In contrast, NDVI showed significantly negative correlation (r = −0.48; P < 0.05) with mean yield. Under RT condition, spike/m2 (r = 0.62; P < 0.01) and PLH (r = 0.64; P < 0.01) were significantly and positively associated with mean yield. TKW, significantly and positively associated with spike/m2 (P < 0.01) and SPAD (P < 0.01) and PLH (P < 0.05), and did not significantly correlated with mean yield. A consistent, significant, and positive correlation (P < 0.01) between the number of spikes with grain yield across three tillage systems was observed. In contrast, other traits did not show a repeatable correlation with grain yield across three tillage systems. A consistent, significant, and negative correlation (P < 0.01) between SPAD and NDVI was found.
Correlation coefficients between traits studied under different tillage systems
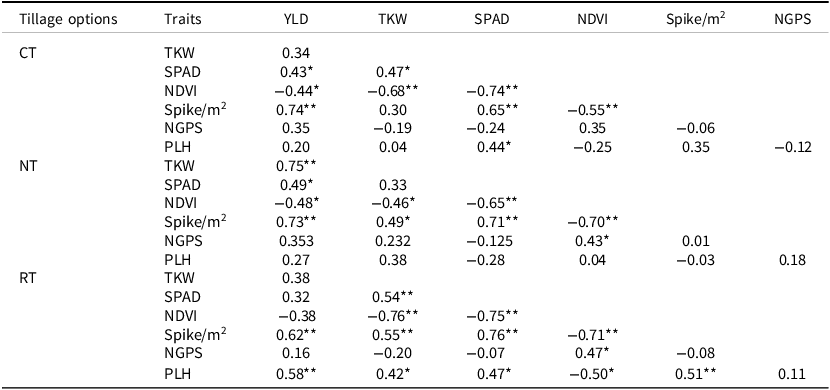
*, ** Significant at 5% and 1% probability level, respectively.
YLD: grain yield; TKW: 1000-kernel weight; SPAD: SPAD reading (chlorophyll content); NDVI: normalised difference vegetation index; Spike/m2: number of spikes per square metre; NGPS: number of grains per spike; PLH: plant height
Test location-based GT-biplot approach
GT-biplot was also constructed for each location to evaluate barley genotypes based on investigated traits (Figure 6). The PC1 and PC2 explained 79.15% and 90.48% of the total variation in Sarabnilofar and Dalahoo locations, respectively. In the case of GT-biplot for Sarabnilofar, all the studied traits were separated in the same section, and breeding line Yea168, followed by Nader cultivar, had the best combination based on these traits (Figure 6a). In this location, close correlations were found between grain yield, NDVI, PLH, and TKW, while spike/m2 and NGPS were closely correlated with SPAD (Figure 6b). No correlation was found between SPAD with grain yield and yield-related traits.
GT-biplot based on traits studied for five barley genotypes across three tillage systems and three cropping seasons in Sarabnilofar (a: ‘which for what’ view, b: traits relations) and Dalahoo (c: ‘which for what’ view, d: traits relations) locations. The arrows represent the traits, whereas a smaller acute angle between two arrows indicates a closer relationship between the two traits. A smaller distance between two genotypes indicates a similar response of the genotypes to different tillage systems across years.
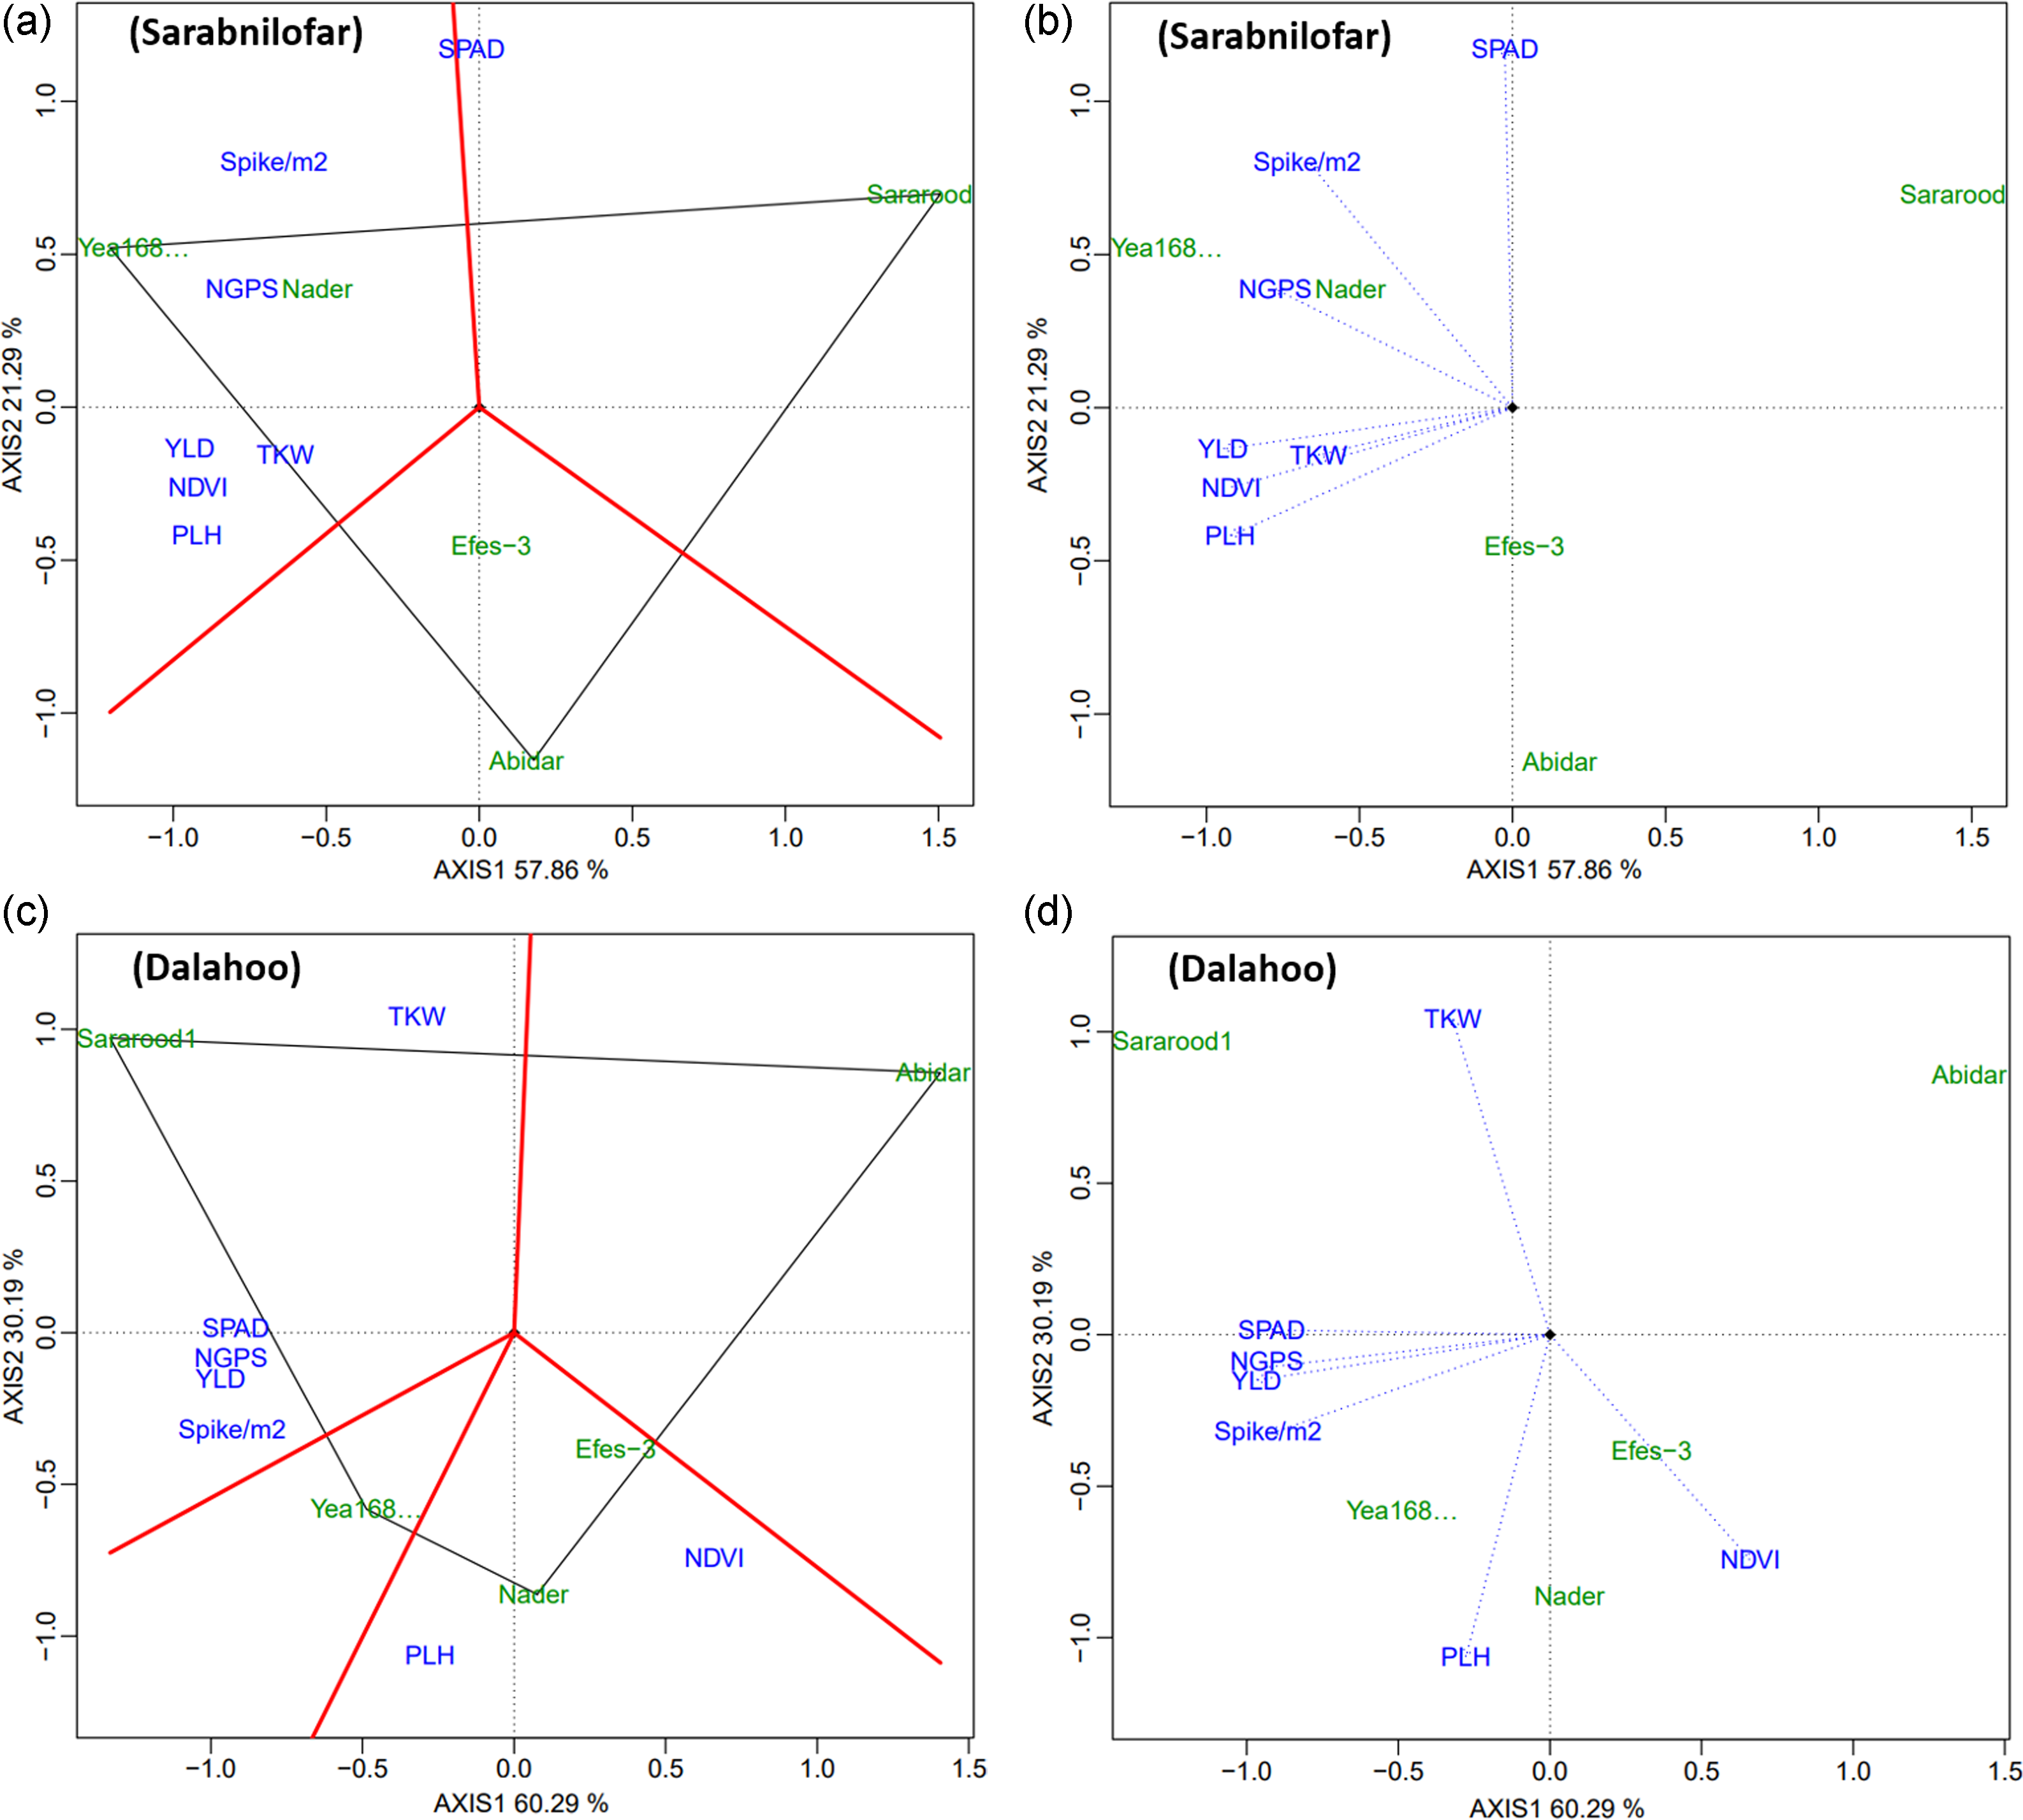
The traits relationships and traits profile of barley genotypes in Dalahoo were different from those in Sarabnilofar. In Dalahoo location, traits fell into two sections (Figure 6c). Grain yield, NGPS, SPAD, and spike/m2 were separated in the same section, and Sararood1 cultivar had the best combination level of these traits, while NDVI and PLH made the next group with Nader cultivar being the winner. These results suggest that specific adaptation of genotypes to different locations. Breeding line Yea168 performed well in Sarabnilofar, while Sararood1 was the best yielder in Dalahoo.
In Dalahoo, SPAD, NGPS, and spike/m2 had a positive correlation with grain yield, while NDVI had a negative correlation with grain yield (Figure 6d). NDVI showed a positive correlation with PLH and a strong negative correlation with TKW. No correlation was found between TKW and mean yield. The breeding line Yea168 positively interacted with grain yield and related traits, while Sararood1 positively interacted with TKW and Efes-3 positively interacted with NDVI.
Genotype × environment interaction for grain yield by GGE biplot
GGE biplot analysis was used to graphically analyse the GE interaction for grain yield to facilitate detecting high-yielding and stable genotypes and environmental assessments. The GGE biplot accounted for 70.82% of the total variation (Figure 7). The which-won-where pattern of GE interaction for barley genotypes across environments is presented in Figure 7a. The breeding line Yea168, and Sararood1 and Efes-3 genotypes with the farthest distance from the origin of the biplot, made vertices of the polygon and are the worst or best genotypes in one or other environments, and hence are considered adapted genotypes. The breeding line Yea168 had the best genotype in CTS20, NTS20, RTS20, RTD21, CTD19, RTS19, and NTS19 environments. Sararood1, followed by Nader variety performed well in RTS21, CTS21, RTS21, RTD19, CTS19, CTD21, and NTD21 environments, while Efes-3 performed best in NTD19 and NTS21. Abider variety was close to the origin of the biplot, which showed that it did not perform the best in all environments. Thus, it was a low-yielding cultivar in all or some of the environments.
GGE biplot analysis based on GY of five barley genotypes across 15 environments (combination of tillage system-location-year) (a) showing ‘which-won-where’ view of GE interaction; (b) ranking of genotypes based on mean yield and stability performance; (c) ranking of genotypes in comparison with ideal genotype; and (d) showing discriminating ability and representativeness view of test environments. CT, conventional tillage; RT: reduced tillage; NT: no-tillage; S: Sarabnilofar location; D: Dalahoo location; 19, 20, and 21 stand for 2018–19, 2019–20, and 2020–21 cropping seasons, respectively.
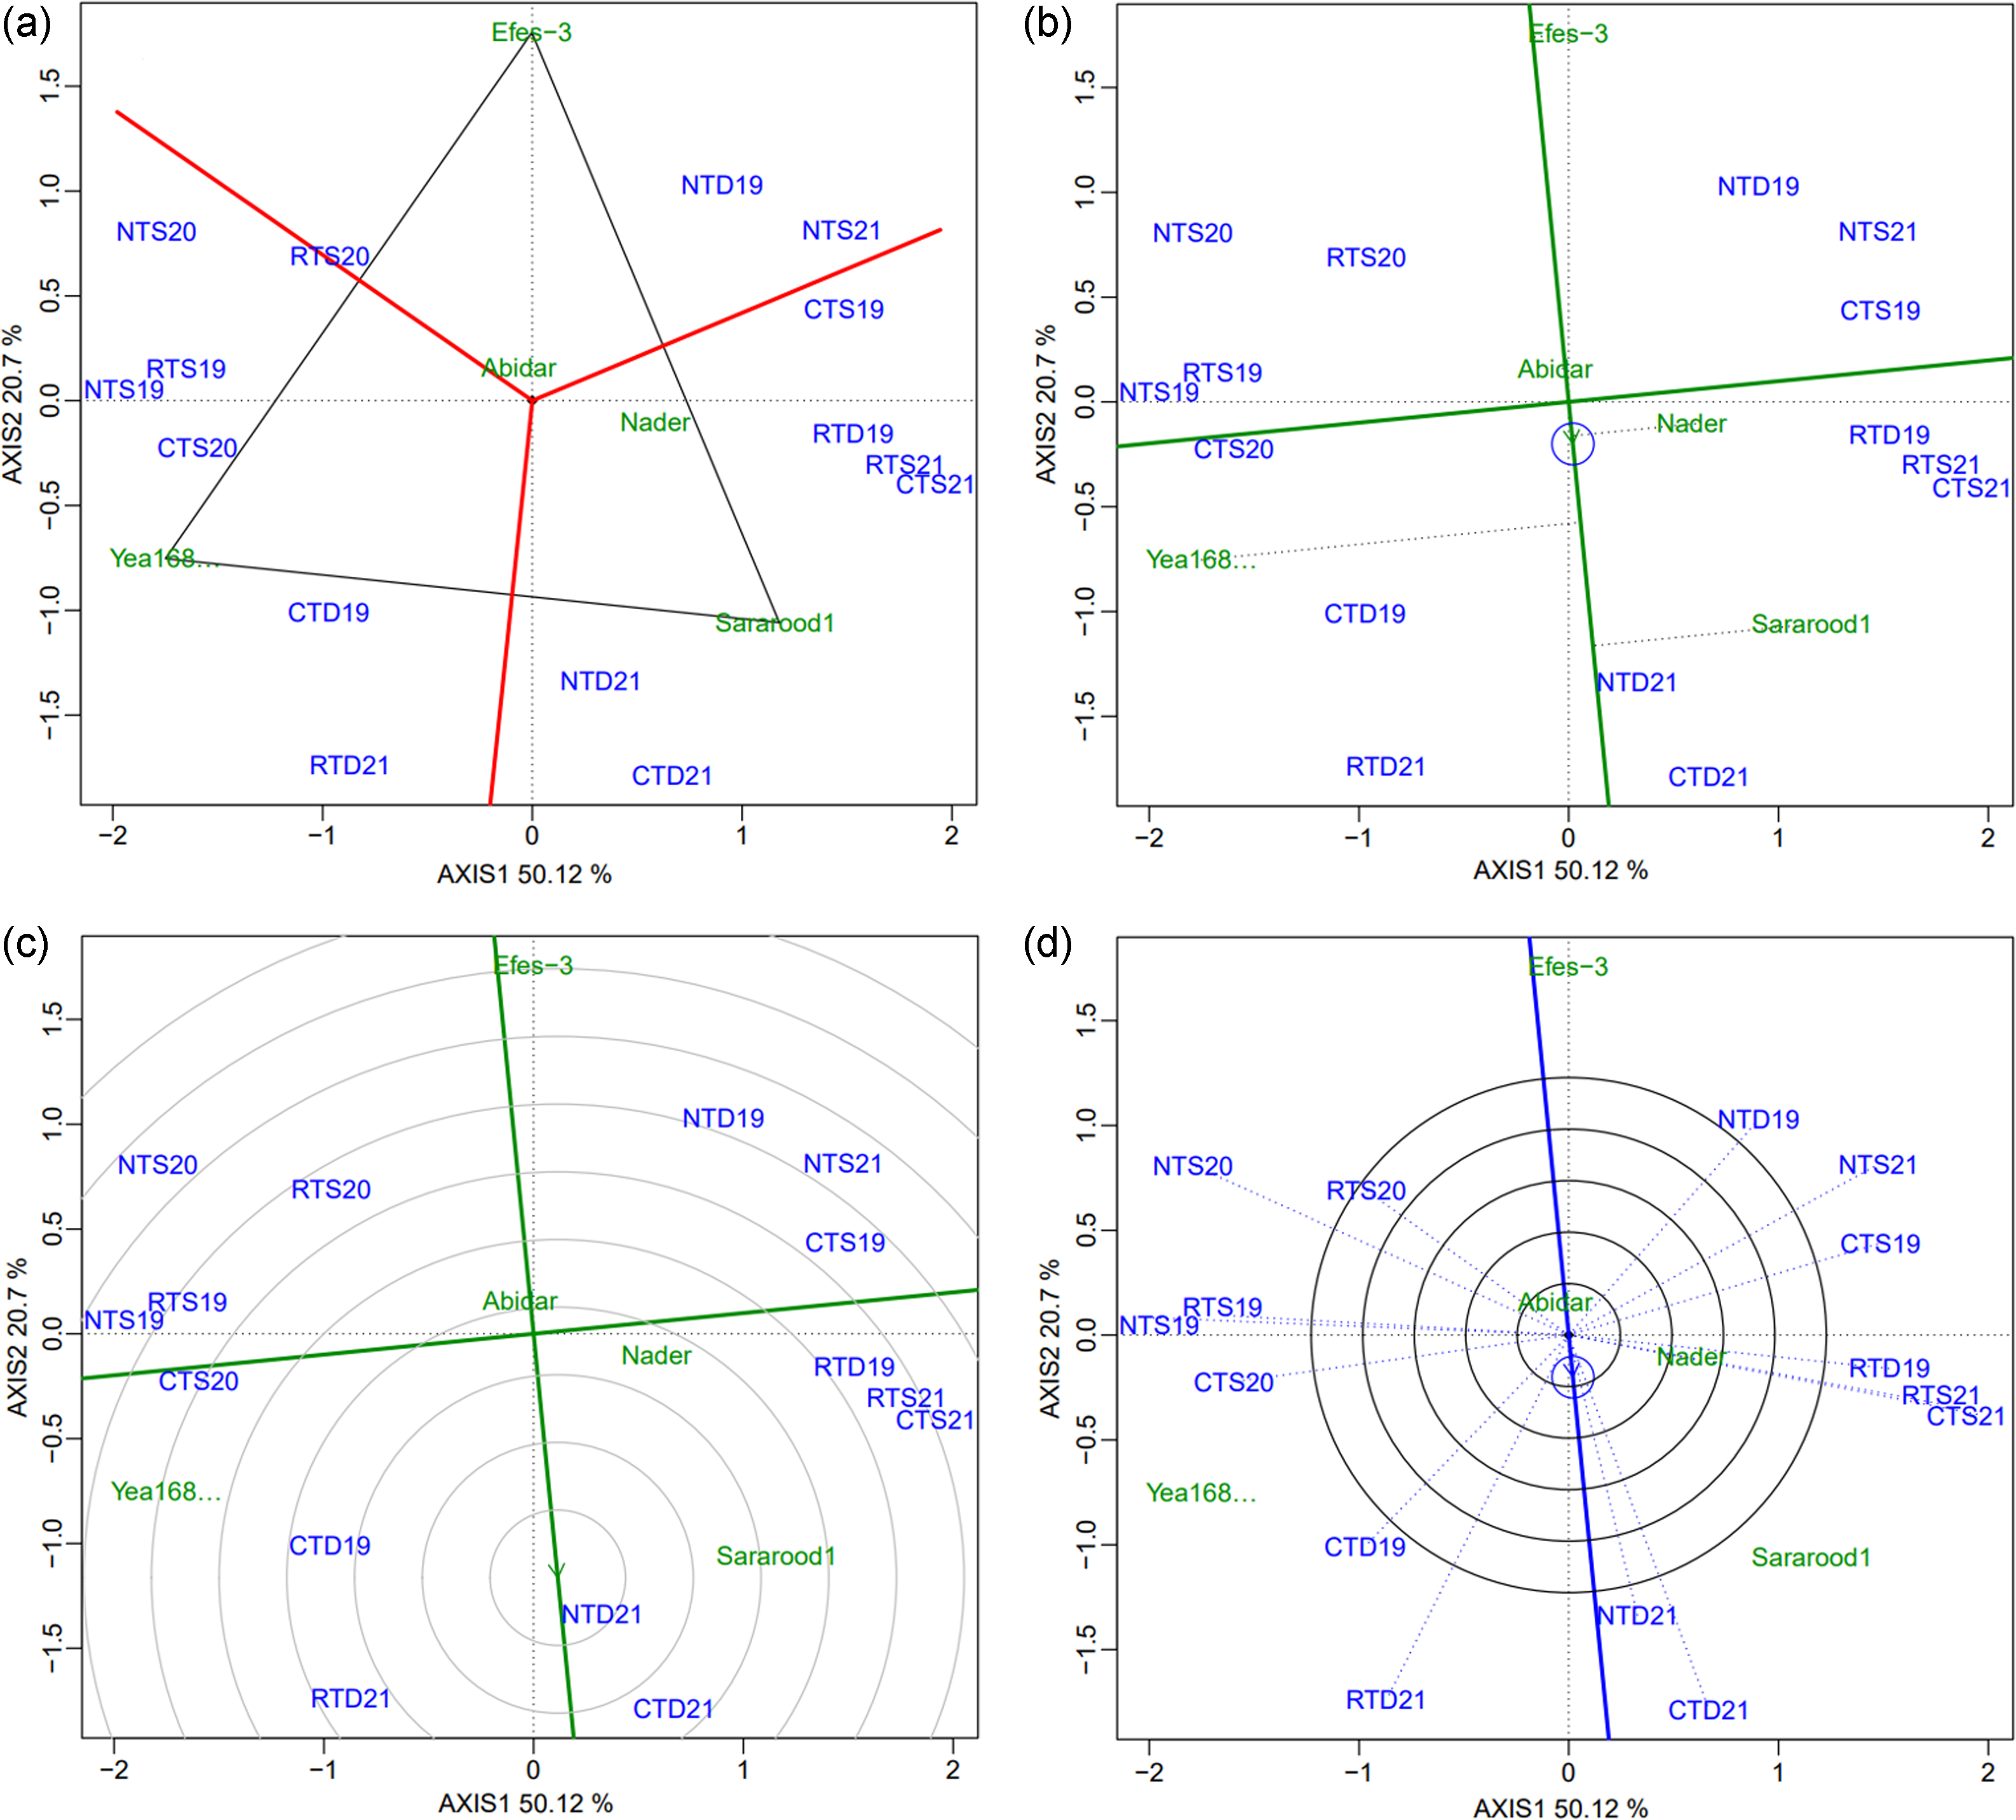
Figure 7b shows the ‘mean vs stability’ view of barley genotypes across environments. The most stable genotypes, although not the highest yielding, were Abidar and Nader, with a mean yield around the grand mean. In contrast, Yea168 and Sararood1 were less stable but had the highest mean yield. The most stable and low-yielding genotype was Efes-3. The ideal genotype is located as close as possible to the middle of the concentric circles in Figure 7c. Thus, the ideal genotype in terms of the highest mean yield and average stability was Yea168 breeding line and Sararood1 cultivar.
The most discriminating environments for grain yield were CTD21, RTD21, NTS19, CTS21, RTS21, and NTS20, and the lowest was RTS20 (Figure 6d). The most representative environments were NTD20, CTD21, and RTD21, and the least were NTD19, RTS20, NTS21, and NTS20. An ideal environment should be both discriminating and representative. Accordingly, CTD21, NTD21, and RTD21 were identified as ideal environments. These environments belonged to the three tillage options in the Dalahoo; so, moisture stress concurrent with cooler temperatures during flowering and grain-filling periods at this location may be a differentiating factor. The environments CTS21, NTS19, RTS21, and NTS20 were discriminating but not representative and could be useful for selecting specifically adapted genotypes.
Discussion
High variability in agronomic characteristics of barley genotypes in varied tillage methods, years, and locations existed, which shows the greatest effect of environment on the genotypic behaviour of barley genotypes. Locations and growing seasons differed in total precipitation and distribution and mean temperature, resulted in different growth conditions that caused terminal drought stress that coincided with heat stress (Figure 1). The high genotype × tillage interaction affected the genotypic performance, which led to variation in genotype adaptability to the tillage methods. This finding is consistent with other studies that have reported significant genotype × tillage interaction in other sorts of crops, that is, barley (Piggin et al., Reference Piggin, Haddad, Khalil, Loss and Pala2015; Yau et al., Reference Yau, Sidahmed and Haidar2010), wheat (Fischer et al., Reference Fischer, Santiveri and Vidal2002; Herrera et al., Reference Herrera, Verhulst, Trethowan, Stamp and Govaerts2013; Honsdorf et al., Reference Honsdorf, Mulvaney, Singh, Ammar, Burgueño, Govaerts and Verhulst2018), and maize (Herrera et al., Reference Herrera, Verhulst, Trethowan, Stamp and Govaerts2013).
Across locations and years, barley genotypes interacted positively with CT more than NT and RT. The superiority in performance under CT may be because of environmental conditions, for example, in CT, where barley genotypes have been released for the CT system. This is in agreement with a global meta-analysis conducted by Pittelkow et al. (Reference Pittelkow, Linquist, Lundy, Liang, van Groenigen, Lee, van Gestel, Six, Venterea and van Kessel2015) that reported a 5.1% reduction in crop performance in NT compared to CT. In a three-year study on wheat genotypes in rainfed conditions by Mohammadi et al. (Reference Mohammadi, Jalal Kamali and Gathala2021), wheat performance under NT decreased by 4% to 35% compared to CT, depending on crop rotation and growing season. In a four-year study conducted on maize and wheat in highlands of sub-humid tropical areas (Fischer et al., Reference Fischer, Santiveri and Vidal2002), grain yield under NT was at least equal to other tillage treatments, which was consistent with many studies reported by Lal (Reference Lal1989). They reported equal grain yield for NT and CT that was economically in favour of NT, as the residue remains in storage for animal feed until the next planting. In addition, more advantages of NT may be the reduction of wind and water erosion, low production cost and the improvement of soil chemical, physical and biological properties (Herrera et al., Reference Herrera, Verhulst, Trethowan, Stamp and Govaerts2013). Moreover, the global burden of chronic crises, including climate change, food insecurity, environmental degradations, and loss of biodiversity, can be solved by CA adoption worldwide (Kassam et al., Reference Kassam, Friedrich and Derpsch2022).
Based on our results, the variability in grain yield, and the NGPS was lower in NT than in CT, which indicates little variation for the testing traits in NT, leading to more stable wheat grain yield under unpredictable precipitation (Figure 2). In a study, Keil et al. (Reference Keil, Mitra, McDonald and Malik2020) revealed that NT provides stable yield in wheat and economic benefits under diverse climatic conditions of growing seasons. They concluded that zero tillage resulted in significant cost savings across all three years, corresponding to a 5% increase in average total household income.
Some patterns can be obtained from the GGE biplot analysis along with the crop performance of the genotypes. Genotypes Sararood1 and Yea1681 performed well across environments with average stability (Figure 7). However, these genotypes performed differently for other studied traits. Across tillage systems, breeding line Yea168 had the best combination of mean yield, PLH, NDVI and spike/m2 traits, while Sararood1 had the best combination of SPAD and NGPS (Figure 5d). However, depending on the tillage system, the agronomic performance of the genotypes was different. Under CT conditions, the breeding line Yea168 expressed the highest mean yield, spike/m2 and SPAD, while the cultivar Nader expressed the highest values of PLH, TKW, NGPS, and NDVI, and the other genotypes did not express well for any trait. Under RT condition, Yea168 expressed the highest average yield and PLH, while Sararood1 expressed the best for TKW, spike/m2, SPAD and NGPS; and Efes-3 exhibited highest NDVI. Under NT conditions, Yea168 performed best based on average yield, PLH and spike/m2, while Efes-3 expressed the highest TKW and NDVI; Sararood1 expressed the highest NGPS; and Nader showed the highest amount of SPAD.
In accordance with GGE biplot analysis, a suitable genotype must have both high mean grain yield and stable yield in different environments (Yan and Tinker, Reference Yan and Tinker2006). Considering these facts, Sararood1 and Yea168 genotypes were selected as high-yielding genotypes with average stability. Nader cultivar also had a general adaptation in different climatic and environmental conditions, because it showed the lowest distance from the index of average environment coordinate with an average yield above the grand mean.
Regarding tillage systems, breeding line Yea168 was identified as a high-yielding genotype with stability across tillage systems (Figure 4). Therefore, this breeding line can be released and cultivated in the three testing tillage methods in the rainfed areas in western Iran. Screening for higher grain yield and stability in environments with variable rainfall has become the most important objective in rainfed barley genetic improvement programmes (Mohammadi et al., Reference Mohammadi, Mahmoodi, Haghparast, Grando, Rahmanian and Ceccarelli2011). The genotype × tillage interaction was higher in Efes-3, Sararood-1 and Nader, while the genotype × tillage interaction was ignorable for the Abidar cultivar and breeding line Yea168. Furthermore, the results indicate the need for special barley breeding programmes for each tillage method. Still, the question of whether screening the genotypes under CA or no-till conditions can enhance performance under CA and possibly under CT conditions remains unanswered (Honsdorf et al., Reference Honsdorf, Mulvaney, Singh, Ammar, Burgueño, Govaerts and Verhulst2018).
We used GT-biplot to investigate relationships between grain yield and studied traits across tillage systems and locations. The results showed that the relationships between traits are slightly influenced by the tillage system. Across tillage systems, spike/m2 and NGPS were positively correlated with yield. Among these correlations, under CT and NT, spike/m2 was strongly correlated with mean yield, while under RT, the NGPS was closely related to yield. In NT conditions, other traits such as PLH, NDVI, and TKW had a strong correlation with yield, while under CT, SPAD positively correlated with grain yield, and in RT condition, PLH showed a positive correlation with yield. It has been reported that some agronomic and physiological characteristics showed correlation with grain yield, but their effects on grain yield are varied (Gutierrez et al., Reference Gutierrez, Reynolds, Raun, Stone and Klatt2012). Li et al. (Reference Li, Zhou, Sun, Jing, Tian and Wang2018) found that spike/m2 and NGPS in wheat played the most important role in grain yield. Yang et al. (Reference Yang, Yu, Ni, Yang, Liu, Wang, Tao and Wu2018) revealed that leaf area index, spike/m2, leaf nitrate reductase and leaf chlorophyll were positively associated with grain yield in wheat. According to GT-biplot, some agronomic and physiological characteristics (spike/m2, NGPS, PLH, NDVI and SPAD) showed a strong positive correlation with grain yield, while some of the traits had a negative correlation (i.e. TKW) with grain yield. One reason is that there is a trade-off between yield components, and a reduction in one of those components could not result in a decrease in grain yield (Yang et al., Reference Yang, Yu, Ni, Yang, Liu, Wang, Tao and Wu2018; Quintero et al., Reference Quintero, Molero, Reynolds and Calderini2018).
Correlations between traits were also different depending on location. At the Sarabnilofar, TKW, NDVI, PLH, and NGPS were strongly correlated with yield, while spike/m2 showed a weak positive correlation with yield, and SPAD was not correlated with yield. At the Dalahoo, NGPS, SPAD, and spike/m2 were strongly correlated with yield, while PLH showed a weak positive correlation with yield. TKW was not correlated with yield, while NDVI showed a negative correlation with yield. However, the environment is an important source of variability in genotypic traits (Mohammadi et al., Reference Mohammadi, Etminan and Shoshtari2019; Shirvani et al., Reference Shirvani, Mohammadi, Daneshvar and Ismaili2023). Rozbicki et al. (Reference Rozbicki, Ceglinska, Gozdowski, Jakubczak, Cacak-Pietrzak, Madry, Golba, Piechocinski, Sobczynski, Studnicki and Drzazga2015) reported that some traits in wheat were affected strongly by location than by genotype. In our study, the high variation in monthly and total rainfall in two locations over three years of study was observed. Such environmental differences affected the traits profile of barley genotypes. However, the findings of Fischer et al. (Reference Fischer, Santiveri and Vidal2002) on wheat in Mexico and Yau et al. (Reference Yau, Sidahmed and Haidar2010) on barley, chickpea, and safflower in Lebanon; and Mohammadi et al. (Reference Mohammadi, Jalal Kamali and Gathala2021) on wheat in Iran showed that the effects of various tillage systems varied with years and crop rotations. Similarly, Morell et al. (Reference Morell, Lampurlanes, Alvaro-Fuentes and Cantero-Martinez2011) reported that barley responses to tillage systems across years in Spain depended on rainfall, with the greatest yield increases with NT in dry seasons.
The barley genotypes in this study did not perform well in CA system, as their performance decreased compared to CT. The reason is that these genotypes were selected under CT system, and this may lead to the conclusion that adapted breeding materials are required to address better adaptability of barley genotypes for CA systems in the national barley breeding programme under dryland conditions. However, CA-based crop management technologies are in adapting phase yet in most part of the dryland areas in the country. Due to its advantages, including low production costs, improving soil physical, chemical and biological properties and decreasing soil and water erosion, and greater evironmental sustainability, it should be promoted by the government and the private sector.
Conclusion
On-farm trials, as the final stage of testing new genotypes, should be considered in breeding programmes to ensure genotype recommendation. The results indicated high variability in grain yield and other studied traits in farmers’ fields, which were significantly affected by genotypes, tillage systems, locations, and years. The highest mean productivity was recorded for barley genotypes under CT, followed by NT (3.6% decrease) and RT (5.8% decrease). Barley genotypes, except Efes-3, positively interacted with CT. Across locations and years, breeding line Yea168 outperformed all genotypes in all three tillage systems and should be recommended for cultivation under rainfed conditions in western Iran. Different environmental conditions between the two locations resulted in variations in the traits profile of barley genotypes. High-yielding genotypes had their unique trait profiles that led to high yields. For example, breeding line Yea168, followed by Nader cultivar, performed well in Sarabnilofar location, where TKW, PLH, NGPS, NDVI, and spike/m2 were the most important traits in deciding grain yield in this location, whereas in Dalahoo location, Sararood1 performed well, and TKW, SPAD, NGPS, and spike/m2 had considerable contributions to grain yield. These findings can further develop our understanding of the mechanisms of yield improvement in barley genotypes. However, these findings are specific to the western part of Iran. We are in the first steps of promoting CA, and it is not yet accepted by many rainfed farmers, even by many experienced experts. However, due to the unpredictable and harsh conditions caused by global warming and climate change, it is necessary to expand and accept it.
Acknowledgements
The authors would like to acknowledge the Dryland Agricultural Research Institute (DARI), Iran, for financial support. The Authors thank the two reviewers and editor of Expermental Agriculture for comments and corrections to this manuscript.
Competing interests
There is no conflict of interest.


 Open access