


Introduction
The Spanish municipality of Aldeaseca, in the region of Castilla y León, had in 2019 a total of 238 inhabitants, about 50 fewer than in 2009. Some kilometres away, in the region of Aragón, the municipality of Bello (around 300 inhabitants in 2009) had lost around 70 people in the same period. In both cases, in the two legislative elections in 2019, the far‐right party Vox increased its share of the votes, while the Spanish Socialists (PSOE or Partido Socialista Obrero Español) and the Conservatives (PP or Partido Popular) lost support, especially the former. These municipalities are grouped in what is popularly known as the ‘Empty Spain’ (ES) places all across the country that have experienced a significant demographic decline, with some of them at risk of disappearing. Yet, do the previous examples show a systematic electoral phenomenon? Is the narrative of population decline benefiting the far‐right empirically consistent across the Spanish territory? Or does depopulation pave the way for the emergence of parties that represent the rural voice, as we have observed in recent Spanish legislative elections? More in general, what are the electoral consequences of depopulation?
Only about a decade ago, many heralded the classical rural–urban cleavage as a relic of the past. Yet, across different countries and regions, we have recently witnessed the (re‐)emergence of the importance of place in our political discussions (Taylor et al., Reference Taylor, Lucas, Armstrong and Bakker2023). Place resentment seems to be gaining ground as a new issue in both party competition and in voters' decision‐making process. For instance, Trump's victory, among other factors, was partially attributed to rural resentment against urban dominance, its cultures and its policies (Cramer, Reference Cramer2016; Jacobs & Munis, Reference Jacobs and Munis2023). In this sense, rural dwellers, as a consequence of the situation of neglect by urban elites and of comparative grievance with metropolitan areas, were more likely to vote for Trump. Or the result of the Brexit referendum was shaped by the uneven consequences of austerity and globalisation across the rural–urban divide (Colantone & Stanig, Reference Colantone and Stanig2018; Fetzer, Reference Fetzer2019). Recent works have continued to look at the electoral consequences of the geography of discontent (Adler & Ansell, Reference Adler and Ansell2020; Furlong, Reference Furlong2019; Levi & Patriarca, Reference Levi and Patriarca2020; Munis, Reference Munis2022; Margalit, Reference Margalit2019) and Spain has not escaped this pattern (García del Horno et al., Reference García del Horno, Rico and Hernández2023; Rodon, Reference Rodon2020; Sánchez‐García & Negral, Reference Sánchez‐García and Negral2023).
Although the topic of the rural–urban has attracted much scholarly attention, extant literature has hitherto been largely oblivious to the role played by depopulation in driving political support. Depopulation is commonly understood as ‘the decrease of the number of inhabitants of a territory compared to a previous period as a consequence of a negative natural growth, a negative migratory balance or both simultaneously’ (Merino & Prats, Reference Merino and Prats2020, p. 1). Yet, depopulation has come to refer in many places to the spatially unequal loss of population, a pattern prevalent in already small municipalities that experience the loss of young inhabitants migrating from rural to metropolitan areas, the increase in the average age of residents, and the loss of economic opportunities and access to public services. This particular notion of depopulation is prevalent in many Western countries (Carbonaro et al., Reference Carbonaro, Leanza, McCann and Medda2018), especially the Southern European regions (Dijkstra et al., Reference Dijkstra, Garcilazo and McCann2013), and in some contexts the phenomenon, as well as the grievances associated with it, has been politicised.
This article fills this gap and aims to test the relationship between depopulation and electoral behaviour. On top of the rural–urban divide, we argue, depopulation is an additional and substantively different factor, grounded on different theoretical mechanisms and with potentially different consequences for electoral behaviour.
Besides testing the relationship between depopulation and electoral behaviour, which represents a contribution on its own, we contend that to comprehend the effect of depopulation on the parties' share of the votes it is crucial to consider the effect of some intervening factors. In particular, the municipality size, the change in the demographic composition, the variation in public services, and changes in the presence of amenities. Regarding the compositional dynamics, we examine whether depopulation is especially affecting municipalities where the share of old people – who are less likely to move – is higher (Sánchez‐García & Rodon, Reference Sánchez‐García and Rodon2023). In addition, in line with previous works (Cremaschi et al., Reference Cremaschi, Rettl, Cappelluti and Vries2022), when depopulated places also experience a loss in public services, such as schools or health facilities, it might be more likely to observe a change in electoral behaviour. The effect of depopulation might also increase when a place experiences a loss in amenities – that is supermarkets or bars. Finally, we analyse the electoral behaviour of municipalities at the end of the tail, that is, those that have lost much population and are at risk of disappearance.
Spain offers rich variation as it has a high number of municipalities – more than 8000 – with borders that have been relatively stable over time. Since 2001, 77 per cent of Spanish municipalities have witnessed a drop in population. While some places are increasingly gaining inhabitants – especially cities – others are losing them, often to the point of threatening their sheer existence.Footnote 1 Finally, the topic of depopulation has become salient. Mainstream parties have tried to attract the vote from depopulated regions, and some places have witnessed the emergence of new (electorally successful) parties representing the depopulated areas. Spain ultimately allows us to test whether depopulation proves electorally advantageous for mainstream parties or if it creates an opportunity for political entrepreneurs to gain electoral support.
Our empirical strategy employs a newly compiled municipality‐level dataset. We first examine general elections that took place in Spain between 1986 and 2019.Footnote 2 The second part analyses the elections between 2011 and 2019 taking into account a comprehensive list of controls that might be related to both depopulation and political support. Finally, we exploit the fact that some municipalities officially switch to a ‘depopulation risk’ category – attributed by the European Union – when they are at risk of disappearing, which brings about different targeted public policies as well as the realisation among their inhabitants that the trend might be irreversible. We apply a counterfactual estimation strategy (Liu et al., Reference Liu, Wang and Xu2024) to estimate the effect of switching on at the depopulation risk category on electoral behaviour.
Our findings show that the average effect of depopulation on electoral behaviour is positive for the mainstream Conservative PP. In other words, a municipality that has lost population over a relatively long period is more likely to report higher support for the PP. Conversely, results also show that depopulation hurts the Socialists (PSOE). In addition, when we look at the effect of depopulation on small municipalities or in places with a higher share of old people – which corresponds to the stereotypical vision of depopulation – we see that the mainstream Conservatives and the Socialists (albeit with less consistent results) perform better, while the new challenger parties perform worse. Taken together, our analyses point to the idea that depopulation benefits the PP due to a compositional change in the denominator: old voters are likely to stay in depopulated municipalities and are also more likely to vote for the traditional right, which automatically brings the relative support for the mainstream Conservatives upwards.
When we inspect if the effect of depopulation is stronger when the provision of public services decreases or the presence of amenities deteriorates, we find no systemic pattern, although the PP seems to win some support when depopulation increases and the municipality experiences a loss in public services. Finally, our counterfactual strategy shows that it is especially in very small municipalities, at the brink of disappearing, where depopulation is linked to an increase in far‐right support.
All in all, our analyses show that the dimension of depopulation has in itself an effect on electoral behaviour, which, on top of the rural–urban divide, can exacerbate attitudes of place‐based resentment and its electoral consequences.
Depopulation and electoral behaviour
Compared to studies on the rural‐urban divide, depopulation has not traditionally been a hot topic in the political science literature. Framed mostly as a by‐product of the rural–urban divide, often by default, the study of the effect of depopulation on election returns has only recently gained traction in some contexts. Overall, in this body of literature, one can identify at least four shortcomings. First, previous studies dealing with the relationship between depopulation on electoral behaviour are plagued with some theoretical and empirical inconsistencies, mainly because depopulation was not the core of their research goal. For example, Rickardsson (Reference Rickardsson2021) finds that there is greater support for Populist Radical Right Parties (PRRPs) in municipalities with lower short‐term population growth, which is conceptually different from depopulation, a phenomenon that takes place over a relatively long period. Or, Schütze (Reference Schütze2023) shows that emigration positively moderates the effect on the AfD vote by reducing levels of civic engagement. Yet, net emigration is only part of the story of population loss (Merino & Prats, Reference Merino and Prats2020), especially in those places where the natural change (the difference between the number of births and deaths) is likely to be greater, such as in rural and ageing areas.
Second, over the last few years, we have accumulated a dearth of evidence on how the rural–urban divide affects vote choice. Instead, departing mostly from the ‘losers of globalisation’ idea (Gordon, Reference Gordon2018; Kriesi et al., Reference Kriesi, Grande, Lachat, Dolezal, Bornschier and Frey2008; Rodrik, Reference Rodrik2018), many studies have considered that some places are left behind by the current economic trends, which leads to a feeling of abandonment and grievances (Goodwin & Heath, Reference Goodwin and Heath2016). Economic crises, unemployment shocks or the deterioration of social conditions trigger feelings of discontent and, as a consequence, an increase in support for challenger political formations (Rodon & Hierro, Reference Rodon and Hierro2016), mainly PRRPs (Ferrari, Reference Ferrari2021), but also other forms of protest vote (Rickardsson, Reference Rickardsson2021; Van Der Brug et al., Reference Van Der Brug, Fennema and Tillie2000). Being a conceptually different concept than the rural–urban divide and the ‘left behind’ places, depopulation is a rural phenomenon (Carbonaro et al., Reference Carbonaro, Leanza, McCann and Medda2018), but not all rural places are losing population. If we focus on Spain, our case study, we can see that most of the municipalities that lose population are rural, but there are also cities and suburbs losing population (see Figure A.3 in the online Appendix). In addition, as we shall see below, the theoretical underpinnings linking the rural–urban divide and depopulation to electoral behaviour are entirely different. The rural–urban divide has its theoretical basis in how community type affects the development of certain political attitudes and behaviours. For example, if we focus on cosmopolitan values, along the lines of Maxwell (Reference Maxwell2020) or Cramer (Reference Cramer2016), on the one hand, we have rural areas, small and anti‐cosmopolitan communities, which are more likely to have conservative, anti‐immigration or negative feelings towards politics (Lago, Reference Lago2022; Mitsch et al., Reference Mitsch, Lee and Ralph Morrow2021). On the other hand, cities, larger communities and cosmopolitans, with higher levels of education, are more likely to have a more progressive or pro‐immigration orientation (Cavaille & Marshall, Reference Cavaille and Marshall2019; Maxwell, Reference Maxwell2020). We contend that depopulation is above and beyond a qualitatively different factor that can on its own affect electoral behaviour.
Third, although the effect of depopulation has generally been overlooked, a few notable exceptions have started to examine its electoral implications. For instance, Dancygier et al. (Reference Dancygier, Dehdari, Laitin, Marbach and Vernby2024) show that depopulation in Sweden triggered discontent and support for the far‐right. Yet, many of the studies examine the relationship between depopulation and voting for the far‐right, without fully considering support for the other parties (Di Matteo & Mariotti, Reference Di Matteo and Mariotti2021; Rickardsson, Reference Rickardsson2021; van Leeuwen et al., Reference van Leeuwen, Halleck Vega and Hogenboom2021).
Finally, previous studies that have considered the effect of depopulation on electoral behaviour have not examined possible heterogeneous effects. We argue that to fully grasp the effect of depopulation it is important to consider that compositional changes, the variation in public services and amenities can moderate its relationship with vote choice.
From a theoretical point of view, the effect of depopulation on electoral behaviour is grounded on different potential channels.
First, in line with the place‐based resentment literature, depopulation may cause a shift in preferences among inhabitants staying behind. A decrease in population may be accompanied by a decline in public services (Lykke et al., Reference Lykke, Haase, Jensen and Schmidt2021) as funding is generally linked to population, and the provision of public services tends to have population thresholds. Private businesses are also hurt. People in depopulated places increasingly have fewer places to buy what they need or simply engage in leisure activities. The feeling that the place is becoming deserted may increase, and people may soon realise that in these places economic and social opportunities are scarce. This may generate a ‘negative spiral of social and economic developments’ (van Leeuwen et al., Reference van Leeuwen, Halleck Vega and Hogenboom2021), which create fertile ground for ‘place‐based resentment’ and place‐based identities (Huijsmans, Reference Huijsmans2023b, Reference Huijsmans2023a) and the subsequent ‘geography of discontent’ (Dijkstra et al., Reference Dijkstra, Poelman and Rodríguez‐Pose2020). Overall, and as suggested by previous works, depopulation, especially when it comes to public service deprivation and changes in the urban environment, may increase the appeal of certain parties, such as the far‐right (Cremaschi et al., Reference Cremaschi, Rettl, Cappelluti and Vries2022; Essletzbichler & Forcher, Reference Essletzbichler and Forcher2022; Rickardsson, Reference Rickardsson2021).
Second, instead of a change in preferences, depopulation may trigger an electoral effect due to compositional changes. As it is well documented, the likelihood of moving from one municipality to another is not random. The profile of movers tends to be that of a young and higher than average educated voter (González‐Leonardo & López‐Gray, Reference González‐Leonardo and López‐Gray2019). The population remaining in the municipality is likely to be older (Di Matteo & Mariotti, Reference Di Matteo and Mariotti2021; Díez & Pardo, Reference Díez and Pardo2020), less educated and more rooted to the place (Anelli & Peri, Reference Anelli and Peri2017; Immerzeel & Pickup, Reference Immerzeel and Pickup2015; Lee et al., Reference Lee, Morris and Kemeny2018), attributes that tend to be associated with higher support for the PRRPs (De Vries, Reference De Vries2018; Fitzgerald, Reference Fitzgerald2018; Goodwin & Heath, Reference Goodwin and Heath2016). Yet, in an argument largely overlooked by previous works, following the sociological model of voting, old people are also less likely to change their support as their political allegiances were frozen during the political socialisation they experienced in their youth (Campbell et al., Reference Campbell, Converse, Miller and Stokes1976). In other words, when a municipality experiences depopulation, people staying behind may still vote for the same party they have always voted for. Thus, according to this second narrative, the potential effect of depopulation on electoral support does not come from a change in preferences among people staying behind, but rather a change in the denominator – a compositional change.
The different paths (or labyrinths) of depopulation
In line with the findings of Sánchez‐García and Rodon (Reference Sánchez‐García and Rodon2023), we believe that it is important to factor in the effects of depopulation across the characteristics or contexts of the municipalities (heterogeneous effects). In the case of Spain, we consider the existence of at least four variables that may moderate (amplifying or decreasing) the effect of depopulation on electoral behaviour.
First, we suggest that municipality size may exert a moderating effect. At the aggregate level, we can observe that small Spanish municipalities have mostly supported the two mainstream parties, especially the Conservatives – even after the breakdown of the two‐party system (Fernández‐Gracia & Lacasa, Reference Fernández‐Gracia and Lacasa2018). We expect that citizens living in small areas are more likely to be older and with relatively frozen political allegiances, thereby clinging on to mainstream parties even if depopulation occurs. Empirically, we expect that the mainstream Conservatives, a party that scores high in agrarian and traditionalist dimensions (see Figures B.3 and B.4 in the online Appendix), should receive an increase in electoral support in municipalities that are small and lose population.
Second, the effect of depopulation might be moderated by the change in the demographic composition of a municipality. Depopulation is usually linked to the emigration of young people and, therefore, the ageing of these municipalities. We believe that ageing can be a moderating variable on the effect of depopulation on electoral behaviour. While young people who emigrate are inclined to vote for the challenger parties, old people in Spain vote for both the PP and the PSOE (Marcos‐Marne et al., Reference Marcos‐Marne, Plaza‐Colodro and Freyburg2020), especially for the former (see online Appendix B for voting trends in Spain). We suggest, therefore, that in depopulated municipalities with a higher presence of older people, there will be greater support for the mainstream parties, especially for the PP, a conservative party with a traditionalist narrative and greater success among elderly people.
Third, depopulation may interact with the loss of some public services (especially health and education). Thus, we consider that the variation in the provision of public services may also moderate the effect of depopulation. Depopulation and the deterioration in the provision of public services may imply that municipalities suffering from it will increase their support for parties advocating greater investment in the provision of public services. Accordingly, left‐wing parties (PSOE and UP), on average more supportive of the welfare state, should receive a greater share of the votes. Notwithstanding this narrative, recent literature points to a different type of expectation: considering the geography of discontent, Cremaschi et al. (Reference Cremaschi, Rettl, Cappelluti and Vries2022) show that the decrease in public services increases the performance of the far‐right – see also Essletzbichler and Forcher (Reference Essletzbichler and Forcher2022). According to the place‐based resentment literature, the expectation is that both depopulation and the erosion of public services can feed polarising narratives and benefit the PRRPs (Borwein & Lucas, Reference Borwein and Lucas2023; Huijsmans, Reference Huijsmans2023b).
Fourth, in terms of the amenities – the vibrancy of the town, and focusing on the left‐behind literature, expectations point to a benefit for the far‐right (Di Matteo & Mariotti, Reference Di Matteo and Mariotti2021; Engler & Weisstanner, Reference Engler and Weisstanner2021). Bolet (Reference Bolet2021) found that local socio‐cultural degradation in the United Kingdom linked to the closure of leisure spaces was also linked to greater support for the radical right. In this sense, municipalities that are losing population and suffering economic decline and/or socio‐cultural degradation are fertile ground for the PRRPs for several reasons. Most notably, it is natural in these places for negative and nostalgic narratives to emerge about what they have been and what they have had (Tomaney et al., Reference Tomaney, Blackman, Natarajan, Panayotopoulos‐Tsiros, Sutcliffe‐Braithwaite and Taylor2023). In this vein, as Frischlich et al. (Reference Frischlich, Clever, Wulf, Wildschut and Sedikides2023) and Elgenius and Rydgren (Reference Elgenius and Rydgren2022) show, nostalgia is in many cases, but not exclusively, fuel for the radical right, especially when there is group‐based deprivation (Versteegen, Reference Versteegen2023).
Finally, we consider as theoretically relevant to look at the end tail of the distribution, that is, examine the electoral behaviour in municipalities at the risk of survival. Most of these municipalities are rural areas with very few inhabitants (Recaño, Reference Recaño2017), and their time horizon as a community is different compared to other small places losing population but not to the extent that the entire town can disappear. Therefore, in these contexts, the expectation is that it is more likely that there will be a higher vote for parties defending rural interests, which tend to be mostly right‐wing parties (online Appendix B). Thus, we suggest that entering the category of risk of depopulation may positively affect both the Conservative PP and the far‐right Vox. In particular, we believe that the latter will be the main beneficiary not only because of its rural narrative (Valero, Reference Valero2022) but also because, as a PRRP, it can better channel discontent and complaints and bring them to the electoral arena.
Research design
Our empirical analysis employs a newly compiled dataset that includes a combination of indicators from various official sources. The unit of observation is the municipality election. Thus, the dataset has a panel structure (time‐series cross‐section) in which each municipality is present at several points in time – the different general elections. Due to the long period considered, the dataset has some missing values because of the creation and disappearance of some municipalities. However, the stability of municipalities in Spain has been fairly constant over time with a loss of only 213 when comparing the first 1979 election to the last one (about 2.6 per cent of municipalities).Footnote 3
Electoral support
The percentage of votes obtained by the different candidacies (party lists) in the elections to the Spanish Parliament since 1989 is used as the dependent variable. This indicator captures the support received by the main state‐wide parties – PSOE, PP, Podemos, Ciudadanos (Cs), and Vox – but also the non‐state wide parties (NSWP).Footnote 4 We also capture under the label ES those party lists whose main political claims revolve around depopulation and the lack of resources and opportunities granted to the depopulated provinces they want to represent. This includes lists such as !Teruel Existe! (Teruel Exists!).
Depopulation
Despite being important in the public discourse, the academic literature does not offer a single widely accepted indicator. In line with our theoretical conceptualisation, and using information obtained from the municipal population register provided by the Spanish National Statistics Institute, we have created a categorical indicator on whether the population increased, decreased or did not change over a relatively long period. The operationalisation consists of two phases. In the first step, following the formula proposed by Sánchez‐García and Rodon (Reference Sánchez‐García and Rodon2023), we capture the rate of depopulation of the municipalities:
 $$\begin{equation} depopulation_{y,m} = - (\frac{P_{y,m} - P_{y-t,m}}{P_{y-t,m}})\times 100,\end{equation}$$
where $P_{y,m}$ is the population of each municipality ( $_{m}$) in the respective year ( $_{y}$), and ${P_{y-t,m}}$ is the population of the previous period ( $_{y-t,m}$). As a main measure, we take two legislatures as a time criterion, which means that the time covered ( $_{t}$) is, overall, 7–8 years.Footnote 5 In the second step, we split this continuous variable into three categories: decrease, increase and no change. The threshold for the categorisation is whether the depopulation change is higher than $+0.5$SD of that year, lower than $-0.5$SD of that year, or greater than $-0.5$SD and less than $+0.5$SD, respectively. We believe that a categorical variable is a good choice for three reasons. In line with the work of van Leeuwen et al. (Reference van Leeuwen, Halleck Vega and Hogenboom2021), we consider that a variable of this type facilitates comparability between municipalities according to their demographic dynamics. Second, when running the interaction this coding eases the interpretability of the coefficients. Finally, it allows us to mitigate problems of very frequent outliers in demographic indicators.
More in general, the time points considered to code depopulation go in line with how we theoretically conceive depopulation: as a phenomenon that occurs over a relatively long period. In addition, political parties in some elections have referred to the population a town had some elections ago, which makes looking at two elections a realistic benchmark. Nonetheless, assuming that this criterion could be biased, we show the results using other periods such as ‘t = 10’ to demonstrate the consistency of our results.Footnote 6
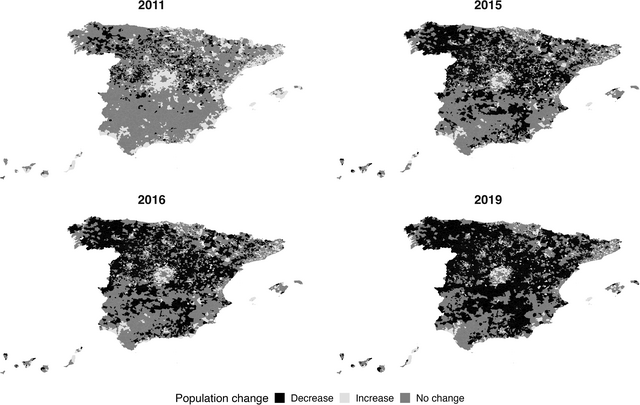
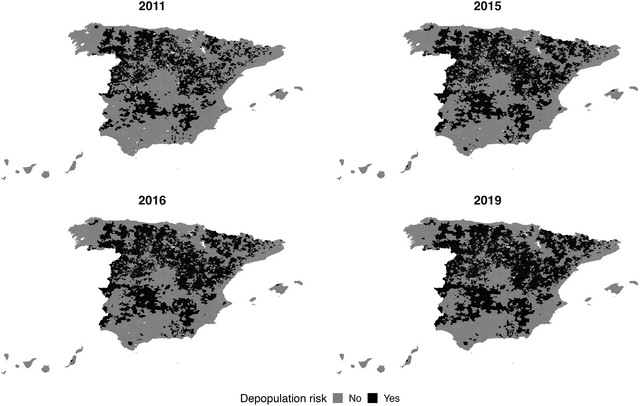
The geographical distribution of this depopulation measure is plotted in Figure 1. It shows that depopulated municipalities are concentrated in the northern and central parts of the peninsula, although the incidence of depopulation has increased over time and across space.
Geographical distribution of the depopulation factor (2011–2019).

Additional indicators
The analysis controls for some factors that might affect both depopulation and electoral support. The first set of controls corresponds to demographic variables. On the one hand, we use the logarithm of the population of each municipality. On the other hand, we use two variables that capture compositional change: the variation in people over 60 years old and the change in people under 16 years old. In all cases, we use the same two‐elections time criterion as in our main independent variable.
Another group of variables captures the characteristics of the economic sector and productive context of each municipality. Using the data obtained from the Spanish Urban Agenda, we incorporate the percentage of the unemployed population (the number of unemployed people over the total potentially active population of the municipality), the percentage of service sector workers and the percentage of agricultural workers (the number of workers in each of these sectors over the total potentially active population in the municipality).
Moreover, we include two more indicators to gather information about the provision of public and private services. The first one is a categorical indicator capturing whether the provision per capita has increased, decreased or there has been a mixed trend. It considers data on health care – the number of local clinics and health centres per capita, obtained from the Spanish Ministry of Health – and on education – the number of primary and secondary schools per capita, which has been collected from the different regional governments.Footnote 7 With those two indicators, the final indicator of public services sets four categories based on the combination of the two: both increase, decrease or remain equal, or there has been a mixed trend. The indicator of variation in the presence of amenities is also categorical and determines whether the provision has increased, decreased or remained constant. To compute it, we take the logarithm of the percentage of properties intended for the following three uses: hospitality, commercial and retail. This information has been obtained from the Spanish cadastre.
There might be a concern that the depopulation indicator is strongly correlated with our moderating variables or, in other words, that some combinations are empty. For instance, one might argue that there might not be many cases in which a municipality that loses population gains public services. In online Appendix B, we show that, across all the different combinations, we have enough observations to run the different analyses.
Finally, we compute a binary indicator of the depopulation risk. According to the official definition set up by the European Union and applied by the Spanish government (Banco de España, 2021), it is considered that municipalities are at risk of disappearing if they have a negative population growth, a negative natural balance and an internal population density of 12.5 inhabitants per square metre.
Empirical strategy
To examine the relationship between depopulation and election results we adopt a three‐step empirical strategy.
First, our estimation strategy relies upon a series of fixed effects (FE) models. FE models remove variation between units – municipalities in our case – that are constant over time as well as among factors shared by all groups that vary over time. Accordingly, we explore variation in depopulation over time within municipalities to identify the impact of losing population. The municipality‐specific fixed effects are correct for all time‐constant heterogeneity among municipalities (Allison, Reference Allison2009). Hence, each municipality acts as its own control, and the model estimates how within‐changes in depopulation affect within‐changes in the share of the votes for the different parties. FE models ensure that the estimated associations between depopulation and political behaviour solely reflect within‐municipality relationships. Our models thus control for the possibility that municipalities that are more likely to end up in certain depopulation states (or experience several depopulation trends) have different benchmark electoral results.
In turn, we divide the first analysis in two. In the first part, we perform a long‐run analysis between 1989 and 2019 and we test the effect of depopulation on the share of the vote for the two mainstream parties and the NSWPs. For this period, due to the absence of historical data at the municipal level that can be used as controls, we only employ our factor of population decline as independent variables. In the second part, we use data from 2011 to 2019. In this period, in addition to these parties, we analyse the effect of depopulation on new parties (Podemos, Cs and Vox), including political formations that represent the ES. Crucially, we incorporate time‐varying controls.
Next, in line with our previous expectations, we examine the effect of depopulation on electoral support as a function of municipality size, compositional change, the variation in public service provision and the presence of amenities.Footnote 8 We perform interactions between these different variables and the depopulation factor on the vote for the main parties in the five national elections held between 2011 and 2019.
Last but not least, we carry out an analysis of the effect of declaring a municipality at the risk of disappearing on electoral behaviour. In this case, we use a counterfactual estimation strategy, as designed by Liu et al. (Reference Liu, Wang and Xu2024). This model allows us to zoom in on the extremes of depopulation and test whether municipalities fall into the risk of depopulation category, based on the criteria established by the European Commission,Footnote 9 are more likely to support certain political formations.
Results
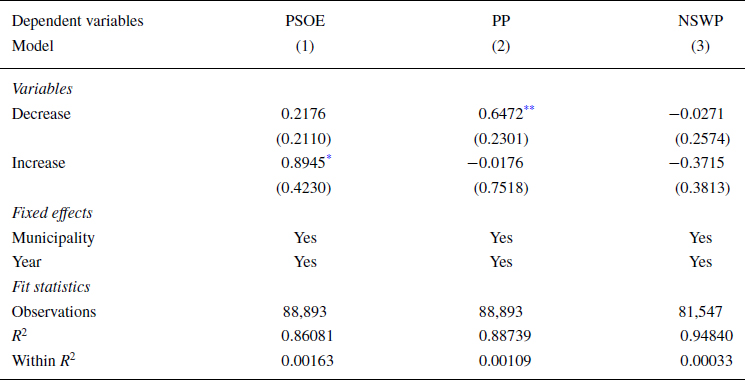
Table 1 shows the first set of models. We employ the share of the votes obtained by the two Spanish mainstream parties (PSOE and PP) and NSWPs. Recall that this long‐window analysis focuses on parties that have been largely stable since the eighties and that we lack important controls. The analysis is nonetheless relevant because it shows us a first glimpse of whether depopulation triggers systematic electoral effects.Footnote 10
The effect of depopulation on vote choice (1986‐2019)

Note: Clustered (region and municipality and year) standard errors in parentheses.
Abbreviations: NSWP, non‐state wide parties; PP, Partido Popular; PSOE, Partido Socialista Obrero Español.
Significance codes: ***, 0.01; **, 0.05; *, 0.1.
Note: Estimates derived from a two‐way fixed effects model (TWFE). SE clustered at the level of municipality and year. 8,205 municipalities.
When we look at the entire window of elections that have taken place in Spain since the post‐transition to democracy, models show that depopulation does have an on average significant effect. In other words, municipalities that have lost population report systematic larger support for the PP. Conversely, municipalities that have gained population show higher levels of support for the PSOE. All in all, this first piece of evidence points out the idea that depopulation seems to matter in the long run for the Conservatives and the Socialists, but not for the NSWPs. In the case of the Socialist Party, it is not depopulation but population growth that has a positive effect on its share of the vote – which is consistent with the idea that municipalities gaining population are mainly urban, which is precisely the environment where the Socialists perform better.
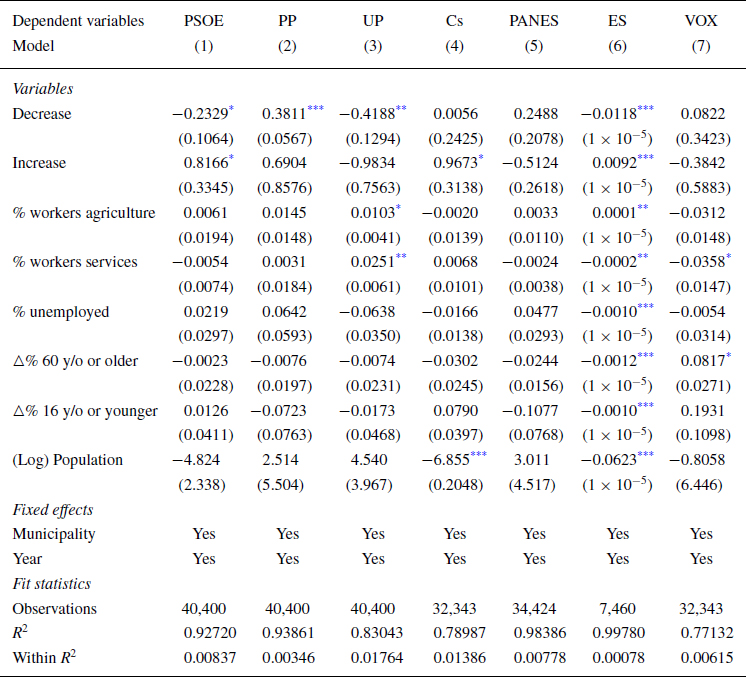
We next restrict our attention to a shorter period. Although the previous analysis takes into account all elections, it is potentially plagued with confounders. Looking at the 2011–2019 period, we can include several time‐varying municipality‐level factors that are likely to be correlated with within‐changes in support for the different parties. To that avail, we now run the same models as before but include the controls discussed in the methods section. Table 2 shows the results. The analysis confirms the positive and statistically significant relationship between depopulation and support for the PP, the mainstream Conservatives. As for the PSOE, not only the previous results are confirmed but this model also reports a negative relationship between a loss of population and its share of the votes. Similarly, we observe that municipalities experiencing population decline are less likely to support the left‐wing Unidas Podemos (UP). Substantively, municipalities that lost population in a window of two legislatures report 0.37 percentage points more votes for the PP as well as some 0.23 and 0.42 percentage points fewer votes for the PSOE and Podemos, respectively. Interestingly, albeit the effects are small the analysis reveals a negative significant relationship between depopulation and voting for the ES, the political formations that emerged to represent the voice and preferences of municipalities' losing population.Footnote 11
The effect of depopulation on electoral results (2011–2019)

Note: Clustered (region and municipality and year) standard errors are in parentheses.
Abbreviations: Cs, Ciudadanos; ES, Empty Spain; PP, Partido Popular; PSOE, Partido Socialista Obrero Español; UP, Unidas Podemos.
Significance codes: ***, 0.01; **, 0.05; *, 0.1.
Note: Estimates derived from a TWFE. SE clustered at the level of AC, municipality and year. ES models are restricted to ACs of Aragón, Castilla y León and to 2015, 2016 and 2019 (10 November).
Municipality size
The average effects reported above miss an important part of the story regarding the effect of depopulation. In other words, depopulation is unlikely to equally affect big or small municipalities. For instance, looking at the data, Barcelona has over the last years lost a lot of population, but the effects of depopulation are arguably different in the Catalan capital compared to other (smaller) municipalities. We next dig a bit more into the heterogeneous effects of depopulation across a set of key indicators.
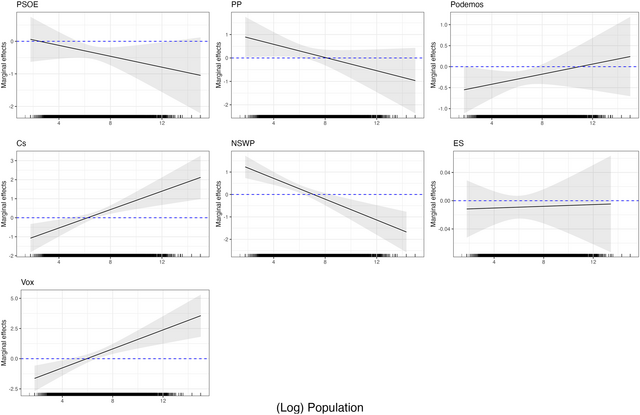
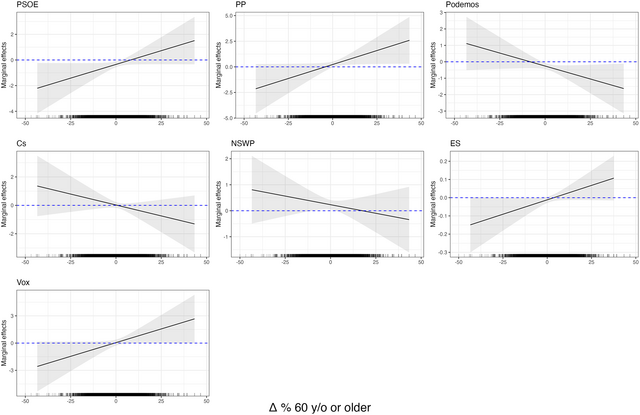
We first look at the effect of depopulation across municipality size. To do so, we interact our depopulation factor with the log of the municipality's population. Figure 2 shows the marginal effects of such an interaction for each of the parties.Footnote 12 The figure reveals different dynamics regarding the effect of depopulation as a function of the size of the municipality. Starting with the mainstream parties, we observe that depopulation – as opposed to the ‘no change’ category – benefits the PP in small municipalities. In substantive terms, when a municipality of around 160 inhabitants (the first quartile of the distribution) loses population, the Conservatives obtain a share of the votes 1.5 p.p. higher compared to a situation in which depopulation does not occur. A similar pattern seems to arise for the PSOE, but the relationship falls short of statistical significance. In the case of the right‐wing party, Cs, and the far‐right Vox, the results show a negative effect of depopulation in the smaller municipalities, while they achieve a notable positive effect in the large population centres. NSWPs show that depopulation in smaller municipalities generates positive electoral returns for them.
The effect of depopulation across municipality size.
Note: Estimates derived from an interaction between the depopulation and the municipality size indicator. The model includes the same controls as in Table 2 and year FE. Standard Errors (SE) clustered at the Autonomous Community (AC), municipality and year level. ES models are restricted to ACs of Aragón, Castilla y León and to 2015, 2016 and 2019 (10 November). Marginal effects are relative to the ‘no change’ category.

Compositional effects
Depopulation mainly implies that some people leave a municipality – usually small and rural – and go work or live in another one – usually urban and larger. As mentioned in the theory, previous research has reported that the probability of leaving small towns differs across age groups. Young people are more likely to seek job or education opportunities elsewhere than old people. This pattern essentially means that depopulation is likely to go in parallel with compositional change, whereby rural and small places increasingly become places where young people become the exception, rather than the norm. Given that young voters tend to behave differently than old ones, it might be that depopulation does not change the electoral behaviour of those staying behind, but rather those who vote differently end up leaving – a negative self‐selection effect. The empirical implication of this pattern is that we should observe differences in electoral support in those places where depopulation has increased and, at the same time, the proportion of old people has also increased.
To explore such a relationship, we run an interaction between our depopulation factor and the change in the percentage of people 60 years old or older. Results, shown in Figure 3, confirm the idea that depopulation has different effects across the change in age composition of the municipality. If we look at the mainstream parties, the largest positive effect is observed for the PP. Also, albeit less clear, for the PSOE. Thus, in places that have lost population and where the percentage of old people has increased, the Conservatives perform comparatively better. This pattern is consistent with electoral support across age groups in Spain, whereby old cohorts are more likely to support mainstream parties (see online Appendix B). In substantive terms, in a municipality where the percentage of old people increases by about 100 per cent and loses average levels of population, the share of the votes obtained by the Conservative PP is 1.5 p.p. higher than in similar places but where the share of old people has not increased. We also see that in places losing population and where the age composition has changed in favour of old people, some of the challenger parties, such as Podemos or Cs perform worse.
The effect of depopulation across different values of the change in people 60 years old or older.
Note: Estimates derived from an interaction between the depopulation and the first difference of the share of the percentage of people who are 60 years old or older. The model includes the same controls as in Table 2 and year FE. SE clustered at the AC, municipality and year level. ES models are restricted to ACs of Aragón, Castilla y León and to 2015, 2016 and 2019 (10 November). Marginal effects are relative to the ‘no change’ category.

The role of public services
We next explore whether the effect of depopulation on electoral behaviour can be exacerbated if people living in these places lose access to certain public services. If an individual lives in a small municipality that is losing population, he/she might be able to cope with it, but life becomes more difficult if certain services disappear. Voters might eventually change their preferences and start voting to express their grievances and abandon traditional parties in favour of new options that aim to better represent them – such as the far‐right or ES parties. Using the information on two important public services (health and education services), we dig into this dynamics by examining the effect of depopulation when a municipality experiences an increase or, most commonly, a decrease in public services.
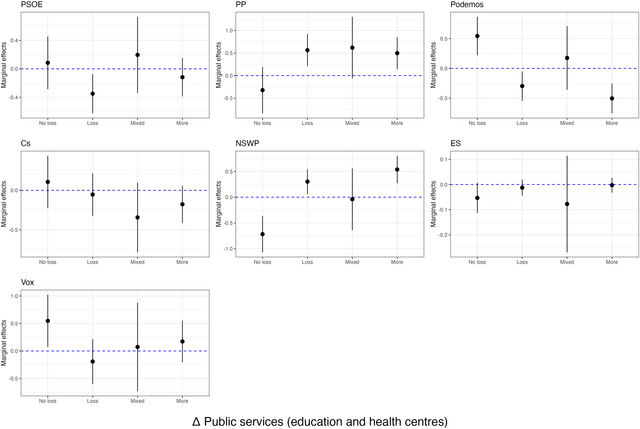
Figure 4 plots the marginal effects of the interaction between the increase/decrease in health and education services and the depopulation indicator.Footnote 13 Findings point to the idea that it does not seem that the loss in public services fuels political support for left‐wing parties. PSOE and Podemos perform slightly worse in municipalities that are depopulating and losing public services. Instead, we see a positive and statistically significant relationship between depopulation and the loss of public services on the PP and NSWP vote. Hence, results point to the idea that the grievances associated with a loss in public services are channelled through the mainstream Conservatives or NSWPs.
The effect of depopulation and the loss of public services (education and health centres) on electoral behaviour.
Note: Estimates derived from an interaction between the depopulation indicator and the evolution of public services. The model includes the same controls as in Table 2 and year FE. SE clustered at the AC and year level.

Finally, and in contrast with the previous analyses (Cremaschi et al., Reference Cremaschi, Rettl, Cappelluti and Vries2022), we do not see that municipalities that have experienced a loss in public services and have lost population, are more likely to report higher support for the far‐right. Despite increasing appeal to rural voters and rural traditions, Vox in Spain largely emerged as a result of the national dimension and the grievances related to Spanish nationalism were at the core of its platform (Valero, Reference Valero2022; Rodon, Reference Rodon2020). Therefore, instead of a discourse related to immigration or the loss in the quality of public services (for the natives), it had different characteristics compared to its European counterparts, which can explain this different result.
Variation in the presence of amenities
The effect of depopulation in electoral changes can also be especially prevalent when it goes hand in hand with the loss of services provided by the private sector – a general loss of the vibrancy of the town. To explore these dynamics, we focus on the role of the service sector and, in particular, the sectors of hospitality, commercial and retail.
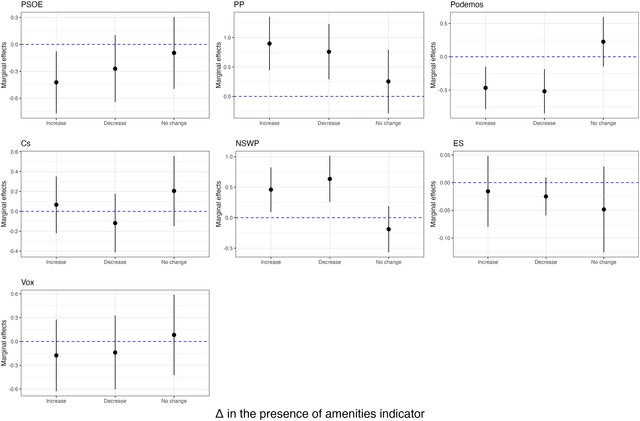
Figure 5 shows the marginal effects of the interaction between the evolution of the service sector and depopulation. The effect does not show a consistent pattern. Municipalities that experienced a loss in population and a negative variation in the presence of amenities do not systematically favour (or penalise) certain parties.
The effect of depopulation and the loss of amenities on electoral behaviour.
Note: Estimates derived from an interaction between the depopulation indicator and the evolution of the service sector (hospitality, commercial and retail). The model includes the same controls as in Table 2 and year FE. SE clustered at the AC, municipality and year level. Marginal effects are relative to the ‘no change’ category.

To sum up, the analysis up to now shows that depopulation triggers electoral changes, but the effect is not homogeneous. Findings show that depopulation mainly benefits the mainstream Conservative party, a relationship especially arising in small places, and where the share of old people is higher. Although the trend is less clear, in the same contexts the socialists – the mainstream left – also benefit from depopulation. Conversely, it electorally hurts the left, especially the party that mainly draws its support from the middle urban class (Podemos). The reason for such an effect does not seem to be the loss of public services nor a deterioration of the vibrancy of the town, but rather a change in the age composition of the population. Young people are more likely to leave small municipalities and old people are more likely to stay. This triggers a change in the denominator in small municipalities and, given that old people are more conservative than young people, leads depopulated municipalities to report higher support for mainstream parties – especially the Spanish Conservatives.
Depopulation risk
Although the previous analyses explored within‐changes in depopulation and political support, there could still be other unobserved time‐varying confounders playing a role. In this section, we resort to a difference‐in‐differences framework and analyse the effect on political support when a municipality enters the category of ‘depopulation risk’. Given the time‐series cross‐sectional nature of our data, we apply a counterfactual estimation, as suggested by Liu et al. (Reference Liu, Wang and Xu2024). We exploit the fact that due to depopulation some municipalities officially enter the depopulation risk category, and the news is widely reported locally. Even though the depopulation trend was already present, when it becomes official citizens realised that a negative threshold has been reached and that the future of the municipality as a viable entity is at stake (see online Appendix E).
Figure 6 shows the spatial distribution of municipalities in the depopulation risk category. It illustrates how the number of municipalities considered at risk has increased over time. In 2011, they represented slightly over 30 per cent of the municipalities. In early 2020, more than four out of 19 Spanish municipalities were classified in the depopulation risk category.
Municipalities at risk of depopulation.
Note: We follow the criteria developed by the European Commission (developed in online Appendix E) to consider municipalities at risk of depopulation.

We explore whether switching to a ‘depopulation risk’ category affects the share of the votes a party receives. The analysis provides us with a slightly different picture than the previous ones. Instead of focusing on depopulation in general, the models below focus on municipalities that are already very small and on the verge of disappearance. Each municipality enters the risk category at different points in time. Some of them, albeit constituting the exception, also leave the depopulation risk category. Thus, this staggered adoption also allows us to estimate the short and mid‐run effects of depopulation.
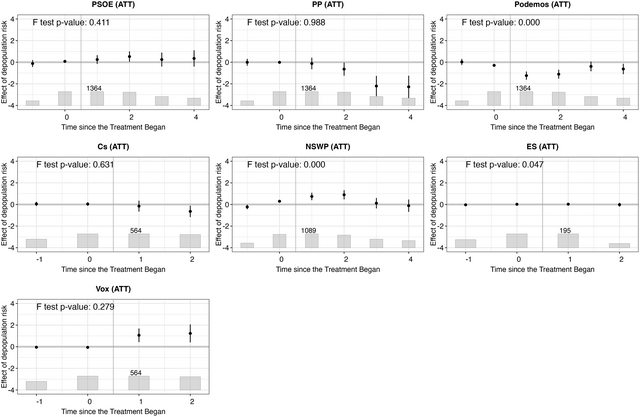
Figure 7 shows the dynamics of treatment effects in the form of the average treatment effects on the treated (ATT) after treatment adoption – the effect of electoral support among municipalities in the depopulation risk category. In most cases, and despite having a limited number of points, the pre‐trends are not detected and hence the effect can mainly be attributed to entering the depopulation risk category. We observe several important patterns: First, contrary to the average effect of depopulation, being at depopulation risk does not electorally benefit the PP – or to a lower extent the PSOE. In the mid‐run, entering the risk of depopulation category ultimately harms the performance of the mainstream Conservatives. Second, consistent with some previous studies (Dancygier et al., Reference Dancygier, Dehdari, Laitin, Marbach and Vernby2024), being in the depopulation risk category implies an increase in support for the far‐right party Vox. Although the party's support mainly comes from large urban centres and attracts voters that give greater salience to the national dimension (Rodon, Reference Rodon2020; Sánchez‐García & Negral, Reference Sánchez‐García and Negral2023), these results show the far‐right was able to make electoral inroads in the more extreme cases of depopulation. Finally, in line with the analyses above, municipalities at risk of disappearing do not give higher support for ES, the political platform that sought to represent them.
The effect of switching on to depopulation risk on electoral support.
Note: Estimates derived from a fixed effects counterfactual estimator model.

Conclusions and discussion
This article has attempted to dig into the dynamics of depopulation and electoral behaviour. Depopulation has recently become a salient issue in many contexts, and it is likely to stay on the forefront due to the dynamics of urban concentration, co‐location of private and public services and, in some cases, public policies that prevent (or foster) it. Many governments, most of them compelled after sweeping electoral changes, are already trying to tackle the issue with different territorial levelling‐up mechanisms. In line with recent discussions, we have studied in this article whether depopulation in Spain affects PRRPs, as suggested by recent works, but also on mainstream parties or other political formations in the system. Many previous works, we argue, compare rural and urban municipalities, without fully considering the dynamics of depopulation, understood as a phenomenon that takes place over a relatively long period and that can affect electoral behaviour on top of place‐based grievances.
Our results show that depopulation is linked to higher support for the PP, the mainstream Conservatives. This is essentially the case in small municipalities or where the share of old people has increased. In contrast, the ‘new left’ and other challenger parties perform worse in the same environments. Although the pattern is less consistent, results also show that the mainstream left (the PSOE) also obtains a (small) electoral boost when a small municipality loses population – a result consistent with the distribution of electoral support across age groups in Spain. When looking at the different heterogeneous effects, albeit not consistent, we see that losing population and public services harms the left – both PSOE and Podemos, but benefits the mainstream right (PP). Thus, the findings overall show not only that depopulation is important to consider beyond the rural–urban divide, but that the electoral change it triggers is mainly explained by a compositional effect. In other words, as young people, on average more likely to be left‐wing, leave small (already depopulated) municipalities, the share of the votes for the mainstream Conservative parties in depopulated areas automatically increases. In addition, in extreme cases of depopulation, as the counterfactual estimator strategy has shown, support for the far‐right goes up.
Compared to other works (Dancygier et al., Reference Dancygier, Dehdari, Laitin, Marbach and Vernby2024), our study shows that the far‐right is not the only beneficiary of depopulation. We find two distinct channels through which depopulation affects right‐wing parties. On the one hand, the mainstream Conservative PP has generally performed better in depopulating municipalities and, as the denominator changes (population leaving), their performance gets relatively better. Inhabitants in depopulated places may see that the world of reference around them is changing, but this might not be enough to change the way they have voted during their lives and start supporting the far‐right, at least in the short run. On the other hand, when the depopulation situation becomes extreme, the far‐right Vox gains higher levels of support while the PP obtains negative returns. Yet, future work will have to ascertain if these old voters still cling to their previous preferences as their town keeps losing population or if the dynamics of generational replacement will change the relationship identified in this article. In addition, the presence of far‐right councillors after the recent local elections in many municipalities or an increasing electoral emphasis by the far right, as in many other countries, might increase their appeal. Future research could examine it, and dig deeper into the mechanisms.
All in all, our article shows that depopulation slowly changes the relative weight of the parties in depopulated places, with a slight relative advantage towards the mainstream Conservatives, and the far‐right. As depopulation is expected to increase in the short run, these effects might persist or even increase. Depopulated places tend to be in districts that have a small district magnitude, a minimum number of seats is constitutionally guaranteed, which may increase their political influence. Yet, in recent years the public sector, partly following electoral incentives, has designed policies to slow (or even revert) the process of depopulation. This, together with the trend, not universal, to leave cities and return to towns after COVID‐19, might also help in diluting the electoral effects of depopulation.
Acknowledgements
Previous versions of this article have been presented at research seminars at UPF, USAL, and UAB. We thank all participants for their feedback and suggestions. We also want to thank Maria Delgado‐García for all her effort in compiling and preparing the datasets used in this article. Support for this research was provided by the POLGEO project (PID2020‐119465 GB‐C21) “Geography, polarization and the rural‐urban divide in the XXI century” (Spanish Ministry of Science, Innovation and Universities).
Data availability statement
The data as well as the code for the analysis of both the body of the article and the appendices is available in the Harvard Database repository (https://doi.org/10.7910/DVN/UBZQLT).
Online Appendix
Additional supporting information may be found in the Online Appendix section at the end of the article:
Table A.1: Data sources
Table A.2: Descriptive statistics of variable (2011‐2019)
Table A.3: Number of municipalities by depopulation category and year
Figure A.1: Correlation between the different numerical independent variables
Table A.4: Number of municipalities by depopulation category, variation in the presence of older people, and year
Figure A.2: Categorisation of the depopulation indicator by year
Figure A.3: Distribution of depopulation (ratio) by type of municipality
Table A.5: Number of municipalities by depopulation category, variation in public services, and year
Table A.6: Number of municipalities by depopulation category, variation in the presence of amenities, and year
Figure B.1: Right‐left position of the parties in Spain
Figure B.2: Welfare state support for parties in Spain
Figure B.3: Agrarian (positive) for parties in Spain
Figure B.4: Traditional values (negative) for parties in Spain
Figure B.5: Evolution of the vote for the main parties according to the size of the municipality
Figure B.6: Voting for the different parties by age groups
Figure C.1: Evolution of depopulation level with a 10‐year reference
Table C.1: The effect of depopulation on electoral results (2011‐2019)
Figure C.2: The effect of depopulation and the variation in health centres on electoral behaviour
Figure C.3: The effect of depopulation and the variation in education centres on electoral behaviour
Table C.2: The effect of depopulation on turnout (2011‐2019)
Figure C.4: The effect of depopulation across municipality size
Figure C.5: The effect of depopulation on turnout across different values of the change in people 60 years old or older
Figure C.6: The effect of depopulation and the loss of public services (education and health centres) on turnout
Figure C.7: The effect of depopulation and the loss of amenities on turnout
Figure D.1: The effect of depopulation across AC (2011 ‐2019)
Figure D.2: The effect of depopulation over time (1989 ‐ 2019)
Figure E.1: Municipalities in depopulation risk
Figure E.2: Google trends evolution, in Spain, for the words “despoblacion” and “España Vaciada” (2010‐2019)
Table E.1: The concern about depopulation on the media
Figure E.3: Screenshot from the Spanish newspaper La Razón on a piece about municipalities in danger of disappearance
Figure E.4: Screenshot from the Spanish newspaper elDiario.es on a piece about municipalities at risk of depopulation


 Open access