

1. INTRODUCTION
The determination of glacier mass balance using the glaciological method (Østrem and Brugman, Reference Østrem and Brugman1991; Kaser and others, Reference Kaser, Fountain and Jansson2003) is based on point measurements of accumulation and ablation at representative sites over monitored glaciers. In the ablation area, ice melt is usually measured using ablation stakes inserted into drillholes. However, maintaining and measuring ablation stakes is labour-intensive, especially with high melt rates, large glacier areas and danger in remote and crevassed areas.
Continuous monitoring of glacier mass balance using automatic devices, possibly with remote communication, has considerable potential for overcoming these limitations, and for obtaining mass-balance data with high temporal resolution in real time (e.g. Huss and others, Reference Huss2013). Moreover, combining remotely-sensed snow cover mapping with automatic measurements of ablation gradients could make the extrapolation of mass balance over unsampled areas easier and more reliable (e.g. Carturan, Reference Carturan2016). Continuous ablation measurements also provide key observations for melt model development and testing (Hulth, Reference Hulth2010).
Automatic measurements of ice ablation can be obtained by using sonic rangers, the draw-wire method (Hulth, Reference Hulth2010), and the Bøggild ablatometer (Bøggild and others, Reference Bøggild, Olesen, Andreas and Jørgensen2004). All these methods require supporting structures above the glacier surface, which can be damaged by snow ripening and wind, and some of them have technical limitations (Fausto and others, Reference Fausto, Van As, Ahlstrøm and Citterio2012). Furthermore, for economic and logistic reasons these devices cannot be deployed with spatial densities comparable to those of traditional ablation stakes.
As demonstrated by previous work, it is possible to automatically measure changes in snow depth using vertical arrays of equally-spaced stand-alone mini temperature loggers, because temperatures measured above and beneath the snow surface have characteristic behaviours (e.g. Danby and Hik, Reference Danby and Hik2007; Lewkowicz, Reference Lewkowicz2008). In principle, these characteristics could also be used to measure glacier ice ablation through surface lowering, but this is not feasible using stand-alone mini temperature loggers that would not be accessible and downloadable from the glacier surface.
Recent technological advances have led to the development of miniaturised thermistor strings, with low power consumption and the possibility of remote communication or wireless download in the field, even under thick snowpacks (e.g. Paro and Gugliemin, Reference Paro and Guglielmin2011). These characteristics of thermistor strings, combined with their flexible configuration, high accuracy and simple construction, make them a possible solution for automatic ice ablation measurements.
This work aims to test the feasibility and the accuracy of ice ablation measurements made with a thermistor string measurement system. In summer 2017, we tested a thermistor string on an Italian glacier, and compared thermistor string measurements with ablation stakes readings and sonic ranger data collected at the same experimental site. This paper outlines the methods of measurement and analysis used to obtain continuous time series of ice ablation by means of thermistor strings, and discusses the results of this experiment.
2. INSTRUMENT DESCRIPTION
The use of vertical arrays of temperature sensors for measuring snow thickness or ice ablation is based on the ability to discriminate between sensors buried in ice/snow and sensors exposed to the atmosphere. Sensors located beneath snow cover generally show much lower temperature variability compared to exposed sensors, due to the different physical characteristics and exposure to solar radiation of the two environments.
The operating principle of the equipment is illustrated in Figure 1. When melt occurs, sensors buried in ice become progressively exposed to the atmosphere, and the identification of the lowermost of these sensors, for example at daily intervals, enables the quantification of cumulative ice ablation from the installation of the thermistor string. This device also detects snow cover periods when the variability of temperature decreases simultaneously at all sensors. The effects of a weathering crust (Muller and Keeler, Reference Muller and Keeler1969) and of preferential melt due to thermal conduction along the string are unknown and therefore investigated in this study.
Schematic diagram illustrating the use of a thermistor string for monitoring ice ablation.

The thermistor string for the experiment was manufactured by GeoPrecision GmbH (http://www.geoprecision.com/en/). Given that the minimum spacing of sensors along standard thermistor strings produced by GeoPrecision was 0.15 m, we asked for a custom-made prototype with sensors 0.10 m apart. This spacing was chosen as a good compromise between costs and feasibility to accommodate sensor size. In addition, we took into consideration the typical roughness of the glacier ice surface and the random error of point ablation measurements using ablation stakes (0.10 m w.e. a−1, Gerbaux and others, Reference Gerbaux, Genthon, Etchevers, Vincent and Dedieu2005; Zemp and others, Reference Zemp2013).
The lowermost 1.8 m of the 3 m thermistor string was equipped with 19 DALLAS DS18S20 temperature sensors, with hourly readings stored in an M-Log5W Datalogger connected to the sensors by the remaining 1.2 m of the string. Because signals are digital, the Dallas 1-wire technology recognises each sensor by its own code, thus allowing all sensors to be connected to the same signal port on the M-Log5W. We coated the string with a double layer of polyolefin transparent heat-shrink tubing, with internal adhesive liner, to strengthen the connection of each sensor to the wire, and to ensure impermeability. A steel cable was fixed to the string to further increase its mechanical strength.
The resolution of the Dallas temperature sensors is 0.065 °C and their accuracy is ±0.25 °C at 0 °C. The temperature offset of each sensor at 0 °C was determined by dipping the string in a container of water, putting it in a freezer and analysing the zero curtain during the freezing and melting phases. This offset was subtracted from the raw data before analysis.
3. EXPERIMENTAL SETUP
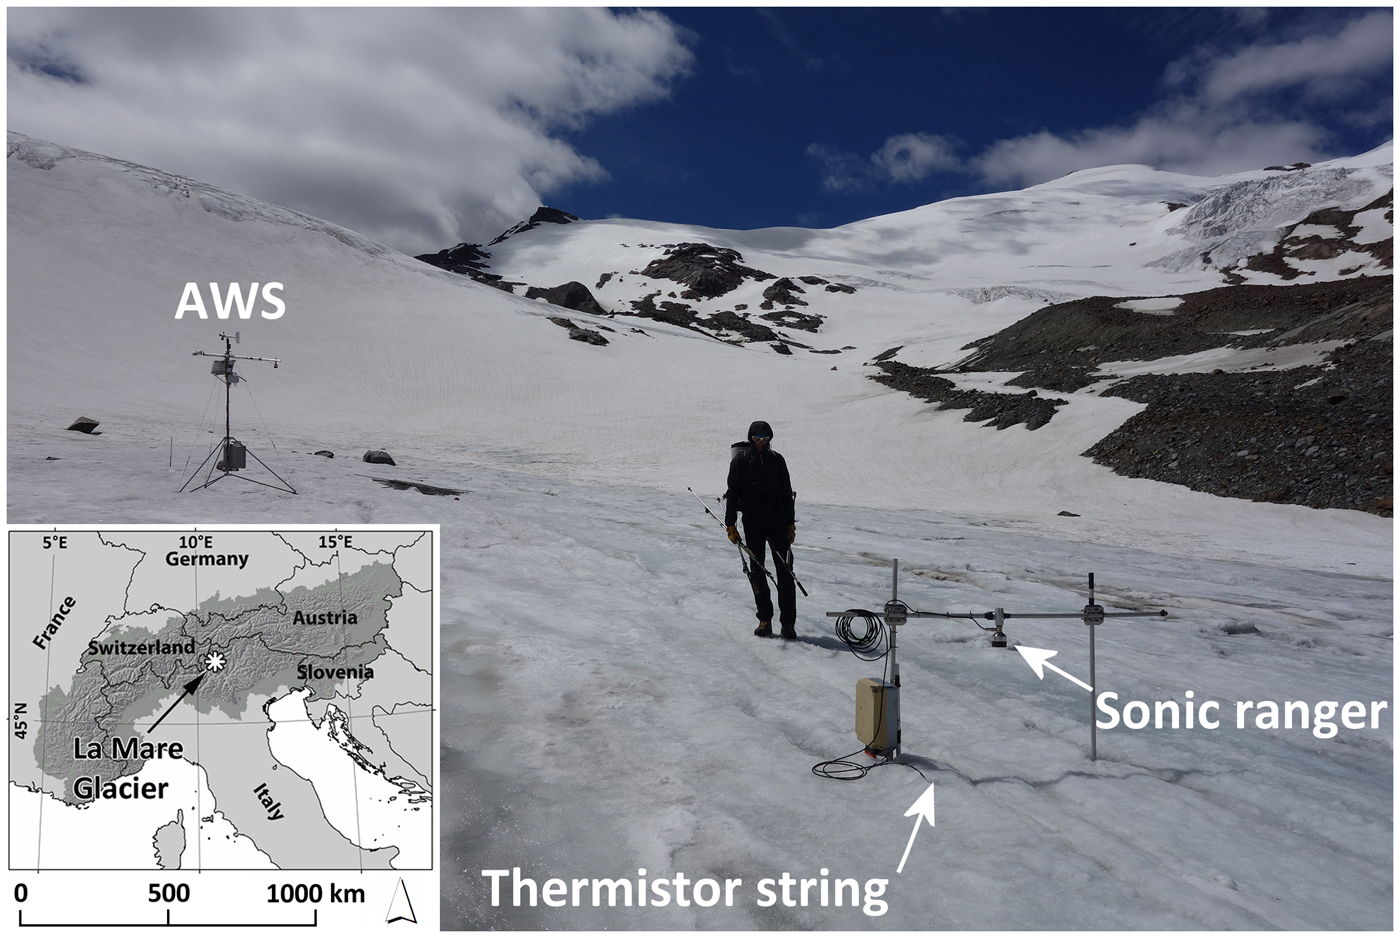
The thermistor string was installed on 17 June 2017 at 2940 m a.s.l. in the ablation area of La Mare Glacier (Ortles-Cevedale Group, Eastern Italian Alps, Fig. 2). The string was inserted into a 2 m hole, drilled with a hand auger. In close proximity to the string, we installed a Campbell Scientific SR50A sonic ranger for parallel measurements of ice ablation, supported by two aluminium stakes which were also used for comparisons. Hourly data from the SR50A were stored in a Campbell Scientific CR510 datalogger and processed to adjust for air temperature, using data from an automatic weather station that has been operating on this glacier since July 2007 (AWS in Fig. 2). Sonic ranger data were also adjusted for level changes during stakes re-insertions.
Geographic setting and experimental setup at 2940 m a.s.l. on the La Mare Glacier.
There were six field visits for maintenance and data downloading, at ~2 week intervals. The thermistor string worked properly until the end of the experimental period, on 8 September. The sonic ranger did not record data from 3 to 23 July, due to power failure. The sonic ranger was lowered three times, to prevent tilting from the meltout of the supporting stakes. The string was re-inserted into the ice on 17 July and 18 August.
During field visits, we measured and recorded the distance from the ice surface to the top of ablation stakes and to the lower rim of the sonic ranger. We also measured the depth of lowermost visible sensor of the thermistor string, and the water level inside the drillhole, from the lower edge of an axe laid on the ice. The water level was used for assessing the thickness of the weathering crust.
4. RESULTS
4.1. Field observations and temperature string data
During field visits, the thermistor string was typically iced into the drillhole. In the La Mare glacier this occurs also with ablation stakes, and the string data showed that it is due to the slightly sub-freezing temperatures (−0.3 to −1.4 °C at the bottom of drillholes) existing in the superficial ice of the lower ablation area. Therefore, the string was secured to the ice shortly after installation, and this prevented sinking or pulling out of the ice. We were able to pull the string out of the ice only when the drillhole was <0.5 m deep. After melting out, the string cable rested on and slightly penetrated into the ice surface, due to preferential ablation, which further anchored the string to the surface.
The thickness of the weathering crust ranged between 0.07 and 0.13 m, and averaged 0.10 m. The ablation hollow caused by the string was much smaller compared to that of ablation stakes (0.02 vs 0.08 m in diameter), and of irregular shape, rather than circular.
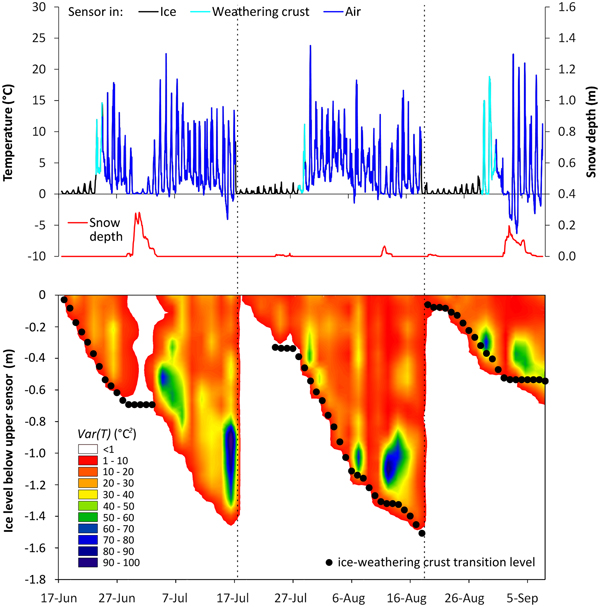
The temperature data of sensor 5 were used to illustrate a typical record during the experiment (Fig. 3). Observed temperatures showed small daily fluctuations when the sensor was inside the drillhole, under the weathering crust and immersed in ice/water. The temperature variability markedly increased in the weathering crust and remained high when the sensor emerged from the ice surface, except for during temporary burial by fresh snow, for example at the end of June. The lower panel in Figure 3 shows that the transition level between ice and weathering crust (0.10 m below the ice surface on average) consistently followed the level of the string where temperature variance exceeded 1 °C2.
Top panel: Hourly temperature readings of sensor no. 5 (0.5 m below the ice surface after string installation), coloured to note the sensor position, and snow depth recorded by the sonic ranger. Bottom panel: Time evolution of the temperature variance vertical profile. Dashed vertical lines indicate string re-insertion on 17 July and 18 August.

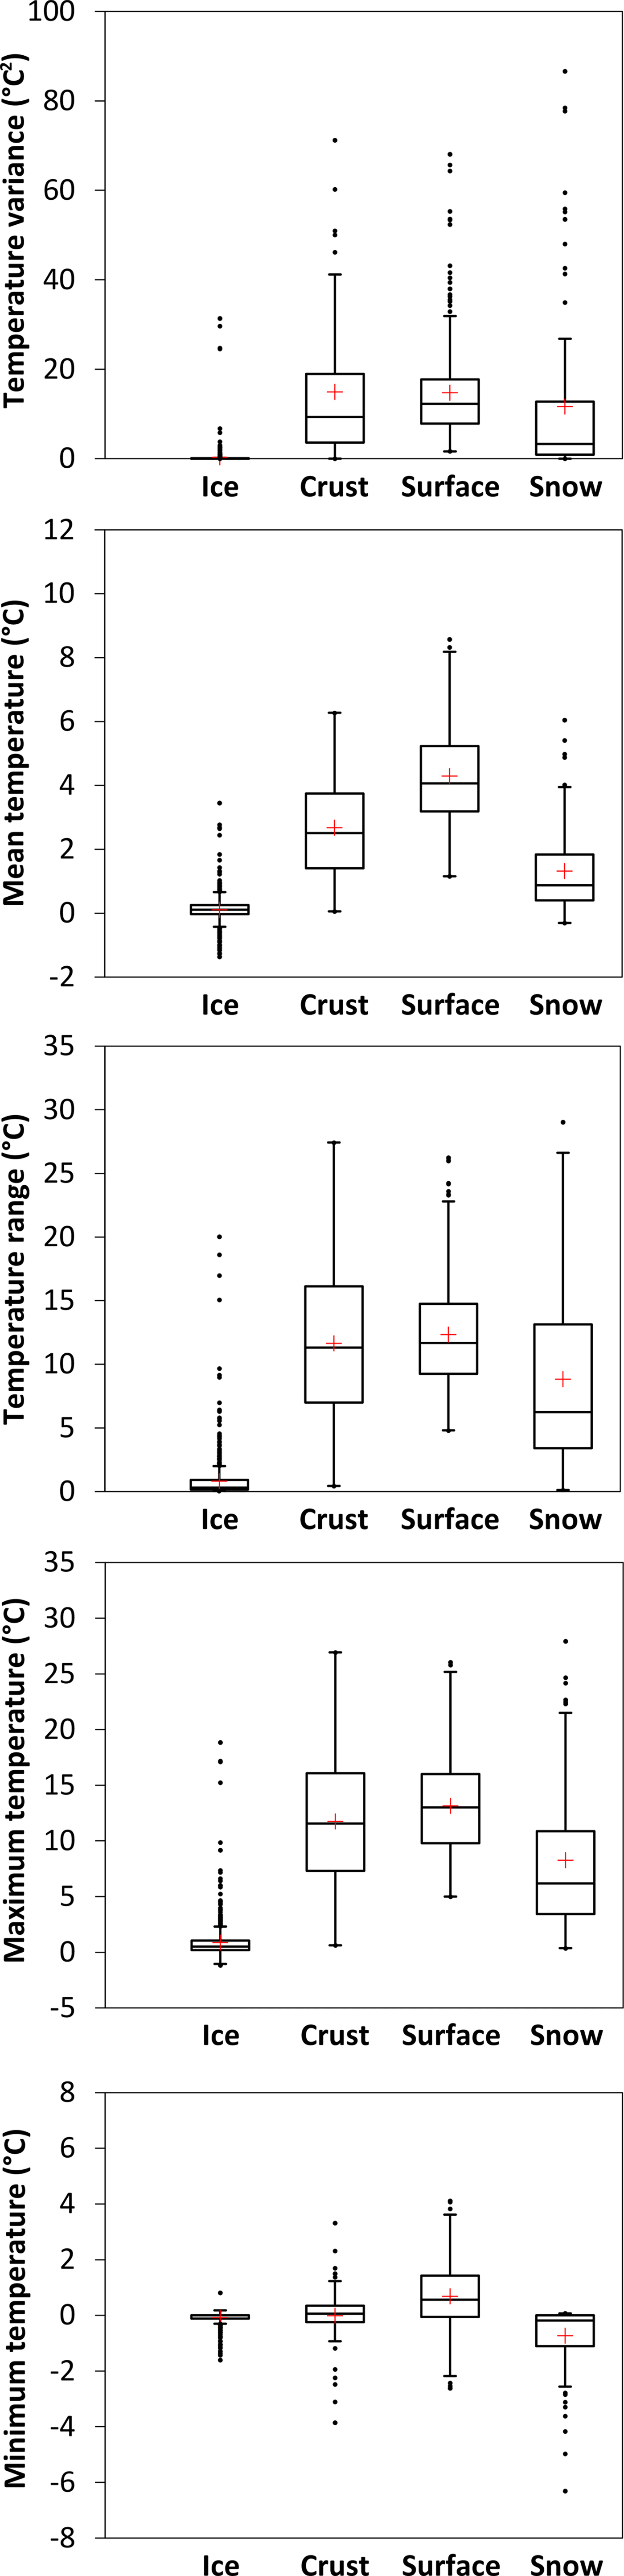
Daily values of mean temperature (T mean), as well as minimum (T min), maximum (T max), range (ΔT) and temperature variance (Var(T)) were calculated for each sensor. For each day, the position of each sensor (ice, weathering crust or exposed) was assigned using sonic ranger data, combined with albedo measurements from the AWS, and assuming a constant thickness of 0.10 m for the weathering crust. This thickness was used to distinguish between sensors in the ice and sensors emerged into the weathering crust.
Sensors positioned in ice showed values close to zero for all temperature metrics (Fig. 4). With the exception of minimum daily temperatures, all temperature metrics were significantly greater than zero after the sensor emerged into the weathering crust and air. Snow cover suppressed the positive temperature excursions of exposed sensors, and in some cases led to negative minimum temperatures. A particularly noteworthy feature is that the variance of sensors positioned in ice is small, not only in comparison with those of the other positions, but in comparison with those of most other temperature metrics as well.
Boxplots showing the distribution of daily descriptive statistics of temperature string data, grouped in four subsamples.
4.2. Calculation of ice ablation
Five methods for calculating cumulative ice ablation were tested. The first four methods are based on the identification of a threshold that minimises the root mean square error (RMSE) between calculated daily ice ablation and measured ice ablation at the sonic ranger. For each day, the ice level is calculated halfway between two adjacent sensors that have T max, ΔT, T mean and Var(T) respectively above and below the threshold. In cases of two or more calculated ice levels, the lowermost is selected. Glacier ice at the surface is flagged when the level remains stable or decreases, while new snow is detected when the level increases.
Threshold methods require at least one independent observation of cumulative ice ablation for the calibration of temperature thresholds, for example the length of the thermistor string cable melted out in a given time period. We tested a fifth method, proposed for measuring snow depth by Reusser and Zehe (Reference Reusser and Zehe2011), that identifies the ice level corresponding to the maximum drop in daily temperature variance along the string. The level is taken as the halfway point between the sensor where the maximum drop occurs and the sensor above. This method, called MDV hereafter, works independently and does not require calibration of fixed thresholds in temperature.
The results have been analysed over the entire experimental period and for two sub-periods of 32 days, to check consistency (Table 1). The threshold methods performed similarly well, with calibrated RMSE ranging between 0.04 and 0.06 m, and mean bias error (MBE) ranging between −0.02 and 0.03 m. The RMSE is lower than the 0.10 m expected for ablation stake readings, in a wide range of threshold temperature values. For threshold methods using T max and Var(T), the temperature threshold giving the lowest RMSE was more variable between the two sub-periods, but RMSE differences among optimised thresholds in the two sub-periods were very small (<0.01 m). The best identification of the surface type was achieved using the T mean threshold method, which enabled the correct classification in 89% of cases. The other three threshold methods also performed reasonably well, providing 80–82% correct classifications.
Performance statistics of tested methods for cumulative ice melt calculation from thermistor string data, compared to sonic ranger readings. The full period of the experiment was divided in two subperiods of 32 days, to check consistency of results. The RMSE, MBE and % of correct surface type identification reported for threshold methods are obtained with the best calibrated temperature thresholds shown on the left. The MDV method does not require calibration
* Var(T) is expressed in °C2.
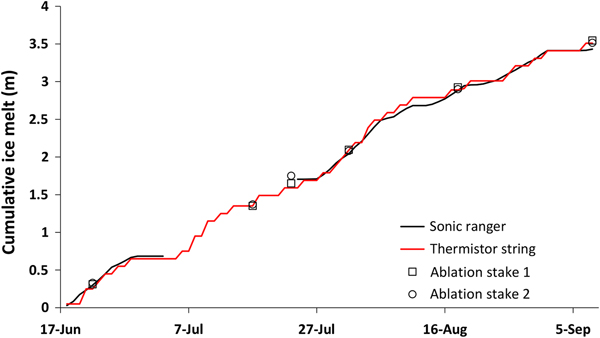
The results of the MDV method were comparable in terms of RMSE, correct classification of surface types and stability between the two sub-periods (Table 1). A good match between cumulative ice melt calculated by the MDV method, and measured with the sonic ranger and ablation stakes, is evident in Figure 5. The daily melt rates compare similarly well (RMSE = 0.05 m, MBE = 0.00 m).
Comparison of cumulative ice melt calculated from the thermistor string (MDV method) to measurements from the sonic ranger and two ablation stakes at the La Mare Glacier experimental site.

5. DISCUSSION
Ice ablation computations from thermistor string data collected in our experiment provided reliable results, with accuracy comparable to traditional measurements from ablation stakes (Gerbaux and others, Reference Gerbaux, Genthon, Etchevers, Vincent and Dedieu2005; Zemp and others, Reference Zemp2013) and other automatic devices (Bøggild and others, Reference Bøggild, Olesen, Andreas and Jørgensen2004; Hulth, Reference Hulth2010; Fausto and others, Reference Fausto, Van As, Ahlstrøm and Citterio2012). Among the tested methods for calculating ice ablation, the MDV looks preferable because it does not require other observations of ice ablation for calibration, keeping good accuracy at the same time. This is desirable in situations where strings are deployed over inaccessible areas, unattended for long periods, or installed for remote monitoring via automatic data transmission. The MDV method is also self-adaptable to changing atmospheric conditions, unlike the other methods that assume a fixed threshold temperature, for all weather conditions.
Good results were also obtained in the identification of the surface type, even though shallow snow depths (<10 cm) were the most problematic cases for surface type identification, because they were classified as ice due to the discrete spacing of sensors along the string. This outcome is potentially useful for snow cover monitoring and mapping, and for determining cumulative ice ablation after disappearance of the seasonal snow cover. Repeat snow cover mapping during the ablation season, in combination with vertical gradients of cumulative ice ablation after ice exposure, enable improved extrapolations of point mass balance, as reported by Carturan (Reference Carturan2016). A simple array of few thermistor strings deployed at regular elevation intervals along a glacier would provide short-term observations of vertical ablation gradients, which are rarely achieved using traditional ablation stakes measurements.
The thermistor string system is flexible because it can be of different lengths, and therefore suitable for various glacial environments. The string can be connected to dataloggers of varying cost, power consumption, memory, size and data transfer systems. For example, the tested M-Log5W datalogger can be downloaded wireless in the field using a 433.92 MHz USB-Dongle connected to a portable computer. This enabled retrieval of firn temperature data on Mt. Ortles in summer 2015, when the logger was buried under 6 m of snow and firn (http://ortles.org/).
A significant assumption in the application of the proposed instrument is the constant thickness of the weathering crust. Even if the literature reports values ranging between a few to a few tens of centimetres (Muller and Keeler, Reference Muller and Keeler1969), this is a problem common to all methods used for measuring glacier ice ablation from surface lowering, and the associated error becomes negligible for periods longer than few days. Due to its small diameter and low thermal conduction, the string is not subject to errors due to the formation of ablation hollows around it.
The resolution of the string could be improved by decreasing the sensors spacing to 0.05 m. However, the results of our experiment in comparison with other measurement techniques, and the inherent uncertainty of ablation measurements related to the specific glacial environment (i.e. the problems related to the weathering crust and the small-scale spatial variability of ablation) suggest that a sensor spacing of 0.10 m is probably a good compromise for applications in similar glacial environments with strings of comparable length.
In order to assess whether a larger sensor spacing could significantly affect the accuracy of ablation measurements, we removed selected sensors from calculations to simulate strings with 0.20, 0.30, 0.40 and 0.50 m sensor spacing. As expected, the RMSE between sonic ranger readings and thermistor string computations increases with sensor spacing, but remains acceptable (i.e. ⩽0.10 m) up to 0.30 m spacing (Fig. 6). This result indicates the feasibility of systems with increased length and/or reduced sensor density, thus enabling longer working periods in remote sites, applicability in areas with high melt rates, and reduced costs. In particular, longer thermistor strings (e.g. 20 m) could be installed with a steam drill for unattended sites, strongly reducing labour.
RMSE between thermistor string computations and sonic ranger readings obtained simulating different sensor spacing.
Further work is needed to test the feasibility of thermistor string use in areas with thick and widespread superimposed ice formations (e.g. on cold glaciers (Cuffey and Paterson, Reference Cuffey and Paterson2010)), or in upper glacier areas, where firn and snow cover the surface. Previous works on seasonal snow cover point to the possibility of using thermistor strings to measure ablation and accumulation in such areas (e.g. Lewkowicz, Reference Lewkowicz2008; Reusser and Zehe, Reference Reusser and Zehe2011).
6. CONCLUDING REMARKS
Based on previous applications of vertical thermistors arrays for automatic snow depth measurements, this paper evaluates the possibility of using thermistor strings as a new automatic tool for the continuous measurement of glacier ice ablation.
A thermistor string was tested in summer 2017 on an Italian glacier, assessing its reliability by means of sonic ranger data and ablation stake readings collected at the same experimental site. The results indicate that thermistor strings can be used as reliable tools for automatic ice ablation measurements, with RMSE ranging between 0.04 and 0.06 m and MBE ranging between −0.02 and 0.03 m, varying with calculation methods.
The accuracy of thermistor string measurements is comparable to traditional ablation measurements by ablation stakes, and to other automatic systems like the draw-wire method (Hulth, Reference Hulth2010), and the ablatometer (Bøggild and others, Reference Bøggild, Olesen, Andreas and Jørgensen2004). However, compared to these automatic devices, the thermistor string used in the experiment has several advantages: (i) simpler construction, (ii) no requirement for support structure or anchoring to the surface, (iii) easier to install, (iv) no influence or damage by wind, high snow accumulation and snow ripening and (v) less expensive to build and transport.
This study suggests that miniaturised systems like the thermistor string tested on La Mare Glacier have potential applications in glacier monitoring. In particular, they can facilitate or make feasible observations in remote locations, and they can be employed for the development of advanced monitoring systems, like wireless sensor networks.
AUTHOR CONTRIBUTIONS
L. Carturan and F. Cazorzi designed the field experiment and prepared the instrumentation. L. Carturan and T. Zanoner installed the instrumentation and performed the field surveys. L. Carturan analysed the data and prepared the manuscript with contributions from all co-authors.


 Open access