


I. INTRODUCTION
Phenelzine sulfate (sold under the trade names Estinerval, Kalgan, Nardil, and others) is used as an antidepressant that is effective in the treatment of panic disorder and social anxiety disorder (Daly, Reference Daly1973). The systematic name (CAS Registry No. 156-51-4) is 2-phenylethylhydrazinium sulfate. The crystal structure of phenelzine sulfate has been determined very recently using MicroED techniques (Lin et al., Reference Lin, Bu, Unge and Gonen2024; CSD Refcode: RUGNEQ). This work is part of a project (Kaduk et al., Reference Kaduk, Crowder, Zhong, Fawcett and Suchomel2014) to determine commercial pharmaceutical crystal structures and add high-quality powder diffraction data to the Powder Diffraction File™ (Kabekkodu et al., Reference Kabekkodu, Dosen and Blanton2024).
II. EXPERIMENTAL AND ANALYSIS
Phenelzine sulfate was a white powder purchased from TargetMol (Batch #12441), and the diffraction pattern was measured from a 0.5-mm-diameter Kapton capillary at 298 K at the Wiggler Low Energy Beamline (Leontowich et al., Reference Leontowich, Gomez, Diaz Moreno, Muir, Spasyuk, King, Reid, Kim and Kycia2021) of the Brockhouse X-ray Diffraction and Scattering Sector of the Canadian Light Source using a wavelength of 0.819826(2) Å (15.1 keV). The data collection time was 3 minutes. The pattern was indexed using DICVOL14 (Louër and Boultif, Reference Louër and Boultif2014), and the crystal structure was solved using Monte Carlo-simulated annealing techniques as implemented in EXPO2014 (Altomare et al., Reference Altomare, Cuocci, Giacovazzo, Moliterni, Rizzi, Corriero and Falcicchio2013) before the publication of Lin et al. (Reference Lin, Bu, Unge and Gonen2024). The coordinates of Lin et al. (Reference Lin, Bu, Unge and Gonen2024) were used to begin refinement.
Rietveld refinement (Figure 1) was carried out using GSAS-II (Toby and Von Dreele, Reference Toby and Von Dreele2013). All non-H-bond distances and angles were restrained according to a Mercury/Mogul Geometry Check (Bruno et al., Reference Bruno, Cole, Kessler, Luo, Motherwell, Purkis and Smith2004; Sykes et al., Reference Sykes, McCabe, Allen, Battle, Bruno and Wood2011). The phenyl rings were restrained to be planar. Hydrogen atoms were included in calculated positions and recalculated during the refinement using Materials Studio (Dassault Systèmes, 2023). The U iso values of the carbon, nitrogen, and oxygen atoms were grouped by chemical similarity, whereas the U iso values of the H atoms were fixed at 1.3× those of the carbon and nitrogen atoms to which they are attached. The final refinement yielded R wp = 0.05594. The largest features in the normalized error plot are in the shapes and positions of some of the low-angle peaks. The lowest-angle peak at 2.378° has a very complex shape, not able to be modeled by the pseudo-Voigt function; therefore, it was excluded from the refinement. This shape and the normalized error plot suggest changes to the specimen during measurement. The largest peak (1.14 Å from N2′) and hole (1.86 Å from C7′) in the difference Fourier map were 0.28(8) and − 0.36(8) eÅ−3, respectively.
The crystal structure of phenelzine sulfate was optimized (fixed unit cell) with density functional theory techniques using VASP 6.0 (Kresse and Furthmüller, Reference Kresse and Furthmüller1996) through the MedeA graphical interface (Materials Design, 2023). Single-point density functional theory calculations (fixed experimental cell) and population analysis were carried out using CRYSTAL23 (Erba et al., Reference Erba, Desmaris, Casassa, Civalleri, Donà, Bush and Searle2023) using H, C, N, and O basis sets defined by Gatti et al. (Reference Gatti, Saunders and Roetti1994) and the S basis set of Peintinger et al. (Reference Peintinger, Vilela Oliveira and Bredow2013).
The Rietveld plot for phenelzine sulfate. The blue crosses represent the observed data points, and the green line corresponds to the calculated pattern. The cyan curve shows the normalized error plot, and the red line indicates the background curve. The blue tick marks indicate the peak positions of phenelzine sulfate. The vertical scale is in units of 106 counts and is multiplied by 20× for 2θ > 22.0°.

III. RESULTS AND DISCUSSION
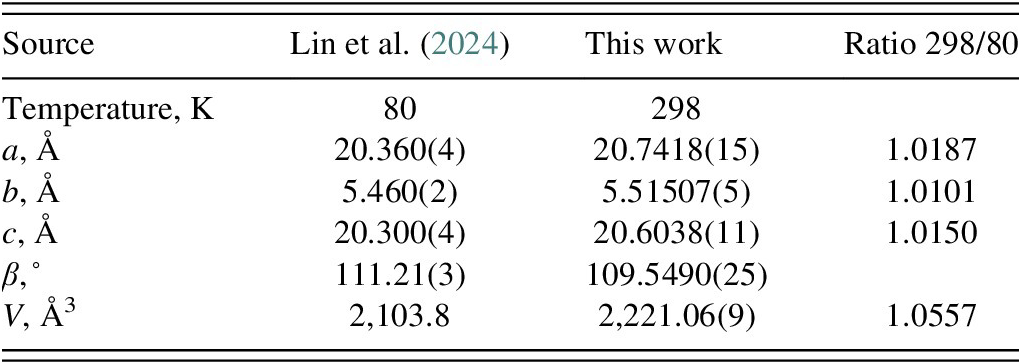
The thermal expansion of phenelzine sulfate between 80 and 298 K is slightly anisotropic (Table I). The powder pattern calculated from the 80 K structure of Lin et al. (Reference Lin, Bu, Unge and Gonen2024) has significantly different peak positions than the room-temperature pattern (Figure 2); the 80 K calculated pattern may thus not be useful for phase identification. The two structures are, however, very similar, with a root-mean-square (rms) Cartesian displacement of 0.176 Å. The rms Cartesian displacement of the non-H atoms in the Rietveld-refined and VASP-optimized structures, calculated using the Mercury CSD-Materials/Search/Crystal Packing Similarity tool, is 0.157 Å, within the normal range for correct structures (van de Streek and Neumann, Reference van de Streek and Neumann2014). A similar comparison to the structure of Lin et al. (Reference Lin, Bu, Unge and Gonen2024) yields a value of 0.176 Å. The asymmetric unit with the atom numbering is presented in Figure 3.
Lattice parameters of phenelzine sulfate

Comparison of the experimental powder pattern of phenelzine sulfate at 298 K (black) with the pattern calculated from the 80 K structure of Lin et al. (Reference Lin, Bu, Unge and Gonen2024) (green). Image generated using JADE Pro (MDI, 2024).

The asymmetric unit of phenelzine sulfate, with the atom numbering. The atoms are represented by 50% probability spheroids. Image generated using Mercury (Macrae et al., Reference Macrae, Sovago, Cottrell, Galek, McCabe, Pidcock and Platings2020).

All of the bond distances, bond angles, and torsion angles fall within the normal ranges indicated by a Mercury Mogul Geometry check (Macrae et al., Reference Macrae, Sovago, Cottrell, Galek, McCabe, Pidcock and Platings2020). The two independent cations are very similar in geometry (rms Cartesian displacement = 0.127 Å). Quantum chemical geometry optimization of the isolated cations (DFT/B3LYP/6-31G*/water) using Spartan ‘24 (Wavefunction, Inc., 2023) indicated that they are within 0.1 kcal/mol in energy, and converge to the same local minimum.
The crystal structure (Figure 4) consists of supramolecular double layers of cations and anions parallel to the bc-plane. The inner portion of the layers consists of the charged parts of the cations and the anions, whereas the outer surfaces consist of phenyl rings, with van der Waals interactions between the layers. The sulfate anions stack along the c-axis. The Mercury Aromatics Analyser indicates moderate interactions between the phenyl rings, with distances of 5.52 and 5.86 Å. Analysis of the contributions to the total crystal energy of the structure using the Forcite module of Materials Studio (Dassault Systèmes, 2023) suggests that the intramolecular deformation energy is dominated by angle distortion terms, whereas van der Waals and electrostatic repulsions dominate the intermolecular energy.
The crystal structure of phenelzine sulfate, viewed down the b-axis. Image generated using Diamond (Crystal Impact, 2023).

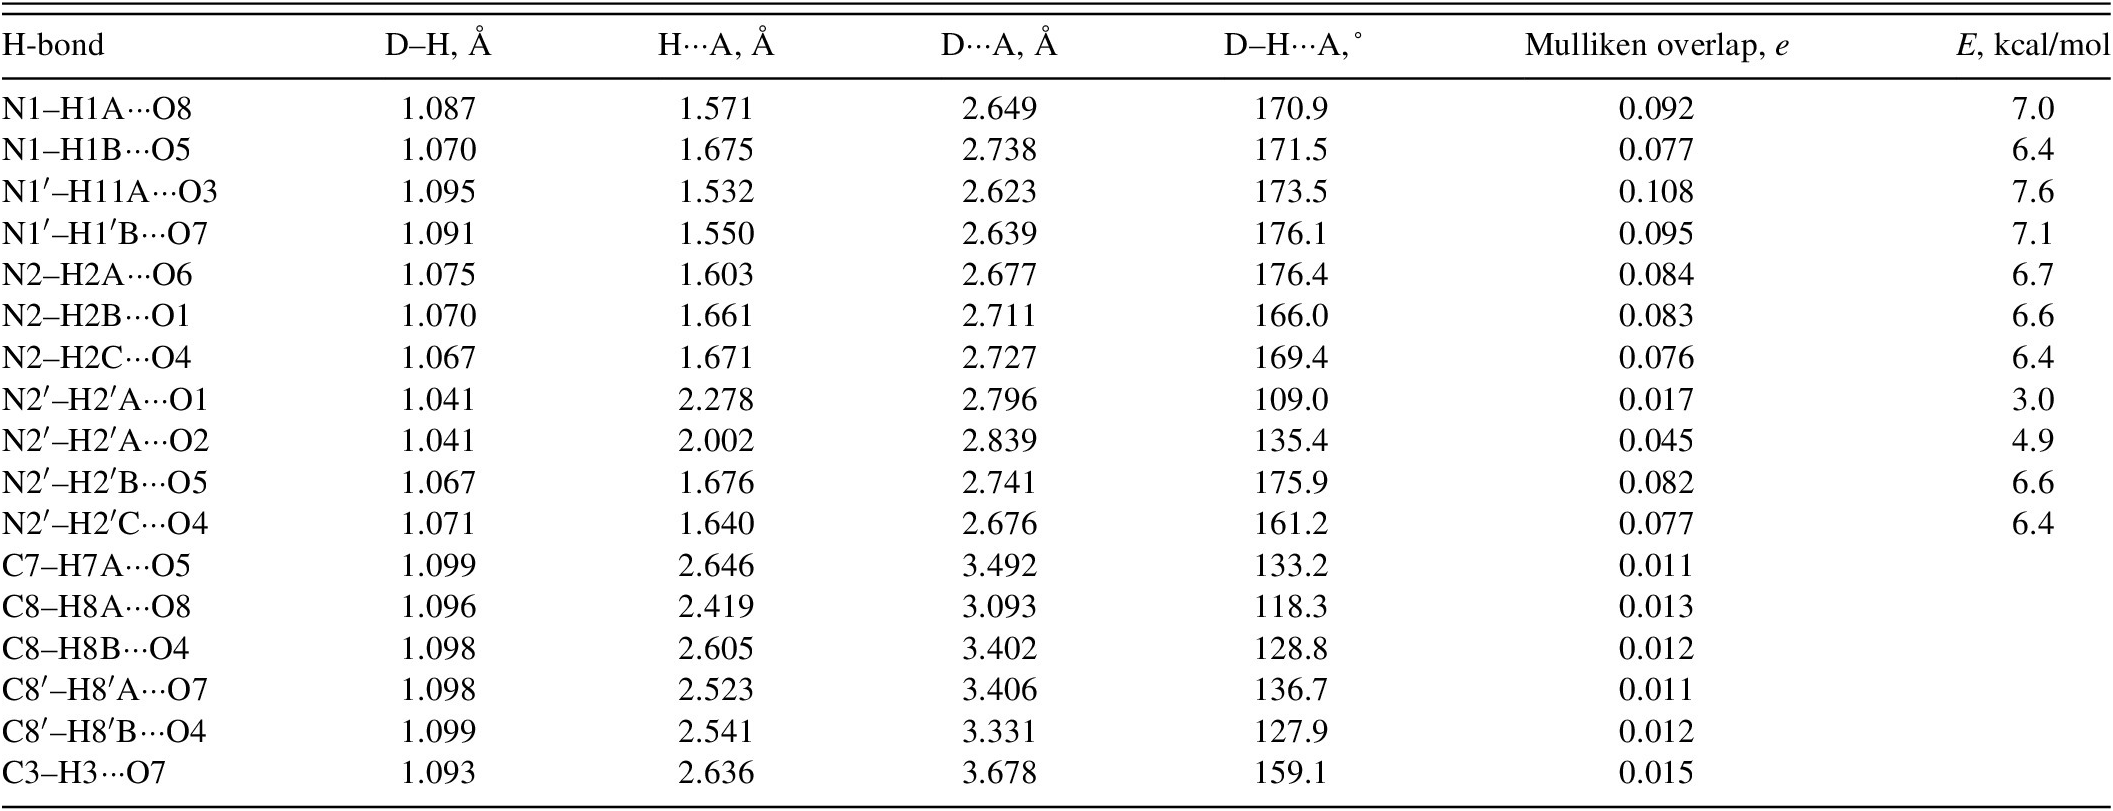
Hydrogen bonds are prominent in the crystal structure (Table II). Each N–H acts as a donor to at least one sulfate O atom, and each O atom acts as an acceptor in at least one N–H···O hydrogen bond. The energies of the N–H···O hydrogen bonds were calculated using the correlation of Wheatley and Kaduk (Reference Wheatley and Kaduk2019). Several C–H···O hydrogen bonds, mainly involving alkyl H atoms but also including one phenyl H, also contribute to the lattice energy.
Hydrogen bonds (CRYSTAL23) in phenelzine sulfate

The Bravais–Friedel–Donnay–Harker (Bravais, Reference Bravais1866; Friedel, Reference Friedel1907; Donnay and Harker, Reference Donnay and Harker1937) morphology suggests that we might expect elongated morphology for phenelzine sulfate (consistent with the anisotropy of the lattice parameters), with [010] as the long axis, or platy morphology with {100} as the major faces (consistent with the layered structure). A sixth-order spherical harmonic model was included in the refinement. The texture index was 1.299(5), indicating that the preferred orientation was significant in this rotated capillary specimen.
DATA AVAILABILITY STATEMENT
The powder pattern of phenelzine sulfate from this synchrotron dataset has been submitted to the International Centre for Diffraction Data (ICDD) for the Powder Diffraction File. CIF files from the Rietveld refinement and density functional theory (DFT) geometry optimization were also deposited and can be requested at pdj@icdd.com.
ACKNOWLEDGMENTS
We thank Adam Leontowich for his assistance in the data collection. We also thank the ICDD team – Megan Rost, Steve Trimble, and Dave Bohnenberger – for their contribution to research, sample preparation, and in-house XRD data collection and verification. We also thank Tamir Gonen of UCLA for supplying the atom coordinates prior to incorporation into the Cambridge Structural Database (CSD).
FUNDING STATEMENT
Part or all of the research described in this paper was performed at the Canadian Light Source, a national research facility of the University of Saskatchewan, which is supported by the Canada Foundation for Innovation (CFI), the Natural Sciences and Engineering Research Council (NSERC), the Canadian Institute of Health Research (CIHR), the Government of Saskatchewan, and the University of Saskatchewan. This work was partially supported by the International Centre for Diffraction Data (ICDD).
CONFLICTS OF INTEREST
The authors have no conflicts of interest to declare.


 Open access