

INTRODUCTION
The environment and its associated factors in which people reside are as important for communicable diseases as they are for non-communicable diseases [Reference Michael1, Reference Winkleby2]. Communicable diseases are essentially ‘eco-bio-social’ events influenced by ecological, biological and social factors [Reference Sommerfeld and Kris3]. Social determinants strongly influence both the onset and response to treatment of major infectious diseases [Reference Farmer4]. Hence, a social determinant perspective is essential [Reference Michael1].
Traditionally, studies on infectious diseases have focused, largely, on biological risk factors at the individual level [Reference Grassly and Fraser5]. However, social scientists emphasize the need to incorporate socioeconomic determinants like poverty, education and income in epidemiological studies [Reference Frieden6]. Evidence from the literature suggests that the spread of communicable disease is influenced by social heterogeneity that exist both within societies and between countries [Reference Farmer4]. A classic example is the most often cited 1848 typhus epidemic in Upper Silesia. The German physician Rudolf Virchow, the chief investigator, cited factors like poverty, hunger, lack of education, and political oppression liable for the epidemic episode [Reference Mackenbach7].
Studies in the literature have shown the effect of socioeconomic status on disease incidence during the 1918 influenza pandemic [Reference Murray8, Reference Mamelund9] and county-level sociodemographic and economic factors associated with the incidence of enteric diseases [Reference Chang10]. Excess mortality data from 27 countries during the 1918–1920 pandemic was correlated with per capita income and absolute values of latitude, generating two regression models [Reference Murray8]. The primary use of the model was to serve as a predictive tool for the estimation of global pandemic mortality, if a pandemic were to occur in later years. The low R 2 values reported indicated a high possibility that these models may possess unsatisfactory predictive capabilities. In addition, pandemic mortality rates may also be related to predictor variables other than per capita income and absolute latitude [Reference Michael1, Reference Sommerfeld and Kris3].
The recent outbreak of H1N1 has provided the scientific community with a sad but timely opportunity to understand the influence of socioeconomic determinants on pandemic mortality. To this end, we have used data from different US counties and analysed the socioeconomic determinants to discover why certain counties reported fewer H1N1 deaths compared to other counties. The aim of our work is to identify the subgroups of the population whose members share common characteristics that are barriers or facilitators of health-related interventions.
Our study objectives, hence, were to: (1) understand the relationship between each of the selected predictors on the response variable, (2) develop a decision tree using the selected predictors, (3) use the decision tree to predict the total deaths due to H1N1 in the USA, and (4) offer guidance to local health officials (at state level and county level) to strategize community health improvement planning. The decision tree method used in our work has the potential to classify counties into subgroups. This work provides a novel approach in using H1N1 data collected by countries at local/state level to quantify the heterogeneity in healthcare at each level using socioeconomic determinants, subgroup, the population to be targeted and to optimize the distribution of public health resources efficiently.
METHODS
Data mining can generally be viewed as a tool used for the extraction of useful knowledge such as patterns, trends and the establishment of hypotheses from large data collections and archives. Here, the objective of data mining is to use the data collected from reliable sources for the construction of valid models. These models, built using a subset of US counties, were then used to predict H1N1 mortality for the whole of the USA.
Data collection
Data were collected from several public health websites in the USA. Data on sociodemographic variables and socioeconomic indicators were collected from the US census and Centre for Disease Control and Prevention (CDC, USA) websites [11, 12]. The response variable of interest is the reported H1N1 deaths/1000 population, with final predictor variables being socioeconomic variables believed to largely influence the spread of H1N1 and H1N1 mortalities. The list of predictors used in the dataset is given in Table 1. We collected the most up-to-date data for each of the predictors and hence the difference in the year of collection.
Summary characteristics of the variables used in the datasetFootnote *

* The corresponding summary characteristic of a variable for the whole of the USA is shown within parentheses.
† Source: 1, US census; 2, CDC, USA; 3 State health websites.
H1N1 deaths in the USA were reported from July 2009 until June 2010. County-level H1N1 death-related data were collected from the State Health Department websites, obtained from the H1N1 webpage of CDC [13]. The H1N1 weblinks of all the 50 US states were browsed thoroughly for data availability. Only 14 states out of the 50 that reported latest county records of H1N1 deaths from July 2009 until June 2010 were selected. The primary reason for such a selection is that only these states have consistent reporting and updating of H1N1 statistics. Here, the phrase ‘consistent reporting and updating of H1N1 statistics’ refers to the reporting standards met by the state health websites at a level with the standards suggested by CDC, USA. Only these 14 states reported county-wise statistics on H1N1 deaths/1000 and hence were included in the dataset. The rest of the states had either reported the cumulative deaths for the whole of the state or did not update the county-level statistics in their health websites. The state-wise details on the number of counties that reported H1N1 deaths and the corresponding web pages are shown in Table 2. A choropleth map of the 341 counties is shown in Figure 1. This dataset of 341 samples (shown in Sheet 1 of the Supplementary material) was then used to model the response variable using the predictors.
US counties included in the dataset.

State-wise details of the data collected

Data analysis
The following exploratory data analyses were performed to gain insight on the relationship between the predictors and the response variable.
Correlation analysis
This was performed in order to understand the relationship between each of the selected predictors and the response variable [Reference Draper and Smith14].
Decision trees
Modelling with decision trees results in a pictorial representation comprising of a series of if-then rules to predict H1N1 deaths/1000. Construction of decision trees can aid in the illustration of certain ‘rules’ governing the spread of H1N1 and H1N1-related deaths. Policy makers can use these rules as the basis to target and optimize the distribution of public health resources. Decision tree analysis is a non-parametric methodology that has the ability to classify populations into subgroups [Reference Breiman15]. Recently, decision tree methodology has been extensively applied in public health analyses [Reference Lemon16], e.g. in studies assessing risk factors for mortality and morbidity from specific diseases [Reference Bachur and Harper17–Reference Lemon21], identifying patients hospitalized with community-acquired pneumonia [Reference Yu22], and influenza treatment strategies [Reference Kenneth and Mark23–Reference Fishbein25]. The three basic steps of building a decision tree are: (1) The overall study group is divided into two subgroups using the most dominant predictor of the response variable. (2) This division into two groups is repeated within the subgroups until no further significant splits are found. At this point, a terminal node is created. (3) The results are then presented in the form of a binary tree structure, which can be pruned to obtain the optimal tree with the least misclassification. The response variable can be either categorical (i.e. classification tree) or continuous (i.e. regression tree). The predictors can be a mix of categorical and continuous variables. In a classification tree, the probability of having the response measure is estimated among those within each node. In regression trees, the mean value of the response variable is estimated among those within each node.
Here, we have used H1N1 deaths/1000 as the target variable and built a regression tree using the 12 selected predictors. The entire sample was used to develop the regression tree and a tenfold cross-validation method was used as the tree testing option to select the best tree [Reference Breiman15]. Pruning was done to avoid over-fitting and the optimal tree was chosen based on the cost of the tree. The procedure described here was coded in Matlab 7.8.0 (R2009a). The regression tree developed using data from 341 counties was then used to predict H1N1 mortality for the whole of the USA. The predictor variables for all US counties were collected from the US census website. The decision rule obtained from the regression tree was used as the basis to determine H1N1 deaths/1000 for each county depending upon its input variables. These predictions were then converted to total H1N1 deaths predicted for each county. The state-wise H1N1 deaths were then obtained from the county totals. H1N1 mortality for the whole of the USA was then obtained from the summation of state-wise H1N1 deaths.
RESULTS
Table 1 summarizes the distributions of all 12 variables included in the dataset, along with the variable H1N1 deaths/1000.
Correlation analysis
The independent variables, population per square mile, percent resident population black race and the response variable, H1N1 deaths/1000 were highly skewed and hence, log transformed. The correlation coefficient (r) of the predictors with respect to the response variable, 95% confidence intervals and the associated P values are shown in Table 3. From Table 3, it is evident that of the 12 predictors, ten are statistically significant (P<0·05). Percent resident population aged <18 years and percent resident population white race are statistically insignificant. Population density, income, education and percent resident population black race show a negative correlation. Poverty, obesity, percent resident population aged <5 years and percent resident population aged ⩾65 years show a positive correlation. All the 12 selected predictors were then used to construct the regression tree and develop decision rules using the most significant splitting variables. Here it should be noted that the actual values of the 12 selected predictors were used for construction of the regression tree.
Correlation coefficient of the potential predictors with respect to H1N1 deaths/1000 population

Regression tree
The best regression tree generated using the procedure described in the Methods section is shown in Figure 2. Of the 12 predictors used for constructing the tree, only six of them showed up as splitting variables in the decision tree. These six predictors include: population density, percent with bachelor's degree education, percent in poverty, percent population black race, percent aged ⩾65 years, and percent population white race. This tree contains 14 terminal nodes. H1N1 deaths/1000 estimated from the regression tree ranged from 0·0125 to 0·3779. The first variable selected for splitting was population density. Of those counties which had a population density (measured in population per square mile) >30·7, a further split was observed for those which had a population density greater (or less) than 53·05. Counties that had a population density >145·4 and percent population black race >1·25 reported the least number (0·0125) of H1N1 deaths/1000 people. Of the counties that had a population density >145·4 and percent population black race <1·25, a further split was observed for those which had a population density greater (or less) than 400·3. Counties that had a population density in the range of 145·4–400·3 and percent population black race <1·25, reported 0·0130 H1N1 deaths/1000. However, counties that had a population density >400·3 and percent population black race <1·25 reported 0·1989 H1N1 deaths/1000. Thus, for counties with similar percent of population of black race and a population density >145·4, a much higher population density has resulted in H1N1 deaths 14 times higher than the second least number of H1N1 deaths/1000. Counties with a population density <30·7 reported H1N1 deaths/1000 ranging from 0·0461 to 0·3779. The group that had a population density <30·7 was further split according to educational attainment (bachelor's degree or higher). Counties with educational attainment <8·8 reported 0·3314 H1N1 deaths/1000. A further split in the group with higher education was based on percent in poverty, population density, education, percent aged ⩾65 years and percent population white race. Counties with low population density, low educational attainment, high percent of population aged ⩾65 years and with a combination of low population density, high education and low poverty reported higher H1N1 deaths/1000 compared to their counterparts.
Regression tree.

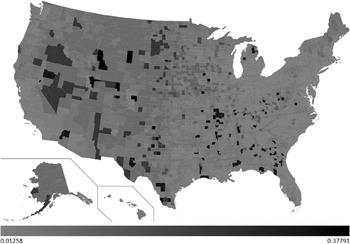
The developed decision tree was then used to predict H1N1 mortality for the whole of the USA. A choropleth map with the county-wise predictions of H1N1 deaths/1000 is shown in Figure 3. The light grey shading in the figure corresponds to 0·0125 H1N1 deaths/1000 and black corresponds to 0·3779 H1N1 deaths/1000. The values in between are highlighted using various gradations of shading between light grey and black.
County-wise predictions of H1N1 deaths/1000.
Of the 3141 counties included in our predictions, 586 counties were predicted to have encountered 0·0125 H1N1 deaths/1000. Fourteen counties were predicted to have encountered the maximum (0·3779) H1N1 deaths/1000. H1N1 deaths/1000 predictions for each state are shown in Figure 4. From our predictions, the top five worst affected states during the recent H1N1 pandemic would be Wyoming, North Dakota, South Dakota, Montana and Alaska. Similarly, the bottom five least affected states would be Delaware, New Jersey, Connecticut, Massachusetts and Maryland. Total H1N1 deaths predicted for each state are shown in Figure 5. H1N1 deaths predicted using our work for the whole of the USA sums up to 7667. From the predictions, we sorted the counties of each state in the order of H1N1 deaths/1000. The results are highlighted in the map shown in Figure 6. For each state, we have highlighted (in black) the counties which were predicted to have encountered maximum H1N1 deaths/1000 among all the counties of that particular state (shown in Sheet 2 of the Supplementary material). Similarly, the counties that were predicted to have encountered minimum H1N1 deaths/1000 among all the counties are highlighted in light grey. If these results were used as the basis for decision-making, it could be concluded that larger differences exist in H1N1 deaths in the counties due to socioeconomic variables. If health authorities intend to target only a few of the counties due to resource constraints, these decision rules will be of assistance. For example, according to these results, resources could be allocated to counties with low population density, low educational attainment, and high percent of population aged ⩾65 years to counties with a combination of low population density, high education and low poverty. In addition, the health authorities of these counties can organize awareness programmes and hence nullify the heterogeneity effect. The respective state authorities can use these results as the basis to strategize health-related interventions for future epidemics as well as for influenza seasons. The Matlab source codes used to develop the regression tree and choropleth map used in this work are available upon request.
H1N1 deaths/1000 predictions for each state of USA.

H1N1 deaths, predictions for each state of USA.

Worst affected and least affected counties for each state of USA.

DISCUSSION
Epidemiology involves the understanding of factors affecting the health of populations and serves as the basis for interventions made in the interest of public health. The decision tree methodology used here is a non-parametric approach that identifies the subgroups of a population whose members share common characteristics that influence the response variable of interest. In addition, the regression tree produces a visual output and simple rules that are easy to understand and interpret.
Our results indicate that H1N1 deaths would be concentrated in counties with low population density, low educational attainment, and high percent of population aged ⩾65 years and to counties with a combination of low population density, high education and low poverty. Socioeconomic indicators are believed to introduce health heterogeneity in the subgroups of the population and our results quantify the impact of these indicators on H1N1 mortality in the USA. Most of the strong relationship that we observed between the predictors and the response variable may be attributed to factors such as awareness about the symptoms of the disease, healthcare access, and timely hospitalization. These factors contribute to better symptomatic medical management [Reference Winkleby2]. Increased level of awareness of the need to report to the relevant authorities and to seek medical attention early in protecting oneself against the virus can also originate from an individual's higher education level. Higher income can also be associated with the increased probability of visiting medical facilities on exhibiting disease-related symptoms. Higher educational attainment and income results in acquisition of skills related to positive attitude about health, and access to preventive health service membership in peer groups [Reference Winkleby2].
Influence of per capita income on pandemic mortality has been studied in the past [Reference Murray8]. However, a study of this magnitude with as many as 12 predictors is a rarity. Previous studies in the literature could only explain half the variance in pandemic mortality, whereas, in our work we improved the predictive ability of the models by using decision trees and 12 predictors. The recently released county health rankings [26] offer the potential to extend the proposed approach for many more predictors such as access to care, quality of care, etc. One of the limitations of our work is that the counties which were updated with zero deaths were excluded from the analysis. The details on whether the counties reported zero deaths or had a poor infrastructure for reporting deaths were not available in the state health websites. For example, California, Connecticut, Florida, Kentucky, Pennsylvania and Wisconsin updated the statistics for all the counties in the state health websites, whereas, the rest of the states updated the statistics of only those counties that reported at least one death. Thus, for the former list of states, we were unable to conclude whether the zero reporting of the deaths by the counties of these states was due to better healthcare or due to poor reporting. Hence, we had to exclude the counties that reported zero deaths from our sample and conduct the analysis only for counties that reported non-zero deaths. This limitation can be addressed by constructing a decision tree with the counties that reported zero deaths as well. Hence, we developed the decision tree by including all the counties that reported zero deaths along with the 341 counties that reported non-zero deaths. This selection resulted in 637 counties. The choropleth map of the counties included in the dataset, the results and discussion are available in the online Supplementary material. Counties that had a per capita personal income higher than US$16 138.5, population density in the range of 8·9–26·75, population of white race <98·15% and percent in poverty <16·15% reported the least number of H1N1 deaths/1000. The lower value of H1N1 deaths/1000 reported in these counties may be due to poor reporting. However, further analysis is required to arrive at proper conclusions. The discrepancies in the predictions between the approaches using only non-zero-death reporting counties and both zero- and non-zero-death reporting counties highlight the impact of data quality on the estimates. In addition, the theoretical background or assumptions about the virulence of the virus, case-fatality rates, etc., were not considered in our current approach. Hence, our work suffers the limitation of its inability to forecast the absolute death count for future epidemic events (wherein the virulence of the virus, case-fatality ratio may be different). A possible alternative to counter this limitation is to use dynamic data mining to build time-series decision trees [Reference Weber27]. Time-series data on H1N1 cases and deaths are available online for the counties of California, Connecticut, Florida, Mississippi, South Carolina, South Dakota, Texas and Wisconsin. These data can be used to understand how social determinants influence the spread of the disease with respect to time. However, irrespective of the virulence of the virus, our work can be used as a basis to understand the relative effect in the counties based on social determinants. Our predictions are strictly based on mortality data collected from 341 counties. Although this constitutes 11% of the total counties of the USA and the dataset used in our work has similar characteristics to USA as a whole (Table 1), the predictive ability of the decision tree can be improved by using additional data from other counties. In addition, our approach assumes that there was no under- or overreporting of H1N1 deaths by certain counties. Quality of data used and reporting bias will influence the predictive ability of the model and hence, future efforts need to address this limitation as well.
This paper is the first study in which county-level data from the recent H1N1 pandemic was used to understand the effect of socioeconomic determinants on H1N1 deaths. We estimated that the recent H1N1 could have killed 7667 individuals in the USA. This estimate is in accord with the lower bound of the CDC estimates of 8870 deaths [28]. CDC estimated the prevalence of H1N1 pandemic using a probabilistic multiplier model that adjusted for sources of under-ascertainment. The number of deaths was not directly estimated from the model. The ratio of deaths to hospitalizations was found to be 6% using the laboratory-confirmed cases. With the assumption that deaths and hospitalizations were underreported to the same extent, this fraction was used to estimate the bounds for H1N1 deaths using the number of hospitalizations. In addition to the death estimates, we have listed the possible counties to be targeted for health-related interventions. The respective state/county authorities can use these results as the basis to target and optimize the distribution of public health resources.
Our results suggest that deaths due to H1N1 were influenced by social heterogeneity that exists both between counties and states. As Paul Farmer quotes, ‘inequality itself constitutes our modern plague’ [Reference Farmer4]. H1N1 2009 provided the opportunity to understand the health heterogeneity that prevails at county level in the USA. Deaths due to infectious disease are but a symptom of a crisis with the marginalization of a subgroup of the population [Reference Michael1, Reference Sommerfeld and Kris3]. Our work provides the additional evidence towards the quantification of this marginalization and provides the opportunity to locate the subgroups and nullify the heterogeneity effect with necessary health-related interventions. H1N1 death-related data have been documented at local, county, province, regional, and state level in many countries. This work provides a novel approach to use the collected data effectively to quantify the marginalization at each level, subgroup, the population to be targeted and optimize the distribution of public health resources efficiently.
NOTE
Supplementary material accompanies this paper on the Journal's website (http://journals.cambridge.org/hyg).
ACKNOWLEDGEMENTS
This work was supported by the National University of Singapore in the form of a research scholarship to L.P.
DECLARATION OF INTEREST
None.


