

Introduction
In the valley of the Meuse, many river terraces were formed during the Pleistocene. These terraces are the result of both climatic and tectonic changes in time (Van den Broek & Maarleveld, Reference van den Broek and Maarleveld1963; Kasse et al., Reference Kasse, Vandenberghe and Bohncke1995, Reference Kasse, van Balen, Bohncke, Wallinga and Vreugdenhil2017; Van den Berg, Reference van den Berg1996; Huisink, Reference Huisink1998). In the middle part of the Meuse valley, the two terraces directly adjacent to the present river channel date to the Younger Dryas and Holocene. The Younger Dryas terrace is characterised by a braiding surface pattern and was abandoned during the Preboreal. Due to the warmer climate at the start of the Holocene, the vegetation cover increased and soils stabilised. As result, a change from a braided to a meandering river system occurred. Overbank deposits cover the terrace, as it was often flooded during the Holocene (Van den Berg, Reference van den Berg1996). During the Early Holocene some channels of the former braided river system were deepened and the river incised in the Younger Dryas floodplain (Kasse et al., Reference Kasse, Vandenberghe and Bohncke1995). The main channel of the Meuse migrated in a small floodplain. The meander belt formed in this period is often absent from the sediments in the Meuse valley and when present it is very narrow, except for the area of the subsiding Roer Valley Graben. The phase of incision and migration during the Early Holocene was followed by an equilibrium flow. Sedimentation started again around the end of the Subboreal as a result of an increased river discharge related to deforestation by man.
The above-described sedimentation history of the Meuse during the Holocene is generally known but based on a limited number of data (Van den Berg, Reference van den Berg1996; Tebbens, Reference Tebbens1999). Also information about the vegetation history of the Meuse river valley was rather limited until the recent discovery of the Well–Aijen residual channel (Bos & Zuidhoff, Reference Bos and Zuidhoff2015). Based on several archaeological excavations during the last two decades, however, our knowledge of the sedimentation history, vegetation development and human occupation in the Meuse valley has increased (Stoepker et al., Reference Stoepker, van der Gauw, Peeters, Quadflieg, Simons, Stassen and Winthagen2005). A large number of unknown archaeological sites dating from the Mesolithic to the Middle Ages were discovered (Prangsma, Reference Prangsma2008; Gerrets & de Leeuwe, Reference Gerrets and de Leeuwe2011; Gerrets & Williams, Reference Gerrets and Williams2011; ter Wal & Tebbens, Reference ter Wal and Tebbens2012; Bouma & Müller, Reference Bouma and Müller2014; Kimenai & Mooren, Reference Kimenai and Mooren2014). The excavations suggested a strong relationship between the geomorphology of the river terraces and human occupation; most remains were found on the higher terraces or their slopes or a short distance from the Meuse river. Apparently the terraces of the Meuse river provided favourable conditions for human occupation due to the fertile soils and the proximity of the river as a water supply and as an important traffic way. The habitation area, however, was restricted by the frequency of floods. Regularly flooded areas on the river terrace could only be used temporarily. Permanent settlement was only possible during periods with low flood frequencies and on the higher parts of the terrace, such as the aeolian dunes and natural levees. The archaeological sites, however, were often covered by sediments and are therefore difficult to find.
In this paper the palaeoenvironmental evolution of a Meuse terrace near the village of Lomm will be reconstructed in relation to human occupation. In order to investigate human–environmental relationships through time, a combination of geo-archaeological methods were applied, including geomorphological (i.e. lidar data, grain-size), micromorphological and botanical (i.e. pollen and macrofossil) analyses. Accelerator mass spectrometry (AMS) 14C, optically stimulated luminescence (OSL) and dendrochronological dating provided an accurate chronology for the sediments and archaeological structures.
Study area
The Lomm site is located in the northern Meuse river valley of the southeast Netherlands close to the German border, about 7km north of Venlo (Fig. 1). The site is located close to the present river, on a terrace of the river Meuse that was formed during the Younger Dryas period (12,846–11,653 cal yr BC; Lowe et al., Reference Lowe, Rasmussen, Björck, Hoek, Steffensen, Walker, Yu and group2008). The gravelly deposits of the former riverbanks are locally covered by aeolian dunes, which developed when the sand was blown from the channels during periods of low discharge. Silty sand layers that were deposited during regular Holocene floods cover the fluvial terrace deposits and dunes.
Location of the study area. Black star shows the location of the field area. A detailed map is shown in Figure 2.

Recently, large water basins have been constructed as a passage for the Meuse river during high water levels. Prior to this, archaeological research was carried out and a large number of trenches were created in which samples were taken for palynological analysis and accurate dating. The emphasis during the excavations was on the relation between palaeoenvironmental changes and occupation history during the Holocene.
Material and methods
Field methods
The Lomm study area has been the object of archaeological research since 1999. First a reconnaissance study was made involving a literature study and a coring campaign (Raemaekers & Heunks, Reference Raemaekers and Heunks2000). During this study, 18 potential archaeological sites were discovered. In 2003 these sites were evaluated by digging 23 trenches over the whole study area (Verhoeven & Schutte, Reference Verhoeven and Schutte2004). It was concluded that the study area was an excellent archaeological site and that the sites should be excavated completely. During three digging campaigns (phases I, II and III) between 2006 and 2009 the northern part of the area was excavated (Prangsma, Reference Prangsma2008; Gerrets & de Leeuwe, Reference Gerrets and de Leeuwe2011; Gerrets & Williams, Reference Gerrets and Williams2011). The side-walls within the trenches were described using the Archaeological Standard Coring Description Method of the Dutch Geological Survey (ASB version 1.1) with regard to texture, median grain size, organic matter content, colour, Fe-oxide content, CaCO3 content, groundwater levels and (palaeo) soils (Bosch, Reference Bosch2008). In addition, the amount, size and diversity of archaeological artefacts (charcoal, fragments of pottery, bone) were described. During the second campaign an east–west-orientated trench 600m long was created in order to obtain an overview of the geomorphology of the landscape. In this trench most of the samples for OSL dating, AMS 14C dating, pollen analyses, micromorphology and grain-size analysis were collected (trench 1 in Fig. 2). Grain size was determined using a FRITSCH ‘Laser Particle Sizer’ A22. This method determines sand- and silt-sized sediments well, but tends to underestimate the clay content (Konert & Vandenberghe, Reference Konert and Vandenberghe1997).
Geological map of the study area with archaeological structures, the location of the trenches and botanical samples.

Micromorphology
In order to determine which soil-forming processes were or had been active, micromorphological samples were taken from soil horizons. In the laboratory, thin micromorphological sections were made following the method of Jongerius & Heintzberger (Reference Jongerius and Heintzberger1975). The thin sections were examined with a petrographic microscope and analysed according to the method of Bullock et al. (Reference Bullock, Federoff, Jongerius, Stoops and Turstina1985) and Courty et al. (Reference Courty, Goldberg and Macphail1989).
Chronology
14C- and OSL-dating and dendrochronological data were used to obtain an accurate chronostratigraphical framework for the sedimentological, botanical and archaeological data (Tables 1 and 2). Age information provided by finds of pottery was also used.
OSL dates obtained from this study.

14C AMS dates obtained from this study. Ua: Angström Laboratory, Uppsala University (Sweden); GU: Scottish Universities Environmental Research Centre, Glasgow (UK); KIA: Leibniz Labor, Kiel (Germany). Radiocarbon dates were converted into calendar years using the CALIB 7.1 computer program and the INTCAL13 calibration curve (Stuiver and Reimer, Reference Stuiver and Reimer1993; Reimer et al., Reference Reimer, Bard, Bayliss, Beck, Blackwell, Bronk Ramsey, Buck, Cheng, Edwards, Friedrich, Grootes, Guilderson, Haflidason, Hajdas, Hatta, Heaton, Hogg, Hughen, Kaiser, Kromer, Manning, Niu, Reimer, Richards, Scott, Southon, Turney and van der Plicht2013).

a Date too old compared with the more reliable date of the seed sample above from the same well.
b Date too old: pottery indicates an Early Iron Age for this sample.
From the residual channel fills, a number of samples of organic material reflecting atmospheric 14C concentrations (e.g. seeds and fruits from terrestrial plants) were selected for AMS 14C dating (Table 2). Levels that were chosen for 14C dating were based on lithological and palynological events, such as the start and end of peat formation and changes in the arboreal pollen/non-arboreal pollen (AP/NAP) ratio and other trends in the pollen curves. AMS 14C dating was performed at three different laboratories, the Leibniz-Labor für Altersbestimmung und Isotopenforschung, Kiel (Germany), the Scottish Universities Environmental Research Centre, Glasgow (UK), and the Angström Laboratory at Uppsala University (Sweden). Radiocarbon dates were converted to calendar years using the CALIB 7.1 computer program and the INTCAL13 calibration curve (Stuiver & Reimer, Reference Stuiver and Reimer1993; Reimer et al., Reference Reimer, Bard, Bayliss, Beck, Blackwell, Bronk Ramsey, Buck, Cheng, Edwards, Friedrich, Grootes, Guilderson, Haflidason, Hajdas, Hatta, Heaton, Hogg, Hughen, Kaiser, Kromer, Manning, Niu, Reimer, Richards, Scott, Southon, Turney and van der Plicht2013; Table 2). In this article, radiocarbon ages are expressed in 14C BP, whereas calibrated ages are reported in cal yr BC.
The water wells and holes discussed in this study were dated using various techniques including dendrochronology, pottery and AMS radiocarbon dating. In order to determine the time of deposition of the fluvial sediments (Wallinga, Reference Wallinga2002), quartz OSL-dating was applied. This is an appropriate method for sediments aged up to 100–150ka. Samples were taken from the river sediments of the Younger Dryas, aeolian sand deposits, residual channel fills and overbank deposits. The OSL signal of sand-sized quartz grains is set to zero by light exposure prior to burial, and builds up after burial due to ionising radiation from surrounding sediments (with a small contribution from cosmic rays). The age of the sample is obtained from measurements of the dose absorbed by the grains since the last light exposure (equivalent dose; De, expressed in Gy) and measurement of the radiation flux the grains were exposed to since burial (dose rate; expressed in Gyka−1).
Botanical analyses
Palynological analyses
Samples were collected from various sediment profiles taken from residual channel fills (sites 217/218 and 219/220, sites 12/13, 565, 625 and 008) and water wells (Iron Age water well 518, Roman age water hole 629 and water well 702) collected in the field, using a small corer with a volume of 1–3cm3. The samples were prepared following Fægri and Iversen (Reference Fægri, Iversen, Faegri, Kaland and Krzywinski1989) with additional sodiumpolytungstate heavy liquid separation to remove the clastic material. Subsequently, the material was sieved over a 7–8µm nylon mesh to remove fine particles, mounted in glycerine jelly and sealed with paraffin wax. Lycopodium (=exotic) spores were added to calculate microfossil concentrations.
First, all pollen samples were scanned. Hereby species content, age and the potential of the sample for analysis is estimated. Secondly a selection was made of samples suitable for analysis. A Leica light microscope (magnification 400×, 630× and 1000×) was used for scanning and pollen counting. Pollen types were identified by comparison with modern reference material and identification keys of Moore et al. (Reference Moore, Webb and Collinson1991), the Northwest European Pollen Flora vols. I–IX (Punt et al., 1976–Reference Punt2003) and Beug (Reference Beug2004). Nomenclature follows these keys. Pollen and spore analysis was performed at the lowest possible taxonomic level. Other microfossils or so-called non-pollen-palynomorphs (e.g. algae, fungal remains) were identified using van Geel (Reference van Geel1978, Reference van Geel, Smol, Birks and Last2001), van Geel et al. (Reference van Geel, Bohncke and Dee1981, Reference van Geel, Coope and van der Hammen1989, Reference van Geel, Buurman, Brinkkemper, Schelvis, Aptroot, van Reenen and Hakbijl2003) and van Geel & Aptroot (Reference van Geel and Aptroot2006).
The results of the microfossil analyses are displayed in dia-grams. The percentage diagrams of the residual channels and water wells were constructed using the Tilia and Tg.view computer programs (Grimm 1992–Reference Grimm2004). Zonation of the diagrams was based on changes in the AP/NAP ratio and trends in the percentages of arboreal taxa that dominate the Holocene pollen records of NW Europe. Taxa were arranged stratigraphically and divided into regional and local components following Janssen (Reference Janssen, Birks and West1973, Reference Janssen1984). Combined AP and NAP totals were employed for percentage calculations. The pollen sum includes trees and shrubs, Ericales, upland herbs and cereals. Pollen and spores of the local aquatic or marsh vegetation, including Poaceae and Cyperaceae (the latter also due to the presence of Clasterosporium caricinum (HdV-126), a parasite on Carex) were excluded. Total pollen sums varied between c. 310 and 520.
Pie charts were also made for each archaeological period (i.e. Mesolithic, Neolithic, Bronze and Iron Age, Roman period and Middle Ages) in which the ecological groups included in the pollen sum were displayed. The pie charts and the location of the sites that were investigated were displayed on the map of the study area (Fig. 2). In this way the distribution of the vegetation through time could be visualised.
Plant–macrofossil analyses
Macrofossil samples were collected from archaeological structures such as trenches, water wells/hole (Roman period, Iron Age), a granary pit (Iron Age) and charcoal pits (Middle Ages). Due to low groundwater levels, however, most macroremains were rather badly preserved and only a small number of the scanned samples contained enough seeds and/or fruits for analysis to provide us with some information about what was consumed and cultivated.
Plant macroremains were recovered from the archaeological samples by washing the sampled material over a 0.5mm sieve. For the selection of the macroremains from the peat deposits in general a sieve with a smaller mesh size (0.125mm) was used. Macroremains were picked out from the recovered fraction and stored at 4°C. For screening and selection a Leitz dissection microscope (magnification 8–40×) was used. Plant macrofossil identifications were made by comparison with modern reference material and identification keys of Beijerinck (Reference Beijerinck1947), Berggren (Reference Berggren1969, Reference Berggren1981), Anderberg (Reference Anderberg1994) and Cappers et al. (Reference Cappers, Bekker and Jans2006). Nomenclature follows van der Meijden (Reference van der Meijden1996). The results of the macrofossil analyses are displayed in Table 3.
Results of the analysed macroremain samples of this study. (unch = uncharred.)

From the Iron Age, two macrofossil samples were analysed from two different pits (293 and 574, phase I), two samples from an Early Iron Age water well (518 and 528, phase II) and three from two pits (36 and 340, phase III) and a pole hole of a granary pit (342, phase III) (Table 3). The macrofossil samples from the Early Iron Age water well correspond with the pollen samples from the same well (518). In sample 518, however, no botanical remains were present, while, in sample 528, only a few seeds of Chenopodium album (melde) were recorded (Table 3). At least two pits (36 and 340) and a pole hole of a granary pit (342) dating in the Iron Age, excavated during phase III, provided some botanical information. The Iron Age pit samples (293 and 574) from phase I, however, were rather poor in botanical content (Table 3).
From the Roman period there is a little more information available from the macroremain samples. Samples were analysed from a Roman water well (804–805, phase I) and a water hole (628, phase I) (Table 3). In this case, both pollen and macroremain samples were analysed from the same archaeological structures. Macroremain sample 628 corresponds with pollen samples 629, while macrofossil samples 804 and 805 correspond with pollen samples 702 (Table 3). In the analysed samples from the Medieval charcoal pits (479, 535, phase II) there were also charcoal remains, with no fruits and seeds present (Table 3).
Results
Lithological sequences and dating
The lithological sequence in the different cross-sections is very uniform and can be described as follows: at a depth of 12–15ma.s.l., coarse-grained sandy sediments were found (Fig. 6 further below). The sand is moderately well sorted, and, in general, sorting increases toward the top. In some sections, layers of gravel were found. A fining upwards sequence was present in nearly all sections, as silty sand covers the sandy layer. In the central part of the study area the sandy sediments were covered by well-sorted sand. The sandy layer is interpreted as a channel deposit that forms part of the Younger Dryas terrace. The well-sorted sand was deposited as small aeolian dunes, formed locally. The silty sand layer is an overbank deposit and represents the last sediments deposited during the Younger Dryas or Early Holocene. In the top of the silty sand a dark-grey horizon was regularly present with fine charcoal and humus fragments. A micromorphological study of the layer indicates that this is not a soil horizon and suggests that the difference in colour was probably caused by a different composition of the sand grains in that period (van Kappel & Exaltus, Reference van Kappel, Exaltus, Gerrets and de Leeuwe2011). In all the described sections (e.g. Fig. 3) a residual channel was found, although the channels are of different origin. The channels were all filled in with silty loam. The Younger Dryas / Early Holocene sediments and the residual channels were covered with a layer of silty sand and are interpreted as overbank deposits of the Late Holocene river Meuse. The difference between these layers and the underlying sediments is that the sediments contain a higher sand percentage (van Kappel & Exaltus, Reference van Kappel, Exaltus, Gerrets and de Leeuwe2011; Zuidhoff, Reference Zuidhoff, Gerrets and de Leeuwe2011).
Cross-section of trench 1, west part. For the location see Figure 2.

Relevant sedimentological layers were dated in order to provide a chronostratigraphical framework for the sedimentation phases on the river terrace and in the residual channels. Unfortunately most of the sediments in the residual channels did not contain sufficient material for AMS 14C radiocarbon dating. In one residual channel in the southern part of the study area, however, a peat deposit was found that could be used for AMS 14C radiocarbon dating. In the other channels, OSL or palynological analysis was used for absolute or relative dating respectively. In a schematic cross-section most of the OSL dates from the different sections are summarised (Fig. 4). Sections with several dates are shown in separate figures (Figs 3, 5, 9 and 13).
Schematic W–E cross-section of the western part of the area with most of the results of the OSL dates.

Cross-section of trench 81 at the cult place. For the location see Figure 2.

The sandy sediments from the Younger Dryas terrace were sampled in the western part of the area (trench 81) (Fig. 5). Sample RCE3 had an expected age of Younger Dryas: 11,290±600 BC (Table 1). Sample ARCN-707 originates from the same layer but had an unexpectedly old age of 15,290±800 BC. This is probably the result of reworking of older fluvial sediments due to the high energetic river system during the Younger Dryas (Huisink, Reference Huisink1998). In the north of the study area, four samples from these sandy sediments of the river terrace (trench 50) were OSL-dated (ARCN-421 to 424; Table 1). The ages of these samples suggest that all sampled deposits were formed c. 10,000 years ago, i.e. during the Early Holocene. The samples are therefore slightly younger than the expected Younger Dryas age.
In trench 81 an abandoned river channel was found 40m from the present river (Fig. 5). This is the most westerly located channel. The OSL ages of the abandoned channel showed that the residual channel was filled in during the Mesolithic. The hydroseral succession process was halfway around 7590±600 BC and complete in 6290±600 BC (ARCN-708 and RCE2). The overbank sediments overlying the residual channel and the archaeological traces of an Iron Age cult place were of a younger age: AD 590±140 (Fig. 9 further below; Gerrets & de Leeuwe, Reference Gerrets and de Leeuwe2011). In trench 46 the dark grey horizon in the overbank deposits overlying the ditches of the cult place was dated together with the overlying Holocene overbank deposits (Fig. 6). The OSL dates showed a very young age of the two layers: AD 1652±23 and AD 1719±19 (ARCN-781 and 782). This suggests that these sediments were bleached by sedimentation or ploughing later than the Middle Ages. Moreover, the 50cm on top of sample ARCN-782 was formed during the last 300 years. In the southwest of the area (trench 43) a Medieval ditch was made in the dark layer. The OSL dates revealed ages similar to those from the cult place: AD 1418±35 and AD 1639±39. The ditch was filled in at the beginning of the 15th century. The top was bleached by ploughing during the 17th century and since then covered by sediments.
Cross-section of trench 46 at the cult place. For the location see Figure 2.

In the western part of trench 1 another abandoned channel incised in the Younger Dryas terrace is present (Fig. 3). The channel was filled in with the same silty loam as in trench 81 and was dated by OSL at the base at 9290±500 BC (Mesolithic) (ARCN-6) and at the top at 900±220 BC (Late Bronze Age) (ARCN-5). Grain-size analyses of the channel sediments showed that towards the top there is an increase in silt percentage and a decrease in sand percentage (Fig. 7). This could be explained by a decrease in sediment supply during this period due to an equilibrium flow of the Meuse. The sand percentage of the overlying overbank deposits was relatively high compared to the channel infill. They were dated at AD 1300±50 (ARCN-4). To the west of the section, in sandy channel deposits between the residual channel in this section and the residual channel in trench 81, an OSL sample was taken which revealed an age of 7890±500 BC (ARCN-3). Together with the results of OSL dates in the north of the study area (ARCN-421 to 424; Table 1), it can be concluded that the western part of the terrace adjacent to the present river channel was formed during the Early Holocene.
Grain-size analysis of the abandoned channel in the western part of trench 1.

A third abandoned channel (12/13; Fig. 2) was found under a gravel road to the east of the other two residual channels. This channel was 2.5m deep and filled in with humic clay. In the seven pollen samples that were scanned from the base of the channel fill, high percentages of deciduous trees or shrubs such as oak, alder, hazel, elm and lime were found (samples 12/13, at depths of 1385.5, 1390.5, 1395.5, 1400.5, 1405.5, 1410.5 and 1415.5cma.s.l.; Zuidhoff & Bos, Reference Zuidhoff, Bos, Gerrets and de Leeuwe2011a , Reference Zuidhoff, Bos, D.A. and Williams b ). The presence of pine and absence of cereals and arable weeds suggests an (Early/Middle) Atlantic age (Mesolithic). Based on the high values of oak and hazel and low values of beech, herbs and cereals in the pollen samples (12/13 at depths of 1425.5 and 1420.5cma.s.l.; Fig. 2) the top of the channel was dated in the Late Subboreal (Late Bronze Age). This corresponds well with the OSL date (ARCN-05) of the abandoned channel to the west.
In the eastern part of the study area a wide and shallow residual channel was present. In the south of the study area this channel was filled in with peat (Fig. 8). This was the only location in the study area where the residual channel fill deposits revealed enough material for 14C radiocarbon dating. For this reason and to exclude local variation, the base and top of the peat deposits of the residual channel fill were dated at two sites (217/218 and 219/220). The sites were located relatively close to each other, c. 2.5m apart. Radiocarbon dates of the base of the peat revealed ages of 7140±50 BP (6090–5900 BC) at site 217/218 and 6560±55 BP (5620–5380 cal yr BC) at site 219/220 respectively, which both date in the Late Mesolithic (Table 2). The top of the peat was dated at 3870±25 BP (2465–2235 cal yr BC, Late Neolithic) at site 219/220 and 3115±25 BP (1440–1300 cal yr BC, Middle Bronze Age) at site 217/218 (see further discussion below).
Cross-section of trench 39 with peat layer and the location of the pollen and 14C samples.

In the north, two tributaries of this main residual channel were filled in with humic clay and peat. The pollen sample of the northernmost tributary contained low values of beech and moderate values of cereals. This suggests a Late Subboreal age (Late Bronze Age) for these deposits (Fig. 2, site 565; Bos et al., Reference Bos, Bouman, Moolhuizen and Prangsma2008a). The base of the peat layer in the other tributary (Fig. 2, site 625; Zuidhoff & Bos, Reference Zuidhoff, Bos, Gerrets and de Leeuwe2011) was dated in the Atlantic (Neolithic), based on the high pollen percentages of hazel, oak and lime and low values of herbs. Sample 008 was also taken in this tributary: the mid-part of the organic infill was dated based on the pollen assemblage in the Middle Bronze Age, which confirms that this tributary channel was abandoned earlier than the northern tributary (Fig. 2; Bos et al., Reference Bos, Bouman, Moolhuizen and Prangsma2008a; Zuidhoff and Bos, Reference Zuidhoff, Bos, D.A. and Williams2011b).
The water wells (518 and 702) and water hole (629) discussed in this study were dated by various techniques including dendrochronology, pottery and AMS radiocarbon dating (Tables 2 and 3). The sediments of water well 518 were dated based on a radiocarbon date of a wooden pole that was found at the base of the well, which gave an age of 2540±35 BP (800–540 cal yr BC; Table 2). The Early Iron Age date was also confirmed by its pottery content (c. 700 cal yr BC). Water hole 629 was dated, based on its pottery content and on a 14C AMS date of 2035±45 BP (170 BC–AD 60; Table 2), in the first to second century. A pollen sequence (discussed below) was collected from the basis of the water hole. Water well 702 had a wooden casing that could be dated by dendrochronology. The wood revealed a felling date between AD 76 and AD 93 and also dates the well in the Early Roman period.
Archaeology
Archaeological remains were mostly found on the higher parts of the Younger Dryas terrace, on the aeolian dunes and on the slopes of the riverbanks (Fig. 2). The terraces were more or less continuously inhabited since the Mesolithic; however, most archaeological remains date from the Iron Age, Roman period and Middle Ages. From the Late Bronze Age and Early Iron Age two clusters of three cremation burials were found (Gerrets & de Leeuwe, Reference Gerrets and de Leeuwe2011). Spread over the area, traces of one larger farmstead were also recovered surrounded by several granaries from the Early Iron Age as well as a water well (Prangsma, Reference Prangsma2008). No traces of houses from the Middle/Late Iron Age were present. Instead a unique find was made in the form of a Middle Iron Age cemetery and rectangular cult place, situated in the lower area very close to the – at that time – active river channel (Gerrets & de Leeuwe, Reference Gerrets and de Leeuwe2011; Fig. 9). The cremation burials in the vicinity of the cult place date from the Middle Iron Age to the Early Roman period. Traces from the Roman period were also found in the east of the study area, as a small farmstead structure and a Roman cemetery were present near the Meuse river south of the cult place (Gerrets & de Leeuwe, Reference Gerrets and de Leeuwe2011). From the Early Middle Ages the only finds were pits with large amounts of charcoal that were scattered over the study area. From some of the pits the charcoal was radiocarbon-dated, which revealed ages that date to the 7th, 8th, 9th and 13th centuries (Gerrets & de Leeuwe, Reference Gerrets and de Leeuwe2011). The pits were probably used to produce charcoal for iron production. From the Late Middle Ages to the present the area has not been inhabited and has only been used for agriculture. During the excavations a large number of ditches were found from this period. Second World War ditches were also present parallel to the river Meuse (Gerrets & de Leeuwe, Reference Gerrets and de Leeuwe2011).
Archaeological traces of the cult place near the Meuse. The structure consists of a small rectangular ditch inside a larger rectangular outer ditch. Two rows of post holes are found inside the outer ditch.

Palynology and archaeobotany
The most complete palynological sequence in the Lomm study area was collected from a residual channel fill in the southern part (trench 39) (Figs 2, 8 and 10). The sediments show a typical infilling of a residual channel with coarse sandy and gravelly deposits at the base and more organic-rich, peaty deposits towards the top. The active braided river deposited the basal sands and gravels during the Younger Dryas. Infilling of the residual channel occurred during the Holocene with sandy loams / silty clays at the bottom, followed by peat. The peat deposits are overlain by an orange-coloured gyttja (Figs 8 and 10). Two sequences (sites 217/218 and 219/220) were collected in the field for pollen analysis from this southern residual channel infill. Initially, pollen samples were scanned from both sites and radiocarbon dating was carried out from the bottom and top (see above). The scan and the 14C ages revealed that the deposits at site 219/220 enclosed the longest time interval (Fig. 11), so pollen analysis concentrated on this site. The pollen diagram of site 219/220 encompasses the Boreal to Subatlantic biozones (i.e. Mesolithic to Middle Ages) (Fig. 10). In the pollen diagram the immigration of various deciduous trees (i.e. alder, ash, beech and hornbeam) during the Holocene can be followed. The pollen diagram was subdivided into four pollen zones, which will be described below.
Microfossil diagram of the residual channel 219/220, phase III (Boreal to Middle Ages).

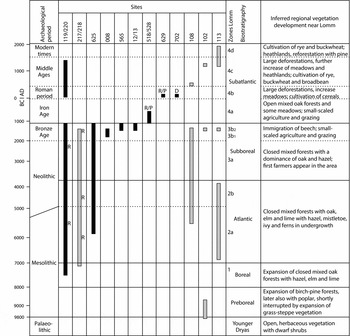
Overview of the investigated palynological sites. Dating of the records was based on radiocarbon dating (=R), dendrochronology (=D) and pottery (=P). The analysed pollen samples are displayed in black, the scanned pollen samples in grey. The inferred regional vegetation development for the Lomm area is also shown.
Other sites (residual channel fills of sites 12/13, 565, 625 and 008 and the two water wells 518 and 702 and water hole 629) from which palynological samples were analysed encompass shorter time intervals of the Holocene (Fig. 11). They will be discussed below in relation to the biozones distinguished from the more complete pollen diagram of site 219/220.
Zone 1: Boreal (Mesolithic)
The basal sandy loams / silty clays at site 219/220 are correlated with the Boreal biozone based on the relatively high pollen percentages of pine (Pinus) and deciduous trees and shrubs such as Corylus (hazel), Quercus (oak), Ulmus (elm) and very low percentages of NAP. Pollen of deciduous trees such as Tilia (lime) and birch (Betula) is also present. The presence of the shade-tolerant lime indicates a Middle Boreal age for these deposits, as lime trees usually appear slightly later during the Boreal.
The pollen assemblage in zone 1 suggests that during the Boreal (Mesolithic), shrubs and dense forests of deciduous trees developed in the Lomm area, initially with hazel but later also with oak, elm and lime. On the higher terraces open pine forests remained present as a relic from the Late-glacial (Fig. 12A).
Pie chart diagrams of the pollen samples from the (A) Boreal (Mesolithic), (B) Atlantic (Neolithic), (C) Subboreal (Bronze Age), (D) Subatlantic (Iron Age) and (E) Subatlantic (Roman period and Middle Ages). Pie chart diagrams legend: dark green = trees and shrubs; purple = heath taxa; yellow = upland herbs; and red = cereals and crops. Other legend is given in Figure 2.

The Boreal is also reflected in the pollen samples (site 5390) from pit 113 (Fig. 2), which were collected in the central part of the study area from the same clay layer as was found at the base of site 219/220. In these samples pine is dominant (Bunnik, Reference Bunnik2005b). This may be a reflection of the natural pine forests that were present during this period on the slightly elevated sandy soils to the west and on the higher sand and gravel-rich terraces of the Meuse valley. In the lower southern area, however, around the residual channel at site 219/220, hazel shrubs were dominant.
Zone 2: Atlantic (Mesolithic – Early Neolithic)
The start of the Atlantic is characterised in the pollen diagram of site 219/220 by the immigration of ash (Fraxinus) and expansion of alder (Alnus). Hazel pollen values decrease and oak becomes the dominant tree during the Atlantic (Mesolithic–Neolithic). This dominance continues far into the Subatlantic. NAP values remain relatively low. In the pollen assemblage typical ‘Atlantic’ taxa are present, such as mistletoe (Viscum album) and ivy (Hedera helix).
During the Atlantic, mixed deciduous forests were present with oak, elm and ash on the river terraces. Oak was the dominant tree in these forests, with hazel, mistletoe, ivy and ferns in the undergrowth. Oak ferns may have grown on and around fallen trees. Pine remained the dominant tree on the higher terraces. The importance of pine decreases during the Atlantic (i.e. sites 5389 and 5390 of pit 113; Fig. 2; Bunnik, Reference Bunnik2005b) and deciduous forests with oak, lime and elm and undergrowth of hazel, ivy and oak ferns gradually replace the pine woodlands on these higher terraces. On the lower parts of the terrace, such as in the residual channels, alder dominated the forests. Also in the residual channel at site 219/220 a peat-forming alder carr developed during the Atlantic.
From these basal peat deposits two radiocarbon dates are present. At site 217/218 the basal peat deposits were dated at 7140±50 BP (6090–5900 cal yr BC) and at site 219/220 at 6560±55 BP (5620–5390 cal yr BC) (Table 2). Both dates fit well with the palynological (=Atlantic) age and suggest that peat growth started slightly earlier at site 217/218, where a small depression is present. A fallen alder tree, located in the middle of the peat deposit at this site, was dated at 5720±25 BP (4680–4490 cal yr BC), which points to a Late Atlantic age.
The Early to Late Atlantic is also present in the samples (sites 5389 and 5390) from pit 113 (Fig. 2) located in the central part of the study area (Bunnik, Reference Bunnik2005b; Figs 11 and 12B). The Late Atlantic (subzone 2b, Early Neolithic) is also reflected in the lowest pollen sample at site 625 (Fig. 13) from a residual channel in the more easterly part of the study area and in the scanned samples (site 5381) in the south of pit 108 (Bunnik, Reference Bunnik2005b; Figs 2, 11 and 12B). In the pollen sample of site 625, the values of lime are higher, while those of elm are lower than at site 219/220 (Figs 10 and 13). This suggests that during this period the forests on moist soils in the southern part of the study area contained more elm and less lime. Lime was probably growing in the forests on the higher soils with a moderate nutrient availability in the northeast of the study area and on the higher terraces of the Maas river valley (site 008, Fig. 12B). In the north, also more bare ground was available on which heather and pioneer communities with herbs, such as composites, could develop (site 625, Fig. 13).
Microfossil diagram of the tributary of the residual channel 625, phase II (Neolithic – Late Bronze Age).

Zone 3: Subboreal (Middle/Late Neolithic – Bronze Age)
The high values of oak, hazel and alder and the first appearance of cereal (Cerealia) pollen grains suggest that the upper peat deposits from the residual channel fill at sites 217/218 and 219/220 (Figs 10 and 11) date in the Subboreal. Pollen of lime, elm, birch and ash are present in low values. In the pollen diagram of site 219/220, the Subboreal can be further subdivided into a Middle/Late Neolithic (subzone 3a) and Bronze Age section (subzone 3b).
Subzone 3a: Subboreal (Middle to Late Neolithic)
In the pollen assemblage that correlates to the Neolithic, NAP values are low, AP values are high (although elm values have slightly decreased) and there are some single finds of cereal grains. The high values of alder indicate the local presence of an alder carr. This period is also reflected in the pollen diagram from the residual channel at site 625 (Fig. 13) in the more easterly part of the study area and in the scanned samples from pit 108 (Bunnik, Reference Bunnik2005b; Fig. 11). In the samples (site 5381) from pit 108 (Fig. 2; Bunnik, Reference Bunnik2005b) the transition from the Atlantic to Subboreal biozones is reflected in the so-called elm-decline.
During the Subboreal, pine slowly started to disappear from the landscape, while on calcareous-rich sand dunes and terraces rich in sands and gravel, some sea buckthorn (Hippohae rhamnoides) remained present (see site 5381, pit 108; Bunnik, Reference Bunnik2005b) as a relic from the Late-glacial. Most of the Meuse valley and higher terraces, however, were covered by dense mixed deciduous forests dominated by oak. Hazel, mistletoe, ivy and (oak) ferns were present in the undergrowth of these forests. In the forests, the role of lime (site 625) and elm (site 219/220) started to decrease. This suggests that while elm was affected on the moister soils in the south of the study area, the amount of lime decreased in the forests on the higher grounds in the northeast and higher terraces of the Meuse valley. Neolithic people probably used twigs and branches of trees (such as ash, elm, lime and hazel) as winter food for cattle (Bunnik, Reference Bunnik2005a) or for construction purposes i.e. to build track-ways across wetlands (cf. Elias, Reference Elias2009). The presence of Neolithic farmers in the Meuse area was also confirmed by finds of cereal pollen in the pollen diagrams of site 625 (Fig. 13) and site 219/220 (Fig. 10). Furthermore, at site 625 typical anthropogenic pollen types were recorded, such as narrow-leaf and broad-leaf plantain (Plantago lanceolata and P. major) and goosefoots (Chenopodiaceae). This may suggest that human activities (e.g. agriculture, trampling) took place close to site 625 (Figs 12B and 13).
Subzone 3b: Subboreal (Bronze Age)
The top of the peat deposits at site 219/220 corresponds to the Bronze Age based on the first occurrence of pollen of beech (cf. Bunnik, Reference Bunnik1999), high values of oak and hazel and the presence of heather (Calluna vulgaris) and cereal pollen grains (inclusive barley, Hordeum). In these uppermost peat deposits slightly higher grass (Poaceae) percentages are recorded. Two radiocarbon dates are present from these levels. At site 217/218 the top was dated at 3115±25 BP (1440–1300 cal yr BC) and at site 219/220 at 3870±25 BP (2465–2235 cal yr BC) (Table 2). The first 14C date agrees well with the palynological (Subboreal) age. The latter is slightly older, which can be related to the dated charcoal pieces that were probably reworked. The high values of alder pollen suggest the local presence of an alder carr at site 219/220.
In the pollen diagram of site 219/220 the Middle Bronze Age is only reflected by one pollen spectrum. The Middle and/or Late Bronze Age, however, are also represented in the deposits of the residual channels of sites 12/13, 565, 625 and 008 (Fig. 12C). At site 625, the Middle (subzone 3b1) to Late Bronze Age (subzone 3b2) is reflected (Fig. 13), while in the pollen diagrams of site 008 the Middle Bronze Age (subzone 3b1, Fig. 14A), and at sites 565 (Fig. 14B) and 12/13 (Fig. 14C) the Late Bronze Age (subzone 3b2), are present. Also in the scanned samples, collected during the coring campaign (Bunnik Reference Bunnik2005b), the Late Bronze Age is reflected at sites 5389 (pit 113) and 435 (pit 102), while in pollen samples (site 5381) from pit 108 (Fig. 2) the Early to Late Bronze Age is present (Fig. 11). The availability of several pollen records distributed over the study area enables a spatial reconstruction of the vegetation over the study area during the Middle and Late Bronze Age (Fig. 12C).
Bronze Age, (A) microfossil diagram of the humic residual channel 008, phase I (Middle Bronze Age), (B) microfossil diagram of the peaty residual channel 565, phase I (Late Bronze Age), and (C) microfossil diagram of residual channel 12/13, phase II (Late Bronze Age).

The pollen samples from the Early and Middle Bronze Age show that the Meuse river valley during this period was still densely forested with mixed deciduous forests. These forests were dominated by oak, but contained less lime and elm than before. On the moist to drier soils, the oak forests had an undergrowth of hazel, (oak) ferns with ivy and hop (Humulus lupulus) climbing in the trees. On forest hedges and in open places in the forests, hazel, bracken and herbs, such as common cow-wheat (Melampyrum pratense) and greater stitchwort (Stellaria holostea), were growing. Although the forests in this period contained less elm, elm trees were still present near site 008, where the tree could expand on the moist and clayey, nutrient-rich soils (Figs 14A and 12C). Further south, in the central-eastern part of the study area, the vegetation near site 625 contained more herbs and heather (Figs 13 and 12C). Lime trees were growing in the forest vege-tation around sites 008 and 625. This suggests that elm and lime were important components in the forest vegetation on the nutrient-rich, clayey soils of the river floodplain in the eastern part of the study area. In the wetter, southern part, hardly any lime trees were present (Fig. 10).
During this period, some pine trees remained present on the higher, sandy, gravelly soils of the Meuse terraces. Especially around site 008, some pines were probably present on the sand dunes and sandy and gravelly terraces, east of the study area.
From the Middle to Late Bronze Age the study area became more open as human impact increased and forests thinned. On the higher parts of the river terraces, open places were created in the forests for agricultural fields, meadows and settlement areas. During the Late Bronze Age, beech immigrated into the forests on the higher and drier areas and loess plateaus of the Meuse river valley, often at the cost of the natural lime forests. According to Bakels (Reference Bakels2009), beech was able to take the place of lime when lime forests suffered too much from human actions. Also around Lomm, the amount of lime trees decreased in the forests during the Late Bronze Age.
Natural forest vegetation was affected more in the north than the south of the study area. Small-scale cereal fields were probably present in the northeast of the study area north of site 565 (Figs 14B and 12C). It is unknown which cereals were grown at Lomm at that time. In the northeastern, northwestern and central part, more disturbed and bare ground became available where pioneers and ruderals could grow. Around site 625 (Figs 12C and 13), plants such as hogweed (Heracleum sphondylium) and fireweed (Chamerion angustifolium) developed. Fireweed can be a pioneer in localities where the (forest) vegetation is burned or cut down (van der Hammen, Reference van der Hammen1951; van Geel et al., Reference van Geel, Bohncke and Dee1981). Its presence may also indicate fireplaces in the study area. In the western part around site 12/13 (Figs 12C and 14C), vegetation with bracken (Pteridium aquilinum) developed. Bracken can also colonise disturbed areas where vegetation was recently cut or burned down. The occurrence of fires in the study area during this period was also documented in the peat deposits at sites 217/218 and 219/220 (Figs 10 and 12C). At these locations, part of the upper layer of peat vegetation was burned down during the Late Bronze Age.
On the wetter soils, in residual channels and in the southern part of the study area, forests remained present with willow and alder. Further south in our study area (site 435, pit 102; Bunnik, Reference Bunnik2005b) deciduous forests were present during this period, with oak, lime and hazel, and, on the wetter soils, alder.
During the Late Bronze Age, livestock grazing probably also caused the forests in the northern and central part of the study area to become more open near sites 625, 12/13 and pit 113 (Figs 12C, 13 and 14C). At these localities, the higher Poaceae (grass) pollen values indicate that some forest vegetation was replaced by meadows. The increase in vegetation with bracken at site 12/13 may also be related to the grazing of livestock in the forests at this location (cf. Behre, Reference Behre1986).
Zone 4: Subatlantic (Iron Age – Middle Ages)
The Subatlantic biozone can be further subdivided into three subzones. Subzone 4a reflects the Iron Age, subzone 4b the Roman period and subzone 4c the Middle Ages. The Iron Age (subzone 4a) is not represented in deposits of the residual channel at site 219/220 (Fig. 10). This is due to a hiatus of about 1000 years that is present between the top of the peat deposits and the overlying orange gyttja. The following Subatlantic subzones (subzone 4b, Early Roman period and subzone 4c, Middle Ages) are recorded again in the sediments at site 219/220 (Fig. 10). At this location, an orange gyttja was deposited in a shallow aquatic environment during both the Roman period and Middle Ages. The reappearance of algae (e.g. Botryococcus braunii and T.128, an unidentified algal taxon) suggests deposition in a shallow aquatic environment. The orange colour of the gyttja was caused by the presence of siderite that was formed by oxidation due to low groundwater levels. The increase in the diversity of semi-aquatic plants (e.g. Salix (willow), burreed (Sparganium), bulrush (Typha angustifolia), purple loosestrife (Lythrum salicaria)) in the upper pollen sample, however, suggests a slight drop in the groundwater level during the Middle Ages.
Subzone 4a: Subatlantic (Iron Age)
Due to a hiatus, the Iron Age is not represented in deposits of the residual channel at site 219/220. The Early Iron Age, however, is present in the pollen samples of a water well (518; Figs 12D and 15). The water well was excavated in the west of the study area, and dating was based on its pottery content (c. 700 cal yr BC) and on a radiocarbon date of a wooden pole at the base of the well (2540±35 BP, 800–450 cal yr BC) (Table 2).
Iron Age, microfossil diagram of the water well 518/528 (Early Iron Age).

In the two analysed pollen samples (Fig. 15), pollen of oak and hazel is present in high values, while oak remains dominant. However, slightly lower total AP percentages were recorded than in the previous periods. Furthermore, NAP values have increased and pollen of typical anthropogenic indicators such as cereals, narrow-leaf plantain (Plantago lanceolata) and mugwort (Artemisia) are present. The pollen assemblage with high AP values of oak and hazel, relatively low values of beech and presence of pollen with typical anthropogenic indicators corresponds well to the age indicated by the pottery and radiocarbon dating.
In the sediments of the water well, high values of bracken spores are recorded. This indicates that bracken, which was already growing near this location during the Late Bronze Age (cf. site 12/13; Figs 12C and 14C), also remained present during the Early Iron Age (Fig. 12D). It may also suggest that cattle grazing occurred in the nearby woodlands (Behre, Reference Behre1986).
During the Iron Age, vegetation in the Meuse river valley still consisted of mixed deciduous forests with oak as the dominant tree. Beech expanded on the loess plateau and on the higher grounds of the Meuse river valley. Due to cattle grazing, forests probably became more open during the Iron Age, and meadows and trampled areas with narrow leaf plantain and pigweed (Polygonum aviculare) extended in area. Furthermore, open places were created in the forests for settlement areas and arable fields where cereals were grown. Although these woodlands were slightly more open than during the Bronze Age, in comparison to other river areas in the Netherlands they remained relatively densely forested.
Some macroremain samples from the Iron Age (from phases I, II and III; Table 3) were analysed that provided information about what was eaten and cultivated during this period. In the Lomm area, common cereals for the Iron Age (cf. Bakels, Reference Bakels and Zeven1997), such as emmer wheat (Triticum dicoccum) and barley (Hordeum vulgare), were probably grown. Furthermore, fragments were found of einkorn wheat-type (Triticum cf. monococcum-type, probably top spikes of emmerwheat), wild or common oat (Avena) and pea (Pisum) or lentil (Lens). Agricultural herbs, such as melde (Chenopodium album), sheep's sorrel (Rumex acetosella), corn buttercup (Ranunculus arvensis), rye brome (Bromus secalinus), wild buckwheat (Fallopia convolvulus), pale persicaria (Persicaria lapathifolia), German knotweed (Scleranthus anuus), corn spurrey (Spergula arvensis), fool's parsley (Aethusa cynapium) and lentil vetch (Vicia tetrasperma) (Table 3; Fig. 15) that were recorded in the pollen and macrofossil samples indicate that these crops were cultivated on soils with a moderate to high nutrient availability. Also found was pollen of rye (Secale cereale), which was probably still an agricultural herb during this period (Van Zeist Reference van Zeist1976; Behre, Reference Behre1992).
Subzone 4a: Subatlantic (Roman period)
The pollen assemblage of the lower sample (1442cma.s.l.) collected from the orange gyttjas at site 219/220 represents the Early Roman period and is characterised by an increase in values of NAP, cereals and grasses, while taxa such as beech, hornbeam (Carpinus betulus) and walnut (Juglans regia) are present. The appearance of walnut is clearly associated with the Roman period. Walnut is not a native tree in the Netherlands (cf. Bakels, Reference Bunnik1999), but, like the sweet chestnut tree (Castanea sativa), a Roman introduction. Oak and hazel are subdominant in the arboreal pollen assemblage. Pollen of lime, birch and ash remain present in low values. Amongst the herbs, diversity increases at this site as more taxa appear, such as sheep's sorrel, spurrey (Spergula), narrow-leaf plantain and various goosefoots, composites and crucifers that are associated with agriculture, grazing and settlements. The dominance of oak and hazel combined with the presence of walnut, beech and hornbeam and various anthropogenic herbs clearly indicates a Roman age for these deposits.
The increase in grasses and records of herbaceous taxa such as meadow/creeping buttercup (Ranunculus acris/repens), ragged-robin (Silene flos-cuculi), bladder campion (Silene vulgaris), lesser stitchwort (Stellaria graminea), devil's-bit scabious (Succisa pratensis), common/rough meadow-grass (Poa pratensis/trivialis) and bellflower (Campanula-type) in both the pollen and macrofossil data dating to this period (Figs 10, 16A and B; Table 3) is related to the expansion of meadows at the cost of the alder carr woodlands in the residual channels.
Roman period, (A) microfossil diagram of the water hole (629) (Early Roman period, phase I), (B) microfossil diagram of the water well (702) (Early Roman period, phase I).

The Early Roman period is also reflected in the infills of a water well (702; Fig. 16B) and water hole (629; Fig. 16A) from the north of the study area (Fig. 11E). These pollen samples date to the first to second century and show very low values of arboreal pollen and higher values of cereals, NAP, heather and grasses. The values of NAP, cereals, heather and grasses at these sites, however, are much higher than in the deposits of the residual channel at site 219/220 and most likely reflect local differences in vegetation between the northern and southern parts of the study area (Fig. 11E). The relatively high AP values at site 219/220 were also recorded in a pollen sample (site 5381) from the southern part of the study area that was scanned during the coring campaign (pit 108; Fig. 11E; Bunnik, Reference Bunnik2005b). Both sites show very low NAP values and suggest the presence of dense forests in the south of the study area.
This indicates that during the Early Roman period, in contrast to the north of the study area, the south was still forested. These southern forests consisted mainly of oak and hazel, with some elm and lime. On the wetter soils in the south of the study area, alder carr forests were present, while beech remained present in the woodlands on the higher terraces of the landscape.
The north of the study area, where the water well (702) and water hole (629) were also situated, was already quite open during the Roman period, which is not surprising for a locality where all kinds of human activities (habitation, agriculture, cattle breeding and trampling) took place (Fig. 11E). During this period, the natural forest vegetation that was still largely present during the Bronze Age and Iron Age in the north, had partly disappeared through deforestation and was replaced by agricultural fields, meadows and heather. Agriculture was taking place at a large scale and the fields were possibly fertilised. Records of smooth hornwort (Phaeoceros laevis) and field hornworts (Anthoceros punctatus) furthermore suggest that the agricultural fields lay fallow for part of the year (Koelbloed & Kroeze, Reference Koelbloed and Kroeze1965). Also cereal cultivation must have been concentrated in this northern part. The high values of cereal pollen in the diagrams of the water well (702) and water hole (629) suggest that during the Early Roman period cereals were locally grown in this area (Fig. 11E). It is unknown which cereal species were grown, as no identifiable cereals were found in the analysed macrofossil samples (Table 3). Agricultural herbs (such as melde, sheep's sorrel, wild buckwheat, pale persicaria, hemp-nettle (Galeopsis bifida/speciosa/tetrahit), corn spurrey, black nightshade (Solanum nigrum), narrowleaf hawksbeard (Crepis tectorum), common chickweed (Stellaria media), dwarf nettle (Urtica urens), hairy buttercup (Ranunculus sardous) and field penny-cress (Thlaspi arvense)) that were recorded, however, indicate that the arable fields were probably located on soils both with a moderate and high nutrient availability. On abandoned fields and nutrient-poor soils, heath and grass vegetation could develop.
In the pollen samples of the water well (702, Fig. 16B) furthermore, pollen of sweet chestnut and flax (Linum usitatissumum) were recorded, while in one of the analysed macroremain samples (site 805; Table 3) an uncharred flower of common millet (Panicum miliaceum) and stones of berry (Rubus) were found. Flax, common millet, walnut and sweet chestnut were probably locally grown in the area, while fruits of berry were gathered. The Romans, however, must have introduced sweet chestnut and walnut in the Lomm area. Based on pollen records we know that walnut and sweet chestnut trees were present in the Dutch landscape.
During the Early Roman period, there are also indications for the presence of livestock (large herbivores such as cows) and trampling in the north of the study area. Records of melde (Table 3) and spores of coprophilous fungi (e.g. Podospora-type, Cercophora-type, Sporormiella-type and Sordaria-type; Figs 16A and B), which grow on herbivore dung (Van Geel et al., Reference van Geel, Buurman, Brinkkemper, Schelvis, Aptroot, van Reenen and Hakbijl2003; Baker et al., Reference Baker, Bhagwat and Willis2013), suggest the proximity of livestock and manure piles in the study area. Taxa such as small-leaf and broad-leaf plantain, pigweed, shepherd's-purse (Capsella bursa-pastoris) and common mallow (Malva sylvestris) suggest the presence of trampled and disturbed ground. In the north of the study area, livestock grazing probably took place in meadows on the lower grounds. Here much alder carr vegetation on the lower grounds was replaced by meadows during the Early Roman period. In the southern part, less deforestation took place, meadows were sparser and the area remained rather forested. No evidence for grazing of the forests was found in the south.
In the northern part, however, there were also spatial differences in the openness of the vegetation. The water hole (629) was located at that time on the flanks of a higher ridge in the landscape. The relatively higher pollen values of beech, oak and hazel recorded are likely a reflection of the vegetation on this higher ridge. In the east, the residual channel 008 was situated, which during Roman times was already partly filled in. The water well (702) was located further west, close to a channel in which during the Roman period open water was still available. The higher alder pollen values in the sediments of the water hole (629) are probably a reflection of an alder carr vegetation that was present in residual channel 008 at that time. This carr vegetation came into existence in the residual channel during the Middle Bronze Age and continued to be present during the Early Roman period.
Zone 4c and 4d: Subatlantic (Middle Ages and Modern times)
The upper pollen sample (1448cma.s.l.) collected from the orange gyttjas at site 219/220 represents the Middle Ages (subzone 4c). The pollen spectrum is still characterised by a dominance of oak pollen. The AP percentages are decreased, mainly because of a decline in the values of hazel, lime and elm pollen. Shade-tolerant trees such as beech and hornbeam, however, seem to be slightly more abundant. In comparison to the previous subzone, the values of NAP, cereals, grasses and heather have further increased. Pollen is present of various cereal taxa such as rye, barley and wheat, and other crops like broad bean (Vicia faba) and buckwheat (Fagopyrum esculentum). The diversity of herbs has also increased: more agricultural herbs appear, such as common poppy (Papaver rhoeas type), cornflower (Centaurea cyanus) and corn spurrey that are associated with the cultivation of these cereals. The combined presence of rye, buckwheat and cornflower suggests that the sample dates in the Late Middle Ages, AD c. 1200–1300 (van Haaster & Brinkkemper, Reference van Haaster and Brinkkemper1995). The increase in grasses and presence of pigweed, common plantain and white clover type (Trifolium repens-type) are probably associated with an extension in the area of meadows that were used for hay harvesting and/or grazing.
The Middle Ages (subzone 4c) are also reflected in pollen samples that were scanned during the initial coring campaign (pits 102, 108 and 113; Figs 2, 11 and 12E; Bunnik, Reference Bunnik2005b). The top sample (site 5381) from pit 108 contains pollen of walnut and hornbeam, grasses, cereals and anthropogenic herbs, while pollen of beech is dominant. Furthermore high values of oak and alder and some hazel and birch are present, while NAP values are <5%. The high values of beech are typical for forest regeneration in the loess area and date the sample after the Roman period, in the fifth to sixth century AD, i.e. Early Middle Ages (Bunnik, Reference Bunnik2005b).
The pollen samples (site 435) from pit 102 in the far south and pit 113 (site 5388; 37.5 and 12.5cm) in the central part of the study area (Fig. 2) reflect the High Middle Ages (after AD 1000) and show high values of NAP, cereals such as rye, grasses and other herbaceous taxa, heather and agricultural herbs such as cornflower, corn cockle (Agrostemma githago) and German knotweed (Bunnik, Reference Bunnik2005b). Trees and shrubs such as beech, hornbeam, alder and hazel dominate the AP. In the top sample (site 5388; 12.5cm) from pit 113 (Fig. 2), trees have almost disappeared, while pollen of rye reaches high values.
From the Middle Ages also some macrofossil samples from charcoal pits (479, 535; Table 3) were scanned; they, however, only revealed large amounts of charcoal, no seeds or fruits.
In another sample (site 5387) from pit 113, low arboreal pollen values are recorded but pine values are rather high. Furthermore, walnut, buckwheat and high values of rye are recorded. Buckwheat played an important role in the agriculture on the nutrient-poor soils between AD c.1500 and 1920. The high pine values suggest that the sample represents the period after AD c. 1900, i.e. subzone 4d (Bunnik, Reference Bunnik2005b).
The pollen sample (5381, pit 108; Bunnik Reference Bunnik2005b) from the Early Middle Ages (subzone 4c) suggests that during the fifth to sixth century AD, forest regeneration with beech occurred in the surrounding loess area, probably as a result of a decline in the human population density (cf. Bunnik, Reference Bunnik1999). In the study area, however, some agricultural fields and meadows remained present. In the southern part of the study area open forests with oak, hazel and birch were present, with on the wetter soils some meadows and open fern-rich alder carrs. Alder carr vegetation expanded again during this period.
During the High to Late Middle Ages (subzone 4c), large-scale deforestations continued and in the northern and central part of the study area most natural forests are replaced by meadows, arable fields and heathlands. On the fields, cereals such as rye, broad bean and later also buckwheat were cultivated. Agricultural herbs, such as cornflower, corn cockle and corn spurrey, suggest that rye was cultivated as winter cereal (e.g. Pals & van Geel, Reference Pals and van Geel1976). In the southern part of the study area some forest patches with oak, hazel and birch remained present, with on the wetter soils, meadows and open fern-rich alder carrs (Fig. 12E).
From AD c. 1900 (subzone 4d) onwards pine plantations occurred in Limburg on a large scale (Bunnik, Reference Bunnik2005b). Forests had almost completely disappeared and arable fields and heathlands were present. Rye and buckwheat were cultivated on the fields.
Palaeoenvironmental reconstruction in relation to human occupation
Based on the information gathered from the lithological cross-sections, OSL, 14C AMS and dendrochronological dates, grain-size analysis and palynological research, a palaeoenvironmental reconstruction from the end of the Late-glacial and Holocene was made for the Lomm area (Fig. 17; Bos et al., Reference Bos, Zuidhoff, van Kappel and Gerrets2012). From time periods that were not represented in the Lomm pollen data, other studies in the Meuse valley and surroundings were used to gather information about the regional vegetation development (Bunnik, Reference Bunnik2005a, Reference Bunnikb; Bos et al., Reference Bos, van der Plicht, van Geel and Bohncke2007; Janssens, Reference Janssens2011).
Schematic cross-section through the study area showing the landscape evolution during the end of the Late-glacial and the Holocene.

Younger Dryas (Palaeolithic)
During the Younger Dryas the river Meuse was a braided river with minor overbank deposition and very sandy and gravelly channel deposits. During the second part of the Younger Dryas the climate became slightly warmer and drier and river activity decreased (e.g. Kasse et al., Reference Kasse, Vandenberghe and Bohncke1995; Isarin and Bohncke, Reference Isarin and Bohncke1999; Hoek & Bohncke, Reference Hoek and Bohncke2002). Due to the warmer and drier climate, aeolian activity increased and dune formation occurred (cf. Bohncke et al., Reference Bohncke, Vandenberghe and Huijzer1993; Kasse, Reference Kasse and Schirmer1999). Especially on the east bank of the Meuse valley, large dune complexes were formed resulting in a 4km wide extensive sand-sheet belt with parabolic dunes, lying on older river terraces. Not only on the older terraces but also at the braided river terrace itself small dunes developed. In this period the vegetation changed from open birch–pine forests that were present during the previous Allerød, to an open, herbaceous vegetation with dwarf shrubs (Blerick-Koelbroek: J.A.A. Bos, unpublished report, 1992; site 436, pit 102: Bunnik, Reference Bunnik2005b). No indications of human presence were found in the study area.
Preboreal–Boreal (Mesolithic)
Due to warming at the start of the Holocene, the vegetation cover increased and soils stabilised. As a result of the warmer climate three channels of the braided river system were deepened. Later, the river Meuse changed towards a meandering pattern and the river discharge concentrated in one main channel (i.e. the most westerly in the study area). The other previously deepened channels were abandoned and filled in with clay. In the northwestern part of the study area the river migrated to the west and a new meander belt was created. These Early Holocene channel belts are found at several places in the north of the Meuse valley and are often small (Zuidhoff et al., Reference Zuidhoff, Huizer and de Jonge2012; Zuidhoff & Bos, Reference Zuidhoff, Bos, Bouma and Müller2014; Zuidhoff & Huizer, Reference Zuidhoff and Huizer2015). Due to the warmer and wetter climate, birch expanded at the start of the Preboreal, and birch forests were formed in which later also poplar (Populus) and pine reappeared (Blerick-Koelbroek: Bos, unpublished report, 1992; site 436, pit 102: Bunnik, Reference Bunnik2005b). During this period, pine was growing on the drier sand dunes and the higher terraces of the Meuse valley. From the Boreal onwards, dense forests of deciduous trees developed, initially with hazel but later also with oak, elm and lime. On the higher terraces pine remained present. Some pine woodlands are also present today just north of Lomm. Also near Well–Aijen, c. 20km north of Lomm, a similar distribution of the vegetation was present on the terraces and in the Meuse valley (Bos & Zuidhoff, Reference Bos and Zuidhoff2015).
The first signs of human occupation during this period were found in the form of flint artefacts (Gerrets & Williams, Reference Gerrets and Williams2011). These traces, however, were not in situ and it is uncertain which activities were carried out. Certainly the area was of interest for hunting activities. In the Meuse valley to the north, near Well–Aijen, several Mesolithic sites were recovered on the higher levels of the Early Holocene meander belts (Tichelman, Reference Tichelman2005; Kimenai & Mooren, Reference Kimenai and Mooren2014).
Atlantic (Mesolithic–Neolithic)
During the Atlantic period the residual channels were still filling in with sediments, and peat formation started in the largest residual channel. On the lower parts of the Lomm terrace, alder carrs started to form in the abandoned residual channels. Also in other residual channels in the Meuse valley that were abandoned in the Early Holocene, alder settled during this period (e.g. Teunissen, Reference Teunissen1990; Blokker, Reference Blokker2013; Otten, Reference Otten2013).
On the river terraces near Lomm and Well–Aijen (Bos & Zuidhoff, Reference Bos and Zuidhoff2015), mixed deciduous forests were present with oak, elm and ash. Oak was the dominant tree in these forests, with hazel, mistletoe, ivy and ferns in the undergrowth and bracken on forest edges. The forests on the moist soils in the southern part of the Lomm study area probably contained more elm and less lime. Lime was growing in the forests on the higher soils with a moderate nutrient availability in the northeast of the study area and on the higher terraces of the Meuse river valley (cf. Bakels, Reference Bakels2017). Pine remained the dominant tree on the higher sandy terraces.
In the north of the study area, some open places were present in the forests where heather and pioneer vegetation were growing. These could be reflections of human interference in the landscape. No cereals were found, however, and, despite the find of a pottery fragment from the Middle and Late Neolithic (Gerrets & Williams, Reference Gerrets and Williams2011), it is uncertain whether people were living in the area at that time.
Subboreal (Neolithic – Bronze Age)
During the Subboreal, terrestrialisation of the residual channels continued and infilling slowly completed. These areas, however, were relatively low, wet places. During this period, there is no sedimentation on the river terrace. During the Neolithic, the role of elm and lime in the mixed deciduous forests started to decrease. Elm was especially affected on the moister soils in the south of the study area, while the number of lime trees decreased in the forests on the higher grounds in the northeast and higher terraces of the Meuse valley. Neolithic people probably used twigs and branches of trees (such as ash, elm, lime and hazel) as winter food for cattle (Bunnik, Reference Bunnik2005a). The presence of the Neolithic farmers in the area is also confirmed by finds of anthropogenic indicators in the pollen data. The human activities (e.g. agriculture, trampling) probably took place in the east of the study area, close to site 625.
During the Early and Middle Bronze Age, the Meuse river valley was still densely forested with mixed deciduous forests. On the moist to dry soils, forests were dominated by oak and had undergrowth of hazel and (oak) ferns while ivy and hop also climbed the trees. The forests contained less lime and elm than before, but elm and lime remained important components in the forest vegetation on the nutrient-rich, clayey soils of the river floodplain in the eastern part of the study area. For example, elm trees were present near site 008, while lime trees were growing in the forest vegetation around sites 008 and 625. In the wetter, southern part of the study area, lime trees were hardly present.
Along forest edges and in open places in the forests, hazel, bracken and herbs such as common cow-wheat and greater stitchwort were also growing. Pine trees remained present on the higher, sandy, gravelly soils of the Meuse terraces. Especially around site 008, some pines were probably present on the sand dunes and sandy and gravelly terraces, east of the study area. In the central-eastern part of the study area, near site 625, the vegetation was slightly more open with more herbs and heather. This was probably related to human activities near that site during the Neolithic (see above).
Beech immigrated during the Late Bronze Age into the forests on the higher and drier areas and loess plateaus of the Meuse river valley, often at the cost of the natural lime forests and especially where the lime forests had already suffered from human actions (Bunnik, Reference Bunnik1999; Bakels, Reference Bakels2009). In the Meuse river valley near Lomm, human impact increased during the Late Bronze Age. On the higher parts of the terraces open places were created in the forests for agricultural fields and meadows. The natural forest vegetation was affected more in the north than the south of the study area. Small-scale cereal fields were probably present in the northeast of the study area north of site 565. During this period, near Well–Aijen, forests became more open due to human activities (Bos & Zuidhoff, Reference Bos and Zuidhoff2015). Within both the Lomm and Well–Aijen areas, however, there were spatial variations in the composition of the forest vegetation and openness of the landscape. The composition of the forest vegetation in both areas was closely related to the geomorphology of the area. The spatial variation in openness of the landscape came into existence during the Late Bronze Age, as soon as people started to use the higher areas for human activities (i.e. habitation, agriculture and livestock herding).
Despite the signs of human occupation in the pollen data, only three graves were recovered dating to this period (Gerrets & Williams, Reference Gerrets and Williams2011). In the area of Well–Aijen a remarkable shift is visible as the location of the Late Bronze Age settlements changed from the Early Holocene meander belt to the higher Younger Dryas terrace (Bouma & Müller, Reference Bouma and Müller2014). This suggests that the Holocene terrace near the present river was abandoned after the Bronze Age because of regular floods. At Lomm, no indications for floods were found. The residual channels were still filling in with clay and peat, and alder carr vegetation was present.
Subatlantic (Iron Age)
In the Iron Age, peat formation in the main residual channel ceased and sedimentation did not start until the end of the Iron Age when a gyttja layer began to form in the peaty residual channel at site 219/220 (Figs 2 and 7). The gytjja layer is likely the result of higher groundwater levels due to wetter conditions caused by an abrupt change from a relatively warm and continental climate to cooler and wetter conditions (van Geel et al., Reference van Geel, Buurman and Waterbolk1996, Reference van Geel, van der Plicht, Kilian, Klaver, Kouwenberg, Renssen, Reynaud-Farrera and Waterbolk1998). Also the increase in deforestation and human agriculture near Lomm and in the hinterland during this period may have caused instability of the soils and an increase in surface erosion. At the higher parts of the river terrace, however, no noticeable sedimentation occurred. In other areas in the northern Meuse valley new channel belts were formed during this period (Zuidhoff & Huizer, Reference Zuidhoff and Huizer2015).
At that time, the vegetation in the Meuse river valley still consisted of deciduous forests dominated by oak. In the study area, human activities (e.g. agriculture, grazing and building of settlements) increased and forests became more open. In the more northerly-located Well–Aijen and Boxmeer areas, human activities also strongly increased during the Iron Age (Bos & Zuidhoff, Reference Bos and Zuidhoff2015; Zuidhoff & Hulzer, Reference Zuidhoff and Huizer2015). Open places were created in the forests for arable fields where cereals, such as emmer, wheat and barley, were grown. From excavations near Well–Aijen it is known that common millet, oat, camelina, pea or lentil and broad bean were probably also consumed during this period (van Haaster & van Rijn Reference van Haaster and van Rijn2005; ter Wal & Tebbens Reference ter Wal and Tebbens2012; Bos & Zuidhoff, Reference Bos and Zuidhoff2015).
Cattle grazing took place in the forests in the lower parts of the study area and meadows extended. Although the forests were slightly more open than during the Late Bronze Age, compared to other river areas in the Netherlands they remained relatively closed. Beech expanded on the loess plateau and also at the higher grounds of the Meuse river valley.
During the Iron Age the occupation of the Lomm area further increased, as was reflected in the construction of a large number of granaries (Gerrets & Williams, Reference Gerrets and Williams2011). Despite the number of granaries, only one farmstead from the Early Iron Age was found in the north of the area (Prangsma, Reference Prangsma2008). During the Middle Iron Age a cemetery and impressive rectangular cult place was built, situated in the lower area very close to the active Meuse river (Fig. 9). Some of the small buildings that were found were probably also connected to the cult place and may have been used for ritual actions (Simons, Reference Simons, Stobbe and Tegtmeier2012). It is remarkable that the cult place was built on top of the sediments of a residual channel. The proximity to the river Meuse was evidently more important than a high and dry location in the landscape.
Subatlantic (Roman period)
The Roman period is characterised by a change in habitation and land use. The region was intensively occupied and agricultural fields and meadows replaced the forests on the uplands of the loess plateau and in the Meuse valley itself. The change in vegetation and use of the hinterland caused a higher flood frequency and induced regu-lar flooding of the study area. These floods resulted in an increase in the sedimentation rate on the Younger Dryas terrace during the Roman period (cf. Kimenai & Mooren, Reference Kimenai and Mooren2014). This increase in sedimentation triggered by human cultivation and deforestation is also known from other large river systems such as the Rhine (Bos et al., Reference Bos, Dambeck, Kalis, Schweizer and Thiemeyer2008b, Reference Bos, Dambeck and Bouman2012; Erkens et al., Reference Erkens, Dambeck, Volleberg, Gouw-Bouman, Bos, Cohen, Wallinga and Hoek2009) and is also calculated by different models (Erkens et al., Reference Erkens, Kohen, Gouw, Middelkoop and Hoek2006; Ward et al., Reference Ward, Renssen, Aerts, van Balen and Vandenberghe2008). In these studies, however, an increase in sedimentation rate is documented since the Bronze Age, while at Lomm the change in sedimentation rate occurred no earlier than the Roman period.
The change in vegetation in the Meuse valley during the Roman period differs from that at the loess plateau. In the hinterland, the change in vegetation occurs gradually from a forested to a more open landscape (cf. Bunnik, Reference Bunnik1999). At Lomm the change seems to be more abrupt, although it must be noted that palynological data are only present from one Iron Age location. The natural forests, which were still present during the Bronze Age and Iron Age in the north of the study area had largely disappeared during the Roman period and were replaced by cereal fields, meadows and heathland. Cultivation of cereals was taking place in this northern area at a large scale and the fields were possibly fertilised and lay fallow for part of the year. It is unknown which cereals were grown, as no identifiable macrofossils were found. The arable fields were probably located on soils both with a moderate and high nutrient availability. On abandoned fields and nutrient-poor soils, heath and grass vegetation developed. Flax, common millet, walnut and sweet chestnut were also grown in the area, while fruits of berry were gathered. The Romans introduced sweet chestnut and walnut into the Lomm area. In the northern area, grazing of livestock probably also took place in meadows on the lower grounds, and much alder carr vegetation on the lower grounds was replaced by meadows.
During the Roman period the south of the study area was still forested with mainly oak and hazel and some lime and elm trees. Less deforestation took place here and meadows were sparse. No evidence for grazing of the forests was found in the south. On the wetter soils in the south, alder carr forests were present in the residual channels, while beech formed an important component of the woodlands on the higher terraces of the landscape and southern loess area.
In contrast to the large changes in vegetation during this period, the occupation of the area seems to proceed more gradually. The cemetery that came into use during the Middle Iron Age continued to be used until the Roman period. Moreover, from the Roman period only a few traces of human occupation were found: one water well, a water hole, a granary and a farmstead (Prangsma, Reference Prangsma2008). Adjacent to the southern part of the study area, however, two settlements were found that provided more evidence for Roman occupation of the area (Verhoeven & Schutte, Reference Verhoeven and Schutte2004).
Middle Ages
During the Middle Ages, sedimentation on the river terraces continued. In other areas in the northern Meuse valley, new channel belts were formed between AD 1000 and 1400 (Zuidhoff & Huizer, Reference Zuidhoff and Huizer2015). In the Early Middle Ages (AD 450–1050) reforestation with beech occurred in the forests of the surrounding loess area, while in the residual channels alder carr vegetation expanded again. This was probably a reflection of the regeneration of these forests as a result of a decline in human population density (cf. loess area in Bunnik, Reference Bunnik1999; Bakels, Reference Bakels2009). There is still some evidence, however, for the presence of fields and meadows in the area. During the seventh and eighth centuries human activity increased again on the higher terraces east of Lomm. There is little evidence for human occupation of the study area. The only finds are 16 pits with a large amount of charcoal, indicating iron production, dating between the seventh and thirteenth centuries (Gerrets & de Leeuwe, Reference Gerrets and de Leeuwe2011).
During the High to Late Middle Ages, large-scale deforestations took place in the northern and central part of the study area, and most natural forests were replaced by meadows, arable fields and heathlands. On the fields, cereals such as rye, buckwheat and broad bean were cultivated. In the southern part some forest patches with oak, hazel and birch remained present with, on the wetter soils, meadows and open fern-rich alder carrs. The village of Lomm, situated outside the study area, was probably established in the 13th century, becoming an important town in the 14th century (Gerrets & de Leeuwe, Reference Gerrets and de Leeuwe2011). In the north of the study area a water mill was built in the 14th century, to drain the arable land (Mulder, Reference Mulder2002).
Modern times
After the Middle Ages a large increase in sediment supply resulted in a rapid and large increase in sedimentation rate in the study area between the 14th and 18th centuries. The sedimentation continued until the present time: the youngest OSL dates are covered by 50–100cm of sediments and sedimentation is observed in the study area after large floods in the 20th century (Jongmans & Miedema, Reference Jongmans and Miedema1986). The canalisation of parts of the Meuse between 1883 and 1980, however, prevented sediment deposition on the floodplains (Lemin et al., Reference Lemin, Koch, Hurtgen and Pissart1987). Moreover, the sedimentation rate can be reduced after 1880 due to a change from crop cultivation to grasslands (Cremer et al., Reference Cremer, Bunnik, Donders, Hoek, Kollen-Eekhout, Koolmees and Lavooi2010). This leads to reduced clastic input compared to arable fields that are seasonally ploughed exposing bare soil. It is, however, difficult to prove this possible decrease in sedimentation rate in the study area because of homogenisation of the top soil by ploughing, making OSL dating complicated.
The modern time is characterised by open landscape where cultivation of rye and buckwheat occurred and heathlands could expand. After 1900 pine was planted on a large scale on the higher terraces. In the study area no farmhouses were present at that time. During the last years of World War II, trenches were dug by soldiers, when the Meuse formed the front line.
Conclusions
-
1. In this paper the sedimentation and vegetation history of a buried river terrace of the Meuse during the Holocene was reconstructed, using a multidisciplinary approach including geomorphological (i.e. lidar data, grain-size), micromorphological and botanical (i.e. pollen- and macrofossil) analyses and AMS 14C, OSL and dendrochronological dating.
-
2. During the Early Holocene the Meuse river deepened the former braided river channels, followed by a short migration of the channel belt. Until the Roman period the river was in an equilibrium flow. In this period, sedimentation began as a result of deforestation by man. A rapid and large increase in sedimentation rate occurred after the Middle Ages.
-
3. The distribution of the archaeological remains shows that there was a strong interaction between people and their physical environment. During the Holocene, the terraces of the Meuse river provided favourable conditions for human occupation due to the fertile soils and proximity to the river as a water source and as an important traffic way. Also the Lomm terrace formed an excellent location for habitation as, due to the higher location, it was only occasionally flooded.
-
4. Based on the botanical data (pollen and macrofossils) the vegetation in the Lomm area was reconstructed for a large part of the Holocene. The reconstruction showed that in contrast to the loess plateau, the Lomm area was largely covered with forests until the Early Roman period. Due to human activities from the Late Bronze Age onwards, forests in this area slowly became more open, yet remained relatively dense until the Roman period, compared to other Dutch areas.
-
5. The botanical data furthermore showed that within the Lomm area, there were spatial differences in the distribution and openness of the vegetation. The distribution and composition of the forest vegetation was closely related to the geomorphology of the area. The spatial variation in openness appeared during the Late Bronze Age, as soon as people started to use the higher areas for human activities (i.e. habitation, agriculture and livestock herding). Due to human activities, the northern area became very open during the Early Roman period. In the lower southern area, forests remained present much longer, until the Early Middle Ages.
Acknowledgements
We are very grateful to all the people who participated in the fieldwork and especially the senior archaeologists: Danny Gerrets, Nienke Prangsma, Sander Hakvoort and Gavin Williams. We would also like to thank Marjolein Gouw-Bouman for some of the pollen analyses and Cornelie Moolhuizen for the identification of the macrofossils. We gratefully acknowledge Piet van der Gauw, Angela Simons and Bert Groenewoudt for advice during the fieldwork and comments on the archaeological report of the different campaigns. We would also like to thank Bas van Geel and Frans Bunnik for constructive comments on an earlier version of this paper.


