


Introduction
Climate change is an inevitable reality, with its consequences increasingly evident in natural disasters that affect ecosystems and people’s quality of life (IPCC, Reference Lee and Romero2023; Cianconi et al., Reference Cianconi, Betrò and Janiri2020). While much attention has been given to physical health, the psychological impacts, especially on mental health, are growing at an alarming rate (Clayton & Swim, Reference Clayton, Swim, Schneiderman, Revenson, Abraído-Lanza, Smith, Anderson, Antoni and Penedo2025; Romanello et al., Reference Romanello, McGushin, Di Napoli, Drummond, Hughes, Jamart, Kennard, Lampard, Solano Rodriguez, Arnell, Ayeb-Karlsson, Belesova, Cai, Campbell-Lendrum, Capstick, Chambers, Chu, Ciampi, Dalin and Hamilton2021; Stanley et al., Reference Stanley, Hogg, Leviston and Walker2021). One prominent construct capturing this phenomenon is “eco-anxiety,” defined as “a generalized sense that the ecological foundations of existence are in the process of collapse” (Albrecht, Reference Albrecht, Kahn and Hasbach2012, p. 249) or as “a chronic fear of environmental doom” (APA, 2017, p. 68). This anxiety is fueled by multiple factors: uncertainty about the future (Albrecht, Reference Albrecht and Weissbecker2011), constant exposure to environmental crises through digital media (Corner et al., Reference Corner, Roberts, Chiari, Völler, Mayrhuber, Mandl and Monson2015), and the cognitive–emotional overload or “infoxication” that limits people’s ability to process information systematically (Area-Moreira & Ribeiro-Pessoa, Reference Area-Moreira and Ribeiro-Pessoa2012). These elements can trigger emotional responses such as fear for the future generations, anger toward past or present inaction, and helplessness (Moser, Reference Moser, Moser and Dilling2007; Searle & Gow, Reference Searle and Gow2010). Certain populations are more vulnerable to climate-related psychological distress: women, people in geographically at-risk areas, those with low socioeconomic status, and individuals with pre-existing mental health conditions, including children and older adults (Clayton, Reference Clayton2021; Sanandrés Pérez-Loizaga & Rodríguez Rey, Reference Sanandrés Pérez-Loizaga and Rodríguez Rey2022). Research shows that children and adolescents tend to be more aware of and concerned about climate change than adults (Corner et al., Reference Corner, Roberts, Chiari, Völler, Mayrhuber, Mandl and Monson2015; Hickman et al., Reference Hickman, Marks, Pihkala, Clayton, Lewandowski, Mayall, Wray, Mellor and van Susteren2021), as reflected in youth-led movements like Fridays for Future.
Within the broader category of eco-anxiety lies a more specific form known as “Climate Change Anxiety” (CCA). There is a growing consensus about CCA involves a cluster of negative emotions, such as fear, sadness, guilt or helplessness, directly related to climate change (e.g., Clayton, Reference Clayton2018; Chan et al., Reference Chan, Tam and Clayton2024). While anxiety can be a protective response (Barlow, Reference Barlow2002), it becomes problematic when persistent, leading to rumination and emotional dysfunction (Borkovec et al., Reference Borkovec, Alcaine, Behar, Heimberg, Turk and Mennin2004; Comer & Comer, Reference Comer and Comer2024). However, moderate levels of CCA can also be adaptive, fostering awareness and action (Hogg et al., Reference Hogg, Stanley, O’Brien, Watsford and Walker2024; Van Valkengoed & Steg, Reference Van Valkengoed and Steg2024). Empirical studies indicate that knowledge about climate change, direct experience with its impacts, and symptoms of generalized anxiety disorder (GAD) predict higher levels of CCA (Asgarizadeh et al., Reference Asgarizadeh, Gifford and Colborne2023). Exposure to climate change information mediates these relationships. Similarly, Chan et al. (Reference Chan, Tam and Clayton2024) confirmed a model in which experience, perception, and evaluation of climate change determine CCA across cultural contexts (U.S. and China). Another key predictor of CCA is environmental identity, that is, the degree to which individuals integrate nature into their self-concept. Higher environmental identity correlates with greater concern for environmental issues (Clayton, Reference Clayton, Clayton and Opotow2003; Clayton & Karazsia, Reference Clayton and Karazsia2020). Groups such as climate scientists, indigenous populations, and individuals with spiritual or religious connections to nature tend to score higher on environmental identity and thus also show higher CCA (McConnell & Loveless, Reference McConnell and Loveless2018; Pihkala, Reference Pihkala2018).
Although CCA is often associated with general anxiety and depression (Clayton & Karazsia, Reference Clayton and Karazsia2020), some researchers argue that it constitutes a distinct emotional phenomenon (Kurth & Pihkala, Reference Kurth and Pihkala2022). Importantly, these emotional responses, though negative, can have constructive outcomes. They may motivate pro-environmental behavior, increase cognitive engagement, and enhance individual and collective adaptation to climate threats (Clayton, Reference Clayton2020; Crandon et al., Reference Crandon, Scott, Charlson and Thomas2024; Stanley et al., Reference Stanley, Hogg, Leviston and Walker2021). In sum, most researchers on CCA agree on the fact that climate change anxiety is a specific form of eco-anxiety, referring to psychological distress caused by climate-related threats. While it shares characteristics with general anxiety, it is should not be pathologized indiscriminately but understood as an emotional response that, when properly channeled, can contribute to resilience and environmental action (Roberts et al., Reference Roberts, Poortinga and Williams2025).
A Multidimensional Approach to Climate Change Anxiety: A Proposal for Spain
The Metacognitive Model (Wells, Reference Wells2010) focuses on analyzing the role of excessive and recurrent worries as a core mechanism generating anxiety (in our case, anxiety stemming from perceptions of climate change-related consequences). This model distinguishes between two types of worry: worries arising from external or internal situations that are not cognitive in nature (e.g., physical sensations)—Type I—and worries related to the act of worrying itself, which are cognitive (also known as metaworries) or Type II. For example, in the context of CCA, Type I worries would involve recurrent thoughts about the impact of climate change, derived from interpreting available environmental news or observing one’s surroundings (e.g., “Temperatures are rising more than before”). In contrast, Type II (metaworry) in CCA refers to concerns about one’s own climate-related anxiety, reflecting maladaptive beliefs about it (e.g., “I can’t stop thinking about climate change”). These beliefs can involve both positive evaluations (“Worrying about climate change motivates me to take action”) and negative evaluations (“Worrying about climate change is overwhelming me”), influencing the individual’s perceived ability to cope. Negative interpretations of worries (considered uncontrollable and dangerous) are often triggered by “What if…?” thoughts, which can activate positive metacognitive beliefs regarding worry as a valid coping and problem-solving strategy. However, if these metacognitive beliefs shift to negative ones, the person may develop heightened anxiety and negative affects. While this situation can be resolved if the person finds a solution to their concerns, it is more common for the problem to persist (Pérez & Graña, Reference Pérez and Graña2019). Additionally, a selective attention process emerges, focusing on information that confirms and reinforces pre-existing ideas, with a bias toward negative information (e.g., “The future is uncertain” → “There will be more natural disasters”). This process creates a self-reinforcing loop, generating rumination and anxious activation.
Various studies support the notion that anxiety associated with generalized anxiety disorder (GAD) is not a unidimensional phenomenon but can be broken down into at least three interrelated dimensions: cognitive, emotional, and functional impairment. That is, generalized anxiety involves alterations in thought processes and cognitive regulation manifesting as excessive worry, intrusive and recurrent thoughts, and difficulty regulating attention (Comer & Comer, Reference Comer and Comer2024). Moreover, GAD is closely related to the activation of intense emotional responses such as fear, distress, or a sense of insecurity (Barlow, Reference Barlow2002). In fact, experiencing anxiety activates structures of the limbic system, particularly the amygdala. Naturally, the recurrent sense of threat and subjective distress significantly impacts daily functioning, affecting fundamental life areas such as academic, work, and social performance; individuals with GAD struggle with decision making and performing daily activities, often leading to avoidance behaviors or paralysis in response to life challenges (Beidel & Alfano, Reference Beidel and Alfano2011; Gross, Reference Gross2015).
From an integrative perspective, the interaction of these three dimensions (emotional, cognitive, and functional) helps explain the multidimensional nature of anxiety and its impact on daily life. Several studies emphasize the importance of addressing these components separately to achieve more effective assessment and treatment (Clark et al., Reference Clark, Bormann, Cropanzano and James1995; Clark & Beck, Reference Clark and Beck2010; Mennin et al., Reference Mennin, Fresco, O’Toole and Heimberg2018). Thus, in the specific context of CCA, we follow the same conceptual framework. This allows us to theorize a tripartite structure of distress associated with CCA, aligning with previous evidence related to generalized anxiety. We adopted the following labels for the three dimensions that we expect to find: (1) functional interference: awareness that thinking about climate change alters the functioning of daily life; (2) emotional distress: intrusive emotional responses resulting from the interaction of physiological and cognitive processes when becoming aware of climate change; and (3) metacognitive impairment: the cognitive burden of being aware of the intrusive nature of one’s own thoughts about climate change.
The Measure of Anxiety about Climate Change: The Climate Change Anxiety Scale (CCAS)
The authors of the Climate Change Anxiety Scale (CCAS) (Clayton & Karazsia, Reference Clayton and Karazsia2020) emphasize its potential to understand the mental health effects of climate change consequences. According to them, the CCAS measure can indicate the impact of climate change anxiety may have on eco-anxiety and point to how this problem might be treated in therapy for extreme cases. Beyond its conceptual novelty, understanding climate change anxiety is relevant because it links global environmental threats with individual and collective mental health, informing preventive and educational interventions that foster adaptive responses rather than paralyzing distress. The main objective of the development of the CCAS was to know the impact of climate anxiety on personal well-being. The original CCAS consists of 13- item Likert format with five response options from 1 (never) to 5 (almost always), grouped in two subscales: (1) cognitive–emotional impairment (items 1–8): this dimension related to climate change reflects difficulties in sleeping, rumination about climate change, or experiencing nightmares for instance: “Thinking about climate change makes it difficult for me to concentrate” (item 1); and (2) functional impairment (items 9–13): this dimension aims to reflect whether the emotions caused by climate change are preventing people from leading a functional life, for instance: “My concerns about climate change make it hard for me to have fun with my family or friends” (item 9). The items that make up these subscales are based on the Rumination Response Scale (Treynor et al., Reference Treynor, González and Nolen-Hoeksema2003) to assess whether people’s thoughts about climate change go beyond occasional concern and the functional impairment items, adapted from the Weiss Functional Impairment Rating Scale (Weiss, Reference Weiss2000). Total scores for both subscales can be calculated independently, but an overall score can also be obtained. The CCAS scale was also developed based on first-person descriptions of experiences and emotions related to climate change, published in blogs dedicated to the subject (Clayton & Karazsia, Reference Clayton and Karazsia2020). In the same study, Clayton and Karazsia (Reference Clayton and Karazsia2020) developed two other subscales (personal experience of climate change and behavioral engagement) as a validation measures for the CCA scale. The personal experience of climate change subscale (items 14–16), or the third related factor of the climate change anxiety, consists of three statements measuring the perception of whether a person feels affected by climate change and captures personal experience with climate change (e.g., “I have been directly affected by climate change”). Meanwhile, the behavioral engagement subscale (items 17–22), or the fourth related factor of the CCA, assesses behavioral activity toward environmental care through six statements (e.g., “I recycle” or “I turn off lights”). This subscale aims to measure behavioral engagement and includes both active participation in pro-environmental behavior and support for such behavioral responses. Both subscales also use a 5-point Likert response format. Some of the items in these CCAS subscales are based on the Drive for Muscularity Scale (McCreary & Sasse, Reference McCreary and Sasse2000). The full set of 22 items, along with the Environmental Identity Scale (EID) (Clayton, Reference Clayton, Clayton and Opotow2003) and four items related to general anxiety and depression, were administered in two different studies to North American samples, one exploratory (n = 203) and the other confirmatory (n = 199). The results of Clayton and Karazsia (Reference Clayton and Karazsia2020) show that the CCA scale has satisfactory psychometric properties. However, it should be noted that in the original study, the authors did not opt to evaluate the factorial structure of the 13-item CCAS, but instead conducted a series of exploratory factor analyses (EFA) with the 22 items, resulting in four factors: (1) cognitive–emotional impairment, (2) functional impairment, (3) personal experience of climate change, and (4) behavioral engagement. CCA is a construct of great relevance for individual and collective well-being, and though significant progress is being made in developing initial knowledge, measuring this construct remains a relatively underexplored topic.
The Measure of Anxiety About Climate Change in Spain
Developing reliable and valid CCA measures in Spain is interesting given the climatic conditions this country will face in the future. We focus on Spain as the largest country in the Iberian Peninsula, as it will be one of the most affected by extreme heat due to climate change. Indeed, there is evidence that much of its Mediterranean coast is warming faster than most coastal areas worldwide. The IPCC Working Group II (Reference Lee and Romero2023) warns that the Mediterranean region’s temperature has already increased by 1.5 degrees Celsius (°C) compared to the global average (1.1°C). They also predict extreme climate events affecting the entire Mediterranean region, such as significant drought increases. They state that for every degree the temperature rises, rainfall will reduce by 5% to 20%, affecting countries’ capacity to reduce emissions. There are records indicating that the Iberian Peninsula is experiencing increased impacts from extreme heat waves in summer, fire risks, catastrophic or torrential rains, species extinction risks sensitive to warming, phenological changes, species displacement, negative impacts on human health, water resources, and food security (Carnicer et al., Reference Carnicer, Domingo-Marimon, Ninyerola, Camarero, Bastos, López-Parages, Blanquer, Rodríguez-Fonseca, Lenton, Dakos, Ribas, Gutiérrez, Peñuelas and Pons2019; Stein et al., Reference Stein, Staudt, Cross, Dubois, Enquist, Griffis, Hansen, Hellmann, Lawler, Nelson and Pairis2013). Recent research indicates that these climatic conditions imply changes in well-being and quality of life, necessitating new styles and habits as adaptation strategies, causing some concern for the population (Corral-Verdugo, Reference Corral-Verdugo2021; Gago et al., Reference Gago, Sargisson and Milfont2024; Stewart, Reference Stewart2021).
In Spain, citizen awareness about the effects of global warming surpasses the European average, with 87% of the population alarmed, making Spain the fifth most concerned country after Portugal, Greece, Cyprus, and Malta (Spain’s Ministry of Ecological Transition & United Nations and Human Rights, 2019). Understanding how climate change affects people is crucial for creating action plans or strategies to mitigate the severity of its health consequences (European Commission, n.d.). Therefore, it is necessary to develop studies aimed at assessing climate change anxiety in the Spanish population, using adapted measures to the Spanish sociocultural context and supported by appropriated validity evidence. Two primary measurement instruments (CCAS by Clayton & Karazsia, Reference Clayton and Karazsia2020 and HEAS by Hogg et al., Reference Hogg, Stanley, O’Brien, Wilson and Watsford2021, Reference Hogg, Stanley, O’Brien, Wilson and Watsford2023) have been adapted to assess climate change anxiety, and the literature shows four proposals for measuring CCA using the CAS scale in Spanish samples. The first proposal is the outcome of testing the psychometric properties of the Spanish translation of the CAS scale (Robles & Aguilar-Luzón, Reference Robles and Aguilar-Luzón2021) providing evidence of validity for the two dimensions of the original CAS (13 items). However, this version has certain limitations, such as the composition of the sample (510 university students) for the analysis of its psychometric properties, and the translation method used. The second Spanish version of the CAS was developed by applying the scale to a large sample of Spanish adolescents (average age of 14.54 years, SD = 1.78) (Sanandrés Pérez-Loizaga & Rodríguez Rey, Reference Sanandrés Pérez-Loizaga and Rodríguez Rey2022). The third version, proposed by Contreras et al. (Reference Contreras, Valiente, Peinado, Trucharte, Heeren and Vazquez2022), is limited to a preregistration of the translated items on OSF (https://osf.io/r3tey). Finally, Navarro-Carrillo et al. (Reference Navarro-Carrillo, Torres-Marín and Moya-Garófano2025) translated the original CCAS and explored various theoretical models (two-factor and three-factor) with a sample of 460 adults. The results support a bifactor structure for that version aligned with the 13 items of the original CCAS formulation.
Overall, these studies emphasize the need for validated measures to effectively assess CCA in the Spanish population. Given the availability of instruments measuring the construct in other languages and, specifically, the extended use in the literature of the CCAS, to develop the Spanish version of that instrument by following a solid and comprehensive approach would help in understanding the construct in Spain and identifying differences with other groups.
However, due to the cultural content of the scale, it is needed to not only translate the scale but also to adapt the items and to critically assess the contribution of each to the total score. Adapting the scale also involves identifying the items representing indicators of the construct and testing the suitability of the theoretical model to assess it in the intended group. Therefore, this study proposes a full adaptation of the CCAS where the CCA is measured according to the Spanish definition of the construct.
The Present Study
This study aims to adapt to the Spanish language spoken in Spain and the Spanish culture and provide validity evidence of the Spanish version of the Climate Change Anxiety Scale (CCAS–S). To reach that goal, two studies were developed. In Study 1, the original version of the CCAS was translated into Spanish by following a modified committee approach to translation (Harkness & Schoua-Glusberg, Reference Harkness, Schoua-Glusberg and Harkness1998). In the study 2, we analyzed the psychometric properties of the translated versions by providence validity evidence to support the intended purpose for CCAS–S measures: to assess climate change anxiety in the Spanish population.
Study 1: Creation of the Spanish Version of the Climate Change Anxiety Scale
Method
Participants
This study consists of two phases: translation and evaluation of the translated version. In the first one, three researchers participated in the translation of the original CCAS into Spanish spoken in Spain. All of them were bilingual psychologists specialized in environmental psychology and/or psychometrics, familiar with both English- and Spanish-speaking cultures, and with extensive experience in test development. Their years of experience ranged from 15 to 44 (M = 29.5; SD = 10.52). On a second phase, six experts rated the adequacy of the items, identified potential problems with the translations of the item stems, and provided suggestions to improve them. Before the task, participants were informed about the goal of the study and signed and informed consent. Ethical approval for this study was obtained from the Ethics Committee of University of Granada (Spain).
Instruments
For the translation, researchers used the original version of the CAS by Clayton and Karazsia (Reference Clayton and Karazsia2020) described earlier. The adjudicator used a template created ad hoc where the two independent adaptations were compared, and the final version was obtained. For the experts’ evaluation, a survey was created using the platform TIVIAN. After presenting the information about the study and the informed consent, participants were shown the Spanish version of the instructions and the items. For each item, experts evaluated the adequacy in a five-point scale from (1) “not adequate at all” to (5) “totally adequate,” and provided suggestions focused on changing and improving the content of the items. Experts were also asked to indicate whether each item adequately represented the theoretical dimension to which it belonged (functional impairment, emotional distress, or metacognitive impairment), and to provide comments on clarity, cultural relevance, and conceptual adequacy. At the end, participants found an additional question to include general comments about the scale.
Procedure and Analysis
In the first phase, the adjudicator reviewed the independent translations by each of the researchers and made two types of actions, either assigned the final version when both researchers coincided in their translation and when one of the versions was clearer than the other or identified the specific element to be discussed in a joint meeting. During the meeting, incongruences between researchers were argued and final decisions were made. Experts in the second phase evaluated the resulting version. Quantitative responses about adequacy allowed identifying potential problematic items, whereas suggestions helped guiding changes in the items. Descriptive analyses were conducted for the former to identify less appropriate items. For the latter, suggestions were grouped for each element and discussed among the researchers. After agreeing with the most suitable suggestions when more than one for the same element, suggestions were implemented leading to the second version of the scale.
Results
The experts’ evaluations of the adequacy of each element of that version, that is, the introduction, the response categories and the specific items is displayed in the Supplementary Materials (Supplementary Table S1 in OSF project). All the elements except the introduction section reached values above 4. That section was rated 2 by one of the experts. The mean of the values assigned to all the elements was 4.55. Despite some items did not reaching the maximum value of 5, comments or suggestions were not provided by experts and, therefore, changes were not implemented in these cases. Supplementary Table S2 (in Supplementary Materials in OSF project) summarizes the comments and suggestions provided by the experts, as well as the new version of all the elements based on those suggestions. The experts made suggestions about specific terms and expressions that were implemented in the new proposal. The Spanish version obtained by following the committee approach is available in the following link (OSF project): https://osf.io/a3x2m/?view_only=366d07205d024396bc05b06f6bed3cef.
Study 2: Validation of the Spanish Version of the Climate Change Anxiety Scale
In our first study, we obtained a CCA translated version into Spanish language and culture evaluated by experts in climate change research and based on the one proposed by Clayton and Karazsia (Reference Clayton and Karazsia2020). In this second study, our objective was to gather validity evidence that would support the intended purpose, that is, the measurement of CCA in the Spanish population. Regarding the dimensionality of the scale, we hope to confirm the three factors structure described for the original version of the scale (functional interference, emotional distress, and metacognitive impairment).
Method
Participants
A total of 819 participants responded to the survey questionnaire, but 13 were not considered in the analyses because of their incorrect response to the attentional control question. A final sample of 806 participants aged 18 to 77 years (M = 27.1 years, SD = 10.8) took part in Study 2. Of these, 584 (72.5%) were female, 212 (26.3%) were male, and 10 (1.2%) did not identify their sex. The descriptive statistics for sociodemographic variables are presented in Supplementary Table S3 (in supplementary materials in OSF project).
Instruments
Along with the final Spanish version of the CCAS (CCAS–S), participants responded to Goldberg’s Anxiety and Depression Scale (EADG) (Goldberg et al., Reference Goldberg, Bridges, Duncan-Jones and Grayson1988) adapted from the Spanish context by Montón et al. (Reference Montón, Pérez Echeverría, Campos, García Campayo and Lobo1993). This scale allows obtaining differentiated evaluations for depression and anxiety. The scale consists of 18 dichotomous (yes/no) items (αordinal = .81), divided into two subscales: nine items assessing anxiety (αordinal = .71), and nine items assessing depression (αordinal = .67). In the anxiety subscale, participants must respond affirmatively to at least two of the first four items to answer all nine items. Similarly, participants are required to respond affirmatively to at least one of the first four items in the depression subscale to proceed with the remaining nine items. This scoring system ensures that participants complete all items of each subscale only if they meet the initial response criteria outlined in the first items.
Furthermore, as suggested by Clayton and Karazsia (Reference Clayton and Karazsia2020), to explore the relationship between CCA and other related variables and obtain evidence of concurrent and discriminant validity, Clayton’s (Reference Clayton, Clayton and Opotow2003) environmental identity scale (EID) was administered, validated in the Spanish context by Olivos and Aragonés (Reference Olivos and Aragonés2011). The EID scale, in its Spanish version, allowed us to evaluate the relationship between personal identity and nature, considering four dimensions of environmental identity: (a) environmental identity (αordinal = .72), (b) enjoyment of nature (αordinal = .74), (c) appreciation for nature (αordinal = .74), and (d) environment (αordinal = .81).
Procedure
The data were collected through an online survey implemented via the Unipark platform (QuestBack, 2019). Participants were recruited through an online research panel provider that follow ISO 26362 norm to guarantee quality, which applied quota-based selection procedures to ensure representativeness across key sociodemographic variables (gender, age, and region). The quotas were established based on the Spanish census. Although participation was voluntary, panel members received standard compensation according to the provider’s procedures, and participation was encouraged through a small economic raffle. All participants provided informed consent before taking part in the study and were informed about the inclusion of random response controls. They were also provided with the contact details of the principal investigator and the research group for any questions or concerns. No identifying information was collected to ensure anonymity. Before these measures and after the acceptance of the informed consent, the participant was asked to inform about his or her age; if this was less than 18, the study was terminated immediately. Ethical approval for this study was obtained from the Ethics Committee of the University of Granada, in accordance with institutional guidelines. Regarding the order in which the measures were taken, the participants first answered the items of the different scales mentioned in the study (CCAS–S, EID, and EADG, in this order) and then completed the study by answering sociodemographic questions.
Analysis
The analysis responded to two different approaches. On one hand, analyses conducted by the authors of the original version of the scale were replicated to compare psychometric properties of the translated version with those of the original scale. First, an item and reliability analysis were conducted. We then performed an exploratory factor analysis (EFA) to complement item analysis statistics by taking also into account item factor loading. For the EFA, the adequacy of the item correlation matrix was first tested using the Kaiser–Meyer–Olkin (KMO) index. To determine the appropriate number of factors to retain, a parallel analysis was performed. The EFA was conducted using the weighted least squares (WLS) estimator, given the ordinal nature of the items and the lack of multivariate normality. In a second stage, confirmatory factor analyses (CFAs) were carried out to compare the fit of alternative theoretical models to the dataset. These included: (1) the original two-factor structure designed to measure cognitive–emotional impairment and functional impairment (Clayton & Karazsia, Reference Clayton and Karazsia2020); (2) a unidimensional model with all items loading on a single factor; and (3) a hierarchical model with three first-order factors, emotional, metacognitive, and functional impairment, operationalized in a second-order structure, following both theoretical considerations and latest common practices with the scale (Cruz & High, Reference Cruz and High2022). CFAs were estimated using the weighted least squares mean and variance adjusted (WLSMV) estimator. Additionally, the average variance extracted (AVE) was calculated for each factor as a measure of convergent validity, assessing the proportion of variance captured by the latent constructs in relation to measurement error. To further ensure the robustness and reliability of these results, a bootstrapping analysis was employed. This procedure provides a distribution of the possible estimates estimated from randomly drawn samples from the study sample, which allows a more accurate understanding of the variability and robustness of the CFA indices obtained. The adequacy of all models was evaluated according to conventional goodness-of-fit thresholds (CFI and TLI ≥ 0.95; RMSEA ≤ 0.08). To assess the stability of the factor loadings and the robustness of the models fit indices, a bootstrapping analysis was performed using the Lavaan R library (Rosseel, Reference Rosseel2012).
In addition to the factorial analyses, group mean comparisons were conducted by sex and by levels of general anxiety and depression. These analyses were included to examine whether CCAS–S scores behaved as theoretically expected in groups differing on related constructs, in accordance with international recommendations for test adaptation and validation (International Test Commission [ITC], 2018). Previous research indicates that higher levels of general anxiety or depression are associated with greater emotional distress related to climate change, and that women typically report higher affective responses to environmental threats. Although these comparisons involve variables external to the CCAS, they provide additional evidence of concurrent and discriminant validity by testing whether the instrument differentiates between groups that theoretically should differ on climate change anxiety. For this, to obtain validity evidence based on relationships with other variables, Spearman’s correlations and partial correlations were computed with the EID and Goldberg scales (including separate and combined subscales for anxiety and depression), as well as with the subscales for climate change experience and behavioral engagement of the CCAS–S. Partial correlations were specifically conducted to control for shared variance between the subscales of the instrument and the related external measures, thus providing a more accurate estimation of the unique associations between constructs. Additionally, Welch’s t tests (Delacre et al., Reference Delacre, Lakens and Leys2017) were used to assess differences in scores on the different scales used in the study between men and women, as well as between participants who exceeded the minimum threshold for responding to the full EADG scales of anxiety, depression, or both, and those who did not. Cohen’s d was computed to quantify the effect sizes, were calculated from the differences found using a Welch’s t test on the scores obtained on the different scales according to four main categorical variables: sex (men vs. women), anxiety (participants who exceeded vs. participants who did not exceed the minimum threshold on the specific anxiety scale of the EADG), depression (participants who exceeded vs. participants who did not exceed the minimum threshold on the specific depression scale of the EADG), and a mixed group (participants who simultaneously exceeded the minimum thresholds on both anxiety and depression scales vs. participants who did not exceed either of these two thresholds). Furthermore, the moderating and mediating effects of environmental identity on the relationship between experience and metacognitive impairment were analyzed using linear regressions.
Finally, a sex invariance analysis was carried out for the CCAS–S scores. The invariance analysis was incorporated into the study to rigorously evaluate whether the measurement instrument operates equivalently across gender groups. The configural model was tested with all levels of invariance (threshold, metric, scalar, and strict invariance) using a WLSMV estimator, theta parameterization, and the identification method for ordinal data of (Wu & Estabrook, Reference Wu and Estabrook2016). For this analysis, due to the marked positive asymmetric distribution of responses, it was necessary to collapse categories 4 and 5 and eliminate item 4 of the emotional factor because in the group of men, none of them responded with category 4 or 5 to this item.
Results
Item Analysis and Exploratory Internal Structure
Table 1 shows the descriptive and item statistics for the CCAS–S version obtained in study 1. All items present positively skewed distributions, indicating a higher proportion of responses at the lower end of the Likert-type scale, except for items 5 (M = 2.31, SD = 1.16, skewness = 0.40, kurtosis = −0.89) and 7 (M = 2.58, SD = 1.16, skewness = 0.14, kurtosis = −0.88). These two items not only deviate from the general pattern of skewness but also exhibit the greatest variability (SD = 1.16 in both cases) and more central tendencies (median = 2 and 3, respectively) among all items on the scale. Items 6 (M = 1.30, SD = 0.66, skewness = 2.49, kurtosis = 6.40) and 11 (M = 1.26, SD = 0.57, skewness = 2.43, kurtosis = 6.54) exhibit extreme responses concentrated within a very narrow range of the Likert-type scale, as evidenced by their low standard deviations (0.66 and 0.57) and high kurtosis values (6.40 and 6.54). This pattern indicates a strongly leptokurtic distribution with minimal dispersion, characterized by the predominance of a single response category in each item. Other problems were also identified concerning these items. Item 11 presented redundancy problems, that is, high correlations (≥ .80) with other items of the same subscale such as item 12 (r = .85) and item 9 (r = .79). On the other hand, in items 5 and 6, the presence of cross-loadings was detected by EFA. In item 6, these cross-loadings were found both in the original two-factor solution (.49 in cognitive–emotional impairment and .40 in the functional impairment factor) and in the three-factor solution obtained because of the parallel analysis conducted to investigate the dimensionality underlying the data (.32 in functional impairment and .31 in both metacognitive and emotional impairment). In item 5, cross-loadings were found only in the three-factor solution of the tool (.45 in emotional impairment and .33 in metacognitive).
Psychometric properties of the items and the scale

Table 1. Long description
The table presents data for 13 items across several psychometric categories.
* Descriptive Statistics: Mean M ranges from 1.26 to 2.58. Standard Deviation S D ranges from 0.57 to 1.16. Skewness ranges from 0.14 to 2.49. Kurtosis ranges from negative 0.89 to 6.54.
* Item-test correlation: Spearman’s r values for the 13-item set range from .54 to .69. For the 10-item set, values range from .53 to .72, with items 5, 6, and 11 excluded.
* Alpha if removed: Cronbach’s alpha remains stable at .87 for the 13-item set and .83 to .84 for the 10-item set.
* E F A (Exploratory Factor Analysis):
* 2 Factors: Factor 1 loadings range from negative .09 to .78. Factor 2 loadings range from negative .06 to 1.00.
* 3 Factors: Factor 1 loadings range from negative .05 to 1.01. Factor 2 loadings range from negative .06 to .86. Factor 3 loadings range from negative .08 to .73.
Note: K M O equals .93. The two-factor solution explains 58 percent of the variance, and the three-factor solution explains 62 percent.
Note: The key measures reported are the mean (M), standard deviation (SD), skewness, and kurtosis. Item–test correlations are presented as Spearman’s r values. KMO = .93. Exploratory factor analyses were conducted using all 13 items. The two-factor solution explained 58% of the variance, while the three-factor solution explained 62%.
Given these issues, and considering the content of the items, the elimination of problematic items (5, 6, and 11) was considered. For this purpose, we decided to compare item statistics of the complete version of the scale (13 items of the original scale) with those excluding the problematic items. Regarding this comparison, the results of the item–test correlations of the items in both versions showed that the elimination of these items did not negatively affect the homogeneity of the scale, since the item–test correlations remained stable in most cases. Additionally, some items (such as item 7) presented a slight increase in their correlation, suggesting that the elimination of items 5, 6, and 11 improved slightly the structure of the scale. On the other hand, in the 10-item version, two distinct groups of item–test correlations were identified. Items 1, 2, 7, 8, 9, and 10 with high correlations (≥0.65) being the most discriminative and contributing the most robustly to the measurement of the construct.
Confirmatory Analysis of the Internal Structure
The Henze–Zirkler multivariate normality test revealed that the CCAS–S items did not conform to a multivariate normal distribution (HZ = 13.71, p < .001). Because of this and the ordinal nature of the data, the WLSMV adjusted was applied. Regarding the fit obtained by testing, the 13- and 10-item version of the different theoretical models using confirmatory factor analysis, the hierarchical three-factor model for the 10-item version presented the best fit to the data according to the various fit statistics (see Table 2). Specifically, fit indices were found for this model with a robust CFI of .97 and a robust TLI of .96, indicating a very good overall fit. Additionally, the error indices supported the model’s acceptability, yielding a robust RMSEA of .071 (90% CI [.053, .090]) and an SRMR of .03. These values suggest minimal discrepancy between the hypothesized model and the observed data, thus supporting structural validity. Moreover, when examining the modification indices to identify possible misspecification, it was observed that the inclusion of a correlation between the residuals of items 7 and 8 (contiguous items with very similar content) produced a significant improvement in the model fit, reaching even more adequate values: robust CFI = .98, robust TLI = .97 and robust RMSEA = .062 (90% CI [.042, .082]). To further ensure the robustness and reliability of these results, a bootstrapping analysis was employed. This procedure provides a distribution of the possible estimates, which allows a more accurate understanding of the variability and robustness of the indices obtained. The mean values obtained after performing 1566 replicates by bootstrapping largely supported the overall robustness of the results (robust CFI = .95 [.90, .98], robust TLI = .93 [.86, .97], robust RMSEA = .10 (90% CI [.08, .11]), and SRMR = .04 [.03, .05]), indicating an acceptable fit in global terms taking into account the non-normality and skewness of the data. However, a specific problematic or unstable aspect related to the residuals was detected, reflected in an RMSEA value higher than the recommended threshold of .08. This finding pointed to a recurring need to incorporate residual correlations in the model specifications, suggesting significant local item dependence. According to our interpretation, this issue could largely explain, at a general level, the inconsistencies observed not only in the present analysis but also in previous studies examining the internal structure of this instrument when administered to different samples aiming for adaptation across diverse cultural contexts, maybe due to overlapping item contents.
Fitting and robustness of confirmatory models comparing the original formulation (13 items) with the reduced version (10 items)

Table 2. Long description
The table consists of seven columns. The first column lists the Fit Index, followed by three main categories each split into 13 Items and 10 Items: Unidimensional model, Theoretical model, and Three-factor hierarchical model.
* Robust C F I: Unidimensional (0.88 for 13 items, 0.90 for 10 items); Theoretical (0.92 for 13 items, 0.93 for 10 items); Three-factor (0.94 for 13 items, 0.97 for 10 items).
* Robust T L I: Unidimensional (0.85 for 13 items, 0.87 for 10 items); Theoretical (0.90 for 13 items, 0.91 for 10 items); Three-factor (0.92 for 13 items, 0.96 for 10 items).
* Robust R M S E A: Unidimensional (0.12 for both); Theoretical (0.10 for both); Three-factor (0.09 for 13 items, 0.07 for 10 items).
* S R M R: Unidimensional (0.06 for 13 items, 0.05 for 10 items); Theoretical (0.05 for both); Three-factor (0.04 for 13 items, 0.03 for 10 items).
* N (Sample Size): Ranges from 1036 to 1593 across the models.
Each cell includes bracketed bootstrap means and parenthetical ranges or confidence intervals. The Three-factor hierarchical model with 10 items shows the best fit with the highest C F I and T L I and the lowest R M S E A and S R M R.
Note: The robust fit indices (CFI, TLI, and RMSEA) were computed using corrections to account for non-normality and data asymmetry. These adjusted indices provide a more accurate reflection of model fit under conditions where the assumption of multivariate normality is violated. The bracketed values represent the mean of each indicator’s distribution obtained via bootstrapping, while the values in parentheses within the brackets indicate the minimum and maximum estimates observed among the N effective (i.e., convergent) replications out of a total of 3500. However, for the robust RMSEA, these parentheses represent the mean of the upper and lower bounds of the robust RMSEA confidence interval, respectively, rather than minimum and maximum estimates.
The factor loadings presented in Table 3 reflected consistent relationships between the items and their respective factors. Specifically, the loadings ranged from .67 (item 1) to .82 (item 2) for the emotional distress factor, from .78 (item 10) to .90 (item 9) for the functional interference factor, and from .72 (item 13) to .74 (item 8) for the metacognitive impairment factor. Furthermore, bootstrapping analyses supported the overall stability of these factor loadings, showing consistent mean values and relatively narrow confidence intervals (e.g., item 2 = .82, 95% CI [0.77–0.87]; item 9 = .90, 95% CI [0.86–0.93]; item 7 = .73, 95% CI [0.67–0.78]), reflecting a good level of confidence in these estimations. The reliability statistics suggest that the factors of the instrument showed good internal consistency. The ordinal alpha is high for the emotional and functional impairment subscales (.82 and .88) and adequate for the metacognitive impairment factor (.76). Regarding the general second-order factor, its higher order omega is also high (.93). The average variance extracted (AVE) indicated a moderate construct validity, particularly higher for the functional interference (.71) compared to the emotional distress and metacognitive impairment factors (.55 and .53 respectively). The second-order general factor indicated a high construct validity (.81).
Factor loadings, stability of estimates, and reliability

Table 3. Long description
The table consists of five columns: Variables, Emotional distress, Functional interference, Metacognitive impairment, and General impairment C C A. Data points include factor loadings followed by R-squared percentages in brackets and 95 percent confidence intervals in parentheses.
Emotional distress loadings:
* Item 1: .67 [45%] (.61 to .73)
* Item 2: .82 [67%] (.77 to .87)
* Item 3: .74 [55%] (.68 to .80)
* Item 4: .73 [53%] (.66 to .79)
Functional interference loadings:
* Item 9: .90 [81%] (.86 to .93)
* Item 10: .78 [60%] (.73 to .82)
* Item 12: .85 [73%] (.81 to .90)
Metacognitive impairment loadings:
* Item 7: .73 [53%] (.67 to .78)
* Item 8: .74 [54%] (.68 to .79)
* Item 13: .72 [52%] (.66 to .79)
General impairment C C A loadings for latent factors:
* Emotional distress: .85 [73%] (.80 to .90)
* Functional interference: .94 [88%] (.89 to .98)
* Metacognitive impairment: .90 [81%] (.85 to .95)
Reliability and Validity Metrics:
* Alpha ordinal: .82 for Emotional distress, .88 for Functional interference, and .76 for Metacognitive impairment.
* Omega total: .76 for Emotional distress, .79 for Functional interference, .71 for Metacognitive impairment, and .93 for General impairment.
* Omega hierarchical: .76 for Emotional distress, .78 for Functional interference, and .71 for Metacognitive impairment.
* Higher order omega: .93 for General impairment.
* A V E: .55 for Emotional distress, .71 for Functional interference, .53 for Metacognitive impairment, and .81 for General impairment.
Note: Factor loadings are presented alongside their respective R 2 values [into brackets], and the stability of these estimates (into parentheses) was derived from a 1566-replication bootstrap analysis. The values into parentheses represent the 2.5th and 97.5th percentile confidence interval boundaries.
Relationships of CCAS–S Measures With Other Variables
As Table 4 shows, the subscales are highly interrelated, with the general impairment measure exhibiting the highest coefficients (r = .838, r = .863, and r = .776, respectively), which indicates that this variable effectively synthesizes the emotional, metacognitive, and functional dimensions. A detailed analysis of the relationship between each of these subscales and the remaining variables revealed a convergent tendency, whereby, in areas such as climate change experience, behavioral engagement to climate change, and environmental identity measures, the CCA measure consistently displayed the highest correlation values. In most cases, this was followed by the metacognitive subscale, while the emotional and functional dimensions tended to yield somewhat lower coefficients.
Correlation matrix of study variables

Table 4. Long description
The table presents Pearson correlation coefficients for 14 variables. The variables are: 1. Emotional distress, 2. Metacognitive impairment, 3. Functional interference, 4. C C A (general impairment), 5. Climate change experience, 6. Behavioral engagement to climate change, 7. Environmental identity, 8. Enjoy nature, 9. Appreciate nature, 10. Environment, 11. Total E I D, 12. Anxiety, 13. Depression, and 14. Mixed (Ax and dep).
Key correlations include:
* Emotional distress (1) correlates strongly with C C A (4) at .838.
* Metacognitive impairment (2) correlates strongly with C C A (4) at .863.
* Total E I D (11) shows high correlations with Environmental identity (7) at .799, Enjoy nature (8) at .809, and Appreciate nature (9) at .840.
* Anxiety (12) and Depression (13) are highly correlated with Mixed (14) at .893 and .895 respectively.
* Climate change experience (5) correlates moderately with C C A (4) at .539.
* Most correlations between climate-related variables (1 through 11) and mental health variables (12 through 14) are low, ranging from non-significant to .287.
Significance levels are indicated by asterisks: three asterisks for p less than .001, two for p less than .01, and one for p less than .05.
Note: *p < .05; **p < .01; ***p < .001. Nonsignificant correlations (p ≥ .05) were left unmarked.
In contrast, in relation to measures of specific emotional states, such as anxiety and depression, a notable divergence from the previous trend was observed: the emotional distress subscale reached higher values (r = .253 for anxiety and r = .170 for depression) compared to the metacognitive impairment subscale (r = .138 and r = .127, respectively), while the CCA measure in turn presented some divergence as well, on one hand, being situated in an intermediate range close to the emotional dimension in relation to anxiety, and on the other hand, even surpassing this subscale in relation to the depression measure (r = .226 for anxiety and r = .184 for depression). Similarly, for the mixed variable (combined depression and anxiety), the emotional dimension (r = .237) surpassed the metacognitive (r = .150) and functional (r = .192) dimensions, evidencing that those emotional measures were more closely associated with the emotional distress subscale. Overall, these results indicated that, while there were convergence in the correlations of the CCA global and metacognitive deterioration measures with variables related to climate change experience, behavioral engagement, and environmental identity, significant divergences were observed concerning specific emotional states, wherein the emotional distress dimension showed a stronger association with these measures. This differential pattern underscored the importance not only of considering the total scale score but also of considering each participant’s particular scores on each impairment component. Partial correlations between each subscale of the two-factor and three-factor models and related study variables are presented in Table 5. All correlations control for the variance shared among the other subscales, providing estimates of the unique association between each latent dimension and the external variables.
Partial correlations of study variables

Table 5. Long description
The table compares a Two-factor structure (E M O dash C O G and F U N) and a Three-factor structure (E M O, M E T dash C O G, and F U N) across nine study variables. Statistically non-significant coefficients are marked with an asterisk.
* Climate change experience: .234, .217 (Two-factor); .138, .245, .159 (Three-factor).
* Behavioral engagement to climate change: .172, .094 (Two-factor); .052 asterisk, .216, .034 asterisk (Three-factor).
* Anxiety: .160, .012 asterisk (Two-factor); .180, minus .018 asterisk, .054 asterisk (Three-factor).
* Depression: .109, .036 asterisk (Two-factor); .104, minus .018 asterisk, .088 (Three-factor).
* Mixed (Ax and dep): .153, .027 asterisk (Two-factor); .161, minus .020 asterisk, .079 (Three-factor).
* Environmental identity: .147, .125 (Two-factor); .066 asterisk, .165, .095 (Three-factor).
* Enjoy nature: .118, .050 asterisk (Two-factor); .058 asterisk, .121, .027 asterisk (Three-factor).
* Appreciate nature: .110, .056 (Two-factor); .082, .081, .061 asterisk (Three-factor).
* Environment: .175, .147 (Two-factor); .067 asterisk, .211, .101 (Three-factor).
Note: Statistically no significant coefficients are marked with an asterisk (*).
The results of the partial correlations, presented in Table 5, show stable estimates of the correlations of the scale factors with the variables of the EID and EADG scales. However, by adopting a three-factor structure, greater differentiation is evident, highlighting the positive association between the metacognitive component and climate change experience (r = .245, p ≤ .001), as well as with behavioral engagement to climate change (r = .216, p ≤ .001). Anxiety showed a positive correlation with the emotional component (r = .180, p ≤ .001) and a null correlation with the metacognitive (r = −.018, p = .597) and functional (r = .054, p = .124) impairment factors, suggesting a closer link with the emotional component. Likewise, environmental identity and environmentalism showed a little relationship with the metacognitive component (r = .165, p ≤ .001 and r = .211, p ≤ .001, respectively), suggesting that a people with stronger sense of environmental identity and environmentalism may be related to greater cognitive processing of these issues. These results suggest that the three-factor structure of the CCAS–S for Spanish samples allows for better differentiation between emotional and cognitive aspects, providing greater clarity in understanding these relationships.
In relation to the groups formed around the anxiety subscale, significant differences were found on several measures. For the emotional distress subscale, a t test indicated a statistically significant difference (
$ {t}_{231.38}=5.72 $
 , p < .001) with a moderate effect size (d = .46). For the total score (overall impairment), the difference was also significant (
$ {t}_{227.62}=5.33 $
, p < .001) with a moderate effect size (d = .46). For the total score (overall impairment), the difference was also significant (
$ {t}_{227.62}=5.33 $
 , p < .001; d = .43), indicating that those who exceeded the minimum threshold score on the anxiety subscale manifested greater emotional and overall impairment compared to those who did not. Functional interference also showed a significant, though somewhat smaller, difference (
$ {t}_{258.28}=4.78 $
, p < .001; d = .43), indicating that those who exceeded the minimum threshold score on the anxiety subscale manifested greater emotional and overall impairment compared to those who did not. Functional interference also showed a significant, though somewhat smaller, difference (
$ {t}_{258.28}=4.78 $
 , p < .001; d = .36), as did metacognitive impairment (
$ {t}_{200.12}=3.05 $
, p < .001; d = .36), as did metacognitive impairment (
$ {t}_{200.12}=3.05 $
 , p = .003; d = .28). Higher scores were also found in the anxiety group for experience with climate change (
$ {t}_{206.13}=2.89 $
, p = .003; d = .28). Higher scores were also found in the anxiety group for experience with climate change (
$ {t}_{206.13}=2.89 $
 , p = .004; d = .25) and behavioral engagement (
$ {t}_{194.92}=1.69 $
, p = .004; d = .25) and behavioral engagement (
$ {t}_{194.92}=1.69 $
 , p = .09; d = .16), though the latter did not reach conventional significance. For the depression subscale groups, small but significant effect sizes were observed for functional interference (
$ {t}_{228.35}=3.87 $
, p = .09; d = .16), though the latter did not reach conventional significance. For the depression subscale groups, small but significant effect sizes were observed for functional interference (
$ {t}_{228.35}=3.87 $
 , p < .001; d = .30), general impairment (
$ {t}_{189.89}=3.39 $
, p < .001; d = .30), general impairment (
$ {t}_{189.89}=3.39 $
 , p = .001; d = .30), and emotional distress (
$ {t}_{185.65}=2.97 $
, p = .001; d = .30), and emotional distress (
$ {t}_{185.65}=2.97 $
 , p = .003; d = .27), with metacognitive impairment showing a smaller but still significant effect (
$ {t}_{176.84}=2.10 $
, p = .003; d = .27), with metacognitive impairment showing a smaller but still significant effect (
$ {t}_{176.84}=2.10 $
 , p = .037; d = .20). For the mixed group, consisting of participants who simultaneously exceeded the thresholds in both anxiety and depression, significant differences were observed in general impairment (
$ {t}_{77.26}=3.04 $
, p = .037; d = .20). For the mixed group, consisting of participants who simultaneously exceeded the thresholds in both anxiety and depression, significant differences were observed in general impairment (
$ {t}_{77.26}=3.04 $
 , p = .003; d = .36), emotional distress (
$ {t}_{74.60}=2.79 $
, p = .003; d = .36), emotional distress (
$ {t}_{74.60}=2.79 $
 , p = .007; d = .35), functional interference (
$ {t}_{88.18}=3.32 $
, p = .007; d = .35), functional interference (
$ {t}_{88.18}=3.32 $
 , p = .001; d = .33), and metacognitive impairment (
$ {t}_{74.45}=1.82 $
, p = .001; d = .33), and metacognitive impairment (
$ {t}_{74.45}=1.82 $
 , p = .073; d = .23), with the latter not reaching statistical significance at the .05 level. Regarding sex differences, the largest effects were observed in anxiety scores (
$ {t}_{330.50}=5.62 $
, p = .073; d = .23), with the latter not reaching statistical significance at the .05 level. Regarding sex differences, the largest effects were observed in anxiety scores (
$ {t}_{330.50}=5.62 $
 , p < .001; d = .48) and in the mixed group (
$ {t}_{347.91}=5.65 $
, p < .001; d = .48) and in the mixed group (
$ {t}_{347.91}=5.65 $
 , p < .001; d = .47), suggesting that women tend to score significantly higher than men on these measures. Relevant effects were also found on emotional distress (
$ {t}_{480.95}=5.00 $
, p < .001; d = .47), suggesting that women tend to score significantly higher than men on these measures. Relevant effects were also found on emotional distress (
$ {t}_{480.95}=5.00 $
 , p < .001; d = .36), which may reflect a greater emotional vulnerability in women compared to men. On the behavioral engagement (
$ {t}_{342.15}=4.42 $
, p < .001; d = .36), which may reflect a greater emotional vulnerability in women compared to men. On the behavioral engagement (
$ {t}_{342.15}=4.42 $
 , p < .001; d = .37) and nature appreciation scales (
$ {t}_{353.80}=2.70 $
, p < .001; d = .37) and nature appreciation scales (
$ {t}_{353.80}=2.70 $
 , p = .007; d = .22), women again scored higher, though with small effect sizes. Environmental identity showed small negative effects, with lower scores observed in the groups that exceeded the minimum threshold for the depression subscale (
$ {t}_{191.25}=-2.15 $
, p = .007; d = .22), women again scored higher, though with small effect sizes. Environmental identity showed small negative effects, with lower scores observed in the groups that exceeded the minimum threshold for the depression subscale (
$ {t}_{191.25}=-2.15 $
 , p = .033; d = −.19) and the group that exceeded the minimum threshold for both subscales (
$ {t}_{78.52}=-2.35 $
, p = .033; d = −.19) and the group that exceeded the minimum threshold for both subscales (
$ {t}_{78.52}=-2.35 $
 , p = .021; d = −.27), indicating a lower identification with the environment among participants in these groups. Further details on the effect sizes found can be seen in the OFS project (see Supplementary Table S4).
A mediation and moderation analysis were conducted to examine the role of environmental identity in the relationship between climate change experience and metacognitive impairment. The results indicated that environmental identity did not function as a moderator in this relationship (β = .00, p = .239). However, environmental identity was found to act as a significant mediator. Specifically, the mediation analysis showed that climate change experience had a significant positive effect on environmental identity, which in turn was significantly associated with increased metacognitive impairment. The indirect effect of climate change experience on metacognitive impairment through environmental identity was statistically significant, as reflected by the path coefficients and confidence intervals shown in Figure 1. Approximately 14% of the total effect of climate change experience on metacognitive impairment was attributable to this indirect (mediated) pathway. This finding indicates that a notable proportion of the relationship between individuals’ experiences with climate change and their metacognitive difficulties can be explained by the extent to which those experiences shape their sense of environmental identity. The figure also reports the proportion of variance explained (R 2) by the model for each endogenous variable, showing that climate change experience explained 10% of the variance in environmental identity, while the overall model accounted for 26% of the variance in metacognitive impairment. All reported path coefficients were statistically significant at p < .001. These results suggesting that individuals who develop a stronger environmental identity in response to their experiences may be particularly susceptible to metacognitive impairment.
Conceptual mediation model of the effect of experience on metacognitive impairment through environmental identity. Note: Path coefficients (a, b, c) represent unstandardized regression estimates, with standard errors in parentheses and 95% confidence intervals in brackets. R 2 indicates the proportion of variance explained by the model for each endogenous variable. All paths are statistically significant at p < .001.

Figure 1. Long description
The flowchart consists of three rectangular boxes connected by arrows.
* On the left is the independent variable box labeled Experience.
* At the top center is the mediator box labeled Environmental Identity, which includes R super 2 equals .10 in the bottom right corner.
* On the right is the dependent variable box labeled Meta-cognitive Impairment, which includes R super 2 equals .26 in the bottom right corner.
Three paths connect these variables with statistical data:
* Path a: An arrow points from Experience up to Environmental Identity. The path is labeled a equals .732, S E equals .075, p is less than .001, and 95 percent C I is .584 to .879.
* Path b: An arrow points from Environmental Identity down to Meta-cognitive Impairment. The path is labeled b equals .065, S E equals .010, p is less than .001, and 95 percent C I is .044 to .085.
* Path c: A direct horizontal arrow points from Experience to Meta-cognitive Impairment. The path is labeled c equals .297, S E equals .023, p is less than .001, and 95 percent C I is .252 to .344.
Measurement Invariance Across Gender
The results derived from the invariance analysis showed that the configural, threshold, metric, scalar, and strict invariance models all fit the data adequately, with no significant differences in fit when additional constraints were imposed (p > .05 in all cases). Specifically, the strict invariance model presented a chi-square difference of 3.50 with 6 degrees of freedom (p = .74), indicating an excellent fit and supporting full invariance across groups. This means that not only are the latent means equivalent between groups, but also the reliability and measurement precision of the instrument are maintained equally in both groups. The fulfilment of strict invariance confirms that any comparisons of means, variances, or covariances between groups are meaningful and unbiased. In the OFS project, the statistics of invariance analysis can be seen in Table S5.
The final version of the CCAS–S proposed in this study is available in the following link: https://osf.io/a3x2m/files/c8qkg?view_only=366d07205d024396bc05b06f6bed3cef (CCAS-S). The proposed version contains 10 items, which makes it necessary to compute z scores when using the CCAS–S to compare responses from Spanish speakers in Spain with those from groups who completed a different version of the instrument. To do this, we first obtained the raw total score for each participant and then calculated the mean and standard deviation of the total scores within each version of the CCAS (e.g., the 10-item version and the alternative version with a different number of items). For each participant, the z score was derived by subtracting the mean of their corresponding version from their raw score and dividing the result by that version’s standard deviation. This standardization expresses each score in terms of the number of standard deviations above or below the group mean, allowing scores from the two versions to be compared on a common metric.
Discussion
This article aimed to create the Spanish version of the CCAS (CCAS–S) and to gather validity evidence supporting its use to measure CCA in Spanish population. Although previous Spanish versions of the CCAS exist, our aim was not limited to translation but also to provide solid validity evidence and deepen the theoretical understanding of climate change anxiety in the Spanish context. Earlier adaptations were often based on convenience samples and lacked a fully documented validation process. This study employs a rigorous translation and method, and psychometrics are performed with data from a sample recruited through an online panel designed to reflect the sociodemographic characteristics of the Spanish population. We believe that in doing so, it provides both a refined theoretical model and a robust measurement tool for assessing the CCA construct.
Two studies were conducted: a committee-based approach to the translation of the scale, following the International Test Commission standards, and a validation study using a sample from the general Spanish population. We replicated the two-factor structure (cognitive–emotional impairment and functional impairment) identified by Clayton and Karazsia (Reference Clayton and Karazsia2020). Although the authors reported adequate psychometric properties for the CCAS, their version was developed for North American samples. Thus, it was needed to examine whether the same dimensional structure hold in culturally different populations, leading us to analyze the psychometric properties in a Spanish sample.
Structure of the Scale
The original CCAS consisted of 22 items and was designed to measure four factors. However, the CCAS was operationalized using the first 13 items through a two-factor structure. In our case, we have obtained evidence that supports a 10-item scale for the Spanish population, which allowed a three-factor structure with an adequate adjustment of the model: functional interference, emotional distress, and metacognitive impairment. Cruz and High (Reference Cruz and High2022) argue that the elimination of items should not be seen as an abandonment of a confirmatory approach. Instead, each element can be viewed as an example drawn from a wide range of potential construct indicators, reducing the risk of overvaluing a single element. In this sense, retaining elements that do not validly contribute becomes counterproductive when a coherent structure can be achieved without them. In addition, as we have indicated earlier, though the CCAS showed satisfactory psychometric properties, it should be noted that in the original study by Clayton and Karazsia (Reference Clayton and Karazsia2020), the evaluation of the factor structure of the CAS of 13 items was not carried out, which further justifies the comparison between the original version and the optimized version of the scale (10 items). Differences in the specific composition of each dimension were observed, suggesting that the meaning attributed to the items may vary across cultural contexts. We believe that a possible difference between their results and ours is due to the established analysis method. Clayton and Karazsia (Reference Clayton and Karazsia2020) used both CFA and EFA on the full 22-item scale, but acknowledged that CCA could be captured by the first 13 items. However, they did not theoretically or empirically test whether the bifactorial structure was superior to the initial four-factor model. This methodological limitation means that the internal structure of the scale was not confirmed with only the 13-item subset. The removal of three items does not affect the comparability of scores between groups, as the construct measured by the Spanish version of the CCAS overlaps with the construct assessed in the original version. The concept of “construct overlap” refers to the extent to which construct indicators are shared across linguistic or cultural groups, going beyond mere equivalence in the number of items across test or questionnaire versions (ITC, 2018). Accordingly, our approach aligns with this principle and emphasizes adaptation rather than direct adoption, aiming to ensure conceptual and contextual equivalence while allowing for potential cultural variations in how climate change anxiety is experienced. We also provide guidance on how to obtain comparable scores when comparing groups that responded to different versions of the CCAS, one of which is the CCAS–S proposed in this study.
Studies conducted with samples other than the one used by Clayton and Karazsia (Reference Clayton and Karazsia2020) also align and endorse the two-factor structure and maintain a scale consisting of 13 items. For example, Mouguiama-Daouda et al. (Reference Mouguiama-Daouda, Blanchard, Coussement and Heeren2022) investigated whether the French version of the CCAS would be better suited to a four-, two-, or single-dimension scale; the two-factor model (cognitive–emotional and functional) presented better fit indices than the other two models, so they chose to maintain this structure with a 13-item scale, for consistency with the original published version. With this same structure, good-fit indices and predictive capacity have also been obtained for samples from Arab countries (Lebanon, Palestine, Egypt, Saudi Arabia, and the United Arab Emirates) (Abdu et al., Reference Abdu, Gebreal, Alsaleem, Aljohani, Abdel-Rahman, Hussein, Ibrahim, Elbarazi, Hussein, Shamma, Elsayed Said Noureldin and Ghazy2024). With Spanish samples, Navarro-Carrillo et al. (Reference Navarro-Carrillo, Torres-Marín and Moya-Garófano2025) explored a unifactorial, bifactorial, and trifactorial solution, endorsing the two-factor structure and maintaining the 13 items translated from the original version of the CCAS.
However, other studies found different structures. For example, Wullenkord et al. (Reference Wullenkord, Tröger, Hamann, Loy and Reese2021), in Germany, did not replicate the two-factor structure. Instead, they proposed a unidimensional model with 12 items, eliminating item 6 due to poor fit. Innocenti et al. (Reference Innocenti, Santarelli, Faggi, Castellini, Manelli, Magrini, Galassi and Ricca2021) found no support for the two-factor model in Italian samples. Therefore, our results align with these European studies. For Spanish samples, CCA is best represented by three dimensions: functional interference, emotional distress, and metacognitive impairment.
Our findings are consistent with Larionow et al. (Reference Larionow, Sołtys, Izdebski, Mudło-Głagolska, Golonka, Demski and Rosińska2022), who proposed a three-factor model for Polish samples. However, slight differences in factor composition suggest that the cultural context influences item interpretation. These authors refer to intrusive symptoms, reflections on CCA, and functional impairment. Given the nature and wording of the items, and the meaning attributed to them within the Spanish cultural context, we operationalized the following dimensions—(1) metacognitive impairment: related to the cognitive burden of being aware of the intrusive nature of one’s thoughts about climate change; (2) emotional distress: reflects intrusive emotional responses arising from the interaction between physiological and cognitive processes when becoming aware of climate change; and (3) functional interference: refers to the awareness of the disruption caused by thinking about climate change in daily life. It includes items related to the personal impact on everyday tasks while also encompassing social aspects, such as interference with social and family relationships. Although the original 13-item CCAS has shown diverse factorial results across studies, its widespread use makes it a valuable reference instrument for cross-cultural research. Our goal was not to reproduce its exact two-factor structure, but to re-examine it in the Spanish context under a theoretically refined framework that distinguishes between functional interference, emotional distress, and metacognitive impairment. This conceptual distinction integrates insights from recent eco-anxiety models, allows for testing a multidimensional structure that may better represent the construct in this population, and can contribute to reinforce the theoretical and practical value of the “climate anxiety” construct for researchers and practitioners. Our proposal aligns with the Cognition-Affect Integrated Model of Emotion (Mishra & Tiwary, Reference Mishra and Tiwary2020), indicating that emotions depend on contextual constructions where affective experiences are modulated and enriched through cognitive processes. Based on this framework, our proposed emotional distress dimension includes items that capture both cognitive and physiological nuances. Moreover, physiological elements (e.g., “I cannot sleep” or “I cannot concentrate”) from the CCAS–S play a significant role when contextualized by cognitive processes (e.g., “When I think about climate change”), enhancing the emotional response. The items in the CCAS–S measure both cognitive–emotional and behavioral aspects, which provokes that the concretion level of the items changes along the instrument making some of them more ambiguous. For instance, in the item “My worries about climate change reduce my ability to develop my potential,” terms as “worries” or “potential” reflect personal elements that can be differently interpreted across participants. Despite the impact it could have in the participants responses, to include these types of items is the only way to measure some of the construct indicators. Future studies could examine the impact of item’s abstraction by comparing responses to items measuring cognitive–emotional aspects and those focused on behaviors. This interaction is particularly relevant for clinical diagnosis and functional adaptation (Monachesi et al., Reference Monachesi, Grecucci, Ghomroudi and Messina2023). Therefore, if the purpose of the CCAS is to provide a diagnostic tool for CCA (Clayton & Karazsia, Reference Clayton and Karazsia2020), our work represents an initial attempt to identify and define the diagnostic dimensions to be considered. However, given the composition we have obtained for each dimension, our results should be interpreted with caution. Regarding the dimensions identified by Larionow et al. (Reference Larionow, Sołtys, Izdebski, Mudło-Głagolska, Golonka, Demski and Rosińska2022), the intrusive symptoms dimension aligns with the emotional distress dimension found in the Spanish sample. For the reflections on climate change dimension, the authors included the same items we assigned to the metacognitive impairment dimension in our proposal. However, they retained item 6 and item 11 while removing item 13, placing them in the functional impairment dimension along with the other items that make up this factor in the Spanish sample. In summary, the 10-item version we propose for Spanish samples shows adequate psychometric properties and fits a three-factor model with good empirical fit. Thus, our proposal emerges as an optimal instrument for measuring CCA in the Spanish population.
Although we believe that our scale is more parsimonious, future studies should explore whether it is possible to differentiate a purely physiological dimension from a purely emotional (affective) dimension resulting from CCA. Nonetheless, the objective of this article was not to develop a new measure of CCA, but to provide a version comparable to the one originally developed for North American samples. To minimize potential bias, we employed robust estimation methods (WLSMV estimator suitable for ordinal data), evaluated model fit using multiple indices, inspected modification indices, and conducted bootstrap analyses to ensure the stability of parameter estimates for the internal structure model proposed. Other measurement tools, such as the scale proposed by Hogg et al. (Reference Hogg, Stanley, O’Brien, Wilson and Watsford2021, Reference Hogg, Stanley, O’Brien, Wilson and Watsford2023), may allow for such differentiation, which will need to be explored in future studies with Spanish samples.
Relationships Between the CCAS–S and Other Variables
Climate Change Anxiety, Depression, and Generalized Anxiety
Clayton and Karazsia (Reference Clayton and Karazsia2020) reported strong correlations between CCA and anxiodepressive symptoms, using a combined score. However, this mixed measure did not allow separate analysis of anxiety and depression. This approach can be problematic both theoretically and methodologically, as it does not distinguish the specific impact that depression and general anxiety could have on the CCA separately. To overcome this limitation, we evaluated both constructs separately and tested the combined measure, seeking comparability of results with the original work. To reinforce the results found regarding the internal structure of the scale, we also compared the relationships of the CCAS with depression, anxiety, and the combined measure, considering the two-factor and three-factor models. To do this, partial correlations were used, since they allow the relationship between variables to be analyzed, eliminating the effect of other factors. A relevant finding of our research is that, in the Spanish population, CCA showed a stronger correlation with generalized anxiety than with depression, a pattern also observed in studies conducted in France (Mouguiama-Daouda et al., Reference Mouguiama-Daouda, Blanchard, Coussement and Heeren2022). In the CCAS validation study in the German context, the authors used the same anxiety and depression items as the original version of the CCAS but separated the two anxiety items from the two depression items (Wullenkord et al., Reference Wullenkord, Tröger, Hamann, Loy and Reese2021). They found that, though weak, there was a significant correlation between the total score of the German version of the CCAS (composed of 12 items) and anxiety (r = .25) and depression (r = .21). In addition, they observed that climate anxiety was associated with the avoidance of climate change-related topics in daily life and with the frustration of basic psychological needs. However, for the Polish population, Larionow et al. (Reference Larionow, Sołtys, Izdebski, Mudło-Głagolska, Golonka, Demski and Rosińska2022) found that the cognitive and functional impairment subscales of the CCAS were positively correlated with depressive symptoms. This suggests that CAS may be more closely related to depression than anxiety in this population. However, a significant association was found in the Spanish samples with symptoms of generalized anxiety, a little stronger than with depression. Taken together, these results and those obtained in this research suggest that emotional distress associated with climate change may be more closely related to a typical worse anxious response accompanied, in addition, by feelings of sadness and helplessness. Unlike the original approach of Clayton and Karazsia (Reference Clayton and Karazsia2020), which combined the symptoms of anxiety and depression into a global score, we believe it is more appropriate to choose to analyze both constructs separately. This approach allows for an accurate identification of the specific impact of climate change anxiety relative to other forms of emotional distress. However, these findings should be interpreted with caution: though the relationships between the total CCAS–S scores and general measures of depression and anxiety were significant, their magnitude was small to moderate. Group mean comparisons by sex and by levels of anxiety and depression were conducted as additional source of validity evidence. As theoretically expected, individuals with higher general anxiety or depression, as well as women, reported higher levels of climate change anxiety. Although the effect sizes were modest, these results support the convergent and discriminant validity of the scale. Similarly, the partial correlations with external variables were generally small to moderate in magnitude, a pattern consistent with the multifactorial nature of climate change anxiety. Overall, these findings suggest that climate change anxiety is related to, but not redundant with, other constructs such as general anxiety or environmental concern, providing meaningful evidence of convergent and discriminant validity.
Climate Change Anxiety and Environmental Identity
Clayton and Karazsia (Reference Clayton and Karazsia2020) also showed that environmental identity was associated with cognitive–emotional impairment but had weak correlations with functional impairment. In the Spanish context, metacognitive impairment was the dimension that presents a closer relationship with environmental identity. This result suggests that people with a deeper connection with nature tend to experience more reflective and recurrent processing regarding the effects of climate change. Therefore, in light of these results, we can endorse the idea that people with a stronger environmental identity present higher level of concern for the environment (Clayton, Reference Clayton, Clayton and Opotow2003). Furthermore, according to our results, emotional distress also showed a significant correlation, indicating that people with a high environmental identity not only think more about climate change, but also experience a greater emotional impact from its consequences. Indeed, we believe our study supports the tenets of affective-cognitive engagement theory (Mishra & Tiwary, Reference Mishra and Tiwary2020), according to which emotions and cognitive processes interact to modulate intense emotional responses. In the case of climate change, stronger environmental identity appears to amplify both metacognitive reflections and emotional responses.
Climate Change Anxiety and Personal Experience
Clayton and Karazsia (Reference Clayton and Karazsia2020) found positive and significant correlations with both subscales of the CCAS (cognitive–emotional impairment and functional impairment) and the subscale of personal experience with climate change but not with behavioral engagement. In the Spanish version of the CCAS, functional interference is the dimension most closely linked to personal experience with climate change. These results may suggest that those who have experienced adverse climatic events encounter greater difficulties in carrying out their daily activities due to concerns about the environment. Indeed, previous studies have indicated that individuals with personal experiences of extreme weather events tend to report higher levels of climate anxiety (Asgarizadeh et al., Reference Asgarizadeh, Gifford and Colborne2023). Our data seem to reflect that when people perceive themselves as being directly affected by climate change, this perception acts as a factor that intensifies emotional and functional responses. In this regard, we believe that our findings highlight the need to pay attention to vulnerable groups who face a higher risk of functional interference due to their direct exposure to the impacts of climate change (e.g., agricultural or coastal communities). However, these results should be interpreted with caution, as our study did not compare two distinct groups of participants (those who perceive themselves as directly affected by climate change vs. those who do not), suggesting a future line of research. Although the sample was obtained through a nonprobabilistic procedure, our aim was to obtain validity evidence to support the use of CCAS–S in the Spanish context rather than to estimate population prevalence. Representativeness in this type of adaptation depends on the conceptual overlap of the construct which is confirmed by the analysis conducted.
Climate Change Anxiety and Pro-Environmental Behavior
Regarding the relationship between climate anxiety and specific behaviors (e.g., pro-environmental actions such as recycling or saving energy), which reflect behavioral engagement with climate change, Clayton and Karazsia (Reference Clayton and Karazsia2020) did not find a significant relationship between these variables. In the case of the CCAS–S, the results were consistent with this finding: none of the three dimensions identified in the CCAS structure showed a strong association with behavioral engagement. It is important to note that the observed partial correlations, though statistically significant, were of small-to-moderate magnitude. This suggests that climate change anxiety is related but not strongly linked to these external variables, which is consistent with the notion that it represents a distinct construct. Our specific results may help clarify the relationship between climate anxiety and behavior, as according to Hogg et al. (Reference Hogg, Stanley, O’Brien, Watsford and Walker2024) there are no clear findings in the literature in this regard. It is possible, as these authors suggest, that nonlinear associations may explain the relationship between these variables (Roberts et al., Reference Roberts, Poortinga and Williams2025), indicating that future research should devote more effort to exploring this direction. This result suggests that, though CCA generates significant distress, it does not necessarily translate into pro-environmental actions. Therefore, interventions aimed at promoting behavioral engagement with climate change should focus on other factors, such as increasing self-efficacy or environmental optimism (MacKinnon et al., Reference MacKinnon, Davis and Arnocky2022), rather than merely addressing the experience of anxiety or distress.
Conclusions
The Spanish version of the CCAS is presented as a valid and reliable instrument for assessing the construct of CCA through three distinct dimensions that relate differently to relevant variables: (1) emotional distress, more associated with depression and environmental identity; (2) metacognitive impairment, linked to repetitive thoughts, generalized anxiety, and deep environmental concerns; and (3) functional interference, related to the personal experience of climate change and its impact on daily life.
These findings have important implications for both clinical diagnosis and the design of public policies that address the psychological impact of climate change on the Spanish population. Furthermore, they highlight the need to differentiate between emotional, cognitive, and functional responses to understand and mitigate the effects of CCA. However, according to these findings, feeling anxiety or concern about climate change is not enough to motivate behavioral change. Rather, action appears to be driven by beliefs about one’s ability to influence the environment and a strong identification with nature. Future research should replicate the analyses in other Spanish-speaking countries to evaluate the cross-cultural equivalence of both the 13- and 10-item versions. These efforts will contribute to consolidating the theoretical and empirical understanding of climate change anxiety and its practical implications.
Supplementary material
The supplementary material for this article can be found at http://doi.org/10.1017/SJP.2026.10040.
Funding statement
This article was supported by the research project “Development of methods to improve the quality of health and social welfare measures in Andalusia: Validation of questionnaires for psychological surveys and assessments”, with reference: P20_00898, of the “Call for Projects of Excellence 2020”, of the General Directorate of Research and Knowledge Transfer, of the Junta de Andalucía (Spain).
The Mind, Brain and Behavior Research Center receives funding from grants CEX2023-001312-M by MCIU/AEI/10.13039/501100011033 and UCE-PP2023-11 by the University of Granada. Funding for Open Access charge: Universidad de Granada / CBUA.

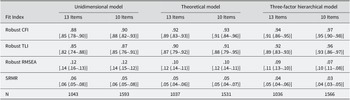
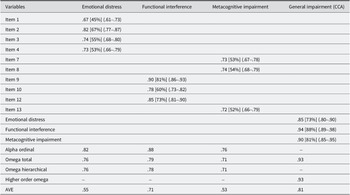

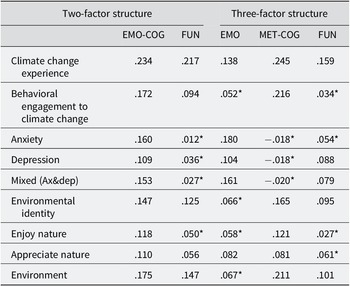
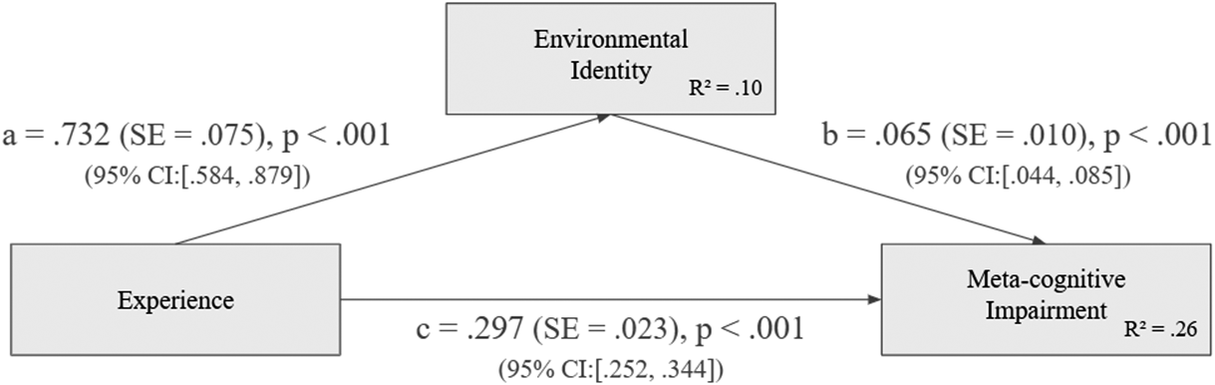


 Open access

