

1. Introduction
The complexity of design problem-solving is characterized by incomplete information, evolving constraints, and multiple feasible solutions (Reference BuchananBuchanan, 1992; Reference DorstDorst, 2006; Reference Hay, Cash and McKilliganHay et al., 2020). Unlike well-structured tasks that can be addressed through clear input-output mappings, the ill-structured tasks commonly confronted during the design process (Reference SimonSimon, 1973) require a continuous co-evolution or search through the problem-solution spaces (Hay et al., Reference Hay, Duffy, McTeague, Pidgeon, Vuletic and Grealy2017a). Consider creating an artifact for a user population: establishing an acceptable solution, often referred to as satisficing (Reference SimonSimon, 1996), arises because there is rarely a single ‘correct’ solution (Reference Farrell and HookerFarrell and Hooker, 2013). In practice, designers must iterate between clarifying the problem and proposing potential solutions - a dynamic process that defies a single, fixed mapping between inputs and outputs.
Numerous methods have been developed to study design cognition by focusing on the process of reasoning. For instance, linkography offers a rich qualitative approach by mapping and segmenting design activities into interlinked ideas (Reference GoldschmidtGoldschmidt, 2014; Reference Kan and GeroKan and Gero, 2017). Protocol studies, which trace verbal or written “think-aloud” processes, remains a cornerstone for understanding how designers generate, connect, and refine solutions (Reference Ericsson and SimonEricsson and Simon, 1993; Hay et al., Reference Hay, Duffy, McTeague, Pidgeon, Vuletic and Grealy2017a). However, these process-based methods typically assess how information flows and decisions are made, but do not by themselves evaluate the resulting design outcomes (Reference Nelson, Wilson, Rosen and YenNelson et al., 2009). In contrast, outcome-based methods do not directly measure the process itself, but provide indirect evidence of effective ideation by evaluating end results of ideation through metrics such as: novelty, variety, quality, and quantity (Reference Shah, Smith and Vargas-HernandezShah et al., 2003), but risk overlooking the depth and soundness of the designer’s reasoning.
The challenge of evaluating design cognition has been magnified by the rapid emergence of generative artificial intelligence and Large Language Models (LLMs) (Reference Regenwetter, Nobari and AhmedRegenwetter et al., 2022; Reference Siddharth, Blessing and LuoSiddharth et al., 2022; Reference Figoli, Bruggeman, Rampino and CiuccarelliFigoli et al., 2025). Although LLMs offer linguistic fluency and large-scale pattern matching, it is unclear whether they replicate or even approximate the reasoning processes found in human design cognition. Conventional outcome-based measures may prematurely validate an LLM’s generated solution without interrogating the integrity of its intermediate reasoning; conversely, translating protocol-based methods to AI systems is non-trivial - linkography or verbal protocols hinge on human ideation and verbalization, which LLMs do not strictly emulate. Being able to robustly evaluate LLMs beyond qualitative heuristics (Reference Hay, Cash and McKilliganHay et al., 2020; Reference Regenwetter, Nobari and AhmedRegenwetter et al., 2022) is becoming increasingly important as they take on a more prominent role in the design process.
We introduce a probabilistic method for quantitatively evaluating the development of knowledge during design problem-solving, integrating both process-oriented and outcome-oriented perspectives. Building upon Bruggeman et al. Reference Han, Bruggeman, Peper, Ciliotta, Marion, Ciuccarelli and Moghaddam(2023)’s cognitive model of design inferences, we propose using soundness and completeness metrics to capture how thoroughly a reasoning process applies knowledge to arrive at possible solutions. Specifically, we examine the use of deductive, inductive, and abductive inference mechanisms as a measurable basis for comparing designers and LLMs in a complex, ill-defined task: eliciting latent user needs from product reviews (Reference CarlgrenCarlgren, 2013). Need identification is the starting point leading to the creation of artifact models and the selecting amongst alternatives (Reference Papalambros and WildePapalambros and Wilde, 2017). Unlike explicit needs, latent needs lie hidden beneath indirect user feedback and can unexpectedly delight or surprise users (Reference Han and MoghaddamHan and Moghaddam, 2021). However, given the non-obvious nature in identifying the unmet need that delivers unexpected value in the future, latent need finding requires the assimilation of needs that can only ever be “better-or-worse” than one another and not definitively true (Reference Han, Bruggeman, Peper, Ciliotta, Marion, Ciuccarelli and MoghaddamBruggeman et al., 2023). Thus, being able to process such disparate information (e.g., material cost, sustainability, user lifestyle) into a coherent need provides a desirable ill-structured setting to observe designer ideation.
To evaluate the probabilistic method, we conduct a multi-stage empirical study of human and LLM-based design reasoning during the latent need finding task. We first perform a protocol with experienced designers, documenting their application of reasoning during the generation of latent needs. Next, we ran a series of workshops where designers independently traced each solution’s underlying logic to validate its consistency with the available data. We then replicate these tasks with two variations of LLMs (a standard GPT-4o model and a “prompted” GPT-4o with additional cognitive guidance). Finally, we conduct a rank-order survey to assess the generated solution spaces by measuring which latent needs were uncovered and how thoroughly they spanned the design space. Collectively, these studies provide a detailed comparison of how different reasoning approaches - human or machine - balance logical soundness and coverage of the design space in real-world problem-solving scenarios.
2. Background
Designers often face ill-structured problems, where both the problem statement and potential solutions are only partially defined and evolve throughout the design process (Reference Simon and SimonSimon, 1977; Reference Dorst and CrossDorst and Cross, 2001). One widely accepted perspective is that design cognition proceeds through a co-evolution of problem and solution spaces, in which the process of exploring possible solutions reshapes the understanding of the problem, while refining or reframing the problem in turn suggests new solution directions (Reference Dorst and CrossDorst and Cross, 2001; Reference Cash, Gonçalves and DorstCash et al., 2023). Highlighting iterative feedback loops that guide both problem definition and solution generation, developing new insights into the problem space (e.g., uncovering hidden constraints or user needs) can spur novel solution ideas, while experimenting with preliminary solutions can expose new dimensions of the design problem.
From a reasoning standpoint, designers employ a process composed of reasoning steps, occurring from the moment they are given an initial problem statement, to when they realize their solution (Reference Gonçalves and CashGoncalves and Cash, 2021). This process has been described as a discrete end-to-end search or continual exploration, wherein the former process is often portrayed as a sequence from problem space to solution space, and the latter is more circular or iterative (Hay et al., Reference Hay, Duffy, McTeague, Pidgeon, Vuletic and Grealy2017b). In either interpretation, designers draw on abstract knowledge structures that combine declarative and procedural knowledge to develop a mental schema (Reference Simon and SimonSimon, 1977; Reference Ball, Ormerod and MorleyBall et al., 2004). This schema guides the mapping from the external problem context to an abstract space, in order to cluster and categorize key characteristics. The process of moving between these levels of abstraction leverages various forms of inference, including inductive, deductive, abductive, and sometimes analogical reasoning (Reference Khorshidi, Shah and WoodwardKhorshidi et al., 2014; Reference Kroll, Le, Weil and MagnaniKroll et al., 2023).
Three notable inference mechanisms employed during the design reasoning process are induction, deduction, and abduction (Reference Koskela, Paavola, Kroll, Vermaas and VialKoskela et al., 2018). Deduction derives conclusions b from known premises a, induction infers that a generally causes b, and abduction offers a plausible explanation a for the observation of b (Reference MarchMarch, 1976; Reference PiercePierce, 1933). March Reference March(1976) proposed a model wherein designers create artifacts by abduction, predict performance using deduction, and accumulate knowledge through induction. Other models adjust this sequence; for instance, Roozenburg Reference Roozenburg(1993) begins with induction, proceeds with abduction, and concludes with deduction. Dorst Reference Dorst and Cross(2011) captures the interplay of these inference mechanisms through a conceptual formula in which the designer’s goal (the “value” to be achieved) is first induced from context, which leads to deduction to derive how to implement that goal, and ultimately drives abduction to envision the artifact. In our work, given the continual nature of the design space, we treat each inference as occurring without a formal order or starting inference. Empirical findings suggest that these mechanisms play distinct roles at different design stages. Abductive reasoning is critical early on for framing the problem and identifying key constraints (Reference Cramer-Petersen, Christensen and Ahmed-KristensenCramer-Petersen et al., 2019), thereby supporting co-evolution between problem and solution. Deductive reasoning then helps assess the technical feasibility or viability of potential solutions as they become more concrete. For instance, Dong et al. Reference Dong, Lovallo and Mounarath(2015) found that committees relying on abduction were more open to innovative or unconventional proposals than those confined by strict deductive logic, which often led to risk-averse decisions. Importantly, the flexibility to move between inductive, deductive, and abductive inferences enables designers to iteratively refine their problem understanding while also evolving promising solutions in parallel (Reference Bruggeman, Ciliotta, Marion and CiuccarelliBruggeman et al., 2024). By emphasizing the fluid and co-evolutionary nature of problem and solution spaces, these theoretical and empirical perspectives inform how designers organize their cognitive strategies, balance risk and creativity, and ultimately arrive at robust outcomes.
3. Design Reasoning During Problem-Solving
We characterize problem-solving as a cycle of inferences that jointly evolve designers’ understanding of the problem and possible solutions. We adopt the knowledge-based view of these mechanisms (Reference Takeda, Yoshioka and TomiyamaTakeda et al., 2001; Reference Bruggeman, Ciliotta and CiuccarelliBruggeman et al., 2023), where knowledge includes (i) concrete information (e.g., user statements), (ii) recognized constraints (e.g., brand or technical requirements), and (iii) emerging goals or hypotheses. Designers repeatedly form, test, and refine their knowledge through the three inferences:
Deduction ( if a then b): Designers derive logical conclusions when both information and constraints are known, such as categorizing a user’s mention of “leather” under material. In many of our observations, designers methodically test whether each user statement points to a known property or attribute.
Abduction ( a explains b): Designers generate plausible explanations when some desired outcome or high-level pattern is observed, but the underlying cause is uncertain. For instance, if user comments indicate material, perceived value, product familiarity, and product cost all converge, an abductive leap might be: “Cost affects material value perception.” Here, the proposition a entails b is reversed, so a (cost) explains b (material perception).
Induction ( infer b from a): Designers generalize across multiple observations or explanations to infer broader design principles or constraints. Building on the previous example, once they hypothesize “cost affects material value perception,” induction helps them conclude that “familiarity over time raises expectations of quality and price perception,” which then informs subsequent design decisions.
In practice, designers continuously iterate among these three inferences to structure raw information into knowledge to propose or evaluate design concepts. As an example, consider a set of user complaints regarding shoe comfort and durability. Deduction may identify specific categories (e.g., “leather” implies material), abduction can propose that “excessive wear” might be the root cause of discomfort, and induction further generalizes that customers expect consistent material quality over time.
3.1. Soundness and Completeness in Design Reasoning
Building on this inference-based perspective, Bruggeman et al. Reference Bruggeman, Ciliotta and Ciuccarelli(2023) propose two foundational properties of well-formed design reasoning. Soundness refers to the logical consistency of each inference step: each conclusion follows validly from the knowledge a designer holds. For instance, if a designer deduces that frequent complaints about ankle support imply a need for sturdier sidewalls, then that claim must not conflict with the constraints or facts already established (e.g., existing brand requirements or contradictory user data). Completeness pertains to the breadth of coverage across all relevant information and constraints. Especially in ill-structured design problems, failing to account for certain user groups or hidden constraints can leave critical needs overlooked (Reference Gero, Kannengiesser and CrillyGero et al., 2022). For example, if a design team ignores feedback about shoe fit among long-distance runners, their final solution might be unsuitable for a major segment of users. Thus, completeness ensures that no essential piece of knowledge is left out when exploring potential design directions. Together, these properties ensure each inference step is well-grounded (soundness), while also requiring that the entire problem space and its possible solutions are sufficiently explored (completeness).
3.2. Knowledge State Evaluation through Soundness and Completeness
While logical bases of soundness and completeness specify how each inference should behave in principle, practical design reasoning often unfolds under uncertainty - where information is incomplete, constraints can shift, and the final set of possible solutions is not fully known at the start. To accommodate this reality, we introduce a probabilistic framework that interprets the logical transitions among knowledge states in terms of likelihoods, and quantifies how comprehensively a designer explores the space of possible needs or solutions.
Suppose the design process is captured by a sequence of knowledge states k0 → k1 →…→kn , where each ki reflects what the designer currently knows or believes about the problem. In a purely logical model, transitions from ki-1| to ki are valid only if they do not violate established facts or constraints. However, real-world design sessions sometimes include tentative, ambiguous, or partial inferences that are not easily codified. Hence, we assign a transition probability P(ki | ki-1) that represents how likely the designer’s move is to maintain logical consistency given the incomplete or uncertain nature of the situation. Although we are no longer explicitly mapping information, constraints, and goals to a next state, the essence of deduction, induction, and abduction remains. Each step can be interpreted as a conditional probability:
P(ki | k i-1, Deduction) = P(b|a, →) : reflecting a deductive update, where → is “if…then…”;
P(ki | k i-1, Induction) = P(a|b, ←) : reflecting an inductive update, where ← is “infer…from…”;
P(ki | k i-1, Abduction) = P(b| a, ⇝) : reflecting an abductive update, where ⇝ is “…explains…”,
wherein we can then combine or weight these conditional probabilities as a function f(·) to derive the overall transition probability:
 $$P(k_i \mid k_{i - 1} ) = f(P(k_i \mid k_{i - 1} ,\;{\rm{ \textsf Deduction}}),P(k_i \mid k_{i - 1} ,\;{\rm{\textsf Induction}}),P(k_i\! \mid\! k_{i - 1} ,\;{\textsf{Abduction}}))$$
This flexible design thus allows researchers to account for uncertainties in each inference mechanism wherein reasoning may only be partly justified:
 $${\rm{Soundness:}}\quad {\mathscr S}(k_n ) = \mathop \prod \limits_{i = 1}^n P(k_i \mid k_{i - 1} ),$$
where ${\mathscr S}(k_n )$
aggregates the probabilities of each step being valid. In practice, one might estimate these probabilities by examining how frequently designers’ inferred claims are consistent with available data or constraints; for instance, via protocol analysis or expert judgments. The product form in (2) parallels a chain of logical inferences: any single step that is deemed improbable (e.g., a leap that contradicts observed user data) lowers the overall soundness measure.
${\mathscr S}(k_n )$
aggregates the probabilities of each step being valid. In practice, one might estimate these probabilities by examining how frequently designers’ inferred claims are consistent with available data or constraints; for instance, via protocol analysis or expert judgments. The product form in (2) parallels a chain of logical inferences: any single step that is deemed improbable (e.g., a leap that contradicts observed user data) lowers the overall soundness measure.
Just as real design challenges involve uncertain knowledge transitions, they also require identifying all relevant insights. We thus define a completeness metric, ${\mathscr C}(k_n )$
, which captures how thoroughly the final knowledge state kn
covers the full range of relevant information, constraints, or potential user needs:
${\mathscr C}(k_n )$
, which captures how thoroughly the final knowledge state kn
covers the full range of relevant information, constraints, or potential user needs:
 $${\text {Completeness:}}\quad {\mathscr C}(k_n ) = {{| {\cup} (k_n)|} \over {| { \textΩ} |}},$$
where ∪(k
n
) represents the union of knowledge the designer has actually incorporated by the end of the process and Ω. is the space of all possible knowledge. This fraction can be interpreted as the proportion of the “design space” that the designer has adequately addressed in their generated idea. Although we may not always know the value of every possible latent need within Ω, in practice ${\mathscr C}(k_n )$
can be approximated through comparative evaluation methods such as rank-order surveys or a catalog of potential constraints derived from domain experts, where independent raters evaluate ideas against one another based on the breadth and depth of knowledge the idea contains.
${\mathscr C}(k_n )$
can be approximated through comparative evaluation methods such as rank-order surveys or a catalog of potential constraints derived from domain experts, where independent raters evaluate ideas against one another based on the breadth and depth of knowledge the idea contains.
4. Evaluation & Results
We conduct a series of studies to evaluate ${\mathscr S}(k_n )$
and
${\mathscr S}(k_n )$
and ${\mathscr C}(k_n )$
in measuring design reasoning during problem-solving. To study soundness, we first held a protocol study wherein designers used annotated user reviews to elicit explicit and latent user needs. Following the protocol study, we held workshops where designers were tasked with inferring the annotations used to generate a latent user need - essentially inverting the protocol task. Concurrently with the protocol and workshop, we employ GPT-4o (4o) (Reference Nelson, Wilson, Rosen and YenOpenAI, 2023) and a cognitively prompted GPT-4o (Prompt) to simulate the same tasks as the protocol and workshop designers. By having participant groups record their annotation usage during their analysis in each setting, we capture the implicit and explicit inferences made when processing available information to derive possible needs. To evaluate completeness, we conducted a rank-order survey, where participants assessed the latent user needs generated by the protocol study designers, GPT-4o, and Prompt-4o. By analyzing the distribution and ranking of needs, we measure how different reasoning approaches cover the possible design space.
${\mathscr C}(k_n )$
in measuring design reasoning during problem-solving. To study soundness, we first held a protocol study wherein designers used annotated user reviews to elicit explicit and latent user needs. Following the protocol study, we held workshops where designers were tasked with inferring the annotations used to generate a latent user need - essentially inverting the protocol task. Concurrently with the protocol and workshop, we employ GPT-4o (4o) (Reference Nelson, Wilson, Rosen and YenOpenAI, 2023) and a cognitively prompted GPT-4o (Prompt) to simulate the same tasks as the protocol and workshop designers. By having participant groups record their annotation usage during their analysis in each setting, we capture the implicit and explicit inferences made when processing available information to derive possible needs. To evaluate completeness, we conducted a rank-order survey, where participants assessed the latent user needs generated by the protocol study designers, GPT-4o, and Prompt-4o. By analyzing the distribution and ranking of needs, we measure how different reasoning approaches cover the possible design space.
4.1. Soundness Study
Experiment. The protocol study was conducted with 10 experienced designers (5+ years in user experience research), split equally between two protocol groups (PI and P2). Each protocol used 10 different online shoe reviews, annotated using Reference Han, Bruggeman, Peper, Ciliotta, Marion, Ciuccarelli and MoghaddamHan et al. (Reference Han, Bruggeman, Peper, Ciliotta, Marion, Ciuccarelli and Moghaddam2023)’s sentiment analysis model that partitions sentences into:
Aspect (ASP): the objective target of the sentence, usually a noun or verb, ex. ‘shoelace’ or ‘run’;
Opinion (OP): the user’s subjective statement in the sentence, such as ‘I like…’ or ‘We felt…’;
Sentiment (SEN): tags the OP term as either having positive, negative, or neutral sentiment;
Category (CAT): tags the ASP term as member to one of the products ontological categories, e.g., ‘leather’ is categorized under Appearance (Material).
PI contained 81 total annotations (47 OP, 15 ASP, 16 CAT, 3 SEN), and P2 contained 82 (50 OP, 14 ASP, 15 CAT, 3 SEN). The designers were asked to elicit any possible latent user needs using the annotations and order them from most to least likely to be the latent need. During each 2-hour session, we recorded designers’ verbal and visual reasoning on Microsoft Teams and Miro. We tracked their explicit use of annotations and all elicited needs and recorded the results.
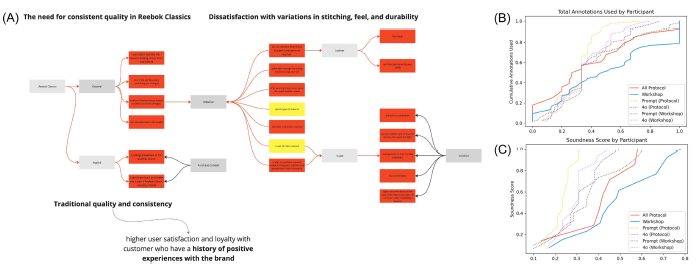
Following the protocol study, we conducted three workshops with 30 designers (in pairs) to evaluate the soundness of protocol-generated latent needs. Participants, representing a mix of students, academics, and professionals, inferred the inference patterns by identifying which annotations likely contributed to the selected latent user need. The participants could track the annotations using visual maps, lists, tables, or descriptive statements (Figure 1A). This provided an independent validation of reasoning soundness, determining whether the process used to generate the solution in the protocol is the same as that being assessed in an outcome-based setting.
To compare human reasoning with artificial cognition, we simulated both tasks using 4o. Previous research has highlighted the cognitive challenges inherent in prompting LLMs to achieve the users goals, especially for complex tasks with ill-defined objectives (Reference Subramonyam, Pea, Pondoc, Agrawala and SeifertSubramonyam et al., Reference Subramonyam, Pea, Pondoc, Agrawala and Seifert2024). This difficulty arises because the underlying actions that lead to a goal can be hard to define. In response to this, we explored prompt engineering strategies for 4o, leveraging the cognitive actions we observed being utilized by the protocol designers. Using the ontology created by Reference Hay, Duffy, McTeague, Pidgeon, Vuletic and GrealyHay et al. (Reference Hay, Duffy, McTeague, Pidgeon, Vuletic and Grealy2017b) of design cognitive actions, we used thematic analysis (Reference SaldañaSaldaña, 2009) to code the actions of one of the designer’s protocol transcripts and create a prompt. The goal was to assess whether explicit cognitive guidance could align the LLMs reasoning and solutions with that of human designers.
To simulate the protocol, each model was tasked with generating a list of explicit and latent user needs while tracking annotation usage in a table. We randomly selected 10 trials, 5 from each review set (matching the protocol). To simulate the workshop, each model evaluated the same latent need by listing their perceived designer annotation usage and providing an argument. Similarly, 15 responses were randomly selected matching the number of workshop groups. All LLM tasks used few-shot prompting (i.e. 2 examples of the task; thus matching the number of demonstrations we showed designers during the protocol and workshop on-boarding) with 500 max tokens for generation and 0.7 temperature.
Evaluation. We evaluated the soundness of designers’ reasoning by examining how often and in what ways they drew upon the four available annotation types (ASP, OP, SEN, CAT) while eliciting latent user needs. Since there is no definitive “correct” latent need, our focus is on internal logic-whether participants systematically utilized or neglected critical annotations in forming their inferences. Specifically, for each participant we define a distribution p = (p Asp , p Op , p Cat , p Sen ), where pi is the proportion of the total annotation usage allocated to annotation category i. A higher p Asp , for example, means a participant more frequently relied on aspects (ASP) in developing their needs. From these per-participant distributions, we then aggregate at the group level (e.g., designers in Protocol vs. Workshop, or human vs. LLM) to determine how consistently each group harnesses the available information and constraints. Even though we cannot label any single annotation as definitively “right” or “wrong,” analyzing how p varies across participants and groups reveals meaningful patterns in cognitive emphasis.
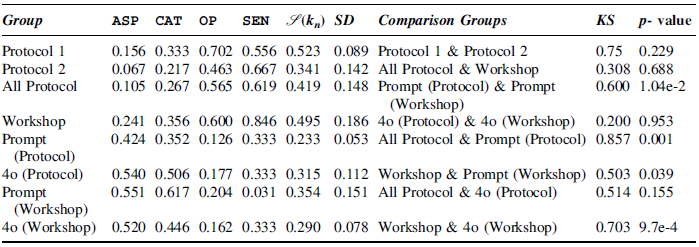
Finally, we use empirical cumulative distribution functions (ECDFs) and the Kolmogorov-Smirnov (KS) test to compare these group-level distributions (see Table 1). As a nonparametric method, KS does not require assumptions of normality or a linear relationship, making it well-suited to determine group differences in our relatively small dataset. Under this framework, usage of annotation categories can be interpreted as soundness ${\mathscr S}(k_n )$
, where a skewed or erratic distribution may indicate weaker internal logic or selective neglect of available information.
${\mathscr S}(k_n )$
, where a skewed or erratic distribution may indicate weaker internal logic or selective neglect of available information.
On the left: the average use of ASP , CAT , OP , SEN by each study group. We take the standard deviation (SD) for the. ${\mathscr S}$
of each participant in the group. To the right is the Kolmogorov-Smirnov test (KS) results comparing groups
${\mathscr S}$
of each participant in the group. To the right is the Kolmogorov-Smirnov test (KS) results comparing groups

Results. The two human protocol groups were the smallest by participant count (5 each), thus resulting in a large KS. However, we observe consistent patterns of annotation usage (p > 0.1) where opinion and sentiment were predominant, suggesting a broadly shared approach to inferring latent user needs. Workshop participants - tasked with inferring the logic behind each solution - show soundness values ${\mathscr S}(k_n )$
= 0.495) close to the overall protocol average (0.419). The KS statistic all protocol to workshop participants is low (0.308, p = 0.688), reinforcing that human reasoning processes remain coherent whether they are generating or evaluating needs.
${\mathscr S}(k_n )$
= 0.495) close to the overall protocol average (0.419). The KS statistic all protocol to workshop participants is low (0.308, p = 0.688), reinforcing that human reasoning processes remain coherent whether they are generating or evaluating needs.
In contrast, both 4o and Prompt-4o exhibit significantly different usage distributions (often with p < 0.1 and KS > 0.5) compared to the human groups. Although the protocol group comparison KS is large, the p is significantly greater than 0.1. Their average ${\mathscr S}(k_n )$
is notably lower (0.298) than the human average of 0.445, indicating that they employ a narrower subset of annotations. Moreover, the steeper ECDF curves for LLM groups (see Figure 1) point to more rigid, less balanced annotation usage-focusing predominantly on certain annotation types while neglecting others. Notably, GPT-4o’s consistency between protocol and workshop simulated tasks (KS = 0.20, p = 0.953) shows that it behaves similarly across different phases of the design exercise, similar to that of the protocol and workshop humans. There is never one universally applicable latent user need (as discussed in Section 1), making it impractical to judge whether individual annotation choices are correct or incorrect in absolute terms. Instead, soundness in this context refers to a designer’s internal consistency: does the designer (or LLM) repeatedly draw on available information and constraints to form a coherent latent user need “idea”? Our nonparametric approach captures the overall consistency of how each group distributed attention across available resources. Thus, while a higher
${\mathscr S}(k_n )$
is notably lower (0.298) than the human average of 0.445, indicating that they employ a narrower subset of annotations. Moreover, the steeper ECDF curves for LLM groups (see Figure 1) point to more rigid, less balanced annotation usage-focusing predominantly on certain annotation types while neglecting others. Notably, GPT-4o’s consistency between protocol and workshop simulated tasks (KS = 0.20, p = 0.953) shows that it behaves similarly across different phases of the design exercise, similar to that of the protocol and workshop humans. There is never one universally applicable latent user need (as discussed in Section 1), making it impractical to judge whether individual annotation choices are correct or incorrect in absolute terms. Instead, soundness in this context refers to a designer’s internal consistency: does the designer (or LLM) repeatedly draw on available information and constraints to form a coherent latent user need “idea”? Our nonparametric approach captures the overall consistency of how each group distributed attention across available resources. Thus, while a higher ${\mathscr S}(k_n )$
does not guarantee optimal solutions, it indicates more thorough and balanced usage of the problem cues - aligned with the notion that ill-structured problems benefit from systematic exploration of the available data. The distinction in reasoning patterns thus allows us to ask whether this translates to differences in idea coverage and whether observed lower
${\mathscr S}(k_n )$
does not guarantee optimal solutions, it indicates more thorough and balanced usage of the problem cues - aligned with the notion that ill-structured problems benefit from systematic exploration of the available data. The distinction in reasoning patterns thus allows us to ask whether this translates to differences in idea coverage and whether observed lower ${\mathscr S}(k_n )$
values indicate limitations in how thoroughly the design space is explored.
${\mathscr S}(k_n )$
values indicate limitations in how thoroughly the design space is explored.
(A) Example of a visual map a workshop designer made. (B) ECDF plot of annotations used by participant per group. (C) Soundness measure for each participant per group

4.2. Completeness Study
Experiment. To examine whether sounder reasoning processes translate into a broader range of considered needs, we conducted a rank-order survey comparing the final outputs of three groups: (1) human designers (Protocol), (2) GPT-4o, and (3) Prompt 4o. Participants (N=43) viewed six randomly selected needs per question (two per group) across five questions, for a total of 990 rankings. Each need was truncated to 15-20 words and rated on a latency scale from 1 (most latent) to 6 (least latent). Before ranking, participants reviewed a standardized set of product reviews as well as a short definition of “latent needs,” ensuring a consistent understanding of the evaluation criteria.
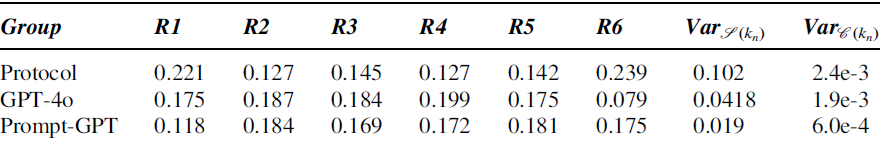
Evaluation. Table 2 summarizes the ranking distributions with the corresponding variance measures: Var ${\mathscr S}(k_n )$
for the annotation distribution and Var
${\mathscr S}(k_n )$
for the annotation distribution and Var ${\mathscr C}(k_n )$
for the final solution sets. In line with our framework, completeness is reflected by the breadth of idea coverage across varying degrees of latency: higher variance in the final rankings indicates greater spread from highly novel (Rl) to more obvious (R6) needs. We then check whether higher Var
${\mathscr C}(k_n )$
for the final solution sets. In line with our framework, completeness is reflected by the breadth of idea coverage across varying degrees of latency: higher variance in the final rankings indicates greater spread from highly novel (Rl) to more obvious (R6) needs. We then check whether higher Var ${\mathscr S}(k_n )$
correlates with higher Var
${\mathscr S}(k_n )$
correlates with higher Var ${\mathscr C}(k_n )$
.
${\mathscr C}(k_n )$
.
Rank results from the survey. Variance = Var

Results. The Protocol group exhibits the highest variance in both their inferred reasoning patterns (Var ${\mathscr S}(k_n )$
= 0.102) and the final rank-order distribution of needs (Var
${\mathscr S}(k_n )$
= 0.102) and the final rank-order distribution of needs (Var ${\mathscr C}(k_n )$
) = 2.4 × 10⁻³). They also show the largest coverage at both extremes (Rl=22.1%, R6=23.9%). This wide spread suggests that designers, leveraging a sounder process (
${\mathscr C}(k_n )$
) = 2.4 × 10⁻³). They also show the largest coverage at both extremes (Rl=22.1%, R6=23.9%). This wide spread suggests that designers, leveraging a sounder process ( ${\mathscr S}(k_n )$
= 0.419), are better able to uncover, articulate, and propose needs ranging from immediately obvious to deeply hidden or surprising. In other words, their completeness arises from exploring multiple facets of the problem space.
${\mathscr S}(k_n )$
= 0.419), are better able to uncover, articulate, and propose needs ranging from immediately obvious to deeply hidden or surprising. In other words, their completeness arises from exploring multiple facets of the problem space.
4o’s solutions cluster around the middle of the ranking scale. While it achieves moderate variance (Var ${\mathscr C}(k_n )$
= 1.9 × 10⁻³), it produces fewer highly novel or extremely explicit needs (notable mid-ranking peaks at R2=18.7% and R4=19.9%). This “safe” reasoning correlates with the lower Var
${\mathscr C}(k_n )$
= 1.9 × 10⁻³), it produces fewer highly novel or extremely explicit needs (notable mid-ranking peaks at R2=18.7% and R4=19.9%). This “safe” reasoning correlates with the lower Var ${\mathscr S}(k_n )$
= 0.0418, suggesting that although GPT-4o can parse user feedback effectively, it tends to offer an “averaged” coverage of needs, possibly limiting its reach into more extreme latent insights. The Prompt-4o variant, which was given additional guidance, showed the lowest variance (Var
${\mathscr S}(k_n )$
= 0.0418, suggesting that although GPT-4o can parse user feedback effectively, it tends to offer an “averaged” coverage of needs, possibly limiting its reach into more extreme latent insights. The Prompt-4o variant, which was given additional guidance, showed the lowest variance (Var ${\mathscr C}(k_n )$
) = 6.0 × 10⁻⁴). Most of its proposed needs occupied middle to somewhat-latent territory, rarely reaching the extremes. This outcome indicates that structured prompting can guide 4o to use annotations more explicitly, but does not necessarily enrich the breadth of ideas.
${\mathscr C}(k_n )$
) = 6.0 × 10⁻⁴). Most of its proposed needs occupied middle to somewhat-latent territory, rarely reaching the extremes. This outcome indicates that structured prompting can guide 4o to use annotations more explicitly, but does not necessarily enrich the breadth of ideas.
By traversing a broader range of available information, designers can surface latent needs across the entire spectrum, from highly novel to straightforward. In contrast, LLMs (with or without added cognitive prompts) often concentrate on mid-tier needs. Taken together, these results highlight the potential value of more human-like reasoning in achieving a truly complete exploration of the design space. A qualitative analysis of the highest and lowest-ranked needs highlights these findings, showcasing fundamental differences in reasoning depth and idea quality between human designers and LLMs. Consider the most frequent top-ranked needs by group (Ri = # times need was ranked at position):
40: “Consumers desire shoes that balance aesthetic appeal with functional comfort, accommodating various activities and foot sizes, without compromising quality or appearance.” (Rtop = 15), Prompt-4o: “Comfort and style are praised, yet issues with sizing, design flaws, and inadequate fit for wide feet impact overall satisfaction.” (Rtop = 10),
Protocol: “Connecting people through targeted reviews, like nurses endorsing shoes, enhances trust without alienating loyal customers or ignoring new feedback.” (Rtop = 13).
While LLMs focused on surface-level product attributes, human designers demonstrated deeper contextual understanding, connecting product features to brand perception and user trust. This distinction becomes more evident in the most frequently bottom-ranked needs:
4o: “Consumers desire shoes that combine visual appeal with functional adaptability, accommodating various activities and foot shapes without sacrificing comfort.” (Rbottom = 6),
Prompt-4o: “Address sizing, noise, and design for shoes that are visually appealing and comfortable for wide feet.” (Rbottom = 13),
Protocol: “Users expect consistent quality and comfort from familiar shoes, maintaining high expectations for material quality and price over time.” (Rbottom = 15).
LLMs largely reframed their top-ranked observations with synonymous language (e.g., “aesthetics” to “visuals”), while human designers explored fundamentally different dimensions like long-term customer loyalty and evolving quality expectations. Even with cognitive prompting, LLMs remained constrained to immediate product attributes, though Prompt-GPT showed marginally more specific observations (e.g., “wide feet” vs. GPT-4’s “various foot sizes”). Human designers’ ability to generate both obvious and deeply latent needs - evidenced by their broader ranking distribution - suggests that sound reasoning patterns enable more complete exploration of the latent need idea space. The LLMs’ narrower focus on immediate product attributes, as indicated by their reliance on CAT annotations over OP annotations, indicates limitations in their ability to reason about emergent user needs, despite their linguistic fluency.
5. Discussion & Conclusion
Discussion. Our findings underscore the multifaceted nature of design cognition and the utility of combining both soundness and completeness metrics to evaluate it. By recognizing that designers operate in ill-structured contexts where no single “correct” solution exists, we have shown how a probabilistic framework can capture the partial, evolving inferences that underlie human or Al-driven ideation. The soundness metric ( ${\mathscr S}(k_n )$
) highlights internal logic within each group’s reasoning process. Rather than judging individual annotation usage as right or wrong, we quantify how systematically designers (or LLMs) draw upon available data. This approach aligns with the inherent ambiguity of eliciting latent needs: because ground-truth needs are unknown, the ability to distribute reasoning as information becomes available is a central indicator of idea quality (Reference Nelson, Wilson, Rosen and YenNelson et al., 2009). Meanwhile, the completeness metric (
${\mathscr S}(k_n )$
) highlights internal logic within each group’s reasoning process. Rather than judging individual annotation usage as right or wrong, we quantify how systematically designers (or LLMs) draw upon available data. This approach aligns with the inherent ambiguity of eliciting latent needs: because ground-truth needs are unknown, the ability to distribute reasoning as information becomes available is a central indicator of idea quality (Reference Nelson, Wilson, Rosen and YenNelson et al., 2009). Meanwhile, the completeness metric ( ${\mathscr C}(k_n )$
) gauges how thoroughly participants cover the design space, as observed through a rank-order survey of latent needs. The broad distribution of solution rankings for human designers - spanning both very novel and clearly obvious needs - corresponds to a higher completeness score, thus better engaging with the broad complex of latent needs (Reference Lin and SeepersadLin and Seepersad, 2007). LLM-based outputs, by contrast, skewed toward middling or relatively uniform needs, signaling gaps in how thoroughly these models scanned the space of potential ideas.
${\mathscr C}(k_n )$
) gauges how thoroughly participants cover the design space, as observed through a rank-order survey of latent needs. The broad distribution of solution rankings for human designers - spanning both very novel and clearly obvious needs - corresponds to a higher completeness score, thus better engaging with the broad complex of latent needs (Reference Lin and SeepersadLin and Seepersad, 2007). LLM-based outputs, by contrast, skewed toward middling or relatively uniform needs, signaling gaps in how thoroughly these models scanned the space of potential ideas.
Although LLMs performed comparably in some areas (e.g., coherent text generation), their struggles to identify deeply hidden needs reflect the importance of human-like inference diversity. To better integrate LLMs into design processes, developers might incorporate explicit reasoning modules with attention, or combine LLM outputs with human oversight to guard against overly convergent or generic solutions. A promising avenue is the co-creative pipeline: combining the breadth and generative speed of LLMs with the reflective, integrative capacities of human designers. Our metrics of soundness and completeness could serve as feedback mechanisms to ensure each partner - artificial intelligence or human - remains thorough and logically consistent, especially as iterative co-design cycles unfold.
Conclusion. In this paper, we presented a unified framework for quantitatively evaluating soundness and completeness during design problem-solving, showcasing how deductive, inductive, and abductive inferences operate congruently to uncover latent user needs. By combining a protocol-based analysis with rank-order surveys, we demonstrated that human designers exhibit robust and comprehensive reasoning processes that differ from current LLM capabilities in detecting deeply latent or innovative needs. Though LLMs displayed linguistic agility, their narrower distribution of ideas and heavier reliance on particular annotations underscore the limitations in design reasoning. Future research should thus focus on understanding and enriching deep learning models in problem-solving through increasingly complex design spaces.
Acknowledgments
This material is based upon work supported by the National Science Foundation under the Engineering Design and System Engineering (EDSE) Grant No. 2050052. Any opinions, findings, conclusions, or recommendations expressed in this material are those of the author(s) and do not necessarily reflect the views of the National Science Foundation.


 Open access