

1. Introduction
Ice presently covers about 10% of Earth‘s terrestrial surface and contains more than 70% of the fresh water on our planet. A number of major ice ages have occurred in the past, with perhaps the most severe existing between 850 and 630 × 106 years ago (Proterozoic Era;Cryogenian Period), when glacial ice sheets may have reached the equator (Reference Hoffman, Kaufman, Halverson and SchragHoffman and others, 1998;Reference Hoffman and SchragHoffman and Schrag, 2002). Glacial ice contains a chronological archive of atmospheric conditions when the snow responsible for the ice fell to the surface. Chemical constituents (i.e. ions, gases) trapped within glacial ice provide a unique record of climate, which has become of particular interest owing to the rate at which Earth is presently warming. In addition to geochemical chronology, biological material such as pollen grains, fungal spores, viruses and bacteria (e.g. Reference Abyzov, Mitskevich and PoglazovaAbyzov and others, 1998; Reference Hoffman, Kaufman, Halverson and SchragHoffman and others, 1998;Reference CastelloCastello and others, 1999; Reference Miteva and BrenchleyMiteva and Brenchley, 2005) and relatively high levels of dissolved organic carbon (Reference Priscu, Christner and BullPriscu and Christner, 2004;Reference Bhatia, Das, Longnecker, Charette and KujawinskiBhatia and others, 2010;Reference Antony, Mahalingnathan, Thamban and NairAntony and others, 2011) are also present in glacial ice. Numerous reports contend that the bacteria may be actively metabolizing within intercrystalline water veins within the ice itself (e.g. Reference PricePrice, 2000;Reference Campen, Sowers and AlleyCampen and others, 2003;Reference Mader, Pettitt, Wadham, Wolff and ParkesMader and others, 2006;Reference Miteva, Sowers and BrenchleyMiteva and others, 2007), and calculations have shown that bacterial carbon within the polar ice sheets contributes significantly to global bacterial carbon pools (Reference Priscu, Christner and BullPriscu and Christner, 2004;Reference Priscu, Tulaczyk, Studinger, Kennicutt, Christner, Foreman, Vincent and Laybourn-ParryPriscu and others, 2008). Despite the apparent importance of ice as a habitat for microorganisms, relatively little is known about the environmental conditions within the ice veins where the bacteria have been shown to exist.
In a previous study (Reference Barletta and RoeBarletta and Roe, 2012) the use of Raman spectroscopy for the analysis of the chemical microenvironments in ice was investigated through the use of surrogate ice prepared by splat-cooling solutions containing various concentrations of anions believed to be present in these solutions. These authors concluded that the concentration of anions in ice veins prepared by this method is controlled to a large extent by the phase relationships among these anions defined by the liquidus curve, rather than the initial solution concentration. In considering how these conclusions might relate to natural ice systems, such as glaciers and ice sheets, one must take into account the mechanism of ice formation on the thermodynamics of the system (Reference MaderMader, 1992a,b). From this perspective, ice crystals grown from cooling solutions, e.g. sea ice and splat-cooled ice, might be very different from ice of a meteoric origin, such as glacial ice in which snow crystals from the atmosphere are transformed to ice by various metamorphic processes. In order to fully evaluate the potential of Raman spectroscopy for the study of ice vein chemistry, analysis of actual glacial ice is necessary to establish the validity of the conclusions of the laboratory studies.
The use of Raman spectroscopy to analyze various chemical species in glacial ice is not unique, but a detailed examination of the geochemistry of ice veins has not been reported. Reference Pauer, Kipfstuhl and KuhsPauer and others (1995) used Raman spectroscopy to determine N2/O2 ratios in clathrates from the Greenland Ice Core Project (GRIP) ice core. In their study, 514.5 nm excitation was used with a laser power of ~300 mW. More recently, Raman spectroscopy has been applied to particulate/inclusion analysis of glacial ice (e.g. Reference Ohno, Igarashi and HondohOhno and others, 2005, 2006;Reference SakuraiSakurai and others, 2010a,Reference Sakurai, Ohno, Horikawa, Iizuka, Uchida and Hondohb, Reference Sakurai2011) again using 514.5 nm excitation, but with lower laser powers (<20 mW at the sample). None of these studies report damage or localized melting of the ice under laser irradiation, although Sakarai and others (2010b) do report that laser-induced temperature gradients (i.e. sample warming) were an issue in their work.
While the dominant cations and anions in ice are monatomic (Reference Angino, Armitage and TashAngino and others, 1965), polyatomic molecular anions are also present. Reference Mader, Pettitt, Wadham, Wolff and ParkesMader and others (2006) have summarized the average concentrations of these anions in glacial ice, based on available literature values. For nitrate, bisulfate and the methanesulfonate (MSA) anions, they estimate average bulk concentrations of 6.0, 2.0 and 0.2 mM, respectively, while noting a large range of variability might be expected. In the context of considering ice veins as a potential microhabitat, they also estimated that these ions would concentrate in the veins by a factor of 3.5 × 10⁵ for ice at −10°C. These estimates would place the vein concentrations well within the range found in our previous studies on splat-cooled ice, lending credence to the applicability of the surrogate studies. Still, given the anticipated variability of these key molecular anions observed in cores, direct measurement in glacial ice is required to evaluate both the applicability of micro-Raman spectroscopy for the non-destructive analysis of ice cores and to assess the microscale variability of molecular anions in ice-core samples. Nitrate and sulfate have been identified experimentally, although not quantified, at triple junctions of Antarctic ice from Nansen and South Yamato ice samples using Raman spectroscopy (Reference Fukazawa, Sugiyama, Mae, Narita and HondohFukazawa and others, 1998), and the presence of sulfuric acid in veins was inferred from sulfur measurements of Dolleman Island ice using energy- dispersive X-rays (EDX) (Reference Mulvaney, Wolff and OatesMulvaney and others, 1988;Reference Wolff, Mulvaney and OatesWolff and others, 1988). Indeed, the microstructure of glacial and laboratory-prepared ice samples has been extensively investigated using scanning electron microscopy (SEM) and EDX (e.g. Reference Cullen and BakerCullen and Baker, 2001;Reference Baker, Cullen and IliescuBaker and others, 2003; Reference Barnes, Wolff, Mallard and MaderBarnes and others, 2003a;Reference Obbard, Iliescu, Cullen and BakerObbard and others, 2003). While much insight has been gained through these studies, they are limited by the fact that SEM/EDX only gives elemental information, from which the extraction of better than semiquantitative elemental distribution is quite problematic. Molecular speciation is at best difficult to elucidate from such data and, as with the references above, often inferred rather than demonstrated. Thus, the SEM/EDX results fail to provide quantitative or even qualitative descriptions of molecular speciation. Given this, relatively little is known about the distribution and concentrations of molecular ions such as sulfate and nitrate in ice cores. Such information is important because high vertical resolution of the chemical composition of melted ice cores is often used to establish the depth chronology in ice cores (Reference Gragnani, Smiraglia, Stenni and TorciniGragnani and others, 1998; Reference SteigSteig and others, 2005) and because many of these same chemicals can serve as substrate to support in situ microbial metabolism. Moreover, long-term (>200year) variations in sulfate and nitrate concentrations have been used in conjunction with other chemical constituents in cores as signatures of climate dynamics (Reference Marsh and DitlevsenMarsh and Ditlevsen, 1997).
To assess the applicability of using Raman for the measurement of ice vein chemistry, micro-Raman analyses were performed on previously characterized polar core samples, which were available through the US National Ice Core Laboratory (NICL). Using published analytical data (Reference MayewskiMayewski and others, 1990, 1995, 1997), appropriate depth horizons were selected to provide a range of bulk sulfate, nitrate and MSA- ion concentrations as a starting point for sample selection. The three core locations, Greenland Ice Sheet Project 2 (GISP2), Newall Glacier (NG) and a glacier in the Dominion Range (DR), were selected for analysis. The GISP2 core represents conditions within the central Greenland ice sheet, the DR core was taken from an Antarctic polar plateau outlet glacier located ~300km from the sea and the NG core was collected from an alpine glacier located ~10km from the sea in the McMurdo Dry Valleys, Antarctica. All of these cores have been the subject of extensive geochemical analysis focusing on paleoclimatic conditions on Earth (Reference MayewskiMayewski and others, 1990, 1995;Reference WilliamsonWilliamson and others, 2007). Various depth horizons for our study were chosen for analysis based on a combination of factors including measured bulk ion concentration, depth and sample availability. Because one of the goals of our study was to investigate the applicability of the methodology when applied to glacial ice, samples were chosen to complement but not compromise other ongoing studies on these ice cores. Table 1 shows the depth, estimated age and bulk nitrate and sulfate concentrations for the core samples selected for this study. The bulk values in Table 1 are those obtained from melted ice analysis and reported in the above-referenced databases for each core. The average ±1σ for bulk sulfate was 0.64 ± 42 0 μM (GISP2), 2.11 ±0.89 μM (NG) and 1.58± 1.24 μM (DR), while bulk nitrate was 1.27 ± 0.25 μM (GISP2), 1.24 ± 0.15 μM (NG) and 0.28± 0.10 μM (DR). The particular anion concentrations reported for the depths used in our study bracket these mean bulk sulfate and nitrate concentrations.
Sample depths, estimated ages and bulk nitrate and sulfate concentrations for ice samples selected for this study. Age data for GISP2 averaged from Mayewski and others (1997) and for Newall Glacier and Dominion Range cores estimated from Mayewski and others (1995). Analytical values for bulk nitrate and sulfate taken from Mayewski and others (1997) for GISP2, Mayewski and others (1995) for Newall Glacier and Mayewski and others (1990) for Dominion Range

2. Experimental Methods
Ice samples were prepared at NICL by first cutting the appropriate core section with a clean bandsaw into pieces approximately 20 mm×20 mm×10 mm. Three samples were cut for each depth interval. The pieces were then treated to remove saw marks using a microtome by taking successive thin slices. This reduced the sample thickness by varying amounts up to ~5 mm. Triplicate samples were thus prepared for each depth interval selected. Samples were sealed in plastic bags and shipped to the University of South Alabama for analysis where they were stored at –80°C until analysis. Before analysis, one of the triplicate samples at a given depth level was placed in a 33 mm glass-bottom culture dish with an uncoated glass window 0.085–0.130 mm thick (MatTEK P35G-0–20-C) and annealed overnight at –9°C.
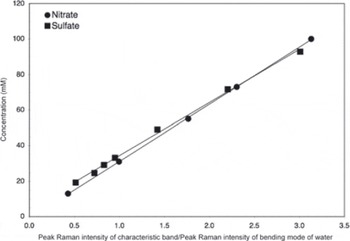
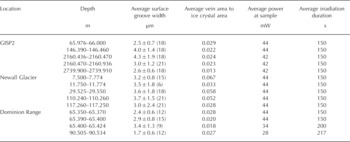
The basic analytical procedure used for the samples has been described previously (Reference Barletta and RoeBarletta and Roe, 2012), although modified slightly to allow for an assessment of the effect of laser irradiation by photographing the sample before and after each Raman measurement. These micrographs revealed characteristic ice microstructures in cross section, including ice crystals, ice veins which appeared as triple junctions, and grain boundaries between crystals, which appeared as surface grooves (see Section 3). The surface groove width was determined by measuring a number of surface grooves in a calibrated photograph at a given depth interval using ImageJ, v. 1.42q, obtained from US National Institutes of Health. The average measured surface groove (i.e. grain boundary) width and ratio of ice vein area (i.e. the surface groove area plus triple junction area) to ice crystal area based on initial (unirradiated) micrographs are listed in Table 2, along with the analytical conditions for the Raman measurements. All samples were analyzed using 488 nm excitation at temperatures of approximately –15°C. This temperature was chosen for consistency in analysis and as a compromise between temperature limitations of the cold stage used and size of the ice triple junctions. Once the Raman data were obtained, concentrations of sulfate and nitrate were determined by integrating the characteristic band of each species (~981 cm-1 for sulfate (Reference Irish and ChenIrish and Chen, 1970) and ~1044cm-1 for nitrate (Reference Ianoul, Coleman and Asherlanoul and others, 2002)) along with the broad band associated with the bending mode of water at ~1640 cm-1 using GramsAI™. The ratio of the peak intensity of the characteristic band, I(band), to that of water, l(water), was then calculated, and using a least-squares relationship determined from standard solutions (Fig. 1) the concentration of the species of interest was then calculated. The calibration curve shown in Figure 1 was not determined at the ice analysis temperature in order to preclude freezing and phase separation of the standard solutions. This approach assumes that the Raman cross section of the species under consideration is independent of temperature. This assumption has been verified for the sulfate and bisulfate ions by Reference Knopf, Luo, Krieger and KoopKnopf and others (2003). The relative analytical uncertainty (1a) in the concentration thus determined was <10% for sulfate and <1.5% for nitrate.
Calibration curves used for nitrate and sulfate concentration determinations. Band ratios are calculated from the ratio of a Gaussian fit to the characteristic band of the species of interest to that of the bending mode of water.
Sample characteristics and analytical conditions for Raman measurements. The number of measurements on which a value is based is given in parentheses. Uncertainties are given as 1a. The average vein area in the fourth column represents the sum of surface groove plus triple junction areas
3. Results and Discussion
3.1. Physical and chemical properties of the ice
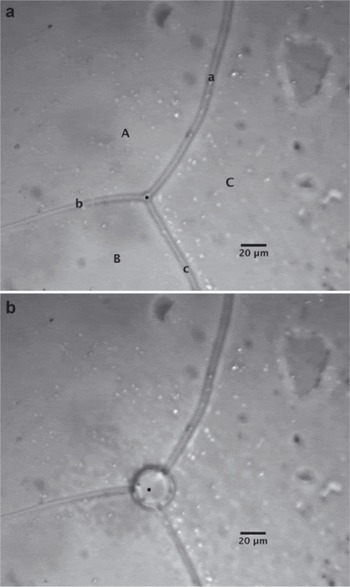
A typical pre-irradiation micrograph showing the surface of an ice sample is shown in Figure 2a. In the image, three ice grains are shown (labeled as upper-case letters on the micrograph). These grains are divided by three surface grooves (labeled as lower-case letters), which are the surface manifestation of grain boundaries in the sample. These grooves intersect to form a triple junction, which is the ice vein in cross section. Each of these features was characterized with Raman spectroscopy to determine the presence and concentration of molecular anions by focusing the laser beam in the appropriate location. With respect to ice crystals, no Raman peaks associated with molecular ions were observed in grain interiors, indicating the grains are impurity-free. This is consistent with the results of synthetic ice observed by Reference Barletta and RoeBarletta and Roe (2012). Conversely, most surface grooves and triple junctions analyzed showed Raman bands characteristic of the presence of nitrate and sulfate. Measurement of both surface groove and triple junction concentrations allowed us to determine the differences in concentration between vein liquids (triple junction measurements) and the concentration along the grain boundaries (surface groove measurements). It has long been assumed that the impurity concentrations along grain boundaries are similar to those in the veins (e.g. Reference Dani, Mader, Wolff and WadhamDani and others, 2012);however, a direct measurement of these concentrations has not been made previously. Our Raman data are the first to reveal that differences in impurity concentration between grain boundaries and veins are not significant (p>0.05), in part because of the large intrasample variation. This variation may be partially the result of the laser spot diameter being close to the surface groove width. This was less of an issue with measurement at triple junctions given their larger size relative to the laser spot.
Typical glacial ice sample (a) before and (b) after laser irradiation. In (a) upper-case letters label ice grains and lower-case letters indicate surface grooves. The measurement here is taken in a triple junction from the GISP2 core at a depth of 146.39–146.46 m. Region of laser focus is shown as a black dot on the micrograph.
Only the sulfate band at ~980cm-1 was observed in a surface groove and a triple junction measurement from GISP2 ice at the 2160.436–2160.470 m interval. No bands attributable to bisulfate were observed in these samples. For most samples, this was not surprising, because the Raman band attributed to bisulfate would be masked by the (stronger) nitrate band. However, as mentioned above, the band ~1050cm-1 associated with bisulfate (HSO4 -) (Reference Irish and ChenIrish and Chen, 1970) was also absent even when nitrate was undetectable. In addition to nitrate and sulfate, no other molecular species could be identified in the ice surface grooves and triple junctions analyzed. While it is possible that other molecular species might be present (e.g. ammonium or phosphate), these results imply that their concentration is low (i.e. below the detection limit of <20 mM). Of note is the fact that no bands attributable to MSA- anion were observed in any of the spectra. This is consistent with the observation of Sakurai and colleagues who showed that, in glacial ice, MSA exists as a particulate (Reference SakuraiSakurai and others, 2010a). None of the samples examined in ice from the 65.400–65.424 m level of Dominion Range ice showed evidence of the presence of molecular ions, which may be evidence of a disconnected vein system in this particular sample (Reference Barnes, Wolff, Mallard and MaderBarnes and others, 2003b) or an artifact of sample history. This does not mean that there are no ionic species present, as monatomic cations and anions (e.g. Na+ and Cl-) cannot be detected using Raman spectroscopy.
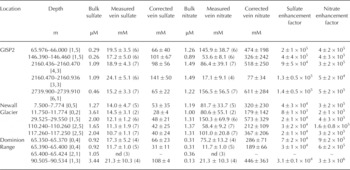
Table 3 gives the mean values for sulfate and nitrate calculated from the Raman peaks assigned as described above. The data in this table labeled vein concentration represent the average of both surface groove and triple junction data since there was statistically no difference (p >0.05) between the two concentrations. Reference Barnes and WolffBarnes and Wolff (2004) argue for a monolayer at grain boundaries at a concentration close to the eutectic, i.e. similar to that found in the veins. Thus, most of the data were obtained on triple junctions (Table 3) because their larger area relative to the surface groove width allowed for more accurate positioning of the laser. The sample-to-sample variation observed at a given depth was much higher than the analytical uncertainty and therefore it is the former that is tabulated for each depth level along with the mean value at that level. Taken as a whole, the relative sample-to-sample variation (1 a) averaged about 33% for nitrate and 22% for sulfate. In the case of the latter, this is almost an order of magnitude greater than the 1 a analytical uncertainty. Table 3 also lists for comparison the values for nitrate and sulfate reported for bulk ice analysis. These results show that nitrate and sulfate in the ice vein system is on the order of 105 and 104 times greater in the veins relative to the bulk concentration of these respective ions. The calculated enhancement factors based on mean values at each level are also listed in Table 3 and are in good agreement with those predicted by Reference Mader, Pettitt, Wadham, Wolff and ParkesMader and others (2006).
Vein sulfate and nitrate concentrations as measured and corrected for local melting. Analytical values for bulk nitrate and sulfate taken from Mayewski and others (1997) for GISP2, Mayewski and others (1995) for Newall Glacier and Mayewski and others (1990) for Dominion Range. The number of surface grooves and triple junctions measured at a given depth range is given after the depth interval in square brackets: [surface grooves, triple junctions]. The total number of measurements on which a value is based is given in parentheses beside the value. ‘nd’ indicates no Raman bands detected above background. Uncertainties are given as 1a. Enhancement factors based upon the ratio of the corrected concentration of a species to its bulk concentration
It should be noted that the enhancement factor is not a fixed number. As discussed by Reference Barletta and RoeBarletta and Roe (2012), the impurity concentration in the veins is determined by thermodynamic considerations that are independent of the initial bulk concentration. Following Reference MaderMader (1992b) and Reference Barnes, Wolff, Mallard and MaderBarnes and others (2003b), the local temperature, conventionally expressed as a temperature depression 0 below 0°C, is given by the sum of the temperature depression due to the concentration of ions in the veins [/]vein and the temperature depression due to the radius of curvature of the veins [r]vein
where A and B are constants. Note that, formally, [r]vein should be the sum of the curvature along the vein and the curvature of the faces of the vein cross section. However, the former is generally much smaller than the latter and hence [r]vein is generally given simply by the curvature of the vein cross section with no loss of accuracy. What Eqn (1) encapsulates is that, as temperature depression 0 below 0°C increases (i.e. the temperature drops), the veins become smaller such that their curvature 1/[r]vein and the vein concentration [i]vein both increase.
We can assess the relative contributions of the two terms by recasting the first term in Eqn (1) in terms of the initial bulk concentration of ions [i]bulk and the volume of veins per unit volume of ice ![]() where C is a constant that is related to the length of veins per unit volume and the geometry of the vein cross section. Hence,
where C is a constant that is related to the length of veins per unit volume and the geometry of the vein cross section. Hence,
Inserting Eqn (2) into Eqn (1) we get
where A‘ = A/C. We can see from Eqn (3) that, for large temperature depressions 0 below 0°C, the first term in Eqn (3) (and hence in Eqn (1)) dominates. This is generally the case for temperatures more than a few degrees below 0°C. Under such conditions, the concentration in the veins, as given by Eqn (1), is controlled entirely by the local temperature, i.e. 0 = A[i]vein. The second, curvature term in Eqn (1) becomes important at higher temperatures (i.e. small 0), and should not influence data from our experiments or for much of the natural ice column.
Long-term storage of ice cores at NICL, subsequent annealing of the samples and uniform analysis conditions will tend to smooth out any concentration variations initially present in the ice used in our studies. At a given temperature, variations in the initial bulk concentration will be expressed by variations in vein size or possibly also crystal size, with high initial bulk concentrations being accommodated by larger veins around smaller crystals (i.e. more vein volume per unit volume of ice) at a constant vein impurity concentration. As a result, one would predict a poor correlation between the initial bulk concentration and vein concentration of any individual compounds in these measurements, which differ primarily in their initial bulk concentrations. Comparison of the concentration data in Table 3 reveals that the vein concentration corrected for laser-induced melting (see below) for each compound is indeed poorly correlated (sulfate, r = 0.20; nitrate, r = 0.46) with the bulk value for that compound obtained after melting.
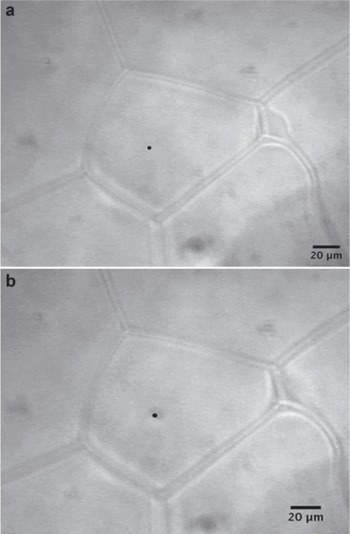
One important consideration in evaluating these results is the effect of laser irradiation on the concentration measurements. For all but two of the samples analyzed, it was noted that localized melting due to laser heating was evident upon post-irradiation examination (Fig. 2b). This was surprising given the fact that in previous experiments on simulated glacial ice made from splat-cooled solutions run at significantly higher incident laser powers (Reference Barletta and RoeBarletta and Roe, 2012) and recent Raman studies on sea ice (R.E. Barletta and A. Gandhakwala, unpublished information), localized melting was not observed. Such melting has also not been reported in the other Raman studies on glacial ice discussed above. The laser powers used in the current study are relatively low (<45mW at the sample) and, given the transparency of ice to 488nm radiation, bulk heating at these powers over the relatively short irradiation time (150–300 s) is likely not the cause of this effect. Indeed, irradiation of the ice crystals in the same sample for similar times and powers produced no such localized melting (Fig. 3). One possible cause of this heating is the presence in the veins of highly absorbing particulates not resolvable at the magnification used. Nanoparticulates such as black carbon can be readily heated using focused laser beams. For example, Reference Bassil, Puech, Tubery, Bacsa and FlahautBassil and others (2006) report that carbon nanotube agglomerates in methanol can be readily heated to the point that the methanol begins to vaporize at power densities as low as 0.14 mWmm-2 for blue laser light. If one assumes a laser spot size of ~1 mm for our experiments and considers the laser powers listed in Table 2, the power density at which these measurements were performed is some two orders of magnitude above that threshold. The presence of carbon particulates cannot be proven, however, as the characteristic Raman G-band, which occurs at ~1592cm-1 (Bassil and others 2006), is likely to have been masked by the broad band due to the water bending mode. Moreover, the concentration of refractory black carbon in glacial ice is typically low. For example, data from Greenland (site D4; Reference McConnellMcConnell and others, 2007) and West Antarctic ice cores (WAIS Divide core WDC06A; Reference BisiauxBisiaux and others, 2011) have shown mean black carbon concentrations of 4.0 and 0.8 mgkg-1, respectively. Regardless of the cause of the melting, the effect is to dilute the measured concentrations of sulfate and nitrate. This could be corrected for by multiplying the result by the ratio of the area of the melted region to the pre-irradiation vein area. This assumes that the area ratio is proportional to the volume ratio, which it likely is as the analytical depth is likely constant and only the liquid in the veins within the melt zone contributes to the measured concentration. While this would have the effect of overcorrecting for dilution if the laser irradiation continued for an appreciable length of time after the measurement had concluded, every effort was made to minimize this. Table 3 also presents the results of this melt correction. It can be seen from Table 3 that the trends observed in the uncorrected data and discussed above are maintained.
Typical glacial ice crystal (a) before and (b) after laser irradiation. The sample is from the Newall Glacier core at a depth of 7.750–7.774 m. The measurement was taken in the interior of an ice grain, and the region of laser focus is shown as a black dot on the micrograph. Note that several triple junctions are also evident in this micrograph.
Based upon the results discussed above, it is of interest to estimate the local vein pH implied by the measured anion concentrations. It has long been speculated that the acidity in the veins is a result of the presence of nitric, sulfuric and, in some cases, hydrochloric acid (Reference Wolff, Mulvaney and OatesWolff and others, 1988). Since the Raman measurements will not reveal the presence of dissociated aqueous HCl, it is not possible to infer its presence from these data. Further, the direct measurement of H+ by Raman spectroscopy is also not possible. Given these limitations, one can make some bounding assessments regarding the pH under the assumption that the measured nitrate and sulfate anions are the result of dissociation of the corresponding acid. Nitric acid is a strong acid, hence there is a one-to-one correspondence between the nitrate concentration and the H+ concentration produced from its dissociation. Using the melt-corrected nitrate concentrations listed in Table 3, the implied pH due to nitric acid will be <1. Acidic protons from the dissociation of sulfuric acid into bisulfate and sulfate will contribute to (i.e. lower) the pH. If the contribution from nitric acid is ignored (e.g. in the case of the two GISP2 samples in which nitrate was not observed), and it is assumed that the bisulfate concentration is below detection limits (<10–20 mM), one can estimate the pH using the measured sulfate concentration along with the temperature-dependent equilibrium constant (Reference Knopf, Luo, Krieger and KoopKnopf and others, 2003). In this case, the pH will be ~2.5–3.0. Thus, given the concentrations of sulfate and nitrate measured in veins and triple junctions, the vein microenvironment will be highly acidic.
3.2. Implications for chemical chronology
The lack of correlation observed between bulk chemical analysis and the micro-Raman analysis of sulfate and nitrate raises the question of the extent to which the variability observed in bulk chemical measurements represents seasonal variation in deposition. Since these anions are part of a connected vein system, diffusion might act to smear out local variation, and the measured concentration may be more likely a result of crystal size and ice vein diameter than original composition. Further, Reference Barletta and RoeBarletta and Roe (2012) argue that a minimum value for ice vein composition is controlled by the position of the liquidus curve in the multicomponent phase diagram defining the ice vein system. It is difficult to answer this question directly from the results of our study, for several reasons. The first and perhaps most important reason is that two of the core sites used in this study (DR and NG) are low-deposition sites with annual layering on the order of a few centimeters or less. The third core is a higher-deposition site with annual layers on the order of 20cm. In all cases, however, the bulk analytical data analysis was not performed at sufficient resolution to reflect any seasonal variation. Secondly, even though the sampling resolution is relatively high for the micro-Raman technique (on the order of micrometers) no effort was made to determine or maintain the orientation of the ice sample with respect to the original core, or to determine the specific analysis position with respect to the overall sample. Thus, the sample-to-sample variation within a core sample, which was high, could in fact reflect seasonal variation. To determine this, a more systematic study, in which absolute sample position relative to the core axis was determined, would have to be performed. Lastly, there is the thermal history of the samples used in this study, which as discussed above would tend to eradicate any variation in the observed vein concentrations. In order to investigate the question of local variability, careful control of the sample thermal gradients would have to be maintained.
Modeling studies can provide some insight into the more general question concerning the viability of maintaining seasonal anion concentration variations in the connected liquid vein system within a core. Several studies have directly addressed the issue of the effect of diffusion on impurity concentration spikes in systems with temperature and concentration gradients (Reference Rempel, Waddington, Wettlaufer and WorsterRempel and others, 2001, 2002; Reference Barnes, Wolff, Mallard and MaderBarnes and others, 2003b). In these modeling studies, chemical gradients in deep ice cores from Summit, Greenland (Reference Rempel, Waddington, Wettlaufer and WorsterRempel and others, 2001, 2002), were used. The shallower Dome C core data were used to benchmark the modeling. Reference Rempel, Waddington, Wettlaufer and WorsterRempel and others (2001, Reference Rempel, Wettlaufer and Waddington2002) concluded that, although major movement of peak concentrations relative to the ice in which it had been deposited due to temperature gradients might be expected, no major broadening of sulfate maxima due to diffusion should be anticipated, especially in situations where the presence of other ionic species can act to damp such diffusion. In their more detailed modeling, which addressed both chemical and temperature gradients, as well as the detailed vein structure within the core, Reference Barnes, Wolff, Mallard and MaderBarnes and others (2003b) concluded to the contrary, that post- depositional movement of sulfate and chloride is, in fact, likely to occur and should be taken into account when assessing chemical data. Future studies using the higher resolution possible through micro-Raman analysis of vein concentrations can possibly address these discrepancies.
3.3. Biological implications
The majority of studies on glacial ice have focused on the physical and geochemical chronology and the subsequent paleoclimatic history of our planet. The seminal studies of microorganisms by Reference Abyzov, Mitskevich and PoglazovaAbyzov and others (1998) on the Vostok (Antarctica) ice core were the first to show that viable (i.e. culturable) bacteria inhabit ice sheets. Subsequent studies on melted ice cores revealed that bacteria within the melted ice can utilize organic carbon substrates at relatively high rates (Reference Karl, Bird, Bjorkman, Houlihan, Shackelford and TupasKarl and others, 1999;Reference ChristnerChristner and others, 2006), further indicating the presence of viable cells within the ice. Reference PricePrice (2000) and Reference Mader, Pettitt, Wadham, Wolff and ParkesMader and others (2006) have contended that microorganisms should be found in the solute-rich veins that exist between ice crystals, and Reference PricePrice (2007) and Reference Rohde and PriceRhode and Price (2007) provide evidence that the concentrations of nutrients and dissolved organic carbon in the aqueous fraction of deep ice cores are sufficient to support microbial metabolism for several hundred thousand years. Our data, using in situ Raman measurements of vein nitrate and sulfate, showed that levels of sulfate and nitrate are highly concentrated within the veins (by a factor of 103-105) with respect to bulk levels, supporting the results of Reference Mader, Pettitt, Wadham, Wolff and ParkesMader and others (2006) and Reference PricePrice (2000). Bulk bacterial densities in polar ice cores range from 102 to 107cellsmL-1 in melted cores (Reference PriscuPriscu and others, 1999;Reference Miteva and BrenchleyMiteva and Brenchley, 2005; Reference ChristnerChristner and others, 2006). Assuming that these bacteria were concentrated into the vein network of the ice, and using a concentration factor of 104, the bacterial concentration within the ice veins would range from 106 to 1011 cells mL-1.
The relatively high anion concentrations and low pH we estimated in the ice cores that we studied agree with those estimated by Reference PricePrice (2000) and Reference Mader, Pettitt, Wadham, Wolff and ParkesMader and others (2006). Such conditions, in concert with in situ subzero temperatures, would place high demands on any bacteria within this environment. Reviews of the diversity of bacteria in icy environments (Reference Priscu, Christner and BullPriscu and Christner, 2004;Reference Christner, Skidmore, Priscu, Tranter, Foreman, Margesin, Schinner, Marx and GerdayChristner and others, 2008;Reference Junge, Christner, Staley, Horikoshi, Antranikian, Bull, Robb and StetterJunge and others, 2011) have shown that many isolates obtained from geographically diverse glacier samples belong to the same genera. Isolates of the Actinobacteria and Firmicutes are typically the predominant groups, followed by Proteobacteria and Bacteroides. Culture-independent studies based on 16S rRNA also found sequences corresponding to the same groups (Reference Miteva, Margesin, Schinner, Marx and GerdayMiteva, 2008). These results suggest that the organisms are metabolically active within the ice veins and that the habitat is selecting for certain bacterial groups. Current efforts to characterize glacial isolates physiologically are beginning to reveal properties required to survive in vein habitats. For example, Reference Loveland-Curtze, Miteva and BrenchleyLoveland-Curtze and others (2010) showed that the species Chryseobacterium greenlandense, isolated from 3034 m depth in the GISP2 core, is small (<0.1 mm3), allowing it to fit easily within the vein diameters we measured and further allowing it to utilize nutrients and exchange gases efficiently by virtue of a high cell surface-to-volume ratio. This same genus has been reported from 3519 m in the Vostok (Antarctica) ice core (Reference Raymond, Christner and SchusterRaymond and others, 2008) and shown to produce an extracellular protein that binds to the prism faces of ice crystals and prevents recrystallization. The results of Reference Raymond, Christner and SchusterRaymond and others (2008) suggest that this organism may produce ice-interacting substances (e.g. ice-binding proteins) that can influence ice crystal structure and possibly depress the freezing point within the vein environment, providing a survival advantage to populations residing in the veins of polycrystalline ice habitats (Reference Achberger, Brox, Skidmore and ChristnerAchberger and others, 2011). Bacteria living in the subzero and highly saline (>5x sea water) environments within the lakes of the McMurdo Dry Valleys have also been shown to remain metabolically active in situ, albeit at rates well below their potential maximum growth rate (Reference Ward and PriscuWard and Priscu, 1997). Despite reduced growth rates, the dry valley lake bacteria alter the chemistry of the lakes via biogeochemical transformations of key elements such as nitrogen and sulfur (Reference PriscuPriscu, 1997;Reference LeeLee and others, 2004a,b).
Based on the enrichment factors computed for sulfate and nitrate in our study, we used the following mass-balance relationships to estimate the maximum value for the vein volume fraction:
where [i]vein is the concentration of ions (sulfate or nitrate) in the veins, [i]crystal is the concentration of ions (sulfate or nitrate) in the ice crystal, [i]bulk is the bulk concentration of ions (sulfate or nitrate) in melted ice, Vvein is the volume of the vein system, Vcrystal is the volume of the crystals and Vtotal is the total volume of the bulk melt phase.
Solving Eqn (4) for [i]bulk, and noting that V total = V vein + V crystal, yields the relationship:
Assuming that [i]vein is much larger than [i]bulk, and assuming low ion concentrations in the pure crystalline phase, [i]crystal, the following relationship with [i]crystal = 0 returns a maximum value for vein volume:
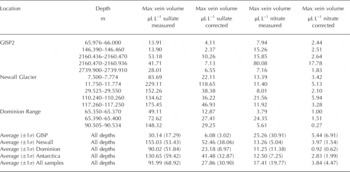
Equation (6) was used to estimate the vein volume within each of the ice-core samples in units of mLL-1 of solid ice (Table 4). In all cases, the vein volume phase estimates were greatest for sulfate, presumably reflecting difference in segregation coefficients between sulfate and nitrate. The average measured and corrected vein volume fractions for the GISP core are 30.14 and 6.08 pi L-1 for sulfate and 25.26 and 5.44 pLL-1 for nitrate;the average measured and corrected vein volumes for the Antarctic ice cores were 130.65 and 41.48 pL L-1 for sulfate and 12.50 and 2.83 pLL-1 for nitrate. Using the average corrected vein volume fractions for sulfate and nitrate together with published volume estimates for the Greenland ice sheet (2.9×10⁶km3; Reference Bamber, Layberry and GogineniBamber and others, 2001) and the Antarctic ice sheet (2.6×10⁷ km3; Reference OerlemansOerlemans, 2005) we estimate that the Greenland and Antarctic ice sheets contain 16.7 and 576 km3 of liquid water in the vein fraction, respectively. It should be noted that the vein volume estimates for Greenland and Antarctica assume that the ice is near the same temperature as that at which the Raman measurements were made. These volumes represent potential habitable space in Earth‘s polar regions not yet considered and suggest that we should view our polar ice sheets as potential habitats for microbial life and not merely benign blocks of ice possessing purely physical and chemical signatures.
Acknowledgements
This study was funded by the US National Science Foundation, Office of Polar Programs under grant No. 0828786. Ice-core data were provided by the US National Snow and Ice Data Center, University of Colorado at Boulder, and the World Data Center-A for Paleoclimatology, National Geophysical Data Center, Boulder, Colorado, through posted websites. The authors acknowledge the assistance of staff at the US National Ice Core Laboratory in the preparation of samples used in this study. J.C.P. was supported by NASA grant NAI5–0021 and NSF grants OPP-0839075, OPP- 0838933 and OPP-1115245.


