


1. Introduction
Climate change is increasingly recognised as one of the most significant systemic risks facing society, with wide-ranging implications for population health, economies and financial markets. For actuaries working within the life, health and pensions sectors, the intersection between climate change and human health outcomes represents a critical frontier of risk assessment and modelling (Romanello et al., Reference Romanello, McGushin, Di Napoli, Drummond, Hughes, Jamart, Kennard, Lampard, Rodriguez, Arnell and Ayeb-Karlsson2021; Reference Romanello, Di Napoli, Drummond, Green, Kennard, Lampard, Scamman, Arnell, Ayeb-Karlsson, Ford, Belesova, Bowen, Cai, Callaghan, Campbell-Lendrum, Chambers, van Daalen, Dalin, Dasandi and Costello2022). Climate perils including extreme heat, air pollution, flooding and the spread of infectious diseases are expected to exacerbate mortality and morbidity risks across vulnerable populations (Ahmed et al., Reference Ahmed, Chen, Hoang and Do-Linh2024; Romanello et al., Reference Romanello, Walawender, Hsu, Moskeland, Palmeiro-Silva, Scamman, Smallcombe, Abdullah, Ades, Al-Maruf and Ameli2024; Tol, Reference Tol2018). Recent estimates indicate that heat-related deaths in individuals over 65 have surged by 167% since the 1990s, and people worldwide are experiencing an extra 50 days of dangerous heat annually – clear signs that climate-driven health threats are intensifying (Romanello et al., Reference Romanello, Walawender, Hsu, Moskeland, Palmeiro-Silva, Scamman, Smallcombe, Abdullah, Ades, Al-Maruf and Ameli2024), placing new pressures on insurers and pension schemes that rely on long-term actuarial assumptions (Miljkovic et al., Reference Miljkovic, Miljkovic and Maurer2018).
While the broader health impacts of climate change are now well documented in public-health literature, the application of these insights in actuarial models remains limited. Previous studies have identified significant challenges in linking environmental exposures to health outcomes over actuarial time horizons (Boudreault et al., Reference Boudreault, Clacher, Sui-Hang, Pigott and Zhou2023). Data limitations, methodological uncertainty and a lack of scenario-based modelling frameworks tailored to the needs of actuaries have contributed to a lag in the integration of climate health risks into actuarial practice. At the same time, regulatory bodies such as the Prudential Regulation Authority (PRA) have called for the inclusion of climate considerations in stress testing and risk disclosures, as exemplified by initiatives like the Climate Biennial Exploratory Scenario (CBES) (Bank of England, 2021a; 2021b).
Although public-health research and temperature effects on mortality research have advanced the understanding of temperature-related mortality in the UK, actuarial applications of these findings remain sparse (Murage et al., Reference Murage, Macintyre, Heaviside, Vardoulakis, Fučkar, Ruksana and Hajat2024; Seklecka et al., Reference Seklecka, Pantelous and O’Hare2017). A recent study by Min et al. (Reference Min, Li, Nagler and Li2025) introduced a stochastic mortality model incorporating distributed lag non-linear effects of climate variables, indicating that rising temperatures will increase summer mortality even as winter mortality declines. Complementing this, Guibert et al. (Reference Guibert, Pincemin and Planchet2025) developed climate-augmented mortality projections for France, demonstrating the material impact of temperature on life expectancy. Similarly, Boumezoued et al. (Reference Boumezoued, Eifassihi, German and Titon2022) models a climate-augmented Lee-Carter model for France and US. However, widespread adoption of such models within the insurance and pension industries is still in its infancy.
The gap between public-health insights, actuarial applications and climate science is compounded by data limitations, methodological complexity and a lack of standardised guidance and tools (Boudreault et al., Reference Boudreault, Clacher, Sui-Hang, Pigott and Zhou2023). Regulators, including the UK PRA, have responded by integrating climate considerations into stress-testing frameworks – most notably through the CBES – but practitioners report challenges in translating these scenarios into mortality and morbidity assumptions as mortality and morbidity risks are outside the scope of the CBES (Bank of England, 2022).
To address this, the Institute and Faculty of Actuaries Sustainability, Demographics Mortality and Morbidity Working Party (the “Working Party”) conducted a survey among UK pension consultancies, insurers and reinsurers. The primary aim was to explore, document and understand how climate perils are currently being modelled in relation to mortality and morbidity and to identify areas where further support and guidance are needed in the UK context, rather than to provide a normative evaluation of practice quality or adequacy. To this end the key objectives were to:
-
1. Assess the current level of integration of climate (and linked environmental and socio-economic) factors in actuarial models and the setting of assumptions.
-
2. Document the use of assumptions and scenarios under the consideration of climate perils in actuarial models for morbidity and mortality.
-
3. Identify methodological barriers and data constraints that impede the effective integration of climate (and linked environmental and socio-economic) factors in actuarial practice.
-
4. Document modelling practices relating to climate change impacts on mortality and morbidity to inform future modelling approaches.
-
5. Capture and analyse stakeholder demand for improved guidance, tools and collaboration opportunities to enhance the integration and communication of climate and health/mortality factors in actuarial modelling.
Accordingly, discussion and interpretation of results are framed primarily around climate risks, mortality and morbidity experience and institutional arrangements relevant to the UK. The results reveal considerable variation in current practice. While a minority of organisations have begun to incorporate climate-related health risks into their modelling, often through exploratory scenario analysis, many remain at an early stage, with limited resources or frameworks available to support such work. Respondents highlighted a need for standardised methodologies, access to reliable climate-health data and profession-led guidance to promote consistency across the industry. Notably, there was strong interest in collaborative approaches to improve data-sharing and modelling tools.
This study makes several contributions to the existing body of knowledge. First, it provides an empirical snapshot of actuarial modelling of climate-induced health risks. Second, it highlights the specific methodological barriers and data constraints that organisations face, thereby helping to direct future research and guidance. Third, it offers evidence-based insights to inform the IFoA’s future work programme, aligning with its commitment to support the profession in responding to the evolving risk landscape. Finally, a key contribution of this paper is its focus on actuarial practitioners themselves. While a growing literature examines the relationship between climate change and health outcomes from public-health and epidemiological perspectives, empirical evidence on how actuaries are currently engaging with these risks remains limited. By surveying UK actuaries across pensions, insurance and reinsurance, this study provides one of the first practitioner-led snapshots of current modelling approaches, challenges and priorities in relation to climate and socio-economic driven mortality and morbidity risks.
By documenting current practice, surfacing practitioner perspectives and identifying actionable priorities, this paper aims to support the actuarial profession in developing proportionate, transparent and forward-looking responses to climate-related health risks and contributes to the development of a more resilient, informed and climate-aware actuarial profession. It also underscores the urgency of interdisciplinary collaboration between actuaries, climate scientists, epidemiologists and policymakers to enhance the robustness of long-term health risk modelling.
The rest of the paper is structured as follows: Section 2 provides a review of relevant literature on climate change, health outcomes and their implications for actuarial modelling, highlighting key gaps in current research and practice; Section 3 outlines the methodology used for the survey, including its design, target respondents and analytical approach; Section 4 presents the survey findings in detail, categorised into thematic areas outlined above; Section 5 concludes and offers practical recommendations for the profession by summarising key insights and reinforcing the importance of embedding climate-health considerations in actuarial workstreams.
2. Literature Review
2.1. Climate Change and Health Outcomes: Scientific Basis
Climate change affects human health through multiple pathways, with extreme temperatures among the most serious hazards (Murray et al., Reference Murray, Aravkin, Zheng, Abbafati, Abbas, Abbasi-Kangevari, Abd-Allah, Abdelalim, Abdollahi, Abdollahpour and Abegaz2020). The scientific consensus is unequivocal: climate change poses material risks to human health, with consequences for both mortality and morbidity. The most direct pathways include temperature extremes such as heatwaves and cold spells, which are associated with excess deaths, particularly among vulnerable populations such as the elderly (Gasparrini et al., Reference Gasparrini, Guo, Hashizume, Lavigne, Zanobetti, Schwartz, Tobias, Tong, Rcoklov, Forsberg, Leone, De Sario, Bell, Guo, Wu, Kan, Yi, Coelho, Saldiva, Honda, Kim and Armstrong2015; Hajat et al., Reference Hajat, Vardoulakis, Heaviside and Eggen2014; Murage et al., Reference Murage, Macintyre, Heaviside, Vardoulakis, Fučkar, Ruksana and Hajat2024).
Numerous studies have explored climate impact on mortality, highlighting heat as the most immediate threat (Chen et al., Reference Chen, De Schrijver, Sivaraj, Sera, Scovronick, Jiang, Roye, Lavigne, Kyselý, Urban and Schneider2024; De Schrijver et al., Reference De Schrijver, Bundo, Ragettli, Sera, Gasparrini, Franco and Vicedo-Cabrera2022; Guo et al., Reference Guo, Lanza, Li, Zhou, Aunan, Loo, Lee, Luo, Duan, Zhang and Zhang2023; Mazdiyasni et al., Reference Mazdiyasni, AghaKouchak, Davis, Madadgar, Mehran, Ragno, Sadegh, Sengupta, Ghosh, Dhanya and Niknejad2017). Between 2000 and 2019, non-optimal temperatures caused over 5 million deaths annually – about 9.4% of global mortality – with cold-related deaths comprising 8.5% and heat-related deaths 0.9% (Zhao et al., Reference Zhao, Guo, Ye, Gasparrini, Tong, Overcenco, Urban, Schneider, Entezari, Vicedo-Cabrera and Zanobetti2021). However, projections indicate heat-related mortality will increase significantly under warming scenarios, eventually exceeding cold-related deaths, which are expected to decline (Gasparrini et al., Reference Gasparrini, Guo, Sera, Vicedo-Cabrera, Huber, Tong, Coelho, Saldiva, Lavigne, Correa, Ortega, Kan, Osorio, Kysely, Urban, Jaakkola, Ryti, Pascal, Goodman, Zeka and Armstrong2017).
Other mechanisms include worsening air quality (e.g., elevated PM2.5 and ozone levels during heat events), the expansion of vector-borne diseases (e.g., Lyme disease and dengue) (Caminade et al., Reference Caminade, McIntyre and Jones2019), food and water insecurity (Banerjee et al., Reference Banerjee, Radak, Khubchandani and Dunn2021) and broader psychosocial stress and mortality mediated by lifestyle and chronic diseases (Rutters et al., Reference Rutters, Pilz, Koopman, Rauh, Te Velde, Stehouwer, Elders, Nijpels and Dekker2014). These climate-health pathways often intersect with socio-economic vulnerability, compounding risks for lower-income and elderly populations and stressing health systems unequally (Watts et al., Reference Watts, Amann, Arnell, Ayeb-Karlsson, Beagley, Belesova, Boykoff, Byass, Cai, Campbell-Lendrum and Capstick2020).
UK-specific evidence supports these global findings. Gasparrini et al. (Reference Gasparrini, Guo, Hashizume, Lavigne, Zanobetti, Schwartz, Tobias, Tong, Rcoklov, Forsberg, Leone, De Sario, Bell, Guo, Wu, Kan, Yi, Coelho, Saldiva, Honda, Kim and Armstrong2015) estimate that around 9.3% of UK deaths are attributable to non-optimal temperatures, with projections showing substantial increases in heat-related mortality by mid-century (Murrage et al., 2024). Climate-health risks also vary spatially: England and Wales are warming more rapidly than Scotland, and excess mortality burdens are higher in deprived and urban areas (Hajat et al., Reference Hajat, Vardoulakis, Heaviside and Eggen2014). This spatial heterogeneity underscores the value of localised modelling. In addition, international frameworks such as the Lancet Countdown on Health and Climate Change call for more structured forecasting and integration of health outcomes in climate adaptation policy and economic planning (Watts et al., Reference Watts, Amann, Arnell, Ayeb-Karlsson, Beagley, Belesova, Boykoff, Byass, Cai, Campbell-Lendrum and Capstick2020).
2.2. Climate Risk Mortality and Morbidity Modelling in Actuarial Science
Despite growing awareness of climate-health risks (Naqvi & Hall, Reference Naqvi and Hall2018), the integration of these risks into actuarial models as described in the academic literature, particularly for mortality and morbidity, is underdeveloped. Historically, life and health insurers have relied on projection models that have assumed historically consistent mortality improvements, rarely adjusting for dynamic climate exposures (Cairns et al., Reference Cairns, Kallestrup-Lamb, Rosenskjold, Blake and Dowd2019).
In contrast, catastrophe models for property and reinsurance applications – where climate hazards like hurricanes and floods are more visible – are more advanced in embedding physical climate risk (Onur, Reference Onur2024; The Geneva Association, 2021; Toumi & Lauren Reference Toumi and Lauren2014; Turner, Reference Turner2023). In the actuarial literature, the Lee and Carter (Reference Lee and Carter1992) model has been extended to include explanatory terms based on a heat index; see Seklecka et al. (Reference Seklecka, Pantelous and O’Hare2017) and Bhattacharya-Craven et al. (Reference Bhattacharya-Craven, Golnaraghi, Thomson and Caplan2024). These successfully link the physical climate risk, through the index, to mortality risk predictions.
From a technical standpoint, most existing actuarial models apply scenario analysis (e.g., stylised Intergovernmental Panel on Climate Change (IPCC) or Network for Greening the Financial System (NGFS) pathways, but few operationalise stochastic approaches that embed climate-sensitive variables into mortality risk functions. Few studies use dynamic mortality models that incorporate climate covariates such as temperature anomalies or air pollution (Alnwisi et al., Reference Alnwisi, Chai, Acharya, Qian, Zhang, Zhang, Vaughn, Xian, Wang and Lin2022; Cox, Reference Cox2024).
Notable limitations stated in the literature include the lack of long-term, high-resolution data sets that link climate exposures and socio-economic factors with mortality or morbidity outcomes over time, as all model parameters are likely to be affected by future changes in socio-economic and environmental factors (UKHSA, 2023a). Most models are based on global or national estimates that obscure local variation. Furthermore, mortality assumptions are often applied uniformly across population segments, ignoring the interaction between age, income, location and exposure see for example (Zhao et al., Reference Zhao, Guo, Ye, Gasparrini, Tong, Overcenco, Urban, Schneider, Entezari, Vicedo-Cabrera and Zanobetti2021). The actuarial field has yet to fully engage with methods that account for structural inequalities in exposure, vulnerability and adaptive capacity (Griffith et al., Reference Griffith, Smith, Manley, Howe and Owen2021).
2.3. Interdisciplinary Perspectives and Emerging Research Needs
Recognising the complexity of climate-health interactions, researchers increasingly call for collaboration between actuaries, epidemiologists, climatologists and public-health officials (UKHSA, 2023; WHO, 2021). Such interdisciplinary work is essential to develop robust models that capture both direct (e.g., heatwaves) and indirect (e.g., food insecurity, mental health, hospital strain) health impacts.
Advances in geospatial statistics and climate science have led to emerging techniques include Bayesian spatial and spatio-temporal modelling using tools such as the Integrated Nested Laplace Approximation (INLA), and flexible regression frameworks such as Generalised Additive Models for Location, Scale and Shape (GAMLSS) (Rue et al., Reference Rue, Martino and Chopin2009; Stasinopoulos et al., Reference Stasinopoulos, Rigby, Heller, Voudouris and De Bastiani2017). These models accommodate non-linear, time-varying effects and are increasingly applied in climate epidemiology (Wang et al., Reference Wang, Chen and Xue2024). Geospatial mapping allows the identification of climate-health hotspots, while data fusion techniques are being developed to integrate environmental, demographic and health data from multiple sources (Wang et al., Reference Wang, Chen and Xue2024; UKHSA, 2023b).
However, significant gaps remain in the existing mortality literature as there is a lack of UK-specific projections for future mortality and morbidity under different climate scenarios, and these do not allow for intra-annual variations in temperature and their effect on mortality (Boudreault et al., Reference Boudreault, Clacher, Sui-Hang, Pigott and Zhou2023). Most importantly, actuarial applications of these models tailored to pricing, reserving and funding requirements are rare or non-existent.
2.4. Professional and Regulatory Guidance
Regulatory and professional bodies in the UK have increasingly stressed the importance of climate risk integration. The PRA and Financial Conduct Authority (FCA) have embedded climate-related expectations into regulatory frameworks, particularly through initiatives such as the CBES and the Supervisory Statement SS3/19 (BoE, 2022; PRA, 2024). HM Treasury’s Green Finance Strategy and the mandatory disclosure requirements aligned with the Task Force on Climate-related Financial Disclosures (TCFD, 2017) underscore the materiality of climate risk across all financial sectors, including insurance and pensions.
Within the actuarial profession, the Institute and Faculty of Actuaries has developed guidance on integrating climate risk into general insurance, life insurance and investment practices (IFoA, 2018; 2022; 2024). These efforts have focused primarily on scenario testing, governance and risk disclosure rather than on modelling frameworks for health outcomes. The existing professional and regulatory guidance has made important progress in articulating expectations around climate risk governance, disclosure and the use of scenario analysis. However, the literature indicates that these frameworks remain largely high-level and provide limited practical direction on how climate-related health impacts should be translated into mortality and morbidity assumptions within actuarial models.
Importantly, most regulatory documents stop short of providing technical guidance on integrating climate-sensitive mortality or morbidity projections into long-term actuarial assumptions. The lack of practical tools for translating climate-health insights into pricing, reserving or funding models leaves insurers and pension funds uncertain about how to operationalise climate considerations within solvency and risk management frameworks. This gap has been noted as a constraint on consistent and credible application, pointing to a potential role for further professional guidance, illustrative case studies or non-prescriptive modelling frameworks focused specifically on mortality and morbidity.
A cautious and reactive approach to climate risk integration has also been observed more broadly within the insurance sector. For example, the BIS (2023) report “Too hot to insure” documents a tendency among insurers to defer substantive action on climate risk until impacts become clearly observable in experience data. This behaviour highlights a structural challenge in incorporating forward-looking climate risks, particularly those affecting health outcomes into actuarial and risk management practices that have traditionally relied on historical evidence.
3. Methodology
3.1. Survey Objectives and Context
This study was undertaken by the Working Party to assess how pension consultancies, life insurers, health insurers and reinsurance companies in the UK are integrating climate-related perils into the modelling of mortality and morbidity risks. Climate perils such as extreme heat, air pollution and flooding are increasingly recognised as drivers of excess mortality and morbidity (Guibert et al., 2025; Romanello et al., Reference Romanello, Di Napoli, Green, Kennard, Lampard, Scamman, Walawender, Ali, Ameli, Ayeb-Karlsson and Beggs2023).
However, their incorporation into actuarial models remains at an early stage, with considerable variation in methodologies, data usage and institutional readiness (Murage et al., Reference Murage, Macintyre, Heaviside, Vardoulakis, Fučkar, Ruksana and Hajat2024). The survey was designed to capture a snapshot of current actuarial practices, identify common challenges and inform the development of practical guidance for the profession. The results aim to contribute to efforts within the IFoA and beyond to improve the integration of long-term climate-health risks into actuarial systems.
3.2. Survey Design and Structure
The survey was designed following a targeted and profession-specific approach, aimed to assess the current state of practice, barriers to integration, use of climate-health data and readiness for incorporating climate perils into actuarial modelling. The survey was developed and reviewed by the Working Party to ensure relevance to the UK actuarial community and alignment with emerging regulatory and professional expectations.
The survey was developed by members of the Working Party, drawing on contemporary literature in climate science, epidemiology and actuarial modelling (Boumezoued et.al, Reference Boumezoued, Eifassihi, German and Titon2022; Romanello et al., Reference Romanello, McGushin, Di Napoli, Drummond, Hughes, Jamart, Kennard, Lampard, Rodriguez, Arnell and Ayeb-Karlsson2021; UK Health Security Agency, 2023; Taylor, Reference Taylor2023). The design followed best practices in climate-health and risk perception research ensuring relevance to the UK actuarial context (de Moura et al., Reference De Moura, de Magalhães and Albuquerque2023; Li et al., Reference Li, Yuan, Yue, Zhang and Huang2021; Susanna et al., Reference Susanna, Abdullah, Herdianti and Fadlirahman2025).
Questions were designed to cover five thematic areas listed in the Introduction. The survey contained 55 questions, including multiple-choice, Likert scale and open-text formats to capture both quantitative and qualitative insights. Questions were reviewed for face validity by members of the Working Party and external actuarial experts.
3.3. Sample
The survey was disseminated through professional networks of the IFoA between November 2024 and January 2025. Target respondents included actuaries working in UK-based life insurance, health insurance and pension consultancies, as well as reinsurance companies with UK exposure.
Dissemination channels included:
-
• IFoA member newsletters.
-
• Direct outreach to institutional contacts in the Working Party’s network.
-
• Targeted outreach through actuarial practice area groups (e.g., life, health, risk management).
Respondents were encouraged to forward the survey to relevant colleagues. All responses were anonymous, and participation was voluntary. Respondents were asked to consider climate-related mortality and morbidity risks primarily in the UK context, reflecting the UK focus of regulatory expectations, available data and actuarial practice addressed in this paper. A purposive sampling approach was adopted to ensure that respondents had relevant knowledge of mortality and morbidity modelling, climate risk or actuarial reporting. Where appropriate, respondents were encouraged to consult with modelling teams or colleagues before submission.
The study is subject to several limitations that should be acknowledged when interpreting the results. First, some bias may persist in the responses collected, as participation in the survey was voluntary and self-selecting. As a result, the views expressed may not fully represent the entire spectrum of perspectives within the UK pensions, insurance and reinsurance sectors.
Additionally, the timing of the data collection may have influenced responses, given the ongoing regulatory developments around climate risk disclosures, heightened market focus on Environmental, Social and Governance (ESG) performance and recent extreme weather events across the UK. These contextual factors may have shaped how respondents perceive and report their organisation’s preparedness and priorities in modelling climate-related mortality and morbidity risks.
Second, the sample size is relatively small (26 respondents) and is not statistically representative of the entire UK pensions, insurance and reinsurance market. Participation was voluntary and self-selecting, which may bias responses towards organisations or individuals with a greater existing interest in climate risk or sustainability issues. Third, responses reflect practitioners’ perceptions and self-reported practices rather than independently verified modelling outputs or outcomes. As such, the findings should be interpreted as an indicative snapshot of current practice rather than as definitive evidence of industry-wide behaviour. Despite these limitations, the survey provides valuable qualitative and descriptive insights into an emerging area of actuarial practice where systematic empirical evidence has been largely absent. The results are intended to inform professional discussion, guidance development and future research rather than to support statistical inference.
To improve transparency and traceability, results are presented thematically and explicitly linked to the corresponding survey questions (referenced as “Ref Qx” throughout). Figures and tables are used where appropriate to summarise key patterns in responses, while narrative discussion highlights areas of consensus, divergence and uncertainty across organisations. In total, 26 responses were received. Respondents reflected a diverse cross-section of organisational profiles, ranging from smaller entities to some of the largest organisations operating in the sector (Ref Q2). Most responses (about 60%) were from medium to large organisations, consisting of organisations with employee counts between 1000-4999 (19%) and over 5000 (42%).
Participants were asked (Ref Q1) to describe the areas of business their organisation was involved in, with the vast majority replying with pensions and life insurance (Figure 1). Some of the 26 respondents replied with multiple areas.
Area of business of the survey respondents.

Figure 2 indicates the periods over which mortality and morbidity outcomes are considered. Pension consultancies considered their mortality outcomes over a period of 20 years and above, whilst most life and health insurance companies considered mortality outcomes over 5–10 years on average. As expected, organisations providing a wide range of solutions considered their mortality outcomes over a wide range of terms consistent with the product design (Ref Q1 & Q5). Responses indicate that most stakeholders take a long-term view when considering mortality outcomes (Ref Q5), with over 30% looking beyond 20 years and 20% considering a 15–20-year horizon. Medium-term perspectives are also common, with 16% each focusing on 0–5 years, 5–10 years and 10–15 years.
Period over which outcomes typically considered: mortality (left) and morbidity (right).

There is considerable variation in the time horizons used for modelling morbidity outcomes (Ref Q8). All terms were almost uniformly selected, indicating that insurance and reinsurance companies model morbidity risks across the full duration of their contracts or portfolios.
Figure 3 presents the survey findings on how climate change has influenced recent mortality and morbidity outcomes in respondents’ business analyses.
Impact of climate change on recent mortality (left) and morbidity (right).

The survey results (Ref Q13) indicate that, for mortality, the most common response (where applicable) was that the impact of climate change is not identifiable (41% respondents), followed closely by those who found it unclear (35% of respondents). Only a small minority observed a direct change, with 18% reporting no noticeable impact and just 6% citing higher mortality rates. No respondents reported lower mortality rates.
A similar pattern emerges for morbidity (Ref Q17), where 41% of respondents found the impact unclear and 35% said it was not identifiable. Only a small share reported measurable changes. Taken together, these results for mortality and morbidity point to a common theme – while climate change is understood as a potential influencing factor, the majority of respondents either cannot disentangle its effect from other variables or lack the data and analytical clarity to do so. Most businesses currently lack clear or measurable evidence to attribute recent mortality trends directly to climate-related factors. This highlights a gap between climate risk awareness and its quantifiable integration into current health-related business assessments.
3.4. Analytical Approach
Given the exploratory nature of the survey, a mixed-methods approach was adopted to analyse the survey data:
-
• Quantitative data (from closed-ended questions) were analysed using descriptive statistics.
-
• Qualitative responses (from open-ended questions) were analysed thematically, allowing emergent themes and to be captured.
The paper did not apply inferential statistical methods, given the purposive sampling and qualitative emphasis of the study. However, the data provided a valuable insight into practice variation, emerging trends and collective priorities among actuarial practitioners working at the climate-morbidity and mortality interface. The study is exploratory and not intended to be statistically representative of the entire UK market. Nonetheless, the results offer a timely and informative view of practice maturity and areas for targeted intervention.
4. Results and Analysis
The survey responses revealed several recurring themes, challenges and opportunities related to the modelling of climate perils and their impact on mortality and morbidity risks. The following key findings emerged from the analysis:
4.1. Objective 1
Assess the current level of integration of climate factors in actuarial models and the setting of assumptions.
Figure 4 indicated that most respondents expect a realisation of a substantial deterioration in life expectancy due to climate change to emerge over a medium to longer-term horizon (Ref Q23).
Period over which substantial deterioration in life expectancy could emerge.

Of those that responded, the largest share (46%) anticipate this rise in mortality rates occurring within 10 to 15 years. Another significant portion (23%) foresee it happening between 5 to 10 years, while an equal share (23%) expects the impact within 15 to 20 years. Only a small minority (8%) project a timeframe beyond 20 years. Notably, no respondents expect such deterioration to emerge within the immediate 0 to 5 years.
Figure 5 indicates varied levels of integration of climate change into mortality modelling across the profession (Ref Q6). The level of integration could reflect the level of sophistication necessary, available approaches or barriers to use. Of those where it was applicable, scenario analysis (based on indicative factors) is the most widely adopted approach, with 78% of respondents currently using it.
Approaches to considering mortality outcomes from climate change.

Of those where it was applicable, Parameter Setting (based on plausible outcomes) shows a more balanced distribution: 25% currently use this method, 40% are developing it and 35% do not consider it at all. This suggests it is an emerging area of practice still under development for many organisations. Full climate models (in-house or external) were only applicable and used by a minority, implying that sophisticated modelling tools are not yet mainstream in actuarial applications.
This highlights a significant opportunity for capacity building, methodological guidance and standardisation in incorporating climate-driven mortality impacts into actuarial practice.
The survey responses (Ref Q9) consider morbidity outcomes from climate change less frequently in actuarial modelling compared to mortality outcomes. Figure 6 indicates that of those where it was applicable, Scenario analysis (based on indicative factors) is the most commonly used method, but uptake remains limited, followed by Parameter Setting (based on plausible outcomes); whereas full climate models (in-house or external) are rarely used.
Approaches to considering morbidity outcomes from climate change.

The responses to questions about modelling techniques that were used to analyse climate change effects on mortality and morbidity (Ref Q52) reveal limited adoption of quantitative modelling approaches across organisations. The most striking finding is that 40% of respondents (6 out of 15) indicated they use none of the listed modelling techniques, highlighting the nascent state of climate-health modelling in the actuarial field. Among those organisations that do employ modelling techniques, Survival Models were the most used, followed by Time Series Models and Regression Models. Advanced modelling approaches showed minimal adoption.
The low overall usage rates across all modelling categories, combined with the high percentage using no techniques at all, underscores the significant gap between the recognised importance of understanding climate impacts on mortality outcomes and the current practical implementation of quantitative modelling approaches in actuarial organisations.
Morbidity-related modelling of climate risks remains nascent in the actuarial profession and limited use of advanced modelling techniques underscores a significant gap in current practice. This highlights the need for clearer guidance on the relevance of climate-related morbidity outcomes, improved data availability and profession-led support to develop applicable modelling frameworks. Respondents identified (Ref Q11) several climate change related perils as having potentially major severity on UK population mortality, with temperature volatility (53% middling impact; 18% major), increases in infectious diseases (47% middling; 18% major) and changes to diet/lifestyle (47% middling; 12% major) standing out (Figure 7).
Factors influencing the severity of climate impact on UK mortality. A stacked bar graph compares the perceived severity of various climate change-related perils on UK mortality. The horizontal axis lists the perils: Temperature volatility, Increase in infectious disease, Changes to diet/lifestyle, Air pollution, Temperature increase, Climate-related migration, Food scarcity, Temperature decrease, Other extreme weather events, Excess precipitation and flood, Drought, Windstorm, Sea level rise and coastal erosion. The vertical axis represents the percentage of respondents, ranging from 0 percent to 100 percent. Each bar is divided into four segments representing the perceived severity: Major (dark blue), Middling (green), Minor (orange), and Insignificant (light blue). Notable trends include a high percentage of middling impact for most perils, with temperature volatility and infectious diseases showing significant major impact percentages.

Figure 7 Long description
A stacked bar graph compares the perceived severity of various climate change-related perils on UK mortality. The horizontal axis lists the perils: Temperature volatility, Increase in infectious disease, Changes to diet/lifestyle, Air pollution, Temperature increase, Climate-related migration, Food scarcity, Temperature decrease, Other extreme weather events, Excess precipitation and flood, Drought, Windstorm, Sea level rise and coastal erosion. The vertical axis represents the percentage of respondents, ranging from 0 percent to 100 percent. Each bar is divided into four segments representing the perceived severity: Major (dark blue), Middling (green), Minor (orange), and Insignificant (light blue). Notable trends include a high percentage of middling impact for most perils, with temperature volatility and infectious diseases showing significant major impact percentages.
Air pollution and temperature increases were also perceived as significant threats, with around half rating them as having at least a middling impact. Other risks, such as excess precipitation and flooding, food scarcity and climate-related migration, were seen as moderate to major threats by a smaller but notable proportion of respondents. In contrast, drought, windstorms and sea level rise/coastal erosion were generally rated as having minor or insignificant impacts on mortality, though some respondents still acknowledged their potential for serious consequences.
Overall, the survey indicates that temperature-related extremes, disease spread and lifestyle/dietary shifts are viewed as the most pressing mortality risks from climate change in the UK.
Respondents viewed temperature increase (59% highly likely; 22% possible) and temperature volatility (47% highly likely; 35% possible) as the most likely climate-related perils to significantly affect UK population mortality (Figure 8), followed closely by excess precipitation and flooding (35% highly likely; 47% possible). Increases in infectious diseases, air pollution, windstorm and rise in sea levels were also seen as notable threats.
Factors influencing the likelihood of climate impact on UK mortality.

Other perils considered to be plausible drivers of mortality risk included climate-related migration, changes to diet/lifestyle and other extreme weather events. By contrast, drought, temperature decrease and food scarcity were generally rated as less likely to have major mortality impact, with a substantial proportion of respondents considering them unlikely or impossible. Overall, perceptions highlighted temperature-related extremes, flooding and infectious disease spread as the most credible high-likelihood mortality risks for the UK.
Generally, respondents perceived an increase in infectious diseases and air pollution as having the greatest potential impact on UK population morbidity (Ref Q15), with around 64% rating its severity as middling or major (Figure 9). Temperature volatility was similarly considered impactful, with more than half rating its effect as middling, though none saw it as major. Moderate concern was expressed for temperature increase and changes to diet/lifestyle, both receiving mixed severity ratings but notable shares of middling or major impact.
Factors influencing the severity of climate impact on UK morbidity.

Other perils like excess precipitation and flood, food scarcity, climate-related migration and other extreme weather events were mostly rated as minor to middling in severity. Perils such as drought, windstorms and sea level rise and coastal erosion were predominantly considered to have insignificant or minor morbidity impacts. Overall, air pollution, infectious disease, lifestyle and temperature volatility stood out as the most concerning climate-related morbidity perils for the UK population.
Temperature increases are rated as the most likely climate peril to impact UK population morbidity, with nearly 60% rating this as highly likely and none considering it unlikely (Figure 10). Excess precipitation and flooding were also perceived as highly likely by over 40%, matched by those rating it as possible, indicating significant concern about these risks. Temperature volatility was seen as both highly likely (41%) and possible (29%). Increase in infectious diseases was mostly considered possible (65%). Air pollution and windstorms were similarly seen as possible or highly likely by a majority.
Factors influencing the likelihood of climate impact on UK morbidity.

In contrast, temperature decrease, food scarcity and drought were often considered unlikely or impossible, with fewer respondents viewing them as highly likely. Perils such as sea level rise and coastal erosion, climate-related migration, changes to diet/lifestyle and other extreme weather events were mainly rated as possible, with smaller proportions seeing them as highly likely.
Overall, rising temperature, flooding and temperature volatility emerged as the most likely contributors to morbidity among UK climate perils.
In relation to secondary factors with greatest impact on UK mortality and morbidity (Ref Q12 & Q16 respectively), respondents ranked less money for health and social care as the most significant secondary factor likely to impact UK mortality, followed by economic downturn caused by the cost of physical events (Figure 11).
Secondary factors with greatest potential impact influencing UK mortality (x-axis units: average rank).

Respondents ranked less money for health and social care as the secondary factor with the greatest potential impact on UK morbidity, scoring highest overall ranking (Figure 12). This was followed by concerns over skin cancer and other chronic illnesses, as well as mental illness caused by distress and anxiety, both scoring significantly high. Economic downturn caused by the cost of physical climate events was also seen as an important factor impacting morbidity. Other notable concerns included illness from pollution and changing diet/healthier eating, which scored moderately high. Factors such as social unrest, infrastructure failure and an increase in active travel or healthy activity were viewed as having a more moderate or lower impact.
Secondary factors with greatest potential impact influencing UK morbidity (x-axis units: average rank).

Finally, increased public awareness about environmental health risks and other extreme weather events were rated as having relatively less influence on morbidity outcomes. Overall, funding constraints on health and social care, chronic illnesses and mental health stood out as the most critical secondary factors affecting morbidity related to climate change.
Specific demographic and socio-economic factors (Ref Q32 & Q37) that could lead to variations in mortality outcomes from climate change, including wealth, age, frailty, disability status, occupation type, quality of housing and access to healthcare. Wealthier individuals are generally expected to adapt more effectively to both direct and indirect climate impacts, while those in lower socio-economic groups, areas of higher deprivation or with limited resources, may face greater risks due to poorer housing, reduced healthcare access and cost-of-living pressures, which could affect diet and lifestyle.
These patterns are consistent with emerging evidence that climate-related risks disproportionately affect socio-economically disadvantaged populations (Huang et al., Reference Huang, Zanocco, Wang, Hwang and Rajagopal2025; Olsen et al., Reference Olsen, Niedzwiedzb, Nicholls, Wheeler, Hob and Pell2025), reinforcing existing inequalities in mortality and morbidity outcomes (Cairns et al., Reference Cairns, Kallestrup-Lamb, Rosenskjold, Blake and Dowd2019; Cairns, Kleinow & Wen, Reference Cairns, Kleinow and Wen2024).
Climate transition risks, such as rising energy costs, may exacerbate inequalities by impacting NHS funding, service provision and individuals’ ability to make healthy choices. Older and more vulnerable populations are more susceptible to extreme weather, with hotter summers and colder winters posing heightened risks, while certain occupations, particularly outdoor and manual work, are more exposed to heat stress, consistent with evidence documented by the World Health Organization and the International Labour Organisation on occupational heat exposure and health risks (ILO, 2024; WHO, 2025). Broader economic impacts, such as migration from more climate-vulnerable regions, could further strain healthcare systems, making prevention strategies increasingly important.
Respondents also highlighted several demographic and socio-economic factors that could influence variations in morbidity outcomes related to climate change. Key themes included lifestyle differences, such as diet and physical activity levels, and the vulnerability of the UK’s food supply chain due to its reliance on imports, with potential climate impacts abroad affecting availability and nutrition. Some noted that climate change could shift consumer behaviour towards healthier, plant-based diets, while others pointed to risks from migration-driven pressures on NHS capacity and research. The emergence or spread of infectious diseases, particularly those transmitted by insects in warmer temperatures, was also cited as a concern.
Respondents stressed that people in areas of higher deprivation may face disproportionately negative health outcomes due to reduced access to healthy food, economic hardship, job losses, stress-induced unhealthy habits, overcrowding and greater exposure to climate-sensitive diseases. Several responses referred to earlier mortality-related comments, reinforcing the overlap in risk factors for both morbidity and mortality.
In relation to life expectancy deterioration when measured relative to a current central best estimate assumption, when asked which factors are considered to have direct or indirect impact within a longer-time horizon (Ref Q22 & Q24), respondents largely agree on certain responses. In particular, a significant majority (13 out of 16) believe that an increase in global temperature of 2°C or more by 2050 will have a strong negative impact on mortality rates.
Air pollution is also seen as a critical factor, with 11 out of 16 respondents identifying it as likely to contribute to rising mortality. In contrast, fewer respondents view higher levels of precipitation and flooding (3 of 16) or increased prevalence of wind (2 of 16) as major drivers of substantial life expectancy deterioration, suggesting these perils are perceived as less impactful on mortality over the longer term.
Most respondents highlight reduced healthcare spending and economic decline as the most significant indirect factors resulting from climate change that are likely to cause a substantial deterioration in life expectancy, cited by 11 out of 16 respondents. Socio-economic inequality is also seen as a major indirect factor, with 10 out of 16 reflecting concerns about widening disparities affecting health outcomes. A smaller yet notable number (6) consider a less active population as a contributing factor.
Respondents noted that demographic and socio-economic factors influencing morbidity outcomes from climate change are largely similar to those affecting mortality, with key drivers including lifestyle factors (diet, physical activity), socio-economic deprivation and access to healthcare. Climate-related disruptions to the food supply chain, given the UK’s reliance on imports, could worsen nutrition for lower-income groups, though increased climate awareness might shift preferences towards healthier, plant-based diets.
Migration driven by physical and transition risks could place additional strain on NHS resources, potentially affecting treatment availability and research capacity. Warmer temperatures may also increase the prevalence of vector- and water-borne diseases such as malaria. Those in higher deprivation areas may experience worsening health outcomes due to job losses, rising costs of healthy foods, increased stress, adoption of unhealthy habits and greater exposure to disease, with impacts potentially moderated by government interventions.
In summary, the findings indicate that while there is growing recognition of the medium- to long-term impacts of climate change on mortality and morbidity, the integration of climate factors into actuarial models remains limited and uneven across the profession. Scenario analysis is emerging as the most widely used approach for mortality outcomes, but uptake of advanced climate modelling, whether in-house or external, remains minimal; largely due to capability, resource or remit constraints. Morbidity outcomes are even less frequently modelled, with high rates of non-applicability and low adoption of any formal techniques, highlighting a clear gap in current practice.
The lack of widespread use of advanced quantitative tools, coupled with a substantial proportion of respondents employing no modelling techniques at all, underscores the need for targeted capacity building, profession-led guidance and improved data accessibility to embed climate-related health risks more systematically into actuarial modelling frameworks.
4.2. Objective 2
Document the use of assumptions and scenarios (e.g., climate scenarios) under the consideration of climate and socio-economic drivers in actuarial models for health and mortality.
The responses show varied views on the extent to which mortality assumptions already reflect the effects of climate change (Ref Q10). Of those where it was applicable, the largest group (54%) believe climate risk is one of many factors incorporated into overall mortality assumptions, though its impact is not separately identifiable. About 23% think climate risk effects are embedded in past experience without any further explicit allowance, while 15% view climate risk as an inherent uncertainty that does not require a specific adjustment. A smaller share (8%) report making a specific adjustment for climate risk as one among several influencing factors.
In relation to morbidity, the responses indicate that many participants do not explicitly incorporate climate change effects into morbidity assumptions (Ref Q14). Of those where it was applicable, 50% consider climate risk an inherent uncertainty that does not require a specific adjustment. A further 30% believe climate risk is one of many factors reflected in the overall assumption, though its impact cannot be individually identified, and 20% think its effects are already embedded in past experience without additional allowance. No respondents reported making a specific adjustment for climate risk as part of morbidity assumptions.
Across responses, there is a clear absence of explicit, isolated modelling of climate risk in morbidity assumptions, with most either subsuming it within general uncertainty or not considering it distinctly at all. When asked about whether passing climate tipping points would be reflected by step changes in assumptions towards a more pessimistic path (Ref Q25), respondents largely said “No,” and believe that such changes would be gradual rather than immediate or stepwise. Key concerns include that it won’t be immediately obvious when tipping points have been passed, with recognition more likely coming with hindsight, and that there isn’t necessarily a direct link between climate tipping points and mortality outcomes.
Several respondents emphasised the importance of scientific consensus and experience data over several years before assumptions would change, creating inherent delays before more pessimistic paths are adopted. Many noted the difficulty of isolating changes due to tipping points given their interconnected impacts with the economy and other ecosystems, with one respondent suggesting we may have already passed up to five tipping points but can’t tell due to lag effects and data challenges.
The responses suggest that the primary trigger for adopting more pessimistic mortality assumptions considering climate change (Ref Q33) would be clear, reliable and consistent evidence showing that climate change is materially impacting mortality rates. Several participants highlighted the need for observed increases in actual mortality experience or statistically robust links between climate-related outcomes (e.g., rising temperatures, spread of tropical diseases) and mortality trends. Others noted that trend-based evidence, especially if it indicates likely continuation could prompt a change, as would a demonstrated shift in the underlying risk factors influencing mortality.
A few respondents emphasised that such changes would likely follow profession-wide adjustments or updated CMI model allowances, particularly for smaller portfolios where independent adjustments may not be feasible. Broader triggers mentioned include global warming scenarios exceeding key thresholds (e.g., >1.5–2°C by 2050), deteriorating climate policies or emerging research indicating more acute mortality risks. Based on the survey responses about the possibility of sudden major collapse of mortality assumptions due to climate change (Ref Q34), most respondents view this scenario as possible but unlikely, with most expecting climate impacts on mortality to evolve gradually over time, rather than through sudden shocks.
However, several respondents identified specific scenarios that could trigger abrupt changes, including the emergence of tropical diseases taking hold rapidly, climate tipping points such as Gulf Stream collapse (which could cause 10–15°C degrees temperature drops in short periods), delayed transition scenarios where funding suddenly diverts away from healthcare while vector-borne diseases increase and extreme warming pathways combined with breaching multiple tipping points leading to global conflict and mass migration).
While acknowledging these possibilities, respondents emphasised the high uncertainty surrounding such scenarios, with one noting that “science will always be limited in scope” and another specifically stating it feels “unlikely in the UK,” while recognising potential for extreme scenarios involving resource shortages and emergence of new diseases.
When asked about what the trigger would be to adopt more pessimistic morbidity assumptions in light of expectations for climate change, respondents identified several possibilities (Ref Q38). The most common theme was the need for robust, reliable data demonstrating a clear and sustained link between climate change impacts such as rising temperatures, increased tropical disease prevalence or other risk factors and worsening mortality experience.
Several participants emphasised the importance of observable trends likely to persist, increased certainty of failing to limit warming to 1.5°C or 2°C by 2050 and emerging research showing more acute effects on mortality. Others noted that profession-wide changes, updates to CMI models or shifts in actuarial profession assumptions could act as catalysts, particularly for smaller portfolios. A few respondents highlighted the role of better understanding future risk pathways and adaptation limits before adjusting assumptions, while one indicated it was too early to comment.
Overall, the responses indicate limited specific consideration of morbidity impacts separate from mortality effects, with most respondents either uncertain about the distinction or viewing climate change impacts on morbidity through the same lens as their mortality assessments.
Based on the survey responses about whether typical climate scenarios used by actuaries adequately capture potential extremes in mortality expectations (Ref Q26), there is strong consensus (87% of respondents said No) that current approaches are insufficient, with respondents highlighting several key limitations. The primary concerns included inadequate exploration of tail risks and tipping points, which are largely excluded from existing scenarios despite evidence that critical thresholds like 1.5°C warming are being approached or breached; meaning quantitative scenario analysis struggles to capture the effects of crossing such tipping points and the increased volatility in outcomes this could generate.
Respondents noted that the link between climate and mortality is not well understood, with climate not viewed as a primary driver of mortality trends, and that typical climate scenarios were not specifically developed for mortality analysis purposes. Several highlighted that many actuaries approach climate change too narrowly (focusing solely on temperature effects) or simplistically (applying uniform effects across different generations), while others pointed out that most practitioners don’t currently reflect climate change in mortality assumptions at all, particularly at the insured level where better access to healthcare and resources may provide protection. Despite these limitations, some acknowledged that current deterministic scenarios, while imperfect, are “more informative than having nothing quantified” and that approaches are expected to develop over time as directional impacts become clearer, though the huge degree of uncertainty in potential climate pathways and associated mortality outcomes remains a significant challenge.
Based on the survey responses about whether typical climate scenarios used by actuaries adequately capture potential extremes in morbidity expectations (Ref Q27), respondents largely said No (93%), and echoed their concerns from the previous mortality question, with most providing brief references to their earlier answers (“as above,” “as per mortality,” “same answer as mortality”). The key substantive points raised include that the link between climate and morbidity is not well understood and climate is not seen as a primary driver of morbidity trends, similar to mortality concerns.
Respondents highlighted the difficulty in assigning probabilities to different climate outcomes, which complicates using these scenarios for assumption setting, though one noted that short-term business can typically be repriced annually to address this challenge. There was recognition that typical climate scenarios were not specifically developed for morbidity analysis purposes, and one respondent called for more research into climate change impacts on mental health specifically.
Overall, the responses suggest that morbidity considerations are even less advanced than mortality analysis in climate scenario work, with practitioners generally viewing morbidity through the same inadequate lens as mortality impacts, indicating that both areas require significant development in terms of understanding climate linkages and incorporating appropriate extreme scenarios into actuarial practice.
When asked about whether climate scenario analysis can help drive future decision-making regarding mortality expectations (Ref Q28), respondents generally view climate scenario analysis as a useful tool for informing judgement and understanding potential impacts, though with significant limitations. Many see it as valuable for providing context and exploring the range of possible outcomes, with one noting it can help “understand the potential materiality of the risks” and another emphasising its usefulness in “longer-term planning for pension schemes” by highlighting potential outcome ranges.
Respondents appreciate that climate scenario analysis can help examine mortality expectations alongside broader business impacts, particularly when combined with asset portfolio considerations, and can serve as input to judgement discussions even if immediate assumption changes aren’t warranted. However, several highlighted significant limitations, including that current climate scenarios are “not well suited to making informed decisions on assumptions,” with many preferring experience analysis or qualitative narrative-based approaches, and noting the large uncertainty in future outcomes makes it difficult to isolate individual drivers of mortality experience.
Some respondents acknowledged that while decisions are unlikely to be made based solely on climate mortality effects, particularly for UK pension schemes, holistic scenario modelling should consider climate as one of many interrelated material factors, with one noting that dismissing impacts as “second order” is no longer justifiable and that low materiality assumptions should be rigorously validated through analysis.
When asked about whether climate scenario analysis can help drive future decision-making regarding morbidity expectations (Ref Q29), 75% of respondents were in the affirmative. Respondents generally view it as a useful input to judgement discussions, though they acknowledge significant limitations and note that morbidity modelling capabilities are less developed than mortality modelling. Several respondents emphasised that climate scenario analysis is “not well suited to making informed decisions on assumptions,” preferring experience analysis or qualitative narrative-based approaches; while others noted the high uncertainty surrounding long-term morbidity impacts makes it challenging as a basis for robust decision-making.
However, many see value in exploring climate scenarios as part of examining emerging risks, even if no immediate assumption changes result, with one highlighting the importance of considering the full range of physical and transition risk drivers and how these translate into morbidity impacts; including behavioural choices, offsetting impacts and regional or socio-economic variations.
Respondents noted that morbidity expectations are driven by risk factors sensitive to climate risk and that low materiality assumptions should be rigorously validated through analysis, while some suggested particular value in holistic sensitivity awareness where specific morbidities may be more acutely linked to climate effects. Overall, the responses indicate that while climate scenario analysis has a role in morbidity decision-making processes, it remains an emerging area with substantial uncertainty, which requires careful integration with other analytical approaches.
While there is growing awareness of climate change as a driver of future mortality and morbidity risks, its integration into actuarial models remains uneven and heavily weighted towards scenario analysis, with limited uptake of parameter setting and very low adoption of full climate models. Mortality impacts are considered more often than morbidity impacts, and a substantial proportion of respondents reported using no quantitative modelling techniques at all.
Most actuaries treat climate risk as embedded or general uncertainty – explicit adjustments are rare. Changes to assumptions are expected to be gradual; sudden collapses are seen as possible but unlikely. Current climate scenarios poorly capture extreme risks or tipping points. Scenarios are helpful for context and planning but not reliable alone for setting assumptions.
4.3. Objective 3
Identify methodological barriers and data constraints that impede the effective integration of climate, environmental and socio-economic factors in actuarial practice.
Based on the survey responses about whether there are suitable data sources for modelling climate change impacts on mortality outcomes relevant to insurers and reinsurers (Ref Q45), the responses reveal mixed views, with significant gaps in current practice. Several respondents acknowledged they haven’t investigated this area or have no opinion, while others noted the extreme difficulty in distinguishing climate change impacts on current mortality rates, particularly given the typically short experience periods used in analysis.
Those who have engaged with available resources pointed to work by the Climate Financial Risk Forum (CFRF) (convened by the PRA and FCA), specifically highlighting the “Physical Risk Underwriting Guide” (CFRF, 2022) and Climate Scenarios Working Group outputs, with particular relevance found in short-term climate scenarios work (CFRF, 2024), and some mentioned using papers like “No Time to Lose” for scenario testing and claims impact assumptions (Abrams et al., Reference Abrams, Clark, Cliffe, Lenton and Oliver2023; Baer et al., Reference Baer, Gasparini, Lancaster and Ranger2023).
However, respondents emphasised significant limitations (see for example Trust et al., Reference Trust, Saye, King, Patel and Martin2022; Reference Trust, Joshi, Lenton and Oliver2023; Reference Trust, Bettis, Saye, Bedenham, Lenton, Abrams and Kemp2024), noting that while there may be some suitable data sources, they are “very limited and significant judgments will need to be applied,” and that there’s “lots of information on economic scenarios, but health ones” are lacking. The consensus suggests high uncertainty, requiring ongoing monitoring and collaboration between actuarial associations, insurance associations and regulators, with recognition that suitable data sources do exist within scientific research and specialist organisations; but the profession needs to remain open-minded to emerging science and rigorous perspectives while developing more sophisticated modelling approaches to consider possible current and future impacts.
Responding to the survey questions about limitations in data sources for modelling climate change impacts on health outcomes (Ref Q48), respondents identified numerous significant challenges that hinder effective analysis in this area. Key limitations include the lack of reliable UK insurance-specific data that can distinguish climate change impacts from other factors, with many confounding influences making it difficult to isolate climate effects on current mortality rates, and insufficient linkages drawn between mortality and climate change in what appears to be an early-phase field.
Respondents highlighted substantial data gaps, including connections between the economy and healthcare spending to mortality, along with high uncertainty in climate models, high deviation in climate outcomes and complex interactions such as how biodiversity impacts in one country affect global food insecurity. Technical challenges include the need for sufficient projections of economic factors under plausible scenarios that incorporate tipping points with assigned probabilities, the difficulty of adapting population-level data to insured populations, and the problem that objectively defined scenarios are infrequently updated.
However, some respondents acknowledged ongoing efforts by the financial services industry to understand and address these limitations, particularly referencing work by the Climate Financial Risk Forum on short-term climate scenarios that explores climate modelling limitations and approaches to address them. Several respondents noted that potential concerns about denial or green-washing claims make actuaries and clients over-cautious about expressing views, which reduces focus on this area; while others indicated that their organisations have limited exposure to mortality/morbidity risks and have chosen to focus resources on other areas like ESG investments, rather than on climate change modelling.
To address the challenges in modelling climate change impacts on health outcomes (Ref Q49), respondents offered a range of solutions while acknowledging the fundamental difficulties involved. Key approaches suggested include: increased availability of projections for economic and behavioural factors under wider ranges of plausible climate scenarios; the establishment of working groups that can highlight existing data and relevant research even if they cannot create new data; and focused efforts on education, awareness and research including the development of health scenarios specifically linked to climate change.
Several respondents pointed to ongoing industry efforts, particularly referencing the Climate Financial Risk Forum’s work on short-term climate scenarios that explores modelling limitations and frameworks to address them, which they view as applicable to the life insurance industry’s understanding of climate risks on mortality and morbidity. Other suggestions included developing credible industry-led scenarios with predicted metrics, reducing “quant-bashing” with better messaging to help stakeholders understand that scenarios are illustrations rather than predictions and generally fostering better understanding of the approaches and frameworks available to deal with known data and model limitations. However, some respondents were pessimistic about solutions, with one stating they’re “not sure they can” be addressed given the complexities around attributing deaths to particular causes, especially where effects are not directly linked to temperature or other direct physical impacts. This highlights the ongoing challenge of establishing clear causal relationships between climate change and health outcomes.
Based on the survey responses about additional comments on modelling and data availability for climate change impacts on health outcomes (Ref Q53), respondents highlighted both ongoing efforts and fundamental challenges in this emerging field. While some work is underway, including literature reviews on potential mortality impacts that have not yet reached conclusions, there is recognition of a critical gap in reliable experience data that can distinguish deaths directly or indirectly caused by climate change in the UK. Respondents view this as very difficult to address and unlikely to be resolved in the medium term, limiting significant modelling advancements.
Respondents noted varying data availability across different areas: climate data is generally available daily, mortality data is available weekly for many populations but often lacks required granularity (though may be obtainable from national statistics institutes upon request); while morbidity data at sufficient granularity is generally limited to infectious disease incidence through national disease control centres, with other health data potentially available for research purposes. Despite these challenges, one respondent emphasised that the complexity of modelling, its nascent stage, and data availability challenges should not be used as arguments against pursuing modelling efforts, suggesting the field should continue developing despite current limitations. Overall, the responses reflect an acknowledgement of significant data and methodological challenges while maintaining that progress should continue in this important but underdeveloped area of actuarial practice.
In summary, the results consistently highlight significant methodological barriers and data constraints that impede the effective integration of climate change impacts into actuarial practice. Many respondents find it extremely difficult to distinguish climate impacts on current mortality rates. Attribution of deaths to climate change is inherently complex, with no reliable UK experience data expected soon. Mortality data is more accessible than morbidity data but both lack granularity. Suggested solutions include increased availability of economic and behavioural projections under varied climate scenarios, and modelling efforts should continue and evolve.
4.4. Objective 4
Document modelling practices relating to climate change impacts on mortality and morbidity to inform future modelling approaches.
Based on the survey responses about what information is considered when modelling the impact of climate change on mortality (Ref Q30), respondents reveal a wide spectrum of approaches ranging from “very little at present” to comprehensive multi-factor analyses.
The most detailed responses describe considering the full range of physical and transition risk drivers and their translation into mortality impacts, including behavioural choices, offsetting impacts and regional or socio-economic variations; with specific factors mentioned including temperature changes, pollution, extreme weather events, air quality, GDP variations, healthcare spending and resilience, mitigation costs and lifestyle factors such as smoking rates and exercise levels.
Several respondents incorporate economic projections under different climate scenarios, such as from NGFS sources, and consider macroeconomic variables like GDP and unemployment alongside health-related factors like infectious disease incidence and natural hazard mortality. However, many responses indicate limited direct analysis. Some conduct only qualitative assessments due to limited exposure to mortality risk. Others note that their approach is primarily driven by compliance requirements such as TCFD reporting rather than actual decision-making, leading to pragmatic illustrations of possible mortality paths without suggesting which is most likely.
A key challenge highlighted is that with no clear observable impact from climate change on past UK mortality rates, it remains difficult to draw direct conclusions that would lead to different assumptions, with many schemes still heavily anchored to experience data.
On the other hand, when asked about the information considered when seeking to model the impact of climate change on morbidity (Ref Q35), most respondents indicated that little or no specific modelling is currently done for the impact of climate change on morbidity, with many treating morbidities in line with mortality assumptions, particularly for pension schemes. Where considered, factors include potential increases in chronic conditions, higher incidence of infectious diseases and skin cancer, cardiovascular impacts from non-optimal temperatures and mental health effects from both extreme weather events and socio-economic pressures. Some noted that climate scenario analysis can incorporate different climate pathways and associated economic outcomes, but often only on a qualitative basis due to limited exposure to morbidity risk and significant uncertainty in the scale and direction of impacts over time.
Most respondents felt that UK regional variations are unlikely to be highly material for modelling the impact of climate change on mortality (Ref Q31), particularly for pension scheme assumption setting, given the wide geographic spread of members and the UK’s relatively high adaptive capacity. Direct physical impacts, such as extreme weather, are expected to be less severe than in more vulnerable regions; with effects more likely to be chronic and long-term, such as increased prevalence of respiratory or cardiovascular diseases.
Regional variation may be more relevant when linked to socio-economic differences (e.g., Index of Multiple Deprivation bands), as climate change could widen existing health and lifespan inequalities, especially between insured lives who are typically healthier, wealthier and more resilient and the general population. Potential regional patterns include the urban heat island effect, particularly in deprived urban areas, and temperature gradients between northern and southern regions; while risks from sea level rise or natural catastrophes are likely to be mitigated by adaptation or migration. Where robust, granular data (e.g., postcode-level mortality studies) exists, it could be incorporated into multi-factorial models that combine socio-economic and environmental indicators, though many such data sources are backward-looking.
Most respondents reported that UK regional variations are not currently a significant focus in modelling the impact of climate change on morbidity, with many aligning their approach to that used for mortality and often not setting morbidity assumptions independently, especially for pension schemes. Where considered, regional differences could be linked to variations in chronic condition prevalence, infectious disease incidence, skin cancer rates, cardiovascular impacts from non-optimal temperatures and mental health effects driven by extreme weather events or socio-economic stressors (Ref Q36). Some acknowledged that climate scenario analysis could incorporate different regional climate and economic pathways, but this is typically qualitative due to limited morbidity risk exposure and substantial uncertainty in the magnitude and direction of future impacts.
Most respondents felt that it is very difficult to model the impact of climate change on mortality and morbidity independently from other drivers (Ref Q40), as economic, lifestyle, behavioural and healthcare factors are highly interconnected. While some noted that certain elements, such as temperature-related mortality, can be modelled as independent factors, the overall magnitude and direction of impacts depend heavily on interactions between multiple drivers, making full isolation challenging.
Limitations in data, particularly the lack of granular health information, further constrain efforts and forward-looking modelling is complicated by the difficulty of distinguishing the climate-related component within economic projections. Some suggested using shock scenarios or modelling primary and secondary factors separately as pragmatic approaches, though even in cases like heat- versus cold-related mortality, disentangling climate effects from other causes (e.g., infectious disease spread in winter) remains problematic. A few respondents acknowledged that literature is evolving, and reasonable efforts can be made, but most agreed that complete independence in modelling is unlikely to be achievable.
However, responses revealed a split in views, with 57% agreeing and 43% disagreeing that modelling climate change risks on mortality and morbidity should focus primarily on plausible health outcomes (Ref Q41). Supporters argued that health outcomes are a fundamental driver, especially for morbidity, and should be a starting point before incorporating other relevant factors. Some stressed the value of exploring the full range of potential outcomes, including extreme or tail risks, and recognised that indirect health effects may be more significant than direct mortality impacts. Others emphasised integrating climate health risks with broader investment, liability and socio-economic considerations, tailoring approaches to organisational capabilities, data availability and business models. Overall, while many acknowledged the centrality of health in such modelling, there was consensus that it should be complemented by other material factors and wider scenario analyses.
Respondents identified a wide range of plausible health outcomes to consider when modelling climate change risks for mortality and morbidity, covering both direct and indirect effects (Ref Q42). Commonly cited outcomes included cardiovascular events linked to heat stress, respiratory illnesses, skin cancer and allergies exacerbated by longer pollen seasons; as well as infectious diseases and vector-borne illnesses in particular. Several noted the role of extreme heat in damaging the cardiovascular, respiratory and renal systems, alongside potential interactions with medications. Mental health impacts such as post-traumatic stress disorder, depression, anxiety and “climate anxiety” were highlighted, particularly following natural catastrophes. Air pollution, dietary shifts towards plant-based foods and the general worsening of health outcomes due to economic stress on healthcare services were also discussed. Respondents further noted that climate change could indirectly strain healthcare capacity and resources, leading to poorer management of chronic conditions and overall declines in well-being.
Respondents overwhelmingly agreed that health outcomes are strongly dependent on the economic outlook (Ref Q43), citing multiple pathways through which economic conditions influence public health. Key factors include NHS capacity constraints, the impact of rising living costs on lifestyle choices and reduced healthcare spending during economic downturns, which can hinder preventive care and screening. Several noted that these effects are particularly pronounced among lower socio-economic groups and in areas with higher deprivation. Specific links were made to the worsening of chronic conditions such as cardiovascular, respiratory and renal diseases; as well as allergies and skin cancer, with impacts often developing gradually. Some respondents referenced statistical evidence, including regression models showing significant relationships between climate-adjusted GDP, macroeconomic variables and health outcomes. While one comment suggested the link may be more limited among insured populations with better socio-economic status, the consensus was that economic conditions are a major determinant of health.
Respondents suggested that the impact of climate change on mortality and morbidity is best incorporated through a combination of expert judgement, scenario analysis and integration into broader risk driver models (Ref Q44). Many favoured pragmatic approaches that consider both physical and transition risks, accounting for their magnitudes, directions and potential offsetting effects. For pension schemes, narrative-based assessments and adjustments to long-term mortality assumptions were seen as effective, reflecting the expectation that climate impacts will emerge gradually over time. Scenario testing often with high-level mortality shocks was recommended to explore potential outcomes, supported by an understanding of how climate change influences macroeconomic, demographic and healthcare-related drivers. Some highlighted the value of computable general equilibrium models or other frameworks that allow climate-adjusted variables to be tested under different scenarios. Across responses, there was consensus that models should aim to improve understanding of risks rather than provide precise predictions, with attention to age and socio-economic differences in vulnerability.
When asked how model developers should best link climate factors with mortality risks, and whether there are gaps relative to what is currently done, respondents generally agreed that there are gaps in how climate factors are currently linked to mortality risks, largely due to limited reliable data and the greater perceived materiality of other risk drivers. Suggestions for improvement included adopting a risk driver approach, developing scenarios that capture the relationships between climate change and key drivers such as healthcare spending and integrating climate-adjusted macroeconomic, macro financial and demographic variables into models. Some noted that while life and health insurers have begun this work, practices remain inconsistent. Overall, respondents stressed the need for holistic, objective approaches that can be tracked against observable future statistics to strengthen the connection between climate factors and mortality outcomes.
Over 80% of respondents agreed that even if transitional factors are more relevant to mortality and morbidity than physical factors in the UK, analysis of physical risks remains important when building models and setting assumptions (Ref Q47). Many saw it as a valuable starting point, as physical risk impacts are often clearer and more tangible, helping to build understanding and ensuring models are not viewed as incomplete or unfit for purpose. Respondents noted that physical risks could become more material over time, particularly for certain populations or regions, and that both types of risk should be assessed through robust materiality analyses. While transitional factors may dominate in the short to medium term, the longer-term uncertainty and potential significance of physical risks mean they should not be overlooked, especially given the actuarial profession’s interest in long-term assumptions and responsible consideration of global impacts.
In summary, survey responses reveal that modelling the impact of climate change on mortality and morbidity in actuarial practice is characterised by wide variations in approach, ranging from limited current analysis to detailed multi-factor frameworks. While many organisations rely heavily on historical mortality data and compliance-driven scenario illustrations, some welcome incorporating broader health and macroeconomic variables under plausible climate scenarios.
Respondents emphasise the complexity of isolating climate impacts from interconnected drivers such as lifestyle, healthcare and economic conditions, suggesting pragmatic approaches that combine expert judgement, scenario analysis and integration with broader risk models. There is consensus on the importance of including physical risks alongside transitional risks despite the latter’s perceived greater short-term relevance, reflecting the need for robust, holistic models that improve risk understanding rather than yield precise predictions. Overall, scenario-based approaches are favoured to understand risks rather than predict precise outcomes.
4.5 Objective 5
Capture and analyse stakeholder demand for improved guidance, tools and collaboration opportunities to enhance the integration and communication of climate and health/mortality factors in actuarial modelling.
When asked about how the uncertainties in modelling the risk of climate change to human health (mortality and morbidity) can be adequately communicated with stakeholders (Ref Q50), respondents suggested multiple approaches to communicating the uncertainties in modelling climate change risks to human health. Common themes included using scenario analysis to illustrate a range of potential outcomes under different climate pathways, complemented by qualitative narratives to capture factors not explicitly modelled. Several emphasised making model limitations explicit, assessing whether they lead to over- or underestimation of risk (often the latter) and quantifying the potential magnitude of any underestimation. Others advocated expressing impacts in financial terms, using relative risk measures and taking a holistic view of both assets and liabilities.
The importance of clear scoping, open discussion and engaging a broader set of stakeholders including scientific experts was also highlighted. Some recommended promoting understanding of deterministic models and ensuring that stakeholders appreciate that extreme but plausible outcomes remain possible. Overall, transparency, breadth of perspective and blending quantitative with qualitative insights were seen as key. Most respondents (67%) felt that modelling climate change risks for mortality and morbidity does not necessarily lead to better stakeholder communication than scenario modelling (Ref Q51), cautioning that such models can become complex “black boxes” whose assumptions are difficult for non-technical audiences to interpret.
Many noted that scenarios are generally easier to explain and can help stakeholders visualise how risks may materialise and interact. Only 33% felt that modelling could provide a clearer link to outcomes, and several respondents suggested that the most effective approach may be to use both methods together, to produce quantitative insights and scenarios to provide contextual clarity while tailoring communication to the audience’s technical expertise. Concerns were also raised about the reputational risks of relying on extensive assumptions in stochastic or overly narrow climate-focused models.
Most respondents supported focusing on UK experience for practical reasons, though several expressed interest in later or separate work covering other countries (Ref Q54). Suggested priorities included the US and Canada, given their relevance to certain markets, and a broader comparative approach examining differences between countries by climate, wealth and policy context. While some felt non-UK analysis was not directly applicable to advising UK pension schemes, others noted it could help identify second-order impacts such as global economic effects, migration and the spread of disease. A few emphasised that many climate issues are global in nature and would benefit from greater international collaboration between actuarial associations.
Respondents expressed a willingness to contribute further to discussions, noting that such engagement would be valuable (Ref Q55). Several comments focused on the implications for retirement and investment businesses, where clients – typically pension scheme managers, trustees or sponsors – often view climate change as leading to lower life expectancies and thus reduced liabilities, meaning it is not currently seen as a major risk requiring extensive analysis. Some organisations have considered perspectives from insurance consulting teams that have analysed both direct and indirect climate impacts on UK mortality rates. There was also support for providing industry guidance and highlighting best practices, particularly where methods are robust enough to inform decision-making. Additionally, respondents emphasised the importance of consistency with how actuaries model other assumptions and recognised a broader public need for perspectives beyond assumption-setting alone.
While data and methodological constraints currently limit fully quantitative modelling of climate-related mortality and morbidity risks, the survey responses suggest several potential entry points for actuarial practitioners. First, climate risk could be incorporated qualitatively into assumption-setting and governance processes, for example through structured expert judgement, explicit narrative disclosures and sensitivity testing around key health-related drivers such as heat exposure, air quality and healthcare capacity. Second, scenario analysis offers a pragmatic starting point, allowing practitioners to explore plausible ranges of outcomes under different climate and socio-economic pathways without requiring precise probabilistic calibration. Such scenarios can be aligned with existing NGFS, CBES or IPCC pathways and translated into high-level mortality or morbidity impacts using conservative assumptions.
Third, climate considerations can potentially be embedded within existing actuarial workflows such as assumption-setting papers and risk registers, rather than treated as a standalone modelling exercise. This approach reflects current practice maturity while supporting gradual capability development. Finally, governance processes play a critical role. Clear documentation of assumptions, limitations and areas of uncertainty can enhance transparency for trustees, regulators and other stakeholders, even where quantitative impacts remain uncertain.
5. Conclusions
The paper reports the results of a survey of 26 respondents drawn from across the UK, life (re) insurance, pensions and actuarial consultancies.
The objectives were to:
-
• Assess the current level of integration of climate (and linked environmental and socio-economic) factors in actuarial models and the setting of assumptions.
-
• Document the use of assumptions and scenarios under the consideration of climate and socio-economic drivers in actuarial models for health and mortality.
-
• Identify methodological barriers and data constraints that impede the effective integration of climate, environmental and socio-economic factors in actuarial practice,
-
• Document modelling practices relating to climate change impacts on mortality and morbidity to inform future modelling approaches.
-
• Capture and analyse stakeholder demand for improved guidance, tools and collaboration opportunities for enhancing the integration and communication of climate and health/mortality factors in actuarial modelling.
The analysis of responses revealed several important themes:
-
1) Varied levels of integration of climate (and linked environmental and socio-economic) factors in actuarial models and the setting of assumptions
While some organisations have begun incorporating climate scenarios into their mortality and morbidity modelling, many are still in the early stages. The level of integration varies significantly across respondents. When modelling mortality and morbidity, climate change is understood to be a potential factor, but most respondents either cannot disentangle its effect from other variables or lack the data and analytical clarity to do so. This highlights a gap between climate risk awareness and practical implementation of quantitative actuarial modelling. The responses to the survey show varied views on the extent to which mortality assumptions already reflect the effects of climate change. Over half of respondents believe climate risk is one of many factors incorporated into overall mortality assumptions, though its impact is not separately identifiable.
-
2) Use of scenarios (e.g., climate scenarios) under the consideration of climate perils in actuarial models for morbidity and mortality
While scenario analysis is used as a practical method, there is limited uptake of advanced climate modelling. This highlights a significant opportunity for capacity building, methodological guidance and standardisation in incorporating climate-driven mortality impacts into actuarial practice. Regarding future decision-making for mortality expectations, respondents generally view climate scenario analysis as a useful tool for informing judgement and understanding potential impacts, but with significant limitations.
-
3) Methodological barriers and data constraints of translating climate perils into health-related actuarial impacts in actuarial practice
A common concern relates to the availability, quality and granularity of climate-related data, as well as the absence of methodologies to translate climate variables into health-related actuarial impacts. Respondents highlighted the difficulty in projecting the long-term health impacts of climate change, especially regarding chronic conditions, heat-related morbidity and regional variability.
Respondents emphasised significant limitations in available data sources, noting that while there may be some suitable sources, they are limited, and significant judgement need to be applied. There is a lot of information on economic scenarios, but there are gaps in connections between economy and healthcare spending to mortality. Respondents to the survey noted that typical climate scenarios were not specifically developed for mortality and morbidity analysis purposes. Suggestions for improvement included developing scenarios that capture the relationships between climate change and key drivers such as healthcare spending. Most respondents felt that it is very difficult to model the impact of climate change on mortality and morbidity independently from other drivers, as economic, lifestyle, behavioural and healthcare factors are highly interconnected.
-
4) Document modelling practices relating to climate change impacts on mortality and morbidity to inform future modelling approaches.
While many organisations rely heavily on historical mortality data and compliance-driven scenario illustrations, some welcome incorporating broader health and macroeconomic variables under plausible climate scenarios, suggesting pragmatic approaches that combine expert judgement, scenario analysis and integration with broader risk models.
The survey findings point to several priority, albeit challenging, areas for future research and methodological development that would be particularly valuable for UK actuarial practice. These include: the development of UK-relevant climate-health datasets linking environmental exposures, socio-economic variables and mortality or morbidity outcomes at appropriate spatial and temporal resolution; the construction of standardised climate-mortality and climate-morbidity scenarios suitable for actuarial use, including exploration of tail risks and tipping points; greater use of spatial and socio-economic stratification to understand differential vulnerability across populations; and translation of emerging statistical and epidemiological methods such as spatio-temporal and Bayesian models into forms that can be operationalised within actuarial pricing, reserving and funding frameworks. Progress in these areas would help bridge the gap between climate-health science and actuarial application, supporting more consistent and credible practice.
-
5) Demand for improved guidance, tools and collaboration opportunities to enhance the integration and communication of climate and health/mortality factors in actuarial modelling
There was a strong call for more collaboration across the profession, as well as the development of shared guidance, case studies and tools to support consistent and credible modelling practices. Overall, these insights indicate a need for coordinated action within the actuarial profession to improve modelling capabilities in the face of climate-related health risks and suggest that while awareness of climate-related health risks is growing, current practice remains at an early stage and may reflect a degree of reliance on experience data that risks delaying meaningful action. Given the long-term nature of mortality and morbidity assumptions, this raises important questions for the profession regarding preparedness, capability development and proportional response to emerging systemic risks. The Working Party recommends further research, development of shared resources and closer collaboration with overseas actuarial organisations, academic, regulatory and industry bodies to advance this important area.
Supplementary material
The supplementary material for this article can be found at https://doi.org/10.1017/S1357321726100476.
Data availability statement
All data supporting this study are available from the corresponding author upon reasonable request.
Acknowledgements
The authors acknowledge the following former members of the Working Party for their valuable input into the design of the survey and background: David Gray, Mary Hall, Hande Love and Gareth W. Peters. Finally, the authors would like to thank all the respondents to the survey for their time and insights and for the support and guidance from the Institute and Faculty of Actuaries, particularly Stuart Gray. The authors are grateful to the anonymous reviewers for providing very constructive comments which helped shaped the paper.
Competing interests
The authors declare none.
Funding statement
This work received no specific grant from any funding agency, commercial or not-for-profit sector.
Disclaimer
The views expressed in this publication are those of the invited contributors and do not necessarily represent the views of their employers or of the Institute and Faculty of Actuaries. The Institute and Faculty of Actuaries do not endorse any of the views stated, nor any claims or representations made in this publication and accept no responsibility or liability to any person for loss or damage suffered as a consequence of their placing reliance upon any view, claim or representation made in this publication. The information and expressions of opinion contained in this publication are not intended to be a comprehensive study, nor to provide actuarial advice or advice of any nature and should not be treated as a substitute for specific advice concerning individual situations. On no account may any part of this publication be reproduced without the written permission of the Institute and Faculty of Actuaries.
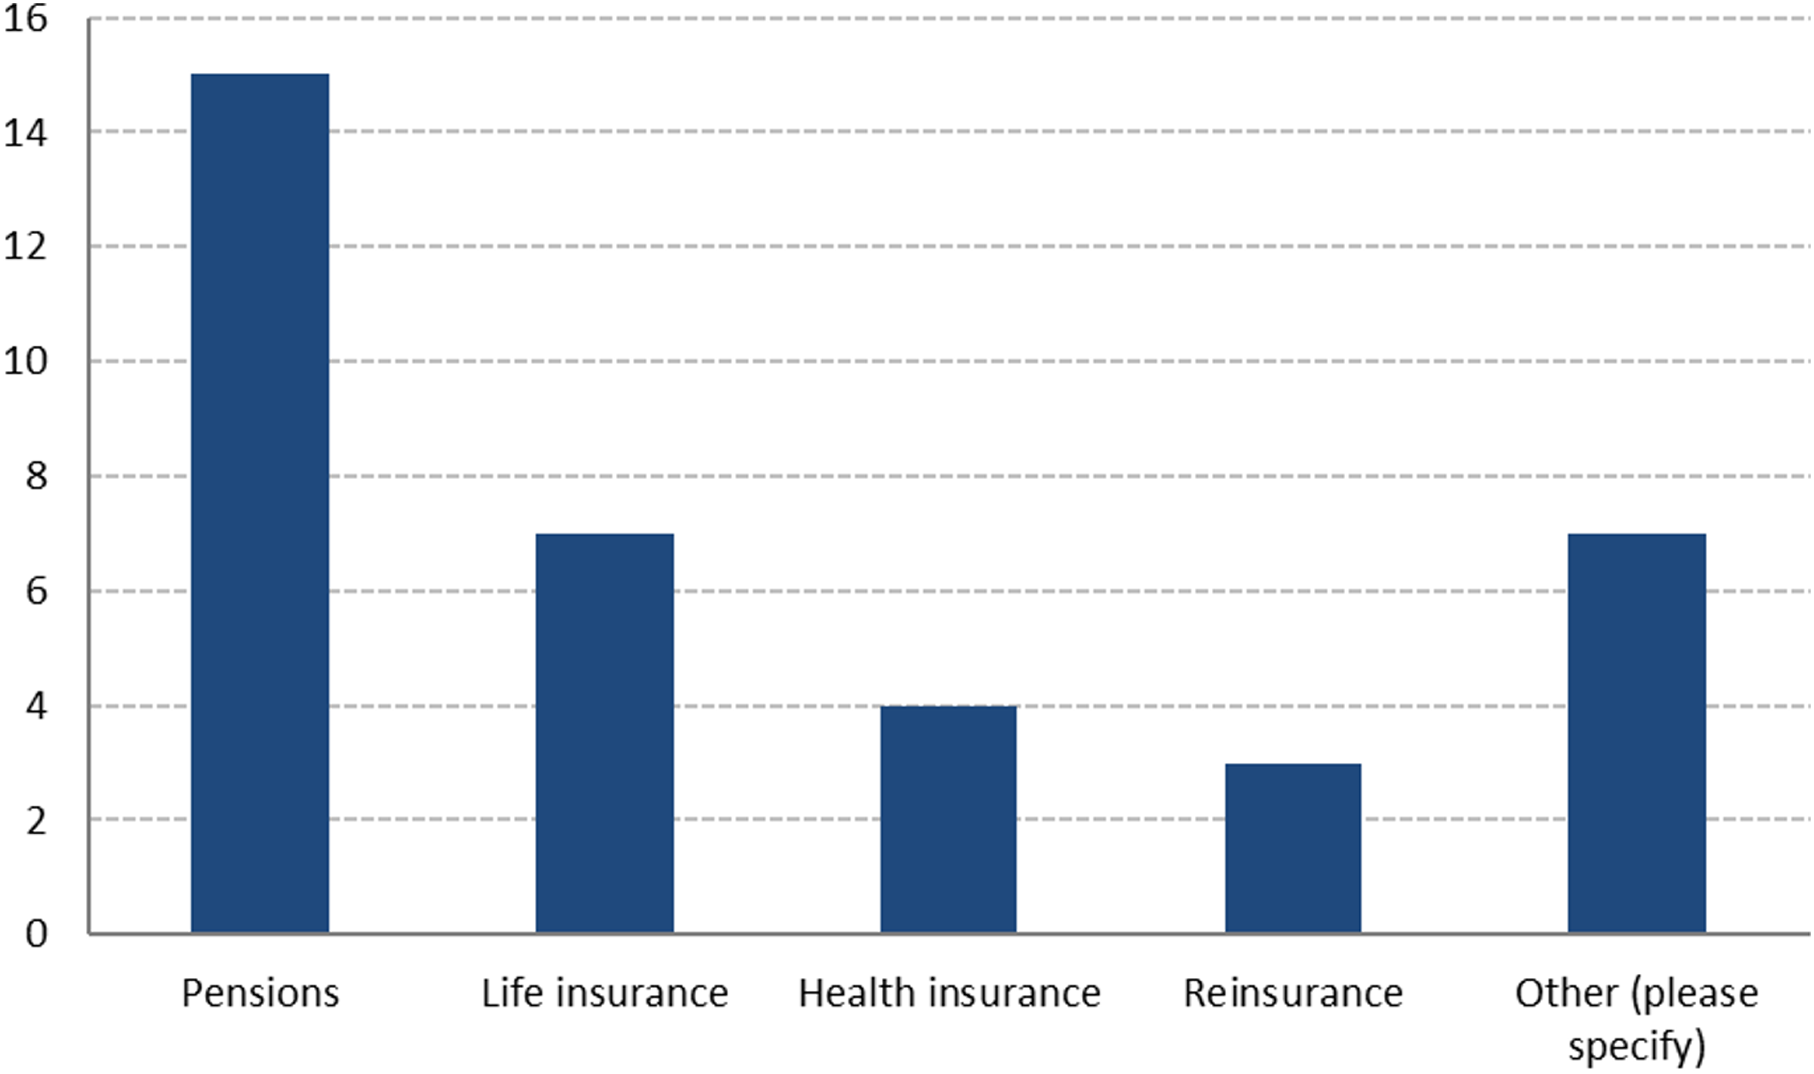
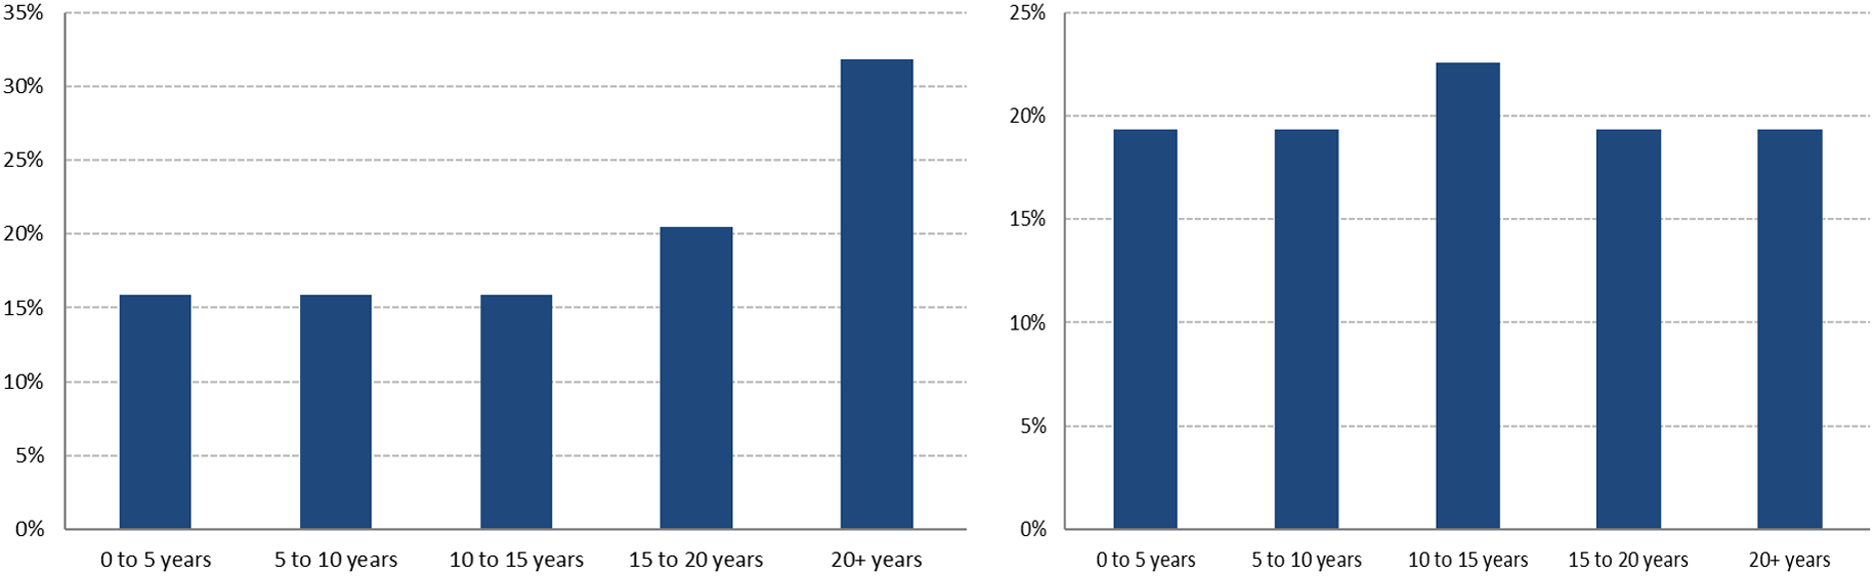
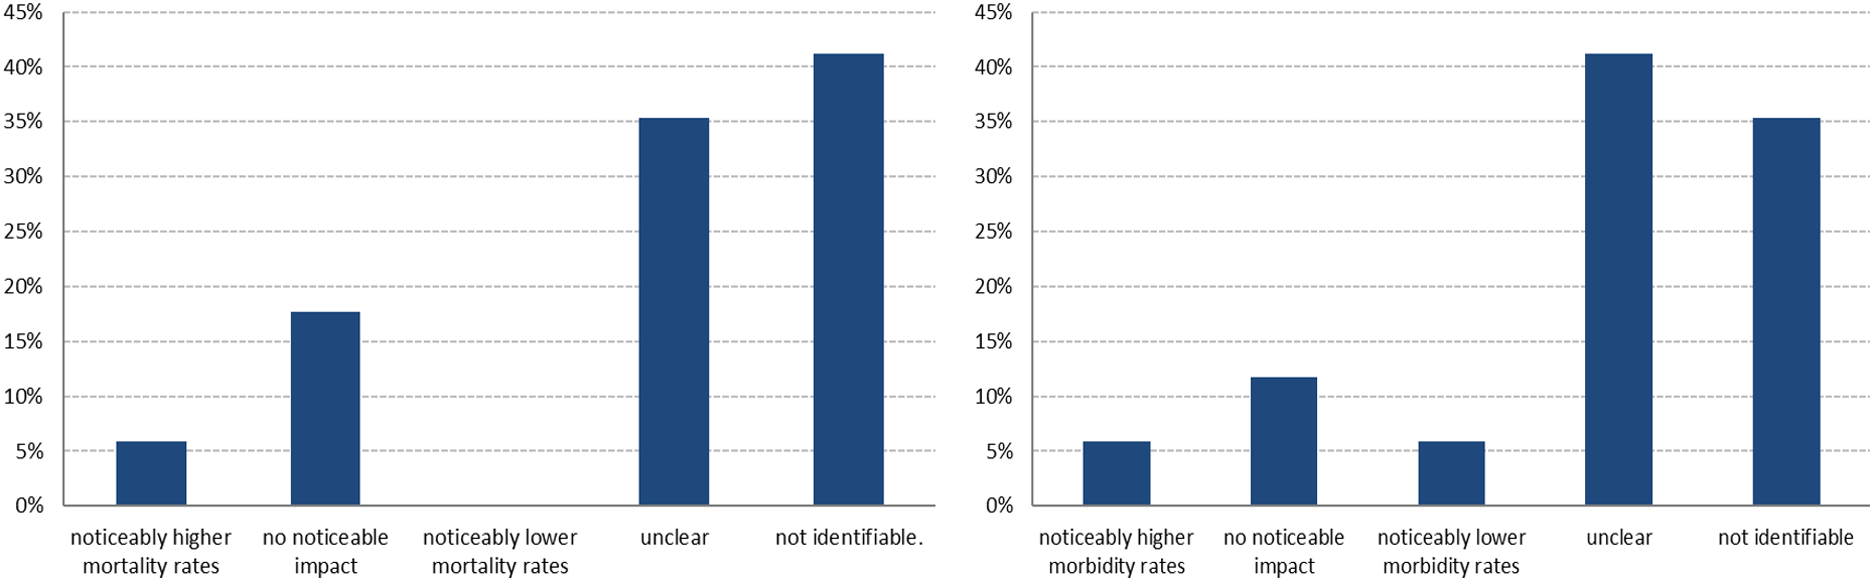
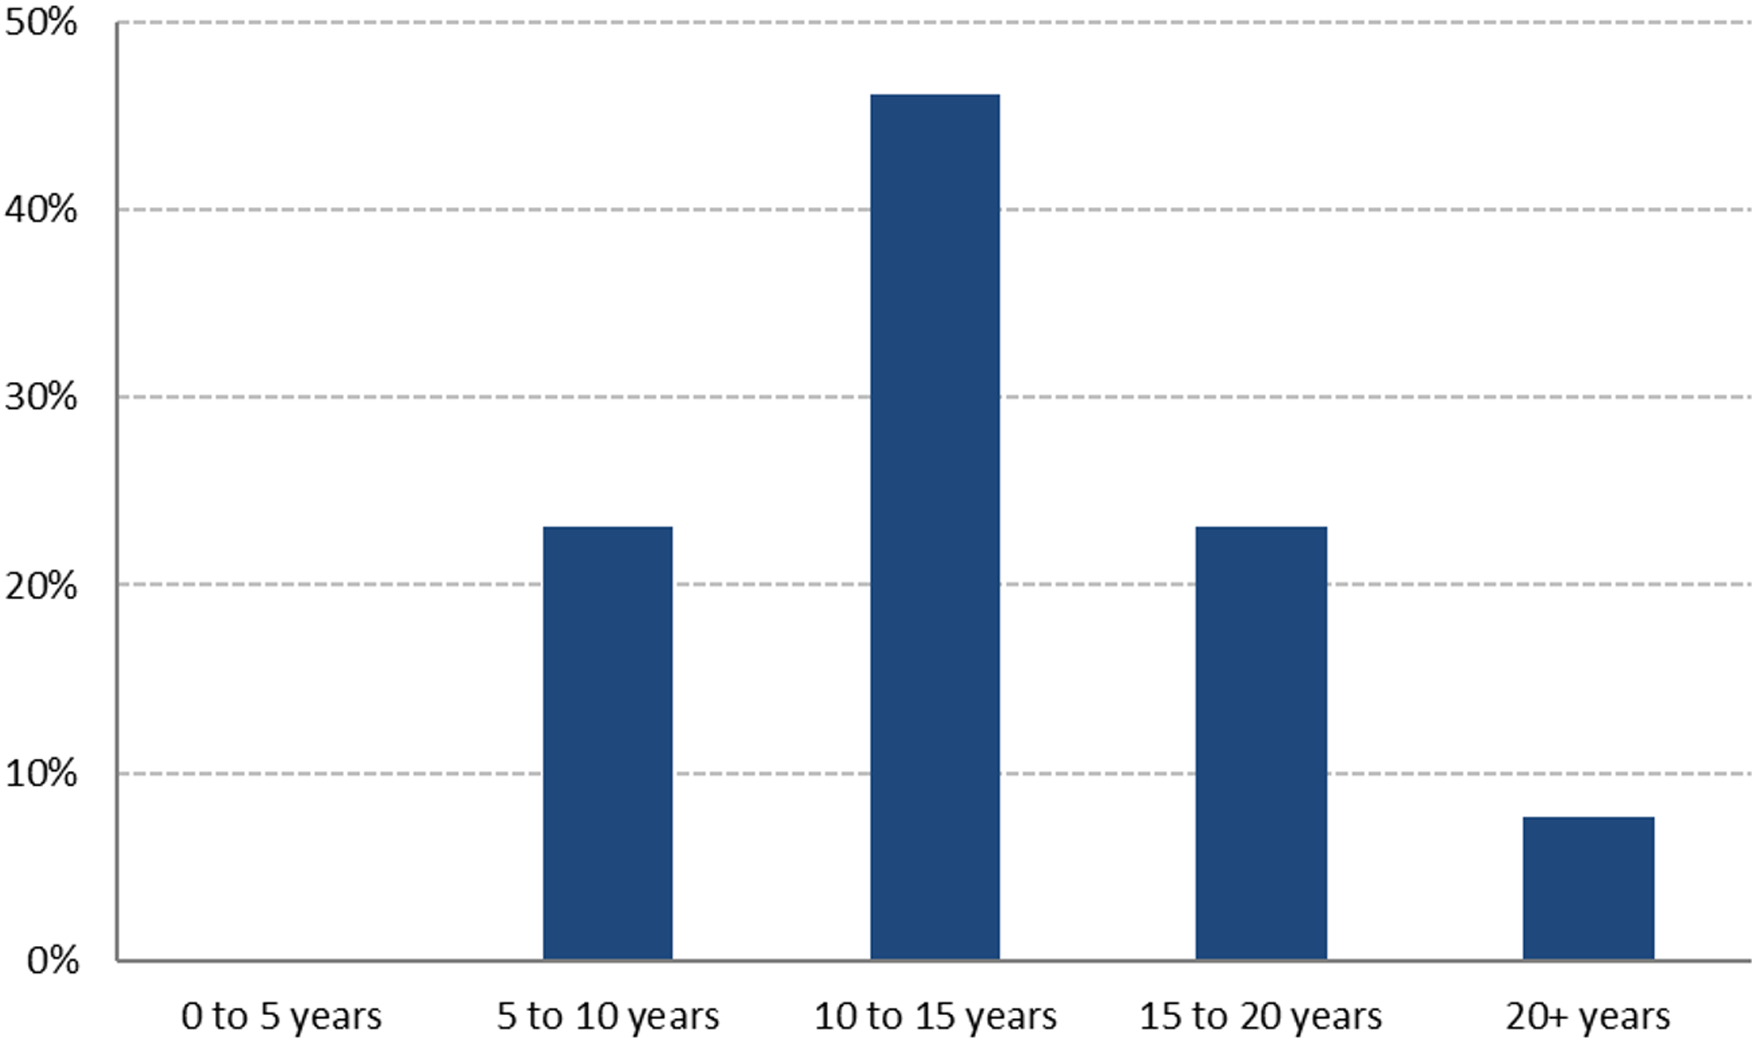
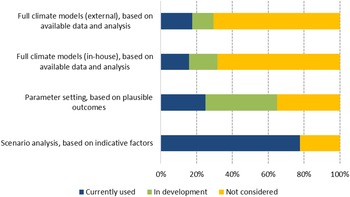
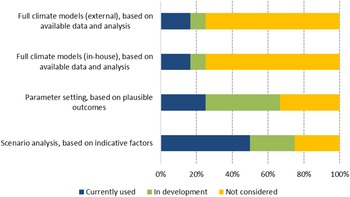
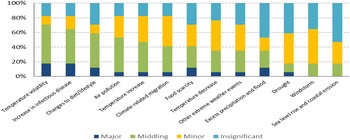
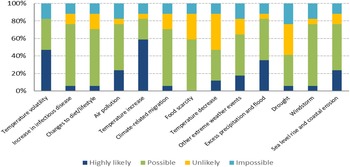

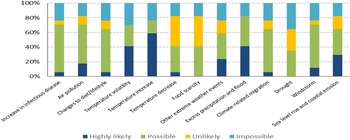


 Open access

