


Introduction
Fluctuations of the Laurentide ice sheet may have driven climate change over various time-scales during the Pleistocene by influencing continental water balances, atmospheric and oceanic circulation, vegetation, and land-surface albedo (e.g. Reference Clark, Alley and PollardClark and others, 1999). Fluctuations of the ice sheet depended on its flow mechanisms, particularly on rapid basal motion that may have been facilitated by a thawed, unlithified substrate (e.g. Reference MacAyealMacAyeal, 1993; Reference ClarkClark, 1994; Reference Marshall and ClarkeMarshall and Clarke, 1997).
Glaciers may move over such a substrate by two processes: decoupling of ice from the sediment bed and by shearing of the bed at depth. Decoupling involves both sliding of ice past clasts that protrude from the bed into the glacier sole and plowing of such clasts through the bed surface (e.g. Reference Brown, Hallet and BoothBrown and others, 1987). Bed shear may occur either as pervasive deformation in a zone that is decimeters to meters thick immediately beneath the glacier sole (e.g. Reference Alley, Blankenship, Bentley and RooneyAlley and others, 1986) or as deformation localized at one or several discrete depths below the glacier sole (e.g. Reference Truffer, Harrison and EchelmeyerTruffer and others, 2000).
Determining the relative importance of these processes would focus efforts to formulate a general constitutive relation for basal motion. The dominant basal flow mechanism also bears on glacial landform development and sediment transport. For example, pervasive deformation of till substrates may have influenced the formation of drumlins (e.g. Reference Smalley and UnwinSmalley and Unwin, 1968; Reference Boulton, Menzies and RoseBoulton, 1987), eskers (Reference Clark and WalderClark and Walder, 1994) and boulder pavements (Reference ClarkClark, 1991). Such deformation also may have been responsible for high sediment fluxes from some Pleistocene ice masses (Reference AlleyAlley, 1991; Reference Jenson, Clark, MacAyeal, Ho and VelaJenson and others, 1995; Reference Hooke and ElverhøiHooke and Elverhøi, 1996; Reference Dowdeswell and SiegertDowdeswell and Siegert, 1999). A first step toward testing these hypotheses is assessing the importance of bed deformation in glacier flow.
Measurements at the bottoms of modern glaciers with unlithified beds have yielded conflicting interpretations of basal flow mechanisms. Borehole records of bed deformation at Storglaciären, Sweden (Reference Iverson, Hanson, Hooke and JanssonIverson and others, 1995; Reference Hooke, Hanson, Iverson, Jansson and FischerHooke and others, 1997), and of sliding at Trapridge Glacier, Canada (Reference Blake, Fischer and ClarkeBlake and others, 1994; Reference Fischer and ClarkeFischer and Clarke, 1997), indicate that when basal water pressure is sufficiently high, motion is focused either at the glacier sole or within the bed only centimeters beneath the glacier sole. Similarly, at the base of a borehole at Whillans Ice Stream, West Antarctica, where basal water pressure is continuously high, motion was focused within centimeters of the ice/bed interface (Reference Engelhardt and KambEngelhardt and Kamb, 1998). However, these data are contradicted by other measurements. Beneath Breiðamerkurjökull, Iceland, most basal motion is distributed across a 0.5–1.0 m thick shear zone in till below the glacier sole (Reference Boulton and HindmarshBoulton and Hindmarsh, 1987; Reference Boulton and DobbieBoulton and Dobbie, 1993). Borehole measurements at Bakaninbreen, Svalbard (Reference Porter, Murray and DowdeswellPorter and others, 1997; Reference Porter and MurrayPorter and Murray, 2001), Columbia Glacier, Alaska (Reference Humphrey, Kamb, Fahnestock and EngelhardtHumphrey and others, 1993), and Ice Stream D, West Antarctica (Reference Kamb, Alley and BindschadlerKamb, 2001), also indicate that significant deformation extends to depth in the bed. Particularly intriguing borehole measurements with tiltmeters at Black Rapids Glacier, Alaska, indicate that, despite the thawed bed there, the bed deforms only at depths greater than 2 m, accounting for most basal motion (Reference Truffer, Harrison and EchelmeyerTruffer and others, 2000).
In this paper, we evaluate possible flow mechanisms of the Des Moines lobe, a part of the Laurentide ice sheet that rested on unlithified sediment and that sometimes apparently flowed rapidly (Reference Clayton and MoranClayton and Moran, 1982). We first extend earlier work (Reference ClarkClark, 1992) to reconstruct the surface morphology of the lobe and estimate basal shear stresses. The possible range of effective normal stress on the bed during the glacier’s maximum is then estimated from consolidation tests on the basal till of the lobe. Over the indicated range of effective normal stress, the shear traction supported by the ice/bed interface is estimated using a model of sliding and plowing (Reference IversonIverson, 1999) and compared with the shear strength of the till bed to assess whether shear at depth in the bed was likely. The model results are then compared with field measurements of clast fabric from basal till, which bear on whether the bed sheared pervasively to high strains (e.g. Reference Alley, Blankenship, Bentley and RooneyAlley and others, 1986).
Regional Setting
The Des Moines lobe (DML) was the largest of several lobes of the Laurentide ice sheet that extended into the mid-continent region of North America during the last glaciation. At its maximum extent, approximately 13 800 radiocarbon years ago, the lobe was up to 250 km wide and covered > 105 km2 in southern Minnesota and north central Iowa (Fig. 1). An arm of the DML, the Grantsburg sub-lobe, flowed to the northeast into western Wisconsin. In Minnesota, the lobe was bounded by glacial deposits of the Coteau des Prairies to the southwest and by the Saint Croix moraine of the Superior lobe to the northeast.
Maximum extent of the DML and the Grantsburg sublobe ∼13 800 radiocarbon years before present.
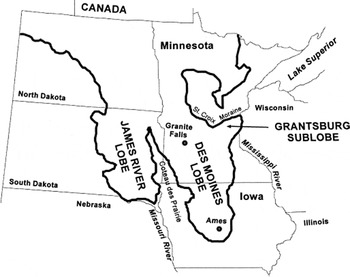
Reconstructions of the surface morphology of the DML at its maximum extent have indicated that it was probably thin and gently sloping (Reference MathewsMathews, 1974; Reference ClarkClark, 1992; Reference BrevikBrevik, 2000) . Driving stresses (downslope component of the glacier’s weight per unit bed area) calculated from the reconstruction of Reference ClarkClark (1992) range from 0.7 to 4.3 kPa, more than 10 times smaller than that considered typical for glaciers (Reference PatersonPaterson, 1994, p. 240). Furthermore, rates of ice-margin advance were on the order of 1700 m a−1, if the best radiocarbon chronology, corrected for variable atmospheric production of C14 (Reference StuiverStuiver and others, 1998), is taken at face value (Reference Clayton and MoranClayton and Moran, 1982; Reference Clayton, Teller and AttigClayton and others, 1985). Based largely on its inferred high speed and low driving stresses, the DML has been compared to the ice streams of the Siple Coast in West Antarctica (e.g. Reference ClarkClark, 1992).
The till of the DML, called the New Ulm till in Minnesota and defined as part of the Dows Formation in Iowa, is 5–20 m thick. In Iowa the till is divided into the Alden Member and the overlying Morgan Member (Reference Hallberg and KemmisHallberg and Kemmis, 1986). The Alden Member is interpreted to be a basal till and consists primarily of a dense, homogeneous diamicton. The diamicton of the Morgan Member, not present everywhere, is texturally heterogeneous and is interpreted to be a supraglacial till deposited in ice-marginal settings (Reference Luttenegger, Kemmis, Hallberg and YongLuttenegger and others, 1983). The DML till generally overlies unlithified sediment > 20 m thick. The maximum extent of the DML is well defined by the Bemis Moraine, a 5–15 km wide band of elevated hummocky topography (Fig. 2). The moraine is approximately the same age as the Pine City moraine of the Grantsburg sub-lobe (Reference Wright, Matsch and CushingWright and others, 1973), which is, hereinafter, considered part of the Bemis Moraine. Other moraines within the margin of the Bemis Moraine represent subsequent marginal positions of the lobe, including the Altamont and Algona moraines (Fig. 2). Other prominent geomorphic features of the lobe include corrugated (washboard) moraine (Reference GwynneGwynne, 1942, Reference Gwynne1951; Reference Stewart, Bryant and SweatStewart and others, 1988; Reference ColganColgan, 1996) and tunnel valleys (Reference PattersonPatterson, 1996).
Geomorphic features and shale isopleths of the DML. Letters indicate locations of samples collected for consolidation tests. Small dots near the glacier margin are locations on the Bemis Moraine where elevations were measured from topographic maps.

Fossil insects (Reference Schwert, Torpen, Bettis, Quade and KemmisSchwert and Torpen, 1996), herbaceous plants (Reference Baker, Bettis, Quade and KemmisBaker, 1996) and trees (Reference Bettis, Quade, Kemmis, Bettis, Quade and KemmisBettis and others, 1996) found near the base of the Dows Formation, and the lack of evidence of permafrost features in the area, indicate that the lobe advanced into a relatively warm (non-arctic) climate. Moreover, tunnel valleys indicate that there was significant meltwater at the bed. These observations, although not conclusive, indicate that the bed was likely thawed.
Reconstruction and Basal Shear Stress
To reconstruct the DML, we follow the method outlined by Reference ClarkClark (1992), who used the elevation of the Bemis Moraine and flowlines inferred from corrugated moraines and shale isopleths to estimate the geometry of the lobe. We consider additional flowline indicators and also examine the sensitivity of the reconstruction to the elevation of the Bemis Moraine, which may have been ice-cored during deposition and hence higher than at present. Terminal-moraine elevations and flow-direction indicators have been used to reconstruct other lobes of the Laurentide ice sheet (Reference ClarkClark, 1992; Reference ColganColgan, 1996, Reference Colgan, Mickelson and Attig1999; Reference Colgan and MickelsonColgan and Mickelson, 1997; Reference Socha, Colgan, Mickelson, Mickelson and AttigSocha and others, 1999) with this method. Contrary to some assertions in the literature, applying this method to reconstruct ice lobes does not involve assumptions regarding either steady-state glacier flow or ice rheology.
Following Reference ClarkClark (1992), we assume points of highest elevation on the Bemis Moraine reflect the elevation of the margin of the lobe at its maximum extent. The elevation of the highest point on the moraine is determined every 2–5 km from 1 : 24 000 topographic maps. Then various flow indicators are used to draw contours of the glacier surface that are perpendicular to the flow direction and that connect points of equal moraine elevation on either side of the lobe. The ice-flow direction is determined in part from corrugated ground moraine, ubiquitous in Iowa (Fig. 2) and assumed to lie perpendicular to flow. The concentration of sand-sized shale fragments in the basal till is also used as a flow-direction indicator in Minnesota (Fig. 2). A reduction in concentration of these particles is interpreted to have resulted from comminution that increased with transport distance from the shale source outcrop (Reference Matsch, Sims and MoreyMatsch, 1972). Isopleths of shale content, therefore, are assumed to have been perpendicular to flow (Reference ClarkClark, 1992). Tunnel valleys (Reference PattersonPatterson, 1996) are assumed to lie parallel to flow and provide an additional constraint not available to Reference ClarkClark (1992).
This method of reconstruction is uncertain for several reasons. One concern is that the origin of corrugated moraines is not well known. However, their tendency to lie perpendicular to tunnel valleys (Fig. 2) indicates that they lie perpendicular to ice flow. The orientations of pebbles, bullet stones and slickensides within the moraines (Reference Stewart, Bryant and SweatStewart and others, 1988) also support this assumption. Another concern is that not all flow indicators may have formed during the lobe’s maximum extent. If so, their internally consistent orientations indicate that flow directions during retreat or minor advances of the lobe must not have deviated greatly from those when the glacier was at its maximum extent.
Another source of error is that high points along the terminal moraine of the lobe may be at a lower elevation than the former ice surface at those points. End-moraine deposition commonly involves the formation of an ice-cored moraine (Fig. 3) (e.g. Reference HookeHooke, 1970; Reference ØstremØstrem, 1971; Reference FitzsimonsFitzsimons, 1997). As the ice of the moraine melts, sediment elevation is reduced proportional to the initial thickness of the moraine and its debris content. Reference ClarkClark (1992) suggested that 30 m was a likely maximum for such subsidence, but did not provide a rationale for this value. Figure 3 shows that larger reductions in sediment elevation during deposition are possible, particularly since moraine elevations kilometers from the distal edge of the moraine are considered to have been equal to the ice-surface elevation (Reference ClarkClark, 1992).
One possible style of moraine formation at the margin of the DML. Elevation of the modern moraine may be significantly less than that of the former ice surface at that location. Maximum relief of the modern moraine provides a minimum value of the thickness of supraglacial sediment, T m .

To estimate the possible decrease in moraine elevation since deposition began, the average minimum thickness, T m, of the DML supraglacial sediment (Morgan Member) was estimated over 3–5 km intervals by measuring the relief on the Bemis Moraine associated with closed and semi-closed depressions (Fig. 3). The past thickness of the moraine, assuming that it was ice-cored, is T m(l − p)/C d, where p is the porosity of the sediment in the current moraine (∼0.3) and C d the mean volumetric debris fraction of the ice-cored moraine. The value of C d may vary widely (Reference Kirkbride and MenziesKirkbride, 1995). A reasonable value, C d = 0.15, yields an ice-cored moraine elevation that ranges, depending upon location, from 25 to 100 m higher than the modern moraine. A lower debris concentration, C d = 0.05, is also plausible and would result in 75–300 m of sediment subsidence during moraine deposition. Thus, we also reconstructed the lobe using C d = 0.15 and C d = 0.05, considering moraine subsidence resulting from the latter value as an upper bound. Further motivation for considering a higher terminal moraine comes from soil studies that indicate original relief of some moraines of the DML has been reduced by 65% due to slope processes (Reference Burras and ScholtesBurras and Scholtes, 1987).
The reconstruction using modern moraine elevations is shown in Figure 4a. The lobe is very thin, and similar in longitudinal profile to that determined by Reference ClarkClark (1992) (Fig. 4b). In contrast, if the Bemis Moraine were ice-cored, the reconstructions yield lobes that are thicker by factors about 2 and 3 for Cd = 0.15 and Cd = 0.05, respectively (Fig. 4b). These results indicate that modern moraine elevations may yield a significant underestimate of glacier thickness and surface slope.
(a) Reconstructed ice-surface morphology and flow-lines for the DML, based on the present elevation of the Bemis Moraine. Flowline A–A′ is the trace of the longitudinal ice-surface profile shown in Figures 4b and 5a. (b) Longitudinal ice-surface profiles for the DML compared with that of Reference ClarkClark (1992). (c) Basal shear stresses calculated every 20 H for the three reconstructions shown in (b).

From the reconstructed profiles, basal shear stress can be calculated. In the absence of side drag from valley walls or from adjacent slow-moving ice, a good assumption for the DML, the driving stress for glacier motion can be equated with the basal shear stress τ b, given by τ b = ρ i gH sin α, where ρ i is the density of ice (916 kg m−3), g is the acceleration due to gravity, H is the glacier thickness and α the surface slope. To minimize possible errors associated with longitudinal stress gradients, values of τ b were calculated over distances of 20 H along the flowline (Reference PatersonPaterson, 1994, p. 264).
If the Bemis Moraine were ice-cored, calculated shear stresses were up to seven times as large (4–15 kPa) as those determined using the modern moraine elevation (Fig. 4c). Nevertheless, given that an approximate average shear stress for glaciers is 50 kPa (Reference PatersonPaterson, 1994, p.242), even the ice-cored moraine cases yield shear stresses that are small. Rapid movement of the DML under such shear stresses likely required that it was not frozen to its bed (e.g. Reference Mickelson and GrafMickelson, 1987).
Basal Water Pressure and Potentiometric Surface
High water pressure in the subglacial hydraulic system may have been responsible for the low basal shear stresses, as it is beneath some modern ice streams (Reference Engelhardt and KambEngelhardt and Kamb, 1997). In this section, lower bounds for the water pressure in this system and the elevation of the potentiometric surface are estimated from results of consolidation tests on intact specimens of the DML basal till and from the reconstructed ice thickness.
In a consolidation test, a confined, water-saturated soil specimen is subjected to incremental increases in axial stress. After each increase in stress, excess pore-water pressure is allowed to dissipate as the specimen contracts. Initial stress increments are small, resulting in mostly elastic deformation of the soil skeleton. At a sufficiently large stress, however, called the preconsolidation stress, the specimen begins to contract permanently. This stress,  , is inferred to have been the maximum effective stress (total normal stress minus pore pressure) on the till during glacier loading, assuming negligible sediment disturbance since deglaciation.
Intact specimens of the DML basal till were collected from 13 locations in Iowa and Minnesota, and consolidation tests yielded a value of  at each location. Care was taken to sample only the basal till of the DML (Alden Member), rather than the supraglacial Morgan Member. The basal till was identified based on its distinct textural homogeneity and by measuring its dry density (Reference Luttenegger, Kemmis, Hallberg and YongLuttenegger and others, 1983). Radiocarbon ages from organic material at the base of this till indicate that is not older than 15 500 years (Reference Bettis, Quade, Kemmis, Bettis, Quade and KemmisBettis and others, 1996), so no earlier glacier advance could have caused its overconsolidation. The Appendix describes the sampling procedure and data reduction. To avoid costly coring, specimens were collected from outcrops, all of which were above the water table when sampled. The specimens had thus dried since loading by the glacier, which can cause consolidation of fine-grained sediments and thereby yield overestimates of preconsolidation stress (Reference Mickelson, Acomb, Edil and SchlüchterMickelson and others, 1979; Reference Tulaczyk, Kamb and EngelhardtTulaczyk and others, 2001). Values of
  reported herein, therefore, are upper bounds for effective normal stresses on the bed during loading by the lobe, so actual effective normal stresses on the bed may have been lower.
Measured values of  range from 125 to 300 kPa (Table 1) and are consistent with unpublished consolidation data from the basal till of the DML (Reference Kanwar, Baker, Horton, Handy, Jones and LutteneggerKanwar and others, 1990, Reference Kanwar, Baker, Horton, Jones, Sumpkins and Luttenegger1992). These values are relatively small, given that over the sampling area our reconstructions indicate total normal stresses on the bed generally greater than 1000 kPa. Apparently, pore-water pressure was sufficiently high in the till to support most of the glacier’s weight. Similarly small values of
  have been measured in consolidation tests on other basal tills (e.g. Reference Solheim, Forsberg, Pittenger, Barron and LarsenSolheim and others, 1991; Reference Sauer, Egeland and ChristiansenSauer and others, 1993; Reference Piotrowski and KrausPiotrowski and Kraus, 1997). Our values of
  are also comparable to the largest effective normal stresses calculated from measured water pressures beneath Whillans Ice Stream (Reference Engelhardt and KambEngelhardt and Kamb, 1997). Note that all measured values of
  at a given location exceed modern total normal stresses that result from sediment overburden (Table 1).
Results of consolidation experiments

To estimate the water pressure at the ice/bed interface, we must account for the difference in water pressure there and that at depth in the bed where the till specimens were collected. If the saturated bulk density of the till is ρ
T (1600–2000 kg m–3), then the minimum pore-water pressure,  , at depth d
T in the basal till is given by
, at depth d
T in the basal till is given by

where the sum of the first two terms on the righthand side is the total normal stress. If it is assumed that there was not significant bed-normal ground-water flow through the till, then the minimum water pressure at the ice/bed interface,  , was less than
  by an amount equal to the change in hydrostatic pressure over d
T. Thus,
by an amount equal to the change in hydrostatic pressure over d
T. Thus,

where ρ
w is the density of water. Note that in the case of downward ground-water flow — a likely possibility — the product ρ
w
gd
T would overestimate the change in pore-water pressure with depth in the till. Thus, even with downward ground-water flow, the water pressure at the ice/bed interface would not have been less than  as given by Equation (2).
From values of  and from ice thicknesses determined from the reconstructions of the lobe, minimum water pressures at the ice/till interface (Table 1) are calculated using Equation (2). The corresponding potentiometric surfaces are plotted in Figure 5 on longitudinal and transverse surface profiles of the DML. Average ratios of
  to ρ
i
gH are 0.91 and 0.95 for reconstructions based on the elevations of modern and ice-cored moraines, respectively, assuming C
d = 0.15 in the latter case, which we consider to be the more plausible of the two ice-cored moraines considered. The DML was therefore nearly floating on its bed. The high basal water pressure probably rules out a drainage system consisting of tunnels cut into ice (Reference RöthlisbergerRöthlisberger, 1972). Channels cut into the bed (Reference Walder and FowlerWalder and Fowler, 1994) fed by a distributed water system in intervening zones (e.g. Reference Engelhardt and KambEngelhardt and Kamb, 1997) would support higher water pressures more like those indicated herein.
to ρ
i
gH are 0.91 and 0.95 for reconstructions based on the elevations of modern and ice-cored moraines, respectively, assuming C
d = 0.15 in the latter case, which we consider to be the more plausible of the two ice-cored moraines considered. The DML was therefore nearly floating on its bed. The high basal water pressure probably rules out a drainage system consisting of tunnels cut into ice (Reference RöthlisbergerRöthlisberger, 1972). Channels cut into the bed (Reference Walder and FowlerWalder and Fowler, 1994) fed by a distributed water system in intervening zones (e.g. Reference Engelhardt and KambEngelhardt and Kamb, 1997) would support higher water pressures more like those indicated herein.
Longitudinal (a) and transverse (b) potentiometric surfaces of the DML. Letters A–J are sampling locations projected onto the longitudinal transect A–A′ (Fig 2 and inset map) whereas letters M, L, J and K are sampling locations projected onto a transverse transect (inset map).

Flow Mechanisms
The low basal shear stresses and effective normal stresses at the bed of the DML indicate that little of its motion was by internal ice deformation. The velocity due to deformation, averaged over the ice thickness, is  , where A is an ice-creep parameter, inversely proportional to the effective ice viscosity, E is an enhancement factor for soft Wisconsin-age ice, and n is the stress exponent in the flow relation for ice (Reference PatersonPaterson, 1994). Using maximum values of τ
b and H (ice-cored Bemis Moraine, C
d = 0.05) to maximize U
i and reasonable values of A (7 × 10⁻¹⁵ kPa−3 s−1), n (3), and E (2.5) (Reference PatersonPaterson, 1994), U
i is <1.0 m a−1. This upper limit is approximately three orders of magnitude less than inferred advance rates of the DML (Reference Clayton and MoranClayton and Moran, 1982) . Expected variability of A and E (Reference PatersonPaterson, 1994) falls well short of accounting for this difference in speed. Thus, motion likely occurred primarily by some combination of sliding, plowing and bed deformation. Next we attempt to determine with theory and field observations whether ice decoupled from the bed by plowing and sliding or whether the bed sheared pervasively.
, where A is an ice-creep parameter, inversely proportional to the effective ice viscosity, E is an enhancement factor for soft Wisconsin-age ice, and n is the stress exponent in the flow relation for ice (Reference PatersonPaterson, 1994). Using maximum values of τ
b and H (ice-cored Bemis Moraine, C
d = 0.05) to maximize U
i and reasonable values of A (7 × 10⁻¹⁵ kPa−3 s−1), n (3), and E (2.5) (Reference PatersonPaterson, 1994), U
i is <1.0 m a−1. This upper limit is approximately three orders of magnitude less than inferred advance rates of the DML (Reference Clayton and MoranClayton and Moran, 1982) . Expected variability of A and E (Reference PatersonPaterson, 1994) falls well short of accounting for this difference in speed. Thus, motion likely occurred primarily by some combination of sliding, plowing and bed deformation. Next we attempt to determine with theory and field observations whether ice decoupled from the bed by plowing and sliding or whether the bed sheared pervasively.
Model calculations
Model description
The model of Reference IversonIverson (1999) is used to estimate the shear strength of the ice–till interface for comparison with the strength of the DML basal till over the relevant range of effective normal stress. If, for example, the interface strength exceeded the bed shear strength, the ice would have been coupled to the bed sufficiently to shear it at a stress equal to the till shear strength. If the converse were true, motion would have occurred at or near the glacier sole by sliding and plowing. An abbreviated description of the model, which is built partly upon aspects of earlier models (Reference Brown, Hallet and BoothBrown and others, 1987; Reference AlleyAlley, 1989), is given herein.
Particles at the bed surface that protrude into the glacier sole provide the roughness that couples ice to the bed (Reference Brown, Hallet and BoothBrown and others, 1987; Reference AlleyAlley, 1989; Reference Tulaczyk, Mickelson and AttigTulaczyk, 1999). The shear stress supported by these particles depends on whether sliding ice exerts a sufficient bed-parallel drag on them to cause them to plow through the bed. If particles plow, the shear stress they support, τ p, depends on the till strength and is given by

where P e is the ambient effective normal stress at the ice–till interface, ϕ and c are the friction angle and cohesion of the till, respectively, N F is a bearing-capacity factor that depends on ϕ, and k is a pressure-shadow factor that accounts for the less-than-ambient ice pressure expected in the lee of particles (Reference IversonIverson, 1999). If particles do not plow, the shear stress on them is controlled by the classical mechanisms of glacier sliding: regelation and enhanced ice deformation. Ice slides primarily by regelation (melting and refreezing) past small particles and primarily by ice deformation past large particles. The transition particle size for which both mechanisms contribute equally depends on the sliding speed but ranges from ∼5 to ∼100 mm (Reference LliboutryLliboutry, 1979; Reference Brown, Hallet and BoothBrown and others, 1987) . A complication is that water-filled cavities may form in the lee of particles. Particles with and without such cavities support shear stresses, τ c and τ s, respectively, which are related to Pe , the sliding speed, U s, and particle radius, R through the expressions (Reference LliboutryLliboutry, 1979):
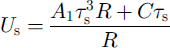

where A 1 is an ice-creep constant, and C is a constant that depends on the thermal properties of the ice and particles. Cavities are expected in the lee of particles near the transition size, which are not accommodated easily by either regelation or enhanced ice deformation. The radii of the largest and smallest particles for which cavities are expected are given by

(Reference IversonIverson, 1999).
Estimating the shear strength of the ice–till interface from values of P e and U s requires that shear stresses supported by individual particles of various sizes at the bed surface be calculated. To do so, for each size class i of particles, we determine either τ s (Equation (4)) or τ c (Equation (5)), depending upon whether particles of that size should have leeward cavities, as given by Equation (6). This value is then compared with the value of τ p (Equation (3)). If τ s (or τ c) > τ p, ice will exert sufficient drag on the particle to cause it to plow, so the shear stress on that size class, τi , will be equal to τ p. If τ s (or τ c) ≤ τ p, the particle will not plow, so τi will be equal to either τ s or τ c, depending upon whether leeward cavities are expected. For each size class i, the value of τi is determined in this way and multiplied by the fractional area of the bed occupied by that size class, Ai f. Summing these products for all size classes yields the shear strength of the ice/till interface that results from sliding and plowing, τ sp, for specified values of P e and U s (Reference Brown, Hallet and BoothBrown and others, 1987; Reference IversonIverson, 1999):

Values of Ai f depend on the size distribution of grains at the bed surface, which is assumed to be equivalent to the grain-size distribution of the till. Aif is given by

where d is the fractal dimension of the grain-size distribution, p is the till porosity, and R u is the upper fractal limit, equal to the radii of the largest particles that contribute to the bed roughness (Reference IversonIverson, 1999).
A thin water layer of non-uniform thickness separates basal ice from the bed (Reference Brown, Hallet and BoothBrown and others, 1987; Reference AlleyAlley, 1989; Reference Tulaczyk, Mickelson and AttigTulaczyk, 1999), regardless of the substrate hydraulic permeability. The mean thickness of this layer, which depends on the extent of cavity development in the lee of particles (Reference IversonIverson, 1999), is an important input to the model because particles with radii smaller than this thickness will not contribute to the interface strength. Thus, these particles are not included in the summation of Equation (7).
A final assumption is that sliding velocity does not depend on effective normal stress. Although there is good evidence that these parameters are correlated for some valley glaciers, data from Whillans Ice Stream indicate that U s does not vary significantly with changes in P e (Reference Engelhardt and KambEngelhardt and Kamb, 1997). As discussed subsequently, model results are very insensitive to variations in U s over the range of values that likely bracket the speed of the DML, so the significance of assuming that U s is independent of P e is not great.
Parameter selection
To estimate the strength of the ice/till interface with this model, the physical properties of the ice and sediment, the grain-size distribution, the sliding speed, the effective normal stress and the water-layer thickness must be specified. Values of these variables used in the calculation are summarized in Table 2. The steady-state friction angle of the DML basal till was determined in a drained ring-shear test (Reference HooyerHooyer, 1999) following the procedure outlined by Reference Iverson, Baker and HooyerIverson and others (1997, Reference Iverson, Hooyer and Baker1998). These tests yielded ϕ = 18.5°, in general agreement with values for some other clay-rich tills (Reference Tika, Vaughan and LemosTika and others, 1996; Reference Iverson, Hooyer and BakerIverson and others, 1998). The bearing-capacity factor that is indicated by this friction angle is 4.6 (Reference IversonIverson, 1999, equation (13)). Cohesion is assumed to be zero during steady deformation (e.g. Reference SkemptonSkempton, 1985).
Model parameters

Parameters for the ice include the regelation parameter, C, and the ice-creep parameter, A l. These are taken to be 2.8 × 10⁻¹⁵ m2 Pa−1 s−1 and 1.2 × 10⁻²⁵ Pa−3 s−1, respectively, and are appropriate values for clean, temperate ice (Reference LliboutryLliboutry, 1979). The pressure-shadow factor, k, is assumed to be 0.1, based on the analysis of Reference Brown, Hallet and BoothBrown and others (1987) for flow dominated by regelation. As discussed subsequently, regelation rather than enhanced creep of ice is the primary mechanism of flow past particles too small to plow through the bed.
Particle-size analysis of the DML basal till yielded a fractal dimension of 2.96 (Reference HooyerHooyer, 1999). We assume that this value can be extrapolated to grain-sizes larger than those measured. The upper fractal limit is taken to be the radius of the largest boulder observed at 25 outcrops. This radius is ∼0.5 m, although several other values are also considered to assess the sensitivity of the results to this variable.
The sliding speed of the DML is unknown, although according to the leading radiocarbon chronology the average rate of marginal advance and retreat was about 2000 m a−1 (Reference Clayton and MoranClayton and Moran, 1982; Reference Clayton, Teller and AttigClayton and others 1985). Correcting this chronology for variable atmospheric production of C14 (Reference StuiverStuiver and others, 1998) results in a reduced rate of advance and retreat of 1700 m a−1. We choose a more conservative value, 440 m a−1, equal to that of Whillans Ice Stream (Reference Engelhardt and KambEngelhardt and Kamb, 1997), but also consider other values.
A range of values of effective normal stress is considered based on the results of consolidation tests (Table 1). These tests yielded maximum values of effective normal stress, and hence pore-water pressures in the till could have been higher than those indicated by these tests. Therefore, effective stresses of 0–300 kPa are considered.
The thickness of the water layer at the ice–till contact has been inferred for various modern and past glaciers (Reference AlleyAlley, 1989; Reference Engelhardt and KambEngelhardt and Kamb, 1997; Reference Hooke, Hanson, Iverson, Jansson and FischerHooke and others, 1997; Reference IversonIverson, 1999; Reference Piotrowski and TulaczykPiotrowski and Tulaczyk, 1999) but is not well known and probably highly variable. We consider various values between 0.001 and 10.0 mm.
Model results and discussion
In Figure 6a the calculated shear strength of the ice/bed interface is plotted as a function of effective normal stress for several water-layer thicknesses. The shear strength of the interface is smaller for thicker water layers, owing to greater ice/bed separation. For example, an increase in water-layer thickness from 0.1 mm to 10.0 mm reduces the interface strength by about 50%. These results, when compared to the shear strength of the till determined in ring-shear tests (bed ultimate strength; Fig. 6a), indicate that the water-layer thickness would have needed to be < ∼0.1 mm for τ sp to exceed the till shear strength. In that case, the bed would have sheared at a stress equal to the bed shear strength. Based on borehole studies, a water-layer thickness of ∼0.1 mm has been suggested for Whillans Ice Stream (Reference Engelhardt and KambEngelhardt and Kamb, 1997). However, Reference Alley, Blankenship, Bentley and RooneyAlley and others (1987) suggested a minimum water-layer thickness an order of magnitude larger than this. Furthermore, modeling results fit to data collected from Storglaciären indicate a water-layer thickness of one to several centimeters (Reference IversonIverson, 1999). A similarly thick water layer of 5–35 mm has been suggested based on the thickness of sand stringers in a Pleistocene basal till in northwest Germany (Reference Piotrowski and TulaczykPiotrowski and Tulaczyk, 1999). Thus, it is not clear from these calculations that the bed sheared at depth. Instead, the weight of evidence seems to point, albeit with significant uncertainty, toward water layers thicker than 0.1 mm and hence to decoupling of ice from the bed.
(a) Calculated values of τ sp as a function of effective normal stress for various water-layer thicknesses. The steady-state shear strength (ultimate strength) of the DML basal till is also shown. (b) Fractional area of the bed occupied by plowing particles and by stationary particles accommodated by regelation for a water-layer thickness of 0.1 mm. (c) Calculated values of τ sp as a function of effective normal stress. The value of τ sp has been divided into its two components: that supported by plowing particles and that supported by stationary particles accommodated by regelation.

Plowing of particles through the bed, rather than regelation or ice creep, limits the shear strength of the ice/bed interface (Fig. 6b). At effective normal stresses less than 200 kPa, all particles in contact with ice plow. These particles cover about 19% of the bed in the case of a water layer 0.1 mm thick; smaller particles are submerged in the water layer. At effective normal stresses greater than 200 kPa, the smallest particles that plow at lower effective normal stresses do not plow because the till is stronger. The shear stress supported by these particles is determined by regelation. Enhanced ice deformation does not limit the shear stress on particles of any size because those particles large enough to be accommodated by ice deformation plow through the bed for the range of effective normal stress considered. The contributions of plowing and regelation to the interface strength are shown in Figure 6c.
Increases in sliding speed have little effect on these results. If sliding speed is increased a factor of ∼4 to 2000 m a−1, the change in interface strength is negligible (Fig. 7), since plowing is the dominant flow mechanism at both the lower and higher sliding speeds, and shear stresses supported by plowing particles are independent of sliding speed. In contrast, at a much lower sliding speed of 50 m a−1, the interface strength is reduced (Fig. 7). In this case, fewer particles plow; those that do not plow are accommodated easily by regelation and thus support shear stresses commensurate with the smaller sliding speed.
Calculated values of τ sp as a function of effective normal stress for various values of sliding speed, assuming a water-layer thickness of 0.1 mm.

Upper fractal limits (radii of the largest boulders considered) both smaller and larger than 0.5 m are considered in Figure 8. If very large boulders are included as part of the grain-size distribution, they strengthen the interface appreciably. However, because such boulders are so uncommon, the length scale over which the calculation applies is much greater than the till thickness if such boulders are considered. For example, Equation (8) indicates that if R u = 2.5 m, boulders with radii 2.0–2.5 m will occur in a strip of unit width less than once every 1700 m. In contrast, if R u = 0.5 m, boulders with radii 0.1–0.5 m will occur about every 5 m. Thus, considering boulders that are much larger than 0.5 m does not provide a physically meaningful estimate of the local strength of the ice–till interface.
Calculated values of τ sp as a function of effective normal stress for various values of the upper fractal limit of the grain-size distribution, assuming a water-layer thickness of 0.1 mm.

Although our calculations are sensitive to a poorly known parameter — the thickness of the water layer that divided ice from the till bed — they indicate that plowing may have occurred easily enough at the bed surface to prevent the bed from pervasively shearing at depth. This hypothesis is now tested by comparing the alignment of elongate clasts in the DML basal till with that developed by shearing of till in the laboratory.
Clast fabric of the DML basal till
We have used a ring-shear device that deforms a large till specimen to study the alignment of isolated, elongate particles (6–16 mm long axes) as a function of shear strain (Reference Hooyer and IversonHooyer and Iverson, 2000). Our results indicate that particles rotate into the shear plane and generally remain there to high shear strains (up to 475), resulting in a strong shear-parallel fabric, regardless of the sizes, shapes and initial orientations of particles. Elongate particles generally remain in the shear plane, rather than orbit through it (e.g. Reference JefferyJeffery, 1922), due to slip between particles and till matrix. S 1 eigenvalues (Reference MarkMark, 1973), indicative of fabric strength (S 1 = 1.0, perfect alignment; S 1 = 0.33, random alignment), were high (0.78–0.87), and particles attained a steady alignment at shear strains of ∼2.0. If subglacial shear strain is pervasive and approximates simple shear, this result should be applicable to field settings, since evidence for subglacial slip between clasts and till matrix is ample (e.g. Reference Benn and EvansBenn and Evans, 1996). Thus, basal tills with weak fabrics have probably not been sheared to the high strains (≫2.0) required to account for significant glacier motion, although fabric disruption by another process or slip along widely spaced, discrete surfaces in the bed cannot be ruled out. In contrast, basal tills with a strong fabric parallel to the shearing direction may have been sheared pervasively to high strains.
Reference Bennett, Waller, Glasser, Hambrey and HuddartBennet and others (1999) have rightly questioned the use of clast fabric in discriminating between glacial-sediment facies. The goal here, however, is not to discriminate between facies but to address whether the bed has been sheared sufficiently to induce a strong fabric (shear strain > 2). The fabric data compiled from field studies by Reference Bennett, Waller, Glasser, Hambrey and HuddartBennet and others (1999) do not allow an evaluation of the correlation between fabric strength and shear-strain magnitude because strain magnitude is seldom known with certainty in field studies.
Clast fabrics from the DML basal till were measured at a number of locations across Minnesota and Iowa (Fig. 9a). As with sampling for preconsolidation tests, basal till was identified based on its textural homogeneity and density. Measured dry densities at the sites of the fabric measurements fell within the range for basal tills in Iowa determined by Reference Luttenegger, Kemmis, Hallberg and YongLuttenegger and others (1983). Fabric measurements in till that did not meet this density criterion were excluded from consideration. In all cases, the till units where fabric was measured were massive, displaying neither clear signs of bed deformation nor preservation of primary structures that might preclude significant deformation (Reference Clayton, Mickelson and AttigClayton and others, 1989; Reference Piotrowski, Mickelson, Tulaczyk, Krzyszkowski and JungePiotrowski and others, 2001) . Fabric was measured by exposing a vertical cut along an outcrop surface and measuring the trend and plunge of 25–100 gravel-sized clasts over outcrop areas of 1–5 m2. Measurements over smaller areas were not possible owing to the low density of clasts sufficiently large and elongate to measure accurately. Thus, zones of local deformation, such as those that would result from plowing at the glacier sole, could not be resolved with this technique. Most fabrics were measured in unoxidized till below any visible soil horizons. Only prolate clasts that had aspect ratios > 1.5 were measured. Fabric was evaluated using the method of Reference MarkMark (1973) to calculate eigenvectors and corresponding eigenvalues. The eigenvalues S 1, S 2 and S 3 represent the degree of clustering around each of the axes of the eigenvectors, V 1, V 2 and V 3, respectively.
(a) Clast fabric stereograms for the DML basal till at various locations. (b) S 1 vs S 3 eigenvalues for the DML basal till, for till deformed in ring-shear tests (Reference Hooyer and IversonHooyer and Iverson, 2000), and for till of selected drumlins (Reference Evenson and Gold-thwaitEvenson, 1971; Reference Krüger and ThomsenKrüger and Thomsen, 1984; Reference Stanford and MickelsonStanford and Mickelson, 1985).

Measured fabrics are weak, with a mean S 1 value of 0.54 (Table 3). Plotting S 3 against S l for each site indicates that these fabrics are considerably weaker than those produced by till deformation in the laboratory (mean S 1 = 0.82) and not as strong as those of selected drumlins where a mobile till bed seems likely (Fig. 9b). Interpretation of these data, however, is complicated by unpublished measurements of basal-till fabric from three sites within end moraines in Iowa made by Reference KemmisKemmis (1991; personal communication from T. J. Kemmis, 2002). At these sites, S 1 = 0.68–0.91, indicating generally stronger fabrics than those measured in this study. Kemmis did not attribute the strong fabric to bed deformation at two of his sites due to stratigraphic evidence (sharp contacts and preserved sand lenses) and geomorphic relations (convex upper contact that mimicked the hummocky surface topography, suggestive of basal melt-out from stagnant ice) (Reference Kemmis, Hallberg and LutteneggerKemmis and others, 1981; Reference KemmisKemmis, 1991). At one site (55 Algona-2; Reference KemmisKemmis, 1991), however, where the mean S 1 value was 0.82, no evidence seemed to preclude deformation of the bed. Thus, although fabric data from the majority of locations studied indicate that, if the bed of the DML was sheared pervasively, shear strain was likely less than ∼2.0, fabrics at some locations are sufficiently strong to be consistent with significant pervasive shear of the bed.
Fabric results for the DML till

Conclusions
Although our reconstructions corroborate previous conclusions (Reference MathewsMathews, 1974; Reference ClarkClark, 1992; Reference BrevikBrevik, 2000) that the DML was thin, reconstructions assuming that its terminal moraine was ice-cored result in up to a three-fold increase in glacier thickness. Calculated basal shear stresses are as much as 3.5 times larger than the largest value thought to be reasonable by Reference ClarkClark (1992) (4.3 kPa). If moraines of other lobes of the Laurentide ice sheet were ice-cored, then those ice lobes were also thicker than reconstructions indicate.
Calculated basal shear stresses, together with the radiocarbon chronology that provides evidence of rapid glacier motion, indicate that the lobe was likely not frozen to its bed and that movement was focused at the base of the lobe with little internal ice deformation. The well-lubricated base of the DML is attributed to high subglacial water pressure. Reconstructions and consolidation tests on basal till of the lobe indicate that water pressures at the bed surface were, depending upon location, at least 78–98% of the ice-over-burden pressure. Water pressures may have been higher, because consolidation tests yield maximum values of effective normal stress, till pore water likely flowed downward during glacier loading, and drying of till may have caused consolidation in excess of that due to glacier loading. High basal water pressures are consistent with the hydrological model of Reference Walder and FowlerWalder and Fowler (1994), which predicts flow in shallow, wide channels cut into the bed, not unlike the tunnel channels of the DML. These channels may have been fed by water in a layer like that which may feed Walder–Fowler channels beneath Whillans Ice Stream (Reference Engelhardt and KambEngelhardt and Kamb, 1997). High water pressures are also consistent with the undrained bed considered by Reference Tulaczyk, Kamb and EngelhardtTulaczyk and others (2000) for Whillans Ice Stream and with preconsolidation stresses determined for the basal sediment there (Reference Tulaczyk, Kamb and EngelhardtTulaczyk and others, 2001).
Calculations of the strength of the coupling between the ice and the bed indicate that, except for the case of an exceptionally thin water layer separating ice from the bed (<0.1 mm), ice motion was likely focused at the glacier sole. The dominant mechanism of motion was probably plowing, with the smallest particles in contact with ice stationary relative to adjacent till and accommodated by regelation.
Till-fabric data agree generally, but not completely, with the model prediction that motion of the DML was focused near the ice/bed interface. The weak alignment of clasts measured in this study indicates that in many locations the bed was not sheared to strains greater than ∼2, unless another process disrupted the clast fabric or deformation was sufficiently localized along slip surfaces so that most clasts did not rotate during shear. However, strong fabrics have sometimes been reported by others for the basal till of the DML (e.g. Reference KemmisKemmis, 1991), leaving open the possibility of pervasive bed deformation in some areas. A more comprehensive study would consider other geomorphic and sedimentological factors indicative of the mode of basal motion. However, for former glacier beds that consist of massive till units, we know of no characteristic other than till fabric that allows small pervasive shear strains to be distinguished from the very large strains required of the bed-deformation model of glacier motion (Reference Hooyer and IversonHooyer and Iverson, 2000).
The results of this study indicate that the DML was likely decoupled from its bed over much of its area, although this conclusion is not definitive due to uncertainties regarding application of the plowing model and interpretation of till-fabric data. The lack of a more definitive result is not surprising, since beneath even modern glaciers, where direct measurements are possible, the dominant mode of basal motion is difficult to determine and commonly ambiguous (e.g. Reference Kamb, Alley and BindschadlerKamb, 2001) . If the DML did decouple from its bed over much of its area, then transport of sediment occurred primarily in basal ice rather than in a shearing till layer beneath the ice. Based on modeling, ice-lobe reconstructions and field evidence, similar conclusions have been reached for the Puget lobe of the Cordilleran ice sheet (Reference Brown, Hallet and BoothBrown and others, 1987) and a portion of the Fennoscandian ice sheet in northwest Germany (Reference Piotrowski and KrausPiotrowski and Kraus, 1997; Reference Piotrowski and TulaczykPiotrowski and Tulaczyk, 1999). In contrast, basal motion is assumed to have occurred by bed deformation in many models of Pleistocene ice masses (Reference BoultonBoulton, 1996; Reference Clark, Licciardi, MacAyeal and JensonClark and others, 1996; Reference Jenson, MacAyeal, Clark, Ho and VelaJenson and others, 1996; Reference Licciardi, Clark, Jenson and MacAyealLicciardi and others, 1998; Reference Dowdeswell and SiegertDowdeswell and Siegert, 1999). Other studies have called upon bed deformation to account for large basal sediment fluxes (Reference AlleyAlley, 1991; Reference Jenson, Clark, MacAyeal, Ho and VelaJenson and others, 1995; Reference Hooke and ElverhøiHooke and Elverhøi, 1996; Reference Shipp, Anderson and DomackShipp and others, 1999). Our analyses and data indicate that beneath the DML widespread deformation of the bed was unlikely.
Acknowledgements
We thank B. Hubbard and S. Tulaczyk for insightful, critical reviews of the manuscript. N. F. Glasser did an excellent job handling the paper as Scientific Editor. We also thank T.J. Kemmis for sharing unpublished till-fabric data with us. This work was supported, in part, by U.S. National Science Foundation grant OPP-9725360.
Appendix Preconsolidation Testing
Sampling and testing procedure
Intact samples of the DML basal till were collected by exposing a 0.04 m2 platform in unweathered basal till at the base of an outcrop. A standard thin-walled brass cylinder, 16 mm high by 75 mm in diameter, was pushed downward into the till until it was flush with the platform. The till around and below the cylinder was then removed, leaving an intact specimen. A wire saw was used to trim the top and bottom of the specimen. Specimens were transported to the laboratory, inserted in a fixed-ring consolidometer, saturated with water, and loaded incrementally following a standard procedure (Reference DasDas, 1994, p. 250). Axial stress increments were applied no less than every 24 hours, thereby allowing sufficient time for excess pore-water pressure to dissipate.
Data reduction
The preconsolidation stress,  , was determined for each specimen by plotting void ratio as a function of the log of the axial stress (Fig. 10). An abrupt change in the slope of this plot indicates the transition from dominantly elastic to permanent deformation and hence the value of
  . Unfortunately, this change in slope is almost never abrupt but occurs gradually over a range of axial stress (Reference Lambe and WhitmanLambe and Whitman, 1969, p. 297).
Typical consolidation curve for the DML basal till. Labeled line segments refer to the graphical method of Reference CasagrandeCasagrande (1936) for determining preconsolidation stress, as explained in the Appendix.

To determine  from such plots, the empirical method of Reference CasagrandeCasagrande (1936) was used. A point was first established visually at the minimum radius of curvature (see “a” in Fig. 10). Two lines were drawn through this point: one tangent to the curve (bc) and the other horizontal (ae). The acute angle formed by these two lines was then bisected (ad). A straight line (fg) was extended from the lower portion of the consolidation curve until it intersected this bisector (ad). The abscissa at this point of intersection is
  . Casagrande found that this method reproduced preconsolidation stresses on soil specimens with known loading histories.



