


INTRODUCTION
Population genetics defines evolution by changes in allele frequencies [Reference Hartl and Clark1, Reference Ewens2]. Evolutionary game dynamics track such shifts under natural selection using Taylor & Jonker's [Reference Taylor and Jonker3] famous replicator model. The system of nonlinear first-order differential equations, and variations thereof, are purported a necessary and sufficient definition of evolution across disciplines, from biology to economics, albeit to sometimes scathing criticism (e.g. [Reference Roca, Suesta and Sanchez4]).
By contrast, Wallace [Reference Wallace5–Reference Wallace8] has proposed a set of necessary-conditions statistical models extending evolutionary theory via the asymptotic limit theorems of communication theory. The approach is based upon representing genetic heritage, gene expression, and the environment as interacting information sources. The essential insight the models offer is recognizing gene expression as a cognitive phenomenon associated with a ‘dual’ information source, while the embedding environment's systematic regularities ‘remember’ imposed changes, resulting in a co-evolutionary process in the sense of Champagnat et al. [Reference Champagnat, Ferriere and Meleard9] recorded in both genes and environment (see [Reference Wallace5–Reference Wallace7, Reference Wallace10, Reference Wallace and Wallace11] for details).
Here we expand the approach to include the effect of ‘large deviations’ representing transitions between the quasi-stable modes that are analogous to game-theoretic evolutionary stable strategies. The focus will be on incorporating path dependence limiting such possible excursions to high probability paths consistent with, if not originating in, previous evolutionary trajectories; however most multi-cellular organisms evolve, they retain their basic Bauplan, variations thereof notwithstanding.
While incorporation of such path dependence markedly reduces possible dynamics in higher organisms, viral or viroid evolution can be explored in a far less constrained manner using a statistical mechanics formalism driven by ‘noise’ defined as much by policy and socioeconomic structure as by reassortment and generation time. Changes in policy and economy can, in effect, desterilize a natural or human ecosystem in which pathogen populations had previously been held to low equilibrium values.
The argument is, in a sense, a co-evolutionary inverse of species-fragmented area relation studies like those of Hanski et al. [Reference Hanski12]. That is, while spatial fragmentation of natural ecosystems can drive wanted species to extinction, proper mosaic design of agricultural systems – fragmentation in time, space, and community structure – can limit the rate of new pathogen evolution and constrain their populations to low endemic levels. In contrast, the inference is that large-scale intensive husbandry, expanding growth and transport of monoculture livestock, is epizootically unsustainable. Increasingly accessed and agroecologically pauperized landscapes should select for pathogens of increasing transmissibility and virulence [Reference Messinger and Ostling13].
THE BASIC MODEL
Following [Reference Wallace5, Reference Wallace6], we assume there are n populations interacting with an embedding environment represented by an information source Z. The genetic and (cognitive) gene expression processes associated with each species i are represented as information sources X i , Yi , respectively. These information sources undergo a ‘co-evolutionary’ interaction in the sense of [Reference Champagnat, Ferriere and Meleard9], producing a joint information source uncertainty [Reference Cover and Thomas14] for the full system as
 $$H(X_1, Y_1, \ldots, X_n, Y_n, Z),$$
In addition, Feynman's [Reference Feynman15] insight that information is a form of free energy allows definition of an entropy analogue as
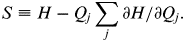 $$S \equiv H - Q_j \mathop \sum \limits_j \partial H/\partial Q_j. $$
The Q i are taken as driving parameters that may include, but are not limited to, the Shannon uncertainties of the underlying information sources. (See Cover & Thomas [Reference Cover and Thomas14] for a basic introduction to information theory.)
Again, in the spirit of [Reference Champagnat, Ferriere and Meleard9], we can characterize the dynamics of the system in terms of Onsager-like non-equilibrium thermodynamics in the gradients of S as the set of stochastic differential equations,
 $$\eqalign{{\rm d}Q_t^i =\,& L_i (\partial S/\partial Q^1,..., \partial S/\partial Q^m, t){\rm d}t \cr & + \mathop \sum \limits_k \sigma _k^i (\partial S/\partial Q^1,..., \partial S/\partial Q^m, t){\rm d}B_k,} $$
where B k represents noise terms having particular forms of quadratic variation. (See [Reference Protter16] or other standard references on stochastic differential equations for details.)
This can be more simply written as
 $${\rm d}Q_t^i = L_i ({\bi Q},t){\rm d}t + \mathop \sum \limits_k \sigma _k^i ({\bi Q},t){\rm d}B_k \,,$$
where Q ≡(Q 1, …, Qm ).
Following the arguments of [Reference Champagnat, Ferriere and Meleard9], this is very much a co-evolutionary structure, where, if it is sufficiently large, fundamental dynamics are determined by inevitable component feedbacks and other interactions:
-
(1) Setting the expectation of equation (4) equal to zero and solving for stationary points gives attractor states since the noise terms preclude unstable equilibria. These are analogous to the evolutionarily stable states of evolutionary game theory.
-
(2) This system may, however, converge to limit cycle or pseudo-random ‘strange attractor’ behaviours similar to thrashing in which the system seems to chase its tail endlessly within a limited venue – the ‘Red Queen’.
-
(3) What is ‘converged’ to in any case is not a simple state or limit cycle of states. Rather it is an equivalence class, or set of them, of highly dynamic information sources coupled by mutual interaction through cross-talk and other interactions. Thus ‘stability’ in this structure represents particular patterns of ongoing dynamics rather than some identifiable static configuration. These are non-equilibrium quasi-steady states.
-
(4) Applying Ito's chain rule for stochastic differential equations to (Q t j )2 and taking expectations allows calculation of variances. These may depend very powerfully on a system's defining structural constants, leading to significant instabilities [Reference Khasminskii17], something we will explore more fully below.
LARGE DEVIATIONS
As Champagnat et al. [Reference Champagnat, Ferriere and Meleard9] note, shifts between the non-equilibrium quasi-steady states of such a co-evolutionary system can be addressed by large deviations formalism. The dynamics of drift away from trajectories predicted by the canonical equation can be investigated by considering the asymptotic of the probability of ‘rare events’ for the sample paths of the diffusion.
‘Rare events’ are the diffusion paths drifting far away from the direct solutions of the canonical equation. The probability of such rare events is governed by a large deviation principle, driven by a ‘rate function’ I that can be expressed in terms of the parameters of the diffusion.
This result can be used to study long-time behaviour of the diffusion process when there are multiple attractive singularities. Under proper conditions, the most likely path followed by the diffusion when exiting a basin of attraction is the one minimizing the rate function I over all the appropriate trajectories.
An essential fact of large deviation theory, however, is that the rate function I almost always has the canonical form
 $$I = - \mathop \sum \limits_j P_j \log {\rm \;} (P_j ),$
for some probability distribution, i.e. the uncertainty of an information source [Reference Cover and Thomas14]. This result goes under a number of names: Sanov's theorem, Cramer's theorem, the Gartner–Ellis theorem, the Shannon–McMillan theorem, etc. [Reference Dembo and Zeitouni18].
These arguments are in the direction of equation (4), now seen as subject to large deviations that can themselves be described as the output of an information source L D defining I, driving or defining Qj parameters that can trigger punctuated shifts between quasi-stable system modes.
Something much like this has become common currency in systems biology (e.g. [Reference Kitano19]).
Not all large deviations are possible, only those consistent with the high probability paths defined by the information source L D .
Recall from the Shannon–McMillan theorem [Reference Cover and Thomas14, Reference Khinchin20] that all possible utterances of an information source can be divided into two sets, one very large that represents nonsense statements of vanishingly small probability, and one very small of high probability representing those statements consistent with the inherent ‘grammar’ and ‘syntax’ of the information source. Again, whatever higher-order multi-cellular evolution takes place, some equivalent of backbone and blood remains.
Thus we could now rewrite equation (1) as
 $$H_L (X_1, Y_1, \ldots, X_n, Y_n, Z,L_D ),$$
where we have explicitly incorporated the ‘large deviations’ information source L D that defines high-probability evolutionary excursions for this system.
For human ecosystems Z, of course, will include fundamental matters of historically driven socioeconomic structure, itself subject to limitations on large deviations excursions. Any such must be consistent with path-dependent patterns of earlier cultural expression.
Again carrying out the argument leading to equation (4), we arrive at another set of quasi-stable modes, but possibly very much changed in number; either branched outward in time by a wave of speciation, or decreased through a wave of extinction.
This is a central result, and, for virus/human systems, must be seen as including interaction between socioeconomic and viral evolution. Note that iterating such models backwards in time constitutes a cladistic or coalescent analysis.
Again, social, economic, and cultural structures must be included in examinations of co-evolutionary variation and selection, according to this model.
EXTINCTION
A simple extinction model leads to significant extension of the theory.
Let N t ⩾0 represent the number of individuals of a particular species at time t. The simplest dynamic model, in this formulation, is then something like
 $${\rm d}N_t = - \alpha N_t |N_t - N_C |{\rm d}t + \sigma N_t {\rm d}W_t, $$
where N C is the ecological carrying capacity for the species, α is a characteristic time constant, σ is a ‘noise’ index, and dW t represents white noise.
Taking the expectation of equation (7), the possible equilibrium values of N t are either zero or N C . Applying the Ito chain rule [Reference Protter16] to the second moment in N t , i.e. to N t 2, a somewhat lengthy calculation finds there can be no real second moment unless
 $$\sigma ^2 \lt 2\alpha N_C. $$
That is, unless equation (8) holds – the product of the rate of population change and carrying capacity is sufficiently large – noise-driven fluctuations will inevitably drive the species to extinction.
Assuming a very low, but non-zero equilibrium possible – say N c <<N C – then calculation shows N C in equation (8) is replaced by the difference ΔN≡N C − Nc .
A similar stochastic differential equation approach has been used to model noise-driven criticality in physical systems [Reference Horsthemeke and Lefever21–Reference Van den Broeck23], suggesting that a more conventional phase transition methodology may provide particular insight.
The core relationships suggest an epidemiological application.
SOCIO-VIRAL EVOLUTION
In general, the number of non-equilibrium quasi-steady states available to the system defined by equation (4), or to its generalization via equation (6), will be relatively small at any given time – how many kinds of hominid can a planet support? The same cannot be said, however, for virus/viroid species or quasi-species, to which we can apply more general methods. The speciation/extinction large-deviations information source L D is far less constrained.
The noise parameter in equation (7) can be interpreted as a kind of temperature analogue, and N t as an order parameter that, like magnetization or ice crystal form, vanishes (or falls to N c <<N C ) above a critical value of σ. For something as protean as influenza or HIV, this leads to a relatively simple statistical mechanics analogue built on the H L of equation (6).
We define a pseudo-probability for quasi-stable mode j as
 $$P_j = \displaystyle{{{\rm exp}\; [ - H_L^j /\kappa \sigma ]} \over {\mathop \sum \nolimits_i {\rm exp}\; [ - H_L^i /\kappa \sigma ]}},$$
where κ is a scaling constant and σ is a noise intensity.
Next, we define a Morse function F, in the sense used by Pettini [Reference Pettini24], as
 $$\exp {\rm \;} [ - F/\kappa \sigma ] \equiv \mathop \sum \limits_i \exp {\rm \;} [ - H_L^i /\kappa \sigma ]\,.$$
We apply Pettini's topological hypothesis to F, taking N j , the number of members of species (or quasi-species) j as a kind of ‘order parameter’, in Landau's sense [Reference Landau and Lifshitz25]. Then σ is seen as a very general temperature-like measure whose changes drive punctuated topological alterations in the underlying ecological structures associated with the Morse function F. In particular, according to the generalization of equation (8), lowering σ below a critical threshold can drive the system from N c to N C >>Nc .
However, topological changes, following Pettini's arguments, can be far more general than indexed by the simple Landau-type critical-point phase transition in an order parameter. They can represent a great variety of fundamental and highly punctuated ecosystem alterations in microbial or viral populations and their dynamics, since the underlying species and quasi-species are not so sharply constrained by evolutionary trajectory in the manner limiting variation in most higher organisms.
Indeed, one might well use a number of measures of σ. For example, neoliberal or colonial exploitation or elimination of traditional farming strategies that previously isolated pathogens from livestock and/or humans, could well induce large-scale ecosystem shifts triggering massive increases in pathogen populations or their rates of speciation, inducing new patterns of transmission and virulence [Reference Leibler26]. That is, changes in policy or socioeconomic structure can ‘desterilize’ a natural or human ecosystem in which a pathogen has been traditionally held at a low level equilibrium value N c , or simply had not previously evolved.
In essence, traditional agriculture can, by its diversity in time, space, and mode, create numerous barriers – counterintuitively, a kind of noise similar to a sterilizing temperature – limiting pathogen evolution and spread. Plantation or factory farming, of course, removes such barriers to improve the ‘efficiency’ of production in time and space.
The argument suggests that it should be possible to empirically define a ‘critical ecosystem sterilizing temperature’ incorporating measures of the ‘collective roughness’ of disease-specific barriers to pathogen evolution and propagation.
It is worth noting that, in deep time, say 500 × 106 years in the past, possible evolutionary trajectories for most species would have, in general, been less locked in by path dependence, and thus more subject to ‘viral-like’ phase transitions allowing relatively large-scale changes in Bauplan or ecological niche. This observation may provide some insight into the Cambrian explosion, the remarkably rapid evolutionary divergence of living organisms that has perplexed evolutionary biologists for considerable time [Reference Wallace27].
EXAMPLES
Polio in the UK
A recent paper by Smallman-Raynor & Cliff [Reference Smallman-Raynor and Cliff28] examined an abrupt transition to heightened poliomyelitis endemicity in England and Wales between 1947 and 1957 that was found to be associated with a pronounced increase in the geographical rate of disease propagation. Figure 1, adapted from [Reference Smallman-Raynor and Cliff28], shows the punctuation in disease incidence that is the centrepiece of their analysis. Figure 1 a examines the UK, Figure 1 b, the USA. The latter example is more fully explored in [Reference Trevelyan, Smallman-Raynor and Cliff29].
Monthly series of poliomyelitis notification rates per 100 000 population to 1971. (a) England and Wales, (b) USA [Reference Smallman-Raynor and Cliff28].

Using a presence/absence method, [Reference Smallman-Raynor and Cliff28] defines a dimensionless velocity relation, with a value in the range [0 − 1], measuring the average time from the onset of polio season to the first notified case in a given category of district. Low/high values of the normalized velocity of the epidemic leading edge (VLE) indicate slow/fast spreading infection waves. See Figure 2, and note particularly the increased rate of propagation in the period 1947–1957.
Dimensionless reduced travelling wave velocity of polio infection vs. year, 1940–1964, for England and Wales [Reference Smallman-Raynor and Cliff28]. The period 1947–1957 shows particularly rapid rates of geographical propagation. VLE, Normalized velocity of the epidemic leading edge.

As [Reference Smallman-Raynor and Cliff28] puts it, relative to the immediately preceding (1940–1946) and following (1958–1964) years, when vaccine became widely available, the period of heightened endemicity (1947–1957) was associated with a faster rate of spatial advance, a slower rate of spatial retreat, and an extended period of notified activity. The changes were underpinned by a shift in the geographical pattern of disease activity, from small focal outbreaks in the inter-war years to national epidemics in the post-war years. These observations, they conclude, are consistent with the operation of an emergence process that considerably enhanced the efficiency by which poliomyelitis spread from one geographical area to another. The enhancement, however, was not gradual; it occurred abruptly with the onset of heightened epidemicity and involved both urban and rural areas of the country. In particular, [Reference Smallman-Raynor and Cliff28] notes, the diffusion characteristics of the events of 1947–1957 are analogous to those observed involving the first-time spread of viral diseases such as new pandemic strains of influenza A in a population.
Recent work by Law [Reference Law30] suggests a possible mechanism for Figure 1. The essential point of [Reference Law30] is that histories of suburban London, in particular, underplay the importance of the car to inter-war mobilities. An emphasis on public transport has, in his view, occluded our understanding of the role of motoring in the transformation of suburban life. This is in marked contrast to work on American suburbia that affords the car a prime role in the suburbs' formation. A vast array of data shows that, by the end of the 1930s, suburban motoring had highly heterogeneous levels of adoption in the UK, but, where it was popular, it changed mobility in a marked manner that prefigured wider developments of the late 1950s.
Figure 3, using data from [Reference Plowden31], shows, for the UK, millions of registered cars vs. year from 1930 to 1957, the last year of severe poliomyelitis outbreaks in the UK. Note the marked decline during the war years. This may, in fact, index a far more general mobility constraint associated with deliberate policies limiting rail and other civilian traffic during the war, carried out under the rubric of ‘Is your trip necessary?’
Millions of registered cars in the UK between 1930 and 1957 [Reference Plowden31]. Note the steady increase between 1930 and 1939, the marked decline during World War II, and the explosive rise thereafter.

Figure 4 shows the dimensionless reduced travelling wave velocity [Reference Smallman-Raynor and Cliff28], and Figure 5 a plot of poliomyelitis epidemic duration [Reference Smallman-Raynor and Cliff28], both as functions of the number of registered cars between 1940 and 1957 [Reference Plowden31]. A step function phase transition is evident in both cases at about 2 million cars.
Dimensionless reduced leading-edge travelling wave velocity of polio epidemics [Reference Smallman-Raynor and Cliff28] vs. millions of registered cars, 1940–1957 [Reference Plowden31]. Note the evident phase transition at about 2 million cars. VLE, Normalized velocity of the epidemic leading edge.

Polio epidemic duration in weeks [Reference Smallman-Raynor and Cliff28] vs. millions of registered cars, 1940–1957 [Reference Plowden31]. The phase transition at 2 million is even more clearly displayed.

Defining a ‘normalized characteristic extent’ of the epidemics as the dimensionless reduced velocity of the leading edge times the epidemic duration produces an even more distinct step function, representing the shift from isolated foci to a more general national outbreak (see Fig. 6).
The obvious inference is that the sudden availability of private travel in the UK after World War II (WW II) was sufficient to breach sterilizing socio-geographical isolation between what would otherwise have been small focal outbreaks, a phase transition triggering the punctuated dynamics of Figures 1 a and 2.
In a sense, then, the normalized characteristic extent can be viewed as a classic order parameter, and the number of cars as a smoothing agent, reducing the friction coefficient σ in equations (8), (9) and (10), eventually driving the co-evolutionary socio-viral system across a critical point.
VLE × epidemic duration, 1940–1957 vs. millions of registered cars, representing a normalized ‘characteristic extent’ of the polio epidemics. The failure of constraint to discrete focal centres after 2 million is evident. VLE, Normalized velocity of the epidemic leading edge.

Poliomyelitis, unlike the various influenzas, appears more evolutionarily stable than its embedding social milieu, and successful vaccines continue to include the basic three viral types. This challenges assertions that introduction of a ‘new’ viral strain to the UK accounts for the explosive post-war outbreaks [Reference Smallman-Raynor and Cliff28].
Although a socio-viral co-evolution may well have selected type I over less virulent strains, the driving force, as it were, appears to be the shift from travel patterns defined primarily by long-established, and hence epidemiologically stable, public transport to a randomization of contact consequent on increasingly widespread automobile travel. In that regard, the ‘signal’ epidemiological event of 1938 from Figure 1a may well have been a harbinger of things to come, as it took place when car numbers first reached the 2 million mark.
Polio in the USA
The USA is, of course, much larger than England and Wales, and represents an amalgam of semi-detached geographical regions that would be expected to undergo a qualitatively different pattern of semi-independent polio outbreaks. Nonetheless, Figure 1 b shows distinct post-WW II spiking.
Unfortunately, VLE statistics for US polio outbreaks are not available, precluding exact comparison with the UK example. What is available, from [Reference Trevelyan, Smallman-Raynor and Cliff29] and from standard statistical abstracts, is given in Figures 7 and 8. Figure 7 shows the poliomyelitis rate per 100 000 population plotted against billions of motor vehicle miles travelled from 1921 to 1954, the last epidemic year before widespread introduction of the vaccine. Figure 8 shows billions of vehicle miles travelled between 1940 and 1955, focusing on the critical explosion after WW II.
Poliomyelitis rate per 100 000 vs. billions of motor vehicle miles travelled (VMT) for the USA, 1921–1955. The fitted linear regression accounts for 63·2% of the variance, adjusted for degrees of freedom. Note, however, the upper-right cluster, that appears to represent a national phase transition at about 350 billion VMT.

Billions of vehicle miles travelled in the USA, 1940–1955. The post-war explosion is evident.

While a simple linear regression, adjusted for degrees of freedom, accounts for about 63% of variance, the upper-right cluster of points, representing the post-WW II outbreaks in Figure 1 b, is detached from the earlier system, and indicates a phase transition in the USA at about 350 billion vehicle miles travelled.
The phase change is illustrated by Figure 9, a simple cluster analysis using a centroid, squared Euclidean distance method. The lower cluster is centred at (5·3, 214·5), the higher at (22·1, 466·6), and transition between the two systems is characteristically unstable.
Cluster analysis for US polio outbreaks, 1921–1955, centroid method, squared Eculidian distance. Two groups are evident, centred at (5·3, 214·5) and (22·1, 466·6), respectively. VMT, Vehicle miles travelled.

Human-origin swine flu in the USA
Less evolutionarily stable pathogens than poliomyelitis present a qualitatively different challenge, since no one vaccine will fit all outbreaks. Unlike for polio, socioeconomic structure and government policy can initiate a synergism of disease spread and evolution, moving the dynamic beyond simply amplifying geographical diffusion.
With the globalization of the livestock industry, the distances over which food animal populations are transported have expanded to continental and even intercontinental scales. Figure 10 shows a surge in worldwide hog exports post-1990.
FAO data. International hog exports, 1961–2011.

The upswing in livestock miles goes hand in hand with the global spread of a corporate model of vertically integrated husbandry associated with farm consolidation and increases in head count per farm [Reference Wallace32]. By way of structural adjustment programmes and free-trade agreements, large-scale agribusinesses are moving company operations to the global South and Eastern Europe to take advantage of cheap labour, cheap land, weak regulation, and domestic production hobbled in favour of heavily subsidized agro-exporting. As a result, livestock and poultry monocultures of limited diversity and inherently dubious immunity are being raised right up against what have been long documented as reservoirs of multiple endemic pathogens, including year-round circulating strains of influenza.
But as Burch [Reference Burch, Fold and Pritchard33] explains, companies are also engaging in sophisticated corporate strategy. Agribusinesses are spreading their production line across much of the world. The CP Group, for one, now the world's fourth largest poultry producer, has poultry facilities in Turkey, China, Malaysia, Indonesia, and the USA. It has feed operations across India, China, Indonesia, and Vietnam. It owns a number of fast-food chain restaurants throughout South East Asia. A supply chain arrayed across multiple countries allows companies the means by which to compensate for any interruptions in business, including of their own making. CP operates joint-venture poultry facilities across China, producing 600 million of China's 2·2 billion chickens sold annually. When an outbreak of deadly bird flu H5N1 occurred in a farm operated by the CP Group in Heilongjiang province, Japan banned poultry from China. CP factories in Thailand filled the market gap by increasing exports to Japan.
The extent to which agroeconomic pressures on production margins are lengthening animal commodity chains is unprecedented. Genuses, a Manitoba company, flies thousands of specially bred pigs to Germany before a truck trip to Russia: Winnipeg to Krasandor on the other side of the world in 4 days [Reference Rollason34]. The implications for influenza are fundamental. First, the scale of transport increases the likelihood previously isolated influenza subtypes can trade genomic segments, as occurred for swine flu's transcontinentally recombinant H1N1 [Reference Wallace32, Reference Vijaykrishna35]. Second, increasing the virus's geographical scope likely selects for deadlier strains [Reference Messinger and Ostling13]. A renewable supply of susceptibles is thought to serve as a primary fuel for the evolution of virulence. The cost of killing off the host declines if another population of susceptibles is easily accessible at the next port of call.
Myers et al. [Reference Myers36] describe the US context:
During the past 60 years, the US swine industry has changed in composition from primarily small herds on family farms to include immense herds in large, corporate facilities [our Figure 11 , from [Reference Vijaykrishna35]]. The US pork industry now generates $11 billion annually and employs an estimated 575 000 persons (2002 figures). Although pork production facilities today are larger, fewer, and more efficient and require fewer workers, it is estimated that, nationwide, at least 100 000 workers work in swine barns with live pigs …
The potential for animal-to-animal transmission … among pigs in a swine confinement operation will be much greater than on a traditional farm because of the pigs' crowding (resulting in prolonged and more frequent contact). In addition, virus-laden secretions from pigs may be more concentrated, and reductions in ventilation and sunshine exposure may prolong viral viability. Thus, a confinement worker's probability of acquiring influenza virus infection may be increased.
Annual numbers of US swine operations and average hogs per operation, 1965–2005 [Reference Myers36].

The reverse is also documented, i.e. the transmission of human influenza to swine, raising the probability that a novel strain can emerge via reassortment. Livestock pigs had long hosted their own version of seasonal H1N1, evolutionarily related to our own, indeed originating in the very human influenza of 1918 infamy. From 1930 to 1998 the pig version evolved only slightly. But starting in 1998, the virus was subjected to a series of reassortment events [Reference Garten37]. In North America, an aggressive swine H1N1 emerged with internal genes of a human H3N2 virus and an avian influenza virus. That virus subsequently spread across pig populations. In early 2009, a previously undocumented influenza, what we now know as swine flu H1N1(2009), emerged in humans in central Mexico and spread around the world as a new pandemic strain. Three of the new virus segments appeared to be from the classical swine influenza (HA, NP, NS), three from the North American H3N2-avian-swine recombinant we just described (PB2, PB1, PA), and two from a Eurasian swine recombinant (NA, M) that originated in birds. That is, every one of the new H1N1's genetic segments proved most closely related to those of influenzas circulating among swine.
Given the US polio example, the form of the domestic ‘traffic’ dependence of H1 spread and evolution is of particular interest. As Nelson et al. [Reference Nelson38] put it:
Millions of swine are transported year-round from the southern United States into the corn-rich Midwest, but the importance of these movements in the spatial dissemination and evolution of the influenza virus in swine is unknown. Using a large data set of influenza virus sequences, collected in North American swine during 2003–2010, we investigated the spatial dynamics of two influenza viruses of the H1 subtype that were introduced into swine from humans around 2003. Employing recently developed Bayesian phylogeography methods, we find that the spread of this influenza virus follows the large-scale transport of swine from the South to the Midwest. Based on this pattern of viral migration, we suggest that the genetic diversity of swine influenza viruses in the Midwest is continually augmented by the importation of viruses from source populations in the South, Understanding the importance of long-distance pig movements in the evolution and spatial dissemination of influenza virus in swine may inform future strategies for the surveillance and control of influenza, and perhaps other swine pathogens.
Figure 12 redisplays Table 2 from [Reference Nelson38], showing Markov jump counts between US regions vs. swine flows – number of exchanged swine – for 2009. The counts, showing estimated migration events across three US regions, are inferred through a Bayesian phylogenetic tree for several hundred H1N1 and H1N2 genetic sequences: South Central, South-Eastern, and Midwest sections, as characterized by [Reference Nelson38]. The resulting migration matrix shows six data points of exchange. The vertical axis is the jump count index, and the horizontal axis is the log of the number of transported swine. The third point represents slightly more than 1 million, and the highest, nearly 18 million swine transported between regions.
Markov jump counts between US regions vs. the log of swine flows, 2009 [Reference Nelson38]. The counts are inferred through the phylogenetic tree for several hundred H1N1 and H1N2 genetic sequences.

That third point appears to mark a cross-sectional punctuated transition to large-scale genetic change, roughly analogous to the transition at 350 billion vehicle miles travelled in Figure 7. The resulting variation may be merely a correlate of the extent of transport, but the introgression offers the kind of genetic substrate from which new variants and reassortants may draw. Indeed, new swine-origin human H1N1v, H1N2v and H3N2v were recently documented in the summer and autumn of 2012 across ten states, mainly in the Midwest [39].
DISCUSSION AND CONCLUSIONS
The variables scientists include in their models embody a social decision. What researchers choose to make internal or external to their model, including which data to concatenate (or exclude), can have a significant impact on both its meaning and application. The same can be said of the formalisms developed here. We have presented a class of statistical models characterizing co-evolutionary and mosaic disease dynamics (and attendant management strategies) from first principles. We extend evolutionary theory via necessary conditions imposed by the asymptotic limit theorems of communication theory, including a ‘thermal’ critical point for path dependency: from organisms (and environments) characterized by deep-time historical constraints to, we propose, pathogens with much greater leeway to explore their evolutionary space [e.g. 40].
The effects landscape dynamics impose on viral evolution, and control efforts, appear fundamental. As Burdon & Thrall [Reference Burdon and Thrall40] put the matter:
[I]t seems highly likely that heterogeneity in agro-ecological interactions across geographical ranges could result in novel disease dynamics (e.g. shifts from ‘boom-and-bust’ to more endemic situations and vice versa) as well as spatial variation in the likelihood of disease emergence and the evolution of new virulence. From an applied evolution perspective, therefore one research issue of clear importance has to do with understanding how agricultural management (e.g. crop spatial arrangement and extent, rotational sequences) in rural landscapes might influence host–pathogen population dynamics … Is it possible to use mosaic management approaches to landscapes to control disease? Overall, it is becoming increasingly clear that managing biological interactions in fragmented landscapes requires studying co-evolution in a community context.
Beyond the traditional purview of evolutionary theory and even applied epizoology, the environmental origins of such dynamics extend into the history of human populations.
Western commentators have widely painted indigenous societies as populated by ignorant savages who needed civilizing [Reference Said41, Reference Young42]. Western power – military, financial, and otherwise – was thus rationalized for seizing resources and deculturing non-Western societies, producing a kind of hollowed-out socioeconomy in which psychological and behavioural pathologies become manifest [Reference Fanon43, Reference Memmi44]. Similarly damaging polices have continued under rubrics of globalization and structural adjustment, fundamentally changing the nature of the underlying ecology, and often aided and abetted by non-governmental organizations based in Western nations [Reference Petras45, Reference Hearn46].
The detrimental effects of dismembering traditional human socioeconomies in the name of progress have long included triggering pandemics [Reference Watts47]. Outbreaks are now repeatedly broadcast out of the exploited outbacks of the world, following the travel and trade patterns of exploitation back into cities at the heart of the industrialized West, much as have AIDS [Reference Wallace48, Reference Wallace, Kahn and Pappas49] and now the near-annual spillovers of novel influenza recombinants.
However, while monocropping and other exploitative practices bear grave responsibility in the current epizootic crises, we risk the prelapsarian fantasy that pitches traditional approaches as inherently more sustainable. The archaeological strata are replete with dead civilizations that farmed themselves into extinction [Reference Diamond50]. In turn, there are many new approaches outside the control of the agribusiness model supporting sustainable production by, among other means, geographical heterogeneity. Wallace & Kock [Reference Wallace and Kock51] review examples in community-controlled agroforestry, grain and grass banking, cooperatives numbering tens of thousands of farmers, and a variety of experiments around nutrient management, conservation tillage, cover cropping, trap cropping, contour cropping, aquaculture, water harvesting, watershed restoration, scales of farming, and mixed crop-livestock systems, all integrated into local social matrices.
As Wallace & Kock describe:
Farmers are daily devising and applying new innovations in organic agriculture to solve today's problems in growing plants and raising livestock, and in climatic and economic contexts of a particular historical moment … Sustainability arises in part from communal ownership of the problem of integrating food and ecology, including recycling physical and social resources for the next season, year, or generation. Such communities are almost by definition unlikely, even unable, to engage in the kinds of ‘spatial fixes’ routinely undertaken by agribusinesses, which, with little compulsion otherwise, are able to move their operations out of a region they've environmentally ruined or even geographically ‘surf’ their own wave of destruction.
The blowback from individual and collective decisions on automobile ownership and usage in the UK and the USA appears to have included unleashing polio epidemics among populations that were previously screened from infection by relative isolation. The public health consequences of individual and collective decisions regarding inexpensive animal protein threaten to be far more serious. Absent fundamental political change supporting such efforts as described in [Reference Wallace and Kock51], and reversing the exploitative relationships instantiating current global policies, the blowback harvests of infection will likely continue to accrue until one of the more virulent of strains now evolving wipes out a good portion of humanity.
ACKNOWLEDGEMENTS
The authors thank Dr D. N. Wallace and Dr M. J. Law for crucial discussions, and the reviewers for comments useful in revision.
DECLARATION OF INTEREST
None.



