


1. Introduction
It has been suggested that arc–continent collision leads to relatively short timescale orogenic events (Dewey, Reference Dewey2005) compared to other styles of mountain building events (e.g. continent–continent collision or Andean-style ocean–continent plate collision). The Grampian orogen of the British and Irish Caledonides formed during the early stages of Iapetus Ocean closure and extends from Connemara (western Ireland), through NW Ireland and mainland Scotland to Shetland (Lambert & McKerrow, Reference Lambert and McKerrow1976; Dewey & Shackleton, Reference Dewey and Shackleton1984; Chew & Strachan, Reference Chew, Strachan, Corfu, Gasser and Chew2014). It is one of the most intensively studied arc–continent collision systems in the world, and a growing body of evidence in recent decades has pointed to a relatively short duration for deformation (Wellings, Reference Wellings1998), Barrovian-style metamorphism (Yardley et al. Reference Yardley, Barber and Gray1987; Friedrich et al. Reference Friedrich, Hodges, Bowring and Martin1999 b), magmatism (Friedrich et al. Reference Friedrich, Bowring, Martin and Hodges1999 a,b) and exhumation (Friedrich et al. Reference Friedrich, Hodges, Bowring and Martin1999 b) associated with orogenesis. In particular, U–Pb geochronology constraints suggest a relatively short-lived (˜12 Ma) period of arc-related magmatism in the Connemara region of the Irish Caledonides (Friedrich et al. Reference Friedrich, Bowring, Martin and Hodges1999 a,b). The geochronological data for Connemara fit well with age constraints on Grampian orogenesis in Scotland, where collision, magmatism and metamorphism are also considered to have occurred relatively rapidly (Oliver et al. Reference Oliver, Chen, Buchwald and Hegner2000; Oliver, Reference Oliver2001; Baxter et al. Reference Baxter, Ague and Depaolo2002).
Here we place new constraints on the nature and timing of mid-lower crustal magma emplacement and associated metamorphism in the Grampian rocks of Connemara. The early stage of collision (early main-phase deformation; D2) was associated with a N-vergent oceanic arc, but by the late main-phase deformation (D3), a subduction polarity flip had occurred with the development of a S-vergent Andean-style continental arc (Dewey, Reference Dewey2005). The arc magmatism is mainly represented in southern Connemara by an extensive suite of mainly metagabbroic intrusions with associated calc-alkaline intermediate to felsic rocks (termed the Metagabbro Gneiss Complex; MGC; Leake, Reference Leake1958, Reference Leake, Newall and Rast1970, Reference Leake1989; Yardley et al. Reference Yardley, Barber and Gray1987; Leake & Tanner, Reference Leake and Tanner1994; Fig. 1). In the northern part of the Connemara terrane, a suite of mafic-ultramafic intrusions referred to as the Dawros–Currywongaun–Doughruagh Complex (DCDC) crops out (Fig. 1). The southern Connemara metagabbros are considered to have been emplaced coevally with D3 (Tanner, Reference Tanner1990), at 470.1 ± 1.4 Ma (U–Pb zircon age; Friedrich et al. Reference Friedrich, Bowring, Martin and Hodges1999 a). However, on the basis of detailed structural mapping and field observations, Wellings (Reference Wellings1998) argued that the DCDC intruded during D2, and that some of the larger DCDC intrusions were deformed syn-magmatically by D3 as they cooled down. Wellings used the latter observation together with thermal modelling to argue that the time gap between D2 and D3 in Connemara was no greater than 0.5 Ma. Friedrich et al. (Reference Friedrich, Bowring, Martin and Hodges1999 a) reported a weighted mean 207Pb–206Pb age of 474.5 ± 1.0 Ma from a population of near concordant zircons from a noritic pegmatite in the Currywongaun intrusion, supporting the idea that the DCDC may have been emplaced before the syn-D3 MGC.
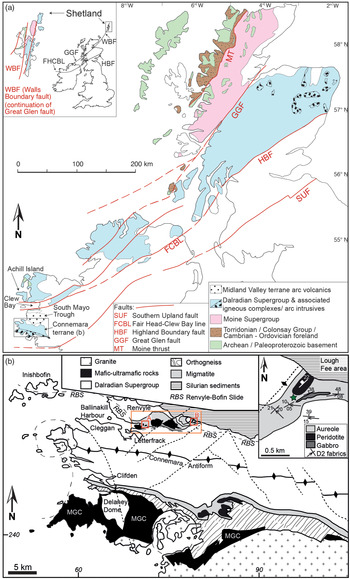
(a) Geological map of the Caledonides of NW Ireland and Scotland, adapted from Chew et al. (Reference Chew, Daly, Magna, Page, Kirkland, Whitehouse and Lam2010), with the location and tectonic relationship of Shetland to the area covered in the main panel shown in the inset at top left. The positions of the major terrane bounding structures are approximate. (b) Geological sketch map of Connemara, western Ireland (position of this panel is indicated by black rectangle in (a) above), showing the location of the intrusions of the DCDC (the mafic-ultramafic bodies within the orange-coloured rectangle) and the locations of the samples studied here (in red squares), where the localities labelled A and B denote the Creggauns and Lough Fee localities, respectively. The inset at top right shows the geological detail of the area around Lough Fee, with the LF-12-02 locality marked by a green star. The Renvyle–Bofin Slide referred to in the text is labelled. The main bodies of the Metagabbro Gneiss Complex in southern Connemara are denoted MGC. The main panel is adapted from O’Driscoll et al. (Reference O’Driscoll, Powell and Reavy2005) and the Lough Fee inset is adapted from Wellings (Reference Wellings1998). The coordinate system shown in (b) is that of the Irish National Grid.

An important implication of the work described above is that the DCDC represents the earliest known magmatism associated with the Grampian Orogeny in Connemara and is associated with a change in the style of deformation (D2 to D3), from crustal thickening and transpressive fabric formation to regional-scale contact metamorphism and folding (Leake & Tanner, Reference Leake and Tanner1994). Thus, shedding further light on the timing of emplacement of these intrusions is valuable in the wider context of polyphase deformation in the Caledonides. One goal of this study is therefore to test the hypothesis implied by the findings of the Friedrich et al. (Reference Friedrich, Bowring, Martin and Hodges1999 a) and Wellings (Reference Wellings1998) studies, namely that emplacement of the DCDC was syn-D2 and that the thermal effects of magmatism were short-lived. We report new U–Pb ages from zircons in the thermal aureole of the DCDC. The zircons are hosted in a magnetite-rich layered rock package at the top of the Ben Levy Grit Formation (BLGF) that is interpreted as a series of heavy mineral seams. Zircon textures together with other characteristics of the rocks suggest they have been reworked at relatively high metamorphic grades, during syn-tectonic intrusion of the DCDC. These zircons are mostly interpreted as magmatic on the basis of their rare earth element (REE) and Th/U compositions, while the U–Pb ages they yield are mainly within uncertainty of those reported by Friedrich et al. (Reference Friedrich, Bowring, Martin and Hodges1999 a). The ranges of spot ages obtained here constrain DCDC magma intrusion and associated high-temperature metamorphism (zircon growth) to an absolute maximum duration of ˜11 Ma, between 477.1 and 466.1 Ma. However, it is likely that zircon growth occurred much more quickly than this, based partly on the ˜0.5 Ma timeframe for cooling of the DCDC proposed by Wellings (Reference Wellings1998). The maximum range of ages reported here matches well with the range of 475 to 463 Ma previously proposed by Friedrich et al. (Reference Friedrich, Bowring, Martin and Hodges1999 a) for the Grampian Orogeny overall in Connemara and, although not resolvable within uncertainty, permit DCDC magmatism to have preceded that associated with the MGC. Our findings are permissive of models that argue for relatively short-lived and pronounced Grampian orogenesis in the Connemara Caledonides (e.g. Wellings, Reference Wellings1998; Friedrich et al. Reference Friedrich, Bowring, Martin and Hodges1999 a,b; Soper et al. Reference Soper, Ryan and Dewey1999).
2. Geological setting
The DCDC intrudes the Neoproterozoic to lower Palaeozoic Dalradian Supergroup, a thick (c. 25 km maximum cumulative thickness) sequence of metasedimentary and metavolcanic rocks deposited during rift-related sedimentation on the Laurentian margin of the Iapetus Ocean (Harris & Pitcher, Reference Harris, Pitcher, Harris, Shackleton, Watson, Downie, Harland and Moorbath1975). The Connemara Dalradian lithostratigraphy can be correlated with the Dalradian succession of Scotland (Tanner & Shackleton, Reference Tanner, Shackleton, Harris, Holland and Leake1979). The DCDC was emplaced into the BLGF, considered to be the lateral equivalent of the (uppermost) Southern Highland Group in Scotland (Tanner & Shackleton, Reference Tanner, Shackleton, Harris, Holland and Leake1979; Leake & Tanner, Reference Leake and Tanner1994). The BLGF consists of a thick sequence of semi-pelites, psammites and volcanogenic layers, and occurs to the north and east of the Renvyle–Bofin Slide, a tectonic discontinuity that separates the BLGF from stratigraphically and structurally lower Dalradian units (Cruse & Leake, Reference Cruse and Leake1968; Leake & Tanner, Reference Leake and Tanner1994). The Dalradian rocks experienced polyphase deformation and metamorphism during closure of the Iapetus Ocean (Ryan & Dewey, Reference Ryan and Dewey1991; Soper et al. Reference Soper, Ryan and Dewey1999). In Connemara, an early crustal thickening event is associated with Barrovian-type metamorphism, which resulted in regional development of a garnet–staurolite–(kyanite) assemblage (Yardley et al. Reference Yardley, Barber and Gray1987). The principal subsequent metamorphic event is essentially a regional-scale thermal aureole (at amphibolite-to-granulite-facies conditions) associated with the intrusion of the southern Connemara MGC. This latter metamorphic event is characterized by widespread growth of sillimanite in the south (close to the MGC) or andalusite further to the north (Yardley et al. Reference Yardley, Barber and Gray1987). The early metamorphic event is correlated with D2, the principal fabric-forming event, as well as isoclinal folding, and the second metamorphic event is associated with D3 (refolding of S2 and F2) (Yardley et al. Reference Yardley, Barber and Gray1987; Boyle & Dawes, Reference Boyle and Dawes1991). The D2 event is thus associated with the development of a pervasive foliation, small-scale (<1 m) wavelength folds, as well as a major fold closure, and the D3 event with a crenulation cleavage and numerous metre–kilometre wavelength folds. The exact relationship between the MGC and the DCDC is not well understood owing to their geographic separation, and the axial trace of the D4 Connemara Antiform runs between both intrusive suites (Fig. 1).
The DCDC comprises a suite of mafic-ultramafic bodies that crop out between Lough Fee (east) and Ballinakill Harbour (west) (Fig. 1). The largest intrusions are the Dawros Peridotite and the Currywongaun and Doughruagh gabbros. The rest comprise smaller (<100 m diameter) mafic and ultramafic bodies that mainly occur between Dawros and Currywongaun, as well as at Lough Fee (Fig. 1). The DCDC is associated with a well-developed contact aureole, containing migmatites and sillimanite-bearing semi-pelites. It has been proposed that the components of the DCDC are petrogenetically related, with Dawros (and other ultramafic components) representing early (and structurally deeper) magmatic differentiates, and Currywongaun–Doughruagh and other gabbroic bodies crystallizing from relatively fractionated magmas (Ingold, Reference Ingold1937; Rothstein, Reference Rothstein1957; Leake, Reference Leake1964, Reference Leake, Newall and Rast1970; Kanaris-Sotiriou & Angus, Reference Kanaris-Sotiriou and Angus1976). Kanaris-Sotiriou & Angus (Reference Kanaris-Sotiriou and Angus1976) argued that syn-tectonic emplacement of the DCDC resulted in syn-magmatic separation of the intrusions. Bennett & Gibb (Reference Bennett and Gibb1983) alternatively suggested that it was possible the Dawros intrusion was emplaced as a separate body to the Currywongaun–Doughruagh gabbros. Hunt et al. (Reference Hunt, O’Driscoll and Daly2012) used mineral chemical and textural characteristics of Cr-spinel in chromitite layers from the Dawros intrusion to demonstrate that these rocks probably represent cumulates formed in an open-system, mid-to-lower crustal supra-subduction zone magma chamber.
The detailed field observations and structural analysis of Wellings (Reference Wellings1998) lend strong support to a syn-D2 emplacement model for the DCDC, although he envisaged the intrusion of discrete magma bodies to be a consequence of emplacement into deforming crust, rather than intrusion and subsequent disaggregation of a semi-solidified body (see also Wellings, Reference Wellings1997; O’Driscoll, Reference O’Driscoll2005; O’Driscoll et al. Reference O’Driscoll, Powell and Reavy2005). At Lough Fee, a small metagabbro body (˜400 m2), with an adjacent peridotite (˜700 m2), make up the easternmost known portion of the DCDC. The metagabbro is altered and completely deformed by D2 fabrics (Welling, Reference Wellings1998). The peridotite contains discontinuous layers of websterite–clinopyroxenite in a predominantly lherzolitic–dunitic host; olivine is largely altered to serpentine in this lithology. Although exposure is poor, the thermal aureole around the Lough Fee intrusions contains rocks of high metamorphic grade, similar to those in the main thermal aureole area between Dawros and Currywongaun (Fig. 1).
3. Sample descriptions
The samples studied here come from within the thermal aureole of the DCDC, within several tens of metres of the closest intrusion in each case. Sample LF-12-02 comes from the Lough Fee area, ˜50 m from the southern contact of the peridotite (Fig. 1). Sample DC-12-02 comes from ˜100 m to the south of the Creggauns gabbro body (Fig. 1), close to the Dawros Peridotite. Both samples are coarse-grained, foliated and characterized by millimetric–centimetric light–dark discontinuous layering (Fig. 2a) that is interpreted here as bedding. In the country rocks around the intrusions at Lough Fee, a pervasive E–W-trending, gently plunging (in either direction) lineation is common, with an E–W- to NE–SW-striking foliation and localized sub-metre amplitude isoclinal fold development (Fig. 2b). At Creggauns, the structure of the rocks is very complex, with no obviously consistent fabric pattern observed; this was termed the area of ‘anomalous orientations’ by Wellings (Reference Wellings1998). Evidence of partial melting (migmatite) of country rock is evident at both Lough Fee and Creggauns, and the leucocratic veins and patches are foliated and folded with the metasedimentary rocks (Fig. 2c).
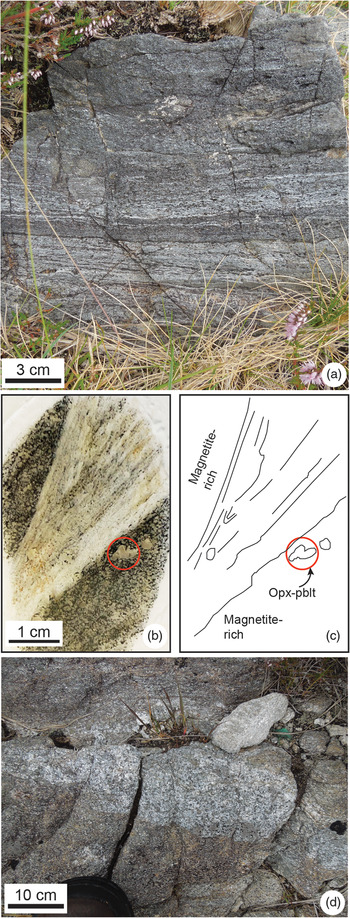
(a) Field photograph of the magnetite–quartz banding at Lough Fee. (b) Thin-section scan of magnetite-rich sample from Lough Fee. The red circle highlights the position of ‘Opx-pblt’ labelled in (c). (c) Interpretative sketch of fold in the thin-section illustrated in (b). The orthopyroxene crystal highlighted is interpreted as being folded into a micro-parasitic structure on the limb of this fold, which is close to isoclinal in geometry. (d) Irregularly shaped patch of leucosome material (quartzofeldspathic), elongate along the main foliation orientation, in the Lough Fee area.

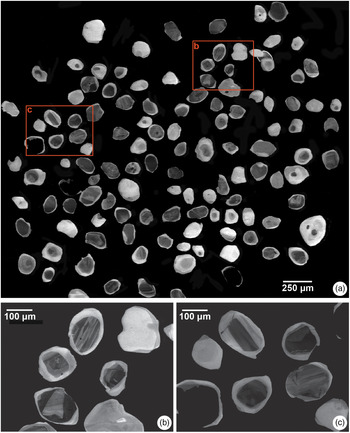
Sample LF-12-02 contains dark magnetite-rich bands (up to 95 vol. % of some layers) of thicknesses up to ˜1 cm (Fig. 2a). The bands mainly comprise sintered magnetite grains with ribbon-textured quartzofeldspathic bands and contain a relative abundance (i.e. above accessory quantities; at up to ˜2 % by volume) of zircon crystals. Zircon is sparse or absent in the alternating quartz-rich layers. Zircon crystals always exhibit rounded outer margins and are typically characterized by circular or slightly elliptical (‘soccerball’) morphologies in the plane of observation (Fig. 3a, e). They appear to be randomly dispersed throughout the magnetite-rich layers and, where elliptical, they are aligned with the foliation in the rock. Some zircons in LF-12-02 host appreciable quantities of melt inclusions. The alternating layers are primarily composed of foliated (ribbon-textured) quartz, with abundant microstructural evidence for solid-state deformation (i.e. sub-grain development, neocrystallization). Microscale evidence for melting is not observed in the quartz-rich layers. Pinkish orthopyroxene porphyroblasts up to 0.5 mm in diameter are common in the quartz-rich layers. The orthopyroxene crystals are locally folded into the foliation, being parasitic on centimetre-scale isoclinal folds (Fig. 3b, c), and are typically surrounded by coronas of slightly pleochroic amphibole and quartz (Fig. 3d). The coronas also appear to be folded into the foliation. The interiors of orthopyroxene porphyroblasts are ubiquitously patchily replaced by a fine-grained fibrous alteration phase. Rounded apatite grains are present, though are less abundant than zircon, and are typically spatially associated with the magnetite bands.
In DC-12-02, the magnetite is much finer grained (˜1 μm) and magnetite-rich bands are thinner than in LF-12-02. Zircon is not as abundant as in LF-12-02 and orthopyroxene is not observed.
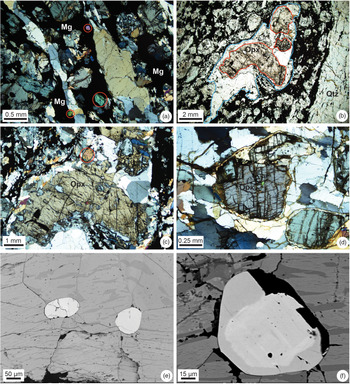
(a–d) Petrographic images of magnetite-rich layers at Lough Fee. (a) Cross-polarized image of mixed magnetite–quartz (Qtz) rock, showing typical appearance of zircon in these materials (circled in red). Note rounded shape of the grains and their location in or close to magnetite (Mg)-rich domains. (b) Plane-polarized light image of the orthopyroxene (Opx) porphyroblast highlighted in Figure 2b, c. The red and blue outlines highlight the edges of the orthopyroxene crystal and its quartz–amphibole-bearing corona, respectively. (c) Cross-polarized image of the same crystal as shown in (b). Despite appearing as separate crystals in this plane of observation, this crystal is in optical continuity (i.e. the three domains highlighted in red in (b) are in optical continuity). A zircon crystal is highlighted by the red circle. (d) Cross-polarized light image of an orthopyroxene porphyroblast (with another to the bottom-right). Note the alteration haloes or coronas on these grains, composed of amphibole. (e) Back-scattered electron micrograph of two zircon crystals hosted in sintered magnetite. Note the wedge-shaped ilmenite lamellae along crystallographic planes. (f) Rounded zircon crystal containing a relatively bright core, surrounded by a darker outer mantle, hosted in magnetite.

4. Analytical techniques
Electron probe microanalysis (EPMA) was conducted to examine compositional and microstructural characteristics of orthopyroxene and zircon in sample LF-12-02. Back-scattered electron imaging, element mapping and quantitative compositional analysis (of orthopyroxene) were carried out using a Cameca SX100 at the University of Manchester. The operating conditions for quantitative analyses of orthopyroxene included an acceleration voltage of 15 kV, a beam current of 10 nA and a spot size of 1 μm. The standards used included the NMNH Kak augite. Analytical conditions for the mapping included an acceleration voltage of 15 kV and 10 nA beam current.
Zircon grains were separated using standard separation and concentration procedures (jaw crushing, Wilfley table, heavy liquids and magnetic separation) at the Department of Geology, Trinity College Dublin (TCD). The fraction between 125 and 250 μm was employed. Zircons were picked under a binocular microscope in ethanol, mounted on 2.5 cm epoxy mounts and polished to approximately half thickness prior to analysis. Cathodoluminescence (CL) images of zircon grains were acquired at the Centre for Microscopy and Analysis at TCD using a Tescan MiraXMU Scanning Electron Microscope with a KE Developments Centaurus Cathodoluminescence Detector. Analysis was carried out at the iCRAG Labs at TCD using an Agilent 7900 quadrupole inductively coupled plasma mass spectrometer (ICP-MS) coupled with a Photon Machines Analyse Excite 193 nm ArF Excimer laser with a HelEx II 2-volume ablation cell; 0.4 l min−1 He carrier gas was split evenly between the large outer sample chamber and the small inner volume (the ‘cup’) where ablation occurs. A small volume of N2 (c. 6 ml min−1) to enhance signal sensitivity and reduce oxide formation and 0.7 l min−1 Ar nebulizer gas was then introduced to the sample–gas mixture via an in-house smoothing device. A laser fluence of 2.5 J cm−2 was employed in all four sessions. The zircon age standards employed across the sessions were 91500 zircon (206Pb–238U thermal ionization mass spectrometry (TIMS) age of 1065.4 ± 0.6 Ma; Wiedenbeck et al. Reference Wiedenbeck, Allé, Corfu, Griffin, Meier, Oberli, Von Quadt, Roddick and Spiegel1995), Plešovice zircon (weighted mean 206Pb–238U TIMS age of 337.13 ± 0.37 Ma; Sláma et al. Reference Sláma, Košler, Condon, Crowley, Gerdes, Hanchar, Horstwood, Morris, Nasdala, Norberg, Schaltegger, Schoene, Tubrett and Whitehouse2008), Temora 2 zircon (206Pb–238U TIMS age of 416.8 ± 1.3 Ma; Black et al. Reference Black, Kamo, Allen, Aleinikoff, Davis, Korsch and Foudoulis2003), Tardree zircon (weighted mean 206Pb–238U TIMS age of 61.32 ± 0.09 Ma; Ganerød et al. Reference Ganerød, Chew, Smethurst, Troll, Corfu, Meade and Prestvik2011) and WRS-1348 (weighted mean 206Pb–238U TIMS age of 526.26 ± 0.70 Ma; Pointon et al. Reference Pointon, Cliff and Chew2012). The laser repetition rate, analysis time and secondary standard data are listed in Table 1.
LA-ICP-MS analytical and standard information (see text for further detail)

The raw isotope data were reduced using the ‘VizualAge’ data reduction scheme of Petrus & Kamber (Reference Petrus and Kamber2012) within the freeware IOLITE package of Paton et al. (Reference Paton, Hellstrom, Paul, Woodhead and Hergt2011). User-defined time intervals are established for the baseline correction procedure to calculate session-wide baseline-corrected values for each isotope. The time-resolved fractionation response of individual standard analyses is then characterized using a user-specified down-hole correction model (such as an exponential curve, a linear fit or a smoothed cubic spline). The data reduction scheme then fits this appropriate session-wide ‘model’ U–Th–Pb fractionation curve to the time-resolved standard data and the unknowns. Sample-standard bracketing is applied after the correction of down-hole fractionation to account for long-term drift in isotopic or elemental ratios by normalizing all ratios to those of the U–Pb reference standards. For zircon REE analyses, the data for LF-12-02 were collected simultaneously with the U–Pb isotope data, whereas for DC-12-02, the data were collected separately from spots placed in the same CL-zone. The raw REE isotope data were reduced using the ‘Trace Elements’ data reduction scheme in IOLITE. NIST612 standard glass was used as the primary standard, with 91Zr employed as an internal standard. 91500 zircon (Wiedenbeck et al. Reference Wiedenbeck, Allé, Corfu, Griffin, Meier, Oberli, Von Quadt, Roddick and Spiegel1995) was used as a secondary standard control for the zircon REE data.
5. Results
The effects of retrograde metamorphism meant that primary orthopyroxene compositions could only be determined from the cores of two or three porphyroblasts from two hand samples (see Fig. 4a and online Supplementary Material Table S1). Orthopyroxene in LF-12-02 is magnesian hypersthene, i.e. with enstatite–ferrosilite components in the approximate ratio 70:30. Values of Mg no. (Mg/(Mg+Fe2+)) range between 0.66 and 0.69 (n = 45), with an average of 0.67 (±0.01; 1σ). Orthopyroxene Al2O3 contents range between 7.8 and 9.6 wt %, CaO between 0.06 and 0.2 wt % and MnO between 0.49 and 0.64 wt %. Titanium (TiO2) contents are relatively low, ranging between 0.04 and 0.16 wt %. A calculation of the relative proportions of IVAl and VIAl suggests that the latter is a significant component in these orthopyroxenes: typically ≥40 % of total Al. A negligible (zero) ferric iron component was estimated for all orthopyroxene measurements, on the basis of stoichiometry, using the method of Droop (Reference Droop1987). Orthopyroxene chemical maps confirm the petrographic observations that the interiors of porphyroblasts are pervasively and significantly altered to a retrograde (hydrous) mineral assemblage (Figs 3b, c, d, 4b, c).
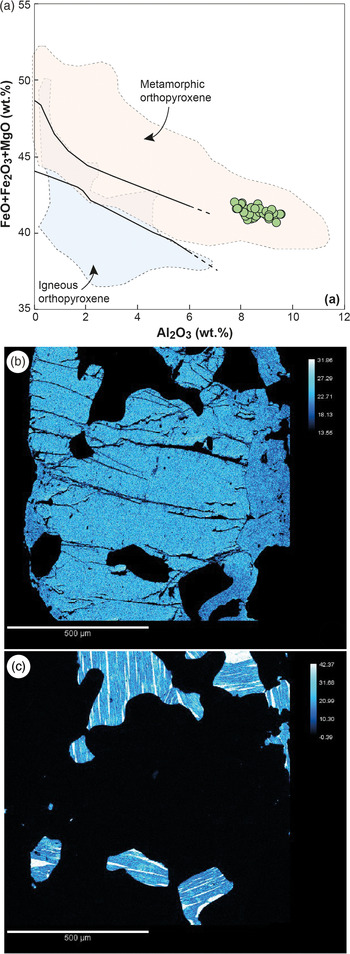
(a) Orthopyroxene from LF-12-02 plotted on the MgO + FeO + Fe2O3 versus Al2O3 orthopyroxene discrimination diagram of Bhattacharyya (Reference Bhattacharyya1971), with the transition zone of Rietmeijer (Reference Rietmeijer1983) delineated by the solid black lines. (b) Quantified MgO element map of orthopyroxene porphyroblast from LF-12-02. (c) Quantified TiO2 map of the same area as in (b). Note the titanomagnetite–ilmenite intergrowths in the oxide grains surrounding the orthopyroxene.

The back-scatter and chemical mapping carried out by EPMA reveals that the magnetite has a complex microstructure, comprising titanomagnetite with abundant wedge-shaped ilmenite lamellae that appear to be crystallographically constrained (Figs 3e, 4c). The titanomagnetite grains are also compositionally heterogeneous, with patchy development of Ti-rich domains that are not crystallographically constrained to the same extent as the ilmenite lamellae. Back-scattered electron imaging shows that many of the rounded zircon grains in sample LF-12-02 show complex internal structures, with irregularly shaped (brighter) cores mantled by darker rims (Fig. 3f).
Figure 5 shows CL representative images of zircons from LF-12-02. On the basis of the zircon textures revealed in the CL imaging, the zircons can be assigned to one of two populations: (1) relatively dark (weakly luminescent), irregularly shaped cores and (2) relatively luminescent (lighter-coloured) outer mantles, with rounded outer grain boundaries against their host magnetite/silicate. The darker cores exhibit complex internal microstructures, including oscillatory zoning, resorption surfaces, irregularly shaped patchy domains of variable composition and intra-crystal deformation (Fig. 5). The cores may have rounded or irregular outer margins. Some dark cores have themselves grown on pre-existing zircon crystal fragments. The relatively light-coloured mantles are variable in thickness and exhibit oscillatory zoning. Less commonly, the latter zircon population comprises whole grains, which can either be unzoned or show weakly developed oscillatory zoning. In contrast, no dark cores were observed in the zircons from DC-12-02.
Cathodoluminescence images of zircons from LF-12-02. The positions of (b) and (c) are marked in (a). Note the propensity for many grains to have relatively weakly luminescent cores and more luminescent rims. See text for discussion.

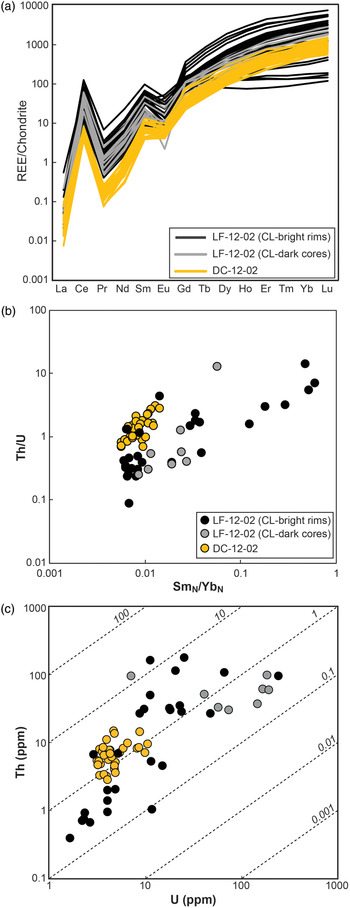
REE and Th/U data for the Lough Fee and Creggauns zircons are plotted in Figure 6 and reported in online Supplementary Material Table S2. In general, the chondrite-normalized REE patterns resemble those of typical magmatic zircons, with a steep positive slope from La to Lu, a marked positive Ce anomaly and a less prominent negative Eu anomaly (Fig. 6a; Whitehouse, Reference Whitehouse, Vance, Muller and Villa2003). The range of REE concentrations of DC-12-02 zircons is restricted, and relatively low (particularly for the light REEs), compared to that of the LF-12-02 population (both rims and cores). The range of REEs from the population of dark cores in LF-12-02 is also relatively restricted. The relatively CL-bright rim population from LF-12-02 exhibit a broader range of REE concentrations than the LF-12-02 core and DC-12-02 zircons, and in the case of some analyses the patterns exhibit shallow to flat slopes for the heavy REEs (HREEs). Zircon Th/U ratios from both samples further emphasize the compositional variations as discussed for the REE data. In particular, zircons from DC-12-02 have moderately high and relatively restricted Th/U ratios (0.5–5) whereas those from LF-12-02 span a much greater range (0.08–14), particularly in the CL-bright rims of some zircon grains (Fig. 6b). Figure 6c shows that the DC-12-02 zircons have relatively low and restricted Th and U contents, whereas in LF-12-02, Th and U are positively correlated and exhibit a relatively broad range of compositional variation. The CL-dark population from LF-12-02 are relatively U-rich and lie at the high Th and U end of this array, while the CL-bright population contain some U-poor compositions and span the entire range observed in both Th and U. Figure 6b shows that Th/U in the CL-bright zircons exhibits a positive correlation with SmN/YbN, such that zircons with relatively high Yb contents have lower Th/U.
(a) Chondrite-normalized REE plot for zircons from samples LF-12-02 and DC-12-02. (b) Ratio of Th/U versus chondrite-normalized Sm/Yb (SmN/YbN). (c) Thorium versus U (ppm). The symbols in (c) are the same as in (b). The values for CI chondrite used are from McDonough & Sun (Reference McDonough and Sun1995).

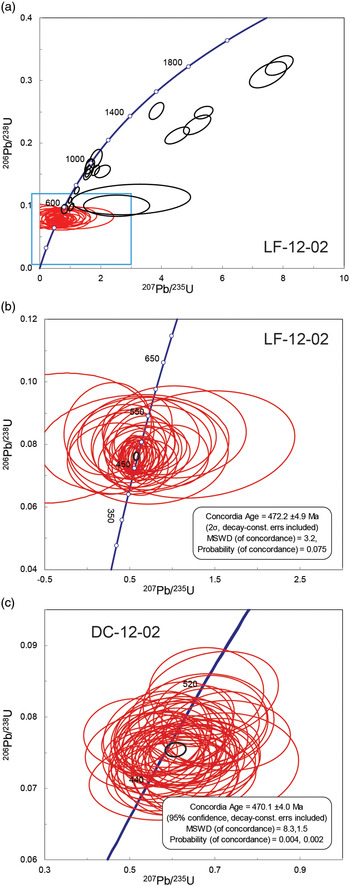
The U–Pb concordia diagrams for LF-12-02 and DC-12-02 are presented in Figure 7. For LF-12-02, a proportion of the zircons (corresponding to the CL-bright population) cluster near concordia and yield a concordia age of 472.2 ± 4.9 Ma (2σ; MSWD = 3.2; Fig. 7a, b; for the data, see online Supplementary Material Table S2). A number of analyses of the darker cores yield concordant ages older than 600 Ma, with a cluster of analyses at ˜1000 Ma. The remainder of the data are discordant (Fig. 7a). Zircons from DC-12-02 exclusively yield Grampian ages and reveal a concordia age of 470.1 ± 4.0 Ma (2σ; MSWD = 8.3; Fig. 7c).
U–Pb concordia diagrams for (a, b) LF-12-02 and (c) DC-12-02. The area shown in higher resolution in (b) is approximately that contained within the blue square in (a). See text for further details.

6. Discussion and conclusions
6.a. Metamorphism of heavy mineral seams in the Connemara Dalradian
The evidence presented here suggests that samples LF-12-02 and DC-12-02 represent Dalradian metasediments that have been reworked at relatively high grades of metamorphism. Field observations indicate that migmatite development in the Dalradian country rocks is extensive in close proximity to the DCDC intrusions. The quartz-rich bands in LF-12-02 and DC-12-02 do not show microstructural evidence for anatexis, such as myrmekite textures or millimetre–centimetre-scale leucosome development, but this is likely to be a feature of the resistant nature of the SiO2-rich material to melting and there is local field evidence for partial melting in close proximity (within tens of metres of the sampling sites; Fig. 2d). The high Al2O3 (and VIAl) contents of the orthopyroxene porphyroblasts suggest these rocks have undergone granulite-facies metamorphism (Fig. 4a). This is qualitatively supported by the ilmenite–titanomagnetite intergrowths in the magnetite layers, which are patchy and heterogeneously distributed (Fig. 4c), suggesting oxy-exsolution occurred at relatively high temperature (cf. Lindsley, Reference Lindsley1991). The Al-in-Opx geobarometer of Emslie et al. (Reference Emslie, Hamilton and Thériault1994) yields an average crystallization pressure of 12.9 kbar for the Lough Fee orthopyroxene (±0.6, 1σ; n = 45).
The zircon populations from LF-12-02 and DC-12-02 also reveal important insights into the contact metamorphic effects of the DCDC on its country rocks. The CL-bright zircon overgrowths in the magnetite-rich layers from LF-12-02 and all of the zircons from DC-12-02 mainly exhibit magmatic (chondrite-normalized) REE patterns and Th/U ratios >0.1 (Fig. 6a, c). Although Th/U ratios >0.1 are generally considered to be magmatic, zircon in high-temperature and ultrahigh-temperature metamorphic rocks have also been shown to have these characteristics (e.g. Harley et al. Reference Harley, Kelly and Möller2007; Yakymchuk et al. Reference Yakymchuk, Kirkland and Clark2018 and references therein). Application of Ti-in-zircon thermometry (cf. Watson et al. Reference Watson, Wark and Thomas2006; Ferry & Watson, Reference Ferry and Watson2007) to the CL-bright zircons from LF-12-02 reveals temperatures in the range 738 to 971 °C, with an average of 894 °C (±64 °C, 1σ; n = 27), suggesting that the rocks in and around the contact aureole of the DCDC were at or close to ultrahigh-temperature metamorphic conditions (the median of the same population is 904 °C). The subset of zircons with flattish HREEs from the CL-bright population in sample LF-12-02 might reflect a component of early cogenetic growth with a HREE-rich phase (e.g. garnet). However, SmN/YbN shows no correlation with temperature (as estimated from the Ti-in-zircon thermometer), as might be expected in this case. The U–Pb concordia ages yielded by the Creggauns and CL-bright Lough Fee populations (470.1 ± 4.0 Ma and 472.2 ± 4.9 Ma, respectively) support the suggestion that the high-temperature metamorphic event responsible for their formation was associated with the intrusion of the DCDC, as these ages overlap with that reported by Friedrich et al. (Reference Friedrich, Bowring, Martin and Hodges1999 a) for emplacement of the Currywongaun body and the onset of Grampian orogenesis: 474.5 ± 1.0 Ma. If, as suggested by Wellings (Reference Wellings1998) and supported by the observations made here (e.g. Figs 2b, c, 3c), intrusion of the DCDC was syn-tectonic, crustal deformation would presumably have facilitated magma/fluid mobility throughout the aureole rocks, accounting for the magmatic-like REE and Th/U signatures observed.
The petrographic and mineral chemical data suggest that the magnetite-rich layering in the contact aureole rocks at Lough Fee and Creggauns is a primary feature of the protolith, i.e. heavy mineral seams, an interpretation that is supported by the presence of an inherited (CL-dark) zircon population in the Lough Fee sample. Such seams are known to be abundant at certain stratigraphic levels within the Dalradian Supergroup (e.g. Achill Island; Winchester & Max, Reference Winchester and Max1996; D. M. Chew, unpub. Ph.D. thesis, Univ. College Dublin, 2001; Fig. 1a). The LF-12-02 and DC-12-02 samples clearly have a sedimentary protolith, and the occurrence/concentration of inherited (Neoproterozoic and older) zircons in the former indicates that this association pre-dates Grampian granulite-facies zircon growth. The inherited zircons in sample LF-12-02 have magmatic Th/U ratios (>0.1) and magmatic chondrite-normalized REE patterns, although some of these also exhibit evidence for a complex magmatic history of their own (see CL-dark cores in Fig. 5b, c). Indeed, the CL-dark zircon population bears microstructural similarities to populations of zircon with complex growth histories in ultrahigh-temperature rocks from the Sveconorwegian Province (Slagstad et al. Reference Slagstad, Roberts, Coint, Høy, Sauer, Kirkland, Marker, Røhr, Henderson, Stormoen, Skår, Sørensen and Bybee2018). The temperatures estimated from the CL-dark zircons overlap with the CL-bright population, though they do not extend to either as low or as high temperatures (i.e. range of 856 to 947 °C; average 895 °C, ±29 °C, 1σ; n = 8). The association of the quartz- and magnetite-rich layers in the country rocks of the DCDC supports the interpretation of a relatively high-energy and mature (i.e. second cycle) shallow marine depositional environment, considered typical for such heavy mineral seams (Winchester & Max, Reference Winchester and Max1996). Wellings (Reference Wellings1998) described a quartz-rich metasedimentary rock unit characterized by an ‘unreactive mineralogy’ to the west of Lough Fee, so heavy mineral seams may be a more common feature of the upper part of the Connemara Dalradian than previously considered.
The BLGF is the stratigraphically highest section of the Dalradian Supergroup in western Connemara and is correlated with the Southern Highland Group of Scotland. To the east, the Lough Kilbride Schist and Cornamona Marble Formation crop out at similar stratigraphic levels. Although the BLGF is younger than the Cornamona Marble Formation, its stratigraphic relationship to the Lough Kilbride Schist Formation is less clear. Both the BLGF and the Lough Kilbride Schist Formation are unconformably overlain by the Silurian Lough Mask Formation. While the BLGF is of Dalradian provenance, the origins of the Lough Kilbride Schist Formation are less certain (Leake & Tanner, Reference Leake and Tanner1994; Leake, Reference Leake2014), and it has been postulated that the latter could even represent a Cambro-Ordovician sequence (Long et al. Reference Long, McConnell and Archer1995). The presence of the laterally extensive (>10 km) heavy mineral seams reported here from the upper parts of the BLGF might therefore make a useful marker horizon for future work to establish the extent to which the Connemara Dalradian is continuous in the east of the terrane (e.g. in the Lough Kilbride region). These seams also represent a potentially fruitful future avenue for geochronological and sedimentary provenance work in the upper levels of the stratigraphy of the Connemara Dalradian.
6.b. Timescales of magmatism and metamorphism in the contact aureole of the DCDC
Wellings (Reference Wellings1997) interpreted the penetrative foliation at Lough Fee to be of D2 origin. The combined microstructural and mineral chemical evidence presented here is compatible with this conclusion. Despite their predominantly magmatic compositional characteristics, the LF-12-02 zircons exhibit metamorphic microstructures (morphologies) and are aligned with the foliation in the rocks. Orthopyroxene grains, as well as their alteration coronas, are folded into the foliation, suggesting that cooling and retrograde alteration was under way before D2 ended. Later (D3) deformation tends to be associated with large-scale (1–2 km wavelength) folds, so the smaller-length-scale structural deformation at Lough Fee does seem most likely to be caused by D2. Our combined observations, therefore, appear to be best explained by a close association of magmatism and deformation, i.e. syn-tectonic (D2) intrusion of the DCDC, as suggested by Wellings (Reference Wellings1997, Reference Wellings1998). A key observation of Wellings (Reference Wellings1998) was that while the intrusions of the DCDC were deformed syn-magmatically by D2, the outer margins of the larger intrusions were deformed by D3. It was argued by the latter author that the change from D2 to D3 deformation occurred during cooling of the DCDC, such that the later stages of cooling of these bodies must have overlapped with the onset of D3 deformation. The smaller bodies of the DCDC, such as those at Lough Fee, were considered to have cooled more rapidly and thus did not record the later deformation phase. On the basis of the observations described above, Wellings (Reference Wellings1998) carried out thermal modelling and proposed a maximum time gap of 0.5 Ma between the end of D2 and the beginning of D3 deformation in Connemara. Our new data do not permit constraints to be placed to this level of precision, but the difference in age (not considering uncertainties) between the U–Pb concordia ages in samples LF-12-02 and DC-12-02 suggest high-temperature metamorphism associated with the larger Dawros intrusion could have persisted after that associated with the Lough Fee intrusion.
The U–Pb concordia ages presented here for magmatic growth of zircon in the DCDC thermal aureole overlap with the range of ages reported by Friedrich et al. (Reference Friedrich, Bowring, Martin and Hodges1999 a; 475–463 Ma), lending support to their assertions of coevality between the Grampian Orogeny in Connemara and the Taconic Orogeny in Newfoundland/New England Appalachians, as well as postdating Tremadocian–early Arenigian island arc volcanism, the latter represented by the rocks of the South Mayo Trough to the north (Fig. 1a). Although we cannot confirm emplacement of the DCDC as having occurred before the MGC with our new ages, the lower limits of uncertainty on the two concordia ages from Creggauns and Lough Fee do show that DCDC magma intrusion and associated contact metamorphism occurred before final cooling of the Connemara terrane (Fig. 8; 460–450 Ma; Friedrich et al. Reference Friedrich, Hodges, Bowring and Martin1999 b). The combined range of uncertainties on the two concordia ages presented here also allow a maximum duration of ˜11 Ma for magmatism and metamorphism (as defined by zircon growth) in the aureole of the DCDC. However, given the uncertainties on the ages presented here the actual duration was probably much shorter, and targeting these and similar materials with high precision U–Pb techniques (e.g. TIMS) would likely be a constructive avenue for future research. In conclusion, in addition to lending further weight to the mutually supportive conclusions of Wellings (Reference Wellings1998) and Friedrich et al. (Reference Friedrich, Bowring, Martin and Hodges1999 a), our new data serve to highlight that locally (ultra)high-grades of metamorphism associated with Grampian magmatism in northern Connemara were likely to have been relatively short-lived.
A comparison of the new zircon ages reported in this study (red symbols) with those from Friedrich et al. (Reference Friedrich, Bowring, Martin and Hodges1999 a,b). Sample labels as follows: CUR – mafic pegmatite from Currywongaun; C-LW – gabbro from the Cashel-Lough Wheelaun intrusion of the MGC; G-PEG – granite pegmatite from the MGC; QTZ-D – quartz-diorite gneiss/migmatite from the MGC; MET-P – metapelite from the MGC; Di-1–3 – metasomatic diopside-bearing marbles, Central Connemara; Ought – Oughterard Granite.

Supplementary material
To view supplementary material for this article, please visit https://doi.org/10.1017/S0016756821000649
Acknowledgements
Peter Greatbatch and Dave Wilde (Keele University) are gratefully acknowledged for excellent thin-section production. Patricia Clay is thanked for assistance with the electron microprobe. B.O’D acknowledges support from Natural Environment Research Council (NERC) New Investigator grant NE/J00457X/1 and Standard Grant NE/L004011/1. D.C. acknowledges past and present support from Science Foundation Ireland through research grants 12/IP/1663, 13/RC/2092 and 13/RC/2092_P2 (iCRAG Research Centre), and 15/IA/3024. iCRAG is funded under the SFI Research Centres Programme and is co-funded under the European Regional Development Fund. Trond Slagstad and Rob Strachan are thanked for their helpful reviews, as is Sarah Sherlock for editorial handling.


 Open access