


Crude vegetable edible oils are produced by compression or solvent extraction of soybean, cottonseed, sesame, coconut, olive, safflower, sunflower, corn, rapeseed, mustard seed, peanut and palm oils. They are processed by both chemical and physical refining techniques (Mounts, Reference Mounts1981; Zschau, Reference Zschau1999). The conventional chemical techniques consist of acid degumming, alkali refining, bleaching, deodorization and winterization stages (Rich, Reference Rich1964; Almeida et al., Reference Almeida, Carvalho, de Souza Soares, Valadares, Mendonça, Silva and Monteiro2019; Hew et al., Reference Hew, Asis, Tan, Yusoff, Lai, Nehdi and Tan2020).
In addition to organic pigments such as chlorophyll, carotenoids and related compounds, other impurities such as soaps, sulfur, phosphates, trace metal cations and their decomposition products are removed from the alkali-refined oils by adsorption and ion exchange through bleaching (Falaras et al., Reference Falaras, Kovanis, Lezou and Seiragakis1999; Taxiarchou & Douni, Reference Taxiarchou and Douni2014; Saneei et al., Reference Saneei, Goli and Keramat2015; Awad et al., Reference Awad, Shaikh, Jalab, Gulied, Nasser, Benamor and Adham2019). Previous studies on the kinetics of the bleaching of vegetable oils (Brimberg, Reference Brimberg1982) showed that the catalytic effect of the bleaching earth (BE) causes lengthy chemisorbed β-carotene molecules to immediately decompose to form shorter molecules. As this decomposition causes a colour change from white to grey-blue, the bleaching power (BP) is more conveniently measured by the adsorption of chlorophyll rather than β-carotene. In addition to the carbonaceous materials (Omar et al., Reference Omar, Girgis and Taha2003), a variety of raw and modified clays such as attapulgite (Huang et al., Reference Huang, Liu, Liu and Wang2007), sepiolite (Tian et al., Reference Tian, Wang, Kang and Wang2014; Laatikainen et al., Reference Laatikainen, Srithammavut, Toukonitty, Turunen and Sainio2015) and bentonite (Komadel, Reference Komadel2003; Noyan et al., Reference Noyan, Önal and Sarıkaya2007) have also been used for the bleaching of various edible and mineral oils. In general, raw and acid-activated clays are called ‘Fuller's earths’ and ‘bleaching earths’, respectively (Zschau, Reference Zschau1985; Sohling et al., Reference Sohling, Ruf, Schurz, Emmerich, Steudel and Schuhmann2009; Emmerich et al., Reference Emmerich, Steudel, Schuhmann, Weidler, Ruf and Sohling2010; Liang et al., Reference Liang, Yang, Su and Xue2020). Such adsorbents are also used in other processes such as the clarification of wine, beer and fruit juice, as well as in the removal of contaminants from wastewater (Bombos et al., Reference Bombos, Ganea, Matei, Mawnescu, Bodnarev and Mihai2014; Silva et al., Reference Silva, Sampaio, Ceriani, Verhé, Stevens, Greyt and Meirelles2014; Zhu et al., Reference Zhu, Chen, Zhou, Xi, Zhu and He2016; Uddin, Reference Uddin2017).
Bleaching earths are produced through the acid activation of calcium bentonites (Önal & Sarıkaya, Reference Önal and Sarıkaya2007; Komadel, Reference Komadel2016) after treatment with hydrochloric acid or sulfuric acid (H2SO4). Smectites such as montmorillonite, saponite, hectorite, nontronite and beidellite are the major clay minerals of bentonites (Bergaya et al., Reference Bergaya, Theng and Lagaly2006), which also include other clay and non-clay minerals as impurities (Moore & Reynolds, Reference Moore and Reynolds1997, Sohling et al., Reference Sohling, Ruf, Schurz, Emmerich, Steudel and Schuhmann2009; Steudel et al., Reference Steudel, Mehl and Emmerich2013). The mineralogical and physicochemical characteristics of bentonites and other clays vary significantly depending on the acid as well as alkali treatments (Pentrák et al., Reference Pentrák, Madejová and Komadel2009; Mache et al., Reference Mache, Signing, Mbey, Razafitianamaharavo, Njopwouo and Fagel2015).
Although Rich (Reference Rich1964) stated that the oil quality is the most important parameter impacting BP (compared to the clay type and the bleaching method), the physicochemical properties of clay minerals and their effect on BP have been investigated systematically. The role of changing the physicochemical properties of acid-activated montmorillonite on its bleaching efficiency was studied by Falaras et al. (Reference Falaras, Kovanis, Lezou and Seiragakis1999), who showed that bleaching efficiency increases with increasing acidity and specific surface area, where medium activation of montmorillonite is the most efficient way to bleach cottonseed oil, producing the best colour index and lowest peroxide value. Falaras et al. (Reference Falaras, Lezou, Seiragakis and Petrakis2000) investigated the physical and chemical properties of pillared materials to understand their effects on bleaching efficiency in the processing of cottonseed oil and concluded that the Al-pillared acid-activated material was comparable to Tonsil® Optimum Bleaching Earth (TOBE). Because every clay sample has slightly different mineralogical and geochemical properties, bleaching powder that is produced through acid activation of the clay may result in variation in adsorption properties such as porosity, specific surface area and pore-size distribution.
Na-rich bentonites (NaBs) and Ca-rich bentonites (CaBs) are clays that contain Na-smectite (Na-Sme) or Ca-smectite (Ca-Sme) as major clay minerals (Mache et al., Reference Mache, Signing, Mbey, Razafitianamaharavo, Njopwouo and Fagel2015; Koutsopoulou et al., Reference Koutsopoulou, Christidis and Marantos2016). Pure smectites are rarely found in the Earth's crust, and they are separated from the bentonites. Bentonites can be activated by various treatments. Acid activation affects the pH and porosity of the bentonites. The void volumes in the solid particles with internal widths of <2, 2–50 and >50 nm are called micropores, mesopores and macropores, respectively (Rouquerol et al., Reference Rouquerol, Rouquerol, Sing, Llewellyn and Maurin2014). The BP of an acid-activated powder for a vegetable oil changes depending on pore volume (V), specific surface area (S) and pore width (D) (Önal & Sarıkaya, Reference Önal and Sarıkaya2012).
Previous studies revealed that the performance of BEs depends on the mineralogical and chemical composition of the raw bentonite selected, the type and amount of the inorganic acid, the temperature and contact time for the activation process, as well as the type and composition of the impurities in the vegetable oil (Christidis et al., Reference Christidis, Scott and Dunham1997; Falaras et al., Reference Falaras, Kovanis, Lezou and Seiragakis1999, Reference Falaras, Lezou, Seiragakis and Petrakis2000, Özgüven et al., Reference Özgüven, Pekdemir, Önal and Sarıkaya2020). However, these studies did not investigate systematically the individual and combined effects of activation parameters (mass fraction of inorganic acid, temperature or contact time). The goal of this study was to evaluate systematically the optimum conditions for the H2SO4 activation of a Turkish bentonite to produce a powder with the maximum BP for soybean oil by analysing the individual and combined effects of activation variables, including mass fraction of H2SO4 (x) per dried CaB and pure H2SO4 mixture, heating temperature (T) and contact time (t), as well as their relationship with S, V and D.
Materials and methods
Materials
A white CaB, obtained from the Çamlıdere, Ankara (Turkey) deposit, was used as the starting material after grinding to pass through a 0.074 mm (200 mesh) sieve and drying at 105°C for 4 h. The bulk chemical composition of the dried CaB (mass%) is SiO2: 72.1, Al2O3: 14.8, Fe2O3: 0.8, MgO: 1.6, CaO: 2.2, Na2O: 0.4, K2O: 1.1, TiO2: 0.1 and loss on ignition (LOI): 7.0. The cation-exchange capacity (CEC) estimated based on the methylene blue method was 0.78 eq. kg–1 (Kipling & Wilson, Reference Kipling and Wilson1960; Hang & Brindley, Reference Hang and Brindley1970; Rytwo et al., Reference Rytwo, Serban, Nir and Margulies1991; Kahr & Madson, Reference Kahr and Madson1995). The H2SO4 (98% by mass, 1.98 g cm–3) used in this process was of analytical grade. Lithium tetraborate (LiB4O7) for digestion was supplied by Merck. Alkali-refined soybean oil was supplied by a vegetable oil plant located in Marsa, İstanbul. TOBE was procured from Süd Chemie (Germany).
Acid activation
Twenty-three samples, each with a mass of 20 g, were weighed from the dried CaB powder and activated with H2SO4 using the dry method. The homogeneous muds prepared with the specific amounts of CaB, H2SO4 and distilled water were heated at various temperatures. The mass fraction of H2SO4 (x) in the dry CaB and pure H2SO4 mixture of the first eight muds varied between 0 and 0.70. The amounts of water and H2SO4 in the 30 mL solution used for the preparation of the muds were calculated and are given in Table 1. Each mixture was heated at 100°C for 2 h. Based on the first measurements, the highest BP was observed at the 0.35 mass fraction of H2SO4. Therefore, the mass fraction of H2SO4 in all time and temperature series experiments was set to 0.35. Next, for the temperature series experiments, a set of seven muds with x = 0.35 were heated for 2 h at temperatures ranging from 25°C to 250°C. An activation time of 2 h was selected based on the optimum BP attained at various total structural metal oxides. Finally, for the time series experiments, the last seven muds having x = 0.35 were heated at 100°C, with time increasing from 0 to 20 h. After activation, each sample was suspended in water and the solid residue was separated by centrifugation. Each residue was washed repeatedly with distilled water until the wash water was free of SO42– against BaCl2 solution. The BEs obtained were dried at 105°C for 4 h, ground so that they would pass through a 0.074 mm (200 mesh) sieve and kept in tightly closed plastic bottles. A total of 23 different BEs were prepared.
The amounts of H2SO4 and water in the mud samples prepared using 20 g of bentonite. The effect of activation temperature was tested at 2 h and x(H2SO4) = 0.35 based on the optimum BP attained at various total structural metal oxides y(RxOy), as shown in Fig. 3. An activation temperature of 100°C, x(H2SO4) = 0.35 and y(RxOy) = 0.10 were selected to test the various activation times according to the largest BP value observed in Fig. 4.
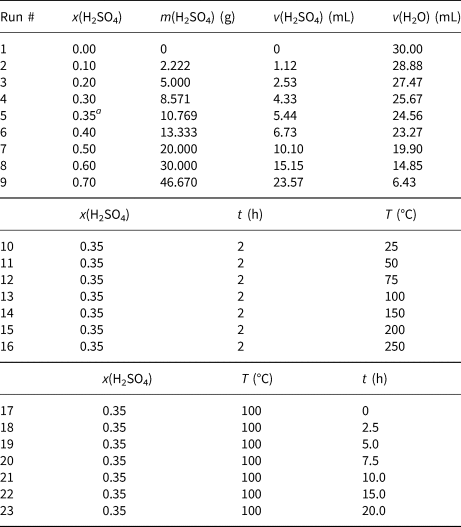
a This specific x(H2SO4) concentration of 0.35 is selected for the next set of time and temperature series experiments based on highest BP observed in Fig. 2 (black dashed line).
Analytical procedures
The pH value for each aqueous suspension having a BE content of 2% by mass was measured using an Orion Star A211 pH-Meter. The X-ray diffraction (XRD) traces for the raw CaB and acid-activated samples were recorded from mounts prepared using the glass slide method and run through a Rikagu D-max 2200 Diffractometer with a Ni filter and Cu-Kα radiation with a wavelength of 0.15418 nm (Moore & Reynolds, Reference Moore and Reynolds1997). For chemical analyses, ~0.25 g of dried sample was weighed into a platinum crucible, mixed with 3 g LiB4O7, fused at 1000°C for 1 h and cooled to room temperature. Then, the crucible was placed in a beaker containing 1000 mL of 10% HCl and heated to 90°C under stirring to dissolve the fused clays. The mass fractions of undissolved Al2O3, Fe2O3 and MgO in the CaB after the activation of the first nine samples were determined using atomic absorption spectrophotometry (AAS) with a Hitachi Z-8200 device. The results were given as the mass% of the metal oxides. The N2 adsorption/desorption data at 77 K for all of the activated samples were obtained at high vacuum using a volumetric adsorption instrument with a Pyrex glass connection (Noyan et al., Reference Noyan, Önal and Sarıkaya2007). Before measurement, each sample was outgassed at 150°C for 4 h under vacuum (10–3 mmHg). The S and V values of the raw and acid-activated samples were calculated from the adsorption and desorption data, respectively (Rouquerol et al., Reference Rouquerol, Rouquerol, Sing, Llewellyn and Maurin2014). The D parameter of the mesopores assumed to be cylindrical was calculated from the following expression (Önal & Sarıkaya, Reference Önal and Sarıkaya2012; Rouquerol et al., Reference Rouquerol, Rouquerol, Sing, Llewellyn and Maurin2014):

Bleaching experiments were carried out in an open 400 mL flask containing 2% by mass BE suspension in alkali-refined soybean oil. Each suspension was heated at 105°C for 15 min using the activated samples (Noyan et al., Reference Noyan, Önal and Sarıkaya2007). The oil was then filtered through Whatman No. 41 filter paper. The colour index of the oil in red-yellow units was determined using a Lovibond Automatic Tintometer (Type D) equipped with a 2.54 cm cell according to the American Oil Chemists' Society (AOCS) Official Method (Taylor et al., Reference Taylor, Jenkins and Ungermann1989). The BP value for each sample was calculated from the expression

where R 0 and R are the red colour units on Lovibond scale of the alkali-refined oil prior to and after bleaching, respectively.
Results and discussion
The XRD traces (Fig. 1a) revealed that the raw bentonite contained Ca-Sme, illite (Ilt), a kaolin group mineral (Kn), orthoclase (Or), quartz (Qz), opal-CT (Opl-CT) and probably some opal-A (Opl-A). The abbreviation symbols are after Warr (Reference Warr2020). As the major clay mineral was Ca-Sme, the raw material is CaB. Ilt and Kn are the minor clay minerals, whereas Or, Qz, Opl-CT and Opl-A are non-clay impurities. The basal spacing (d 001) values for the Ca-Sme, Ilt and Kn are 1.52, 1.00 and 0.72 nm, respectively. The XRD traces (Fig. 1) showed that the Ca-Sme and Ilt particles decomposed completely through acid activation at x = 0.35, but Kn, Or, Qz, Opl-CT and Opl-A were still observed.
XRD traces of (a) raw bentonite and (b, c) two representative activated samples.

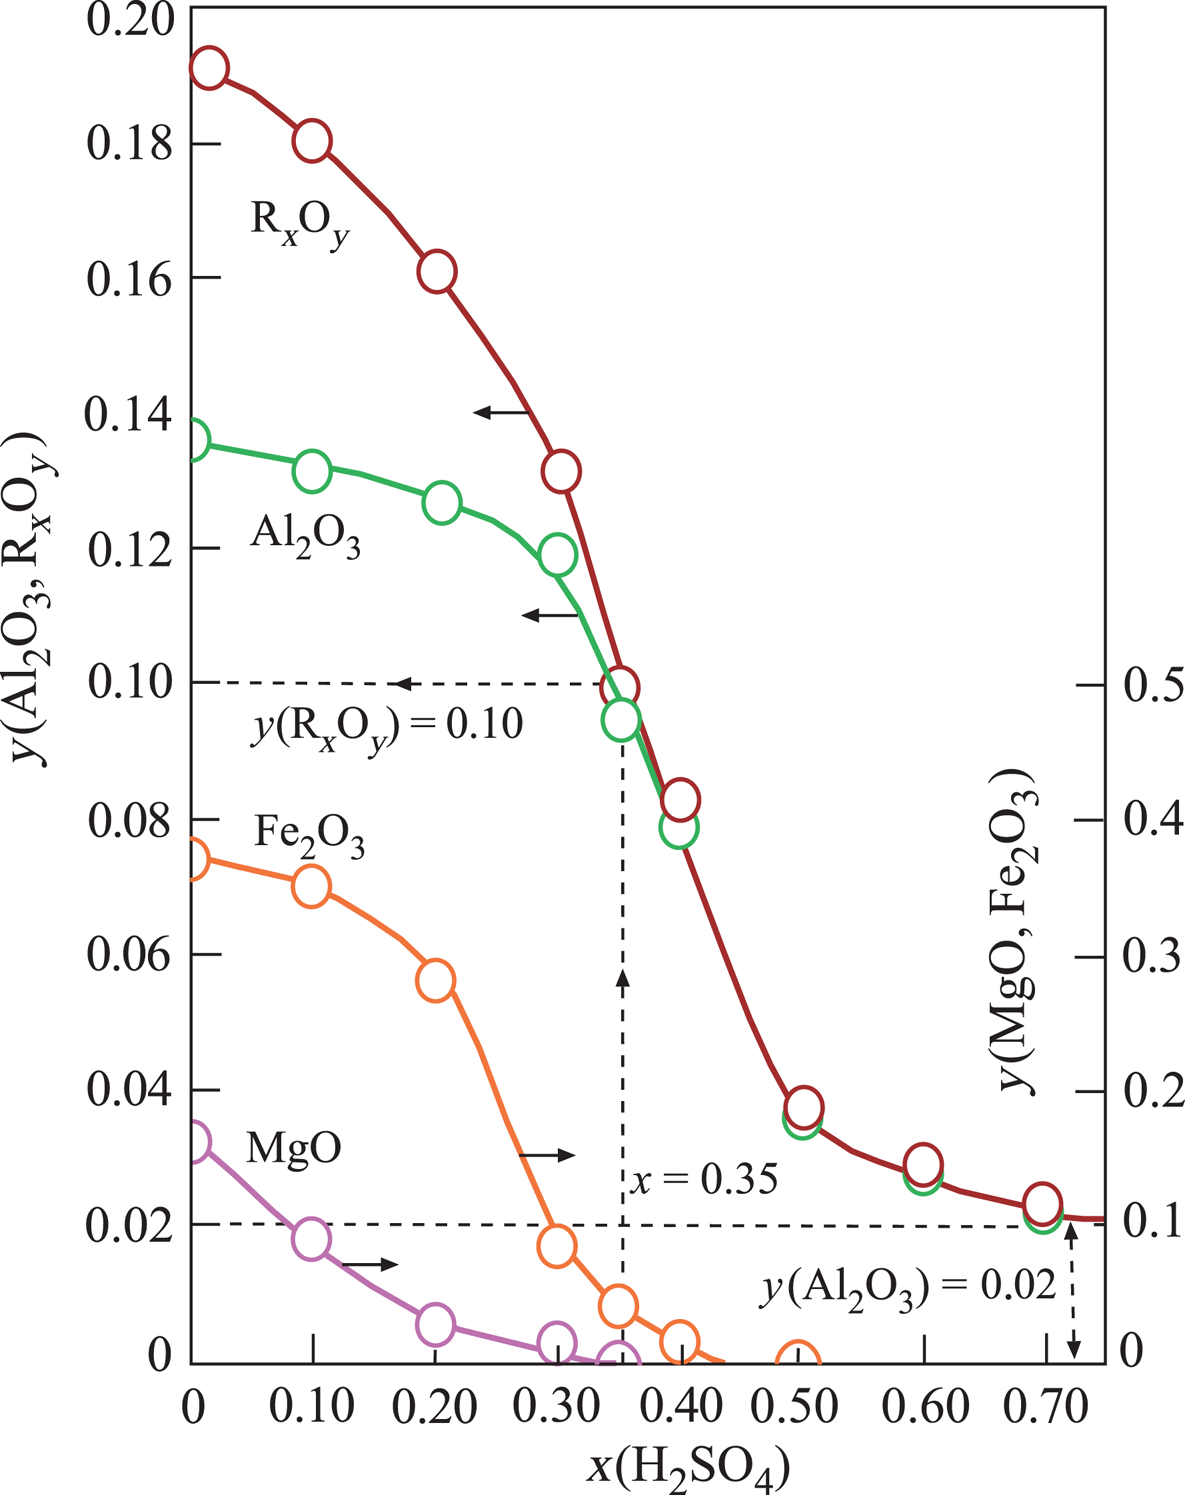
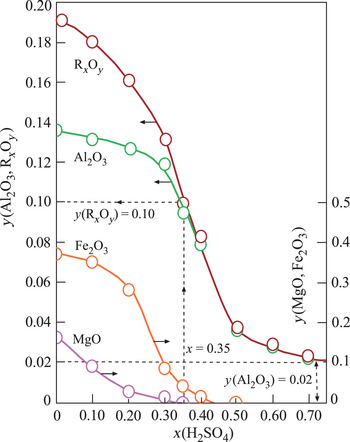
The structural cations Al3+, Fe3+ and Mg2+ of Ca-Sme and Ilt dissolved during the H2SO4 activation. The mass fraction (y) of the corresponding metal oxides Al2O3, Fe2O3 and MgO and their sum, RxOy, decreased curvilinearly with increasing x in the prepared muds (Fig. 2). Dissolution ceased at x = 0.70. The remaining Al2O3 was probably present in undissolved Kn and Or impurities. These results are in agreement with Falaras et al. (Reference Falaras, Kovanis, Lezou and Seiragakis1999), who also observed a decrease in the octahedral oxides (Al2O3, MgO, Fe2O3) due to dissolution of cations, including Al3+, Mg2+ and Fe2+, during the acid activation of Ca-montmorillonite in the bleaching of cottonseed oil. Furthermore, Falaras et al. (Reference Falaras, Kovanis, Lezou and Seiragakis1999) observed an increase in the specific surface area and acidity with decreasing pH (3.05) during acid activation, which is in agreement with the present study, suggesting a correlation between specific surface area, acidity and pH. In a similar work, Mache et al. (Reference Mache, Signing, Mbey, Razafitianamaharavo, Njopwouo and Fagel2015) showed that Al, Mg and Fe were leached from the octahedral and tetrahedral sheets of Ca-Sme, while the SiO4 groups of the tetrahedral sheets remained intact. Partial leaching of octahedral cations was correlated with the decrease in the MgO, Fe2O3 and Al2O3 contents during the acid activation of smectitic clays. Finally, Saneei et al. (Reference Saneei, Goli and Keramat2015) focused on the optimization of acid activation parameters during the bleaching of sepiolite and observed a similar decrease in structural cations and reduction in pH.
Change in the mass fraction (y) of the structural metal oxides (Al2O3, Fe2O3, MgO) and their totals (RxOy) retained in the Ca-Sme depending on the mass fraction (x) of H2SO4, based on the dried CaB and pure acid mixtures.
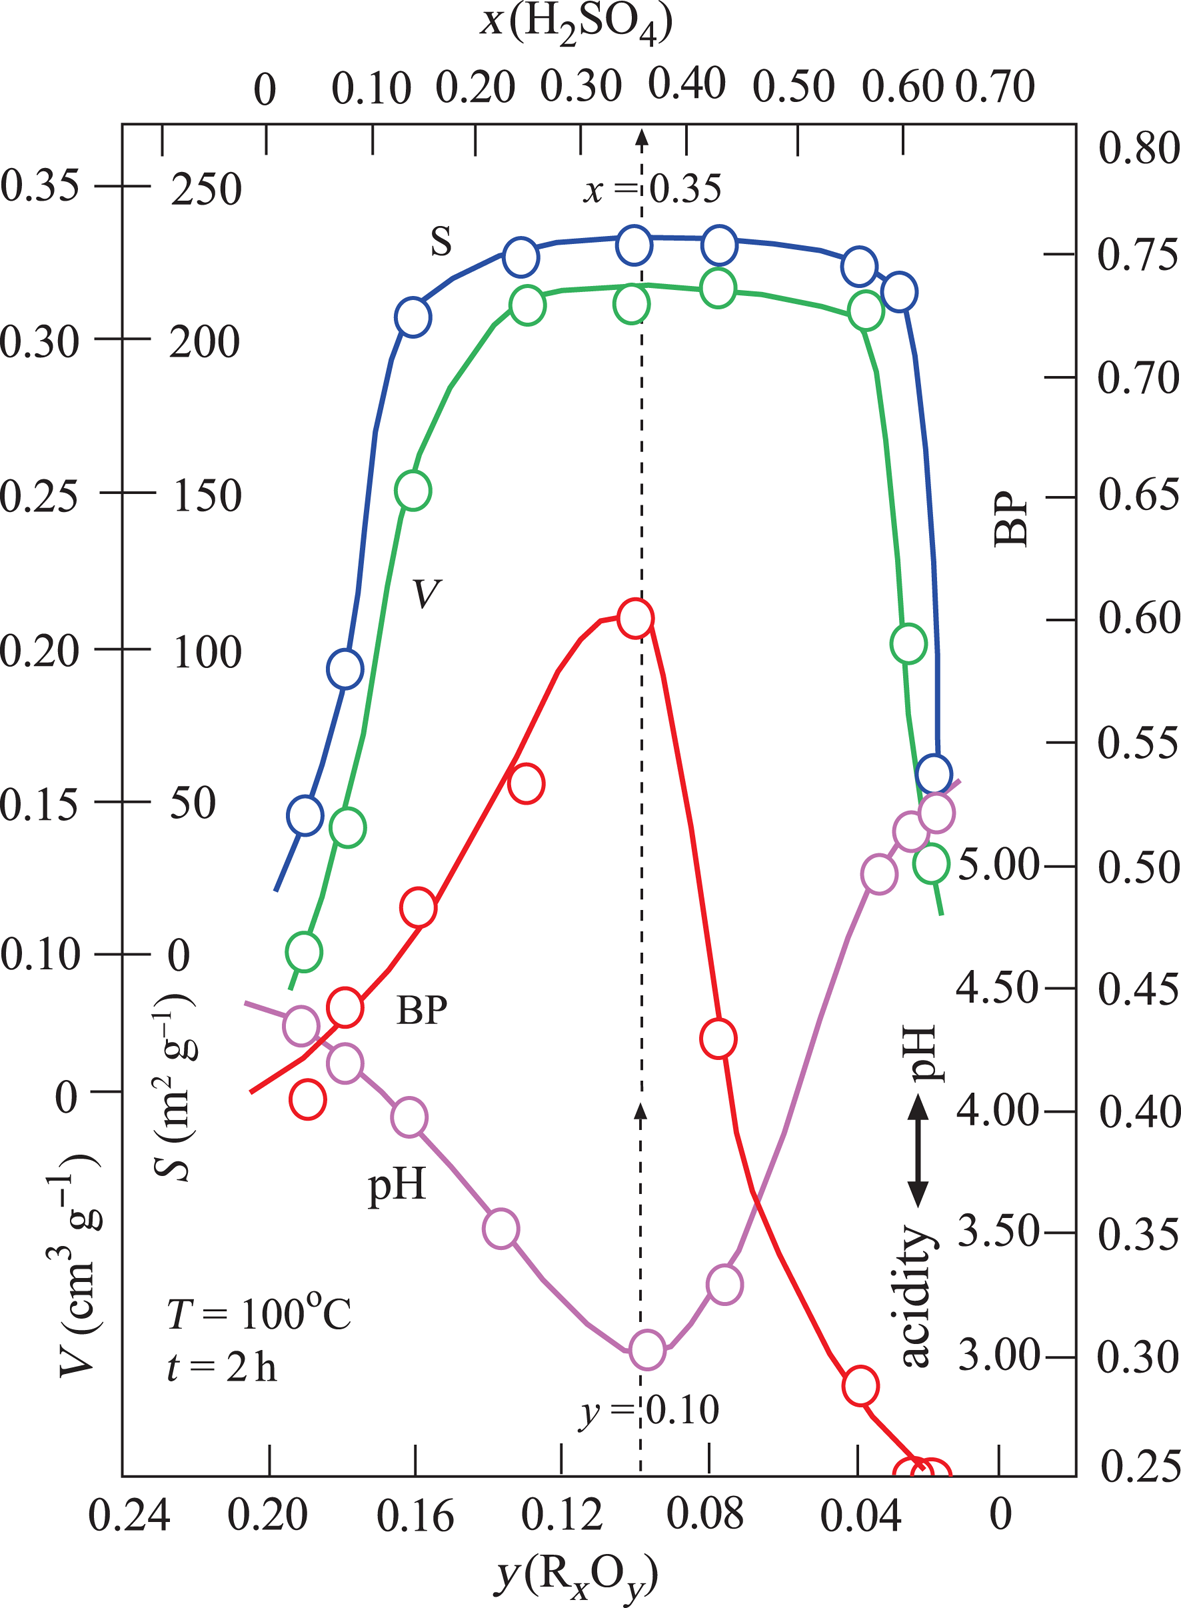
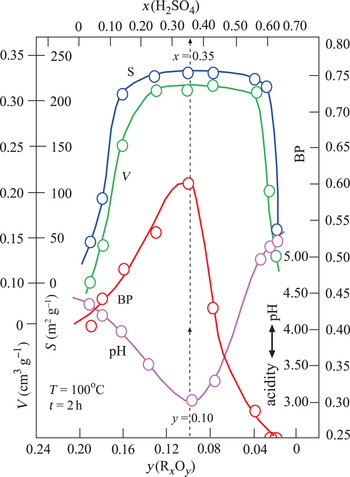
Changes in the V, S, pH and BP parameters were dependent on the x and y variables defined above (Fig. 3). The broad maxima of V and S are in the ranges 0.20 < x < 0.60 and 0.04 < y < 0.16. By contrast, the pH and BP values show a sharp minimum and a sharp maximum, respectively, for the same intervals. Their extreme values are pH = 3.0 and BP = 0.60 at x = 0.35 and y = 0.10 values. In addition, TOBE has an identical BP with the optimum BE that is used in the present study. Therefore, the acid-activation conditions for preparing the most suitable BEs are x = 0.35, T = 100°C and t = 2 h (Fig. 3). Other investigated physicochemical properties of this sample were y = 0.10, V = 0.31 cm3 g–1 and S = 225 m2 g–1. Consequently, the BP was observed to be more dependent on the pH (acidity) than the V and S values. Our results are in partial disagreement with the work of Falaras et al. (Reference Falaras, Lezou, Seiragakis and Petrakis2000) in terms of the BP of TOBE because Falaras et al. demonstrated that pillared, acid-activated montmorillonites have greater bleaching efficiency compared to the pillared products of the untreated clay. Therefore, the Al-pillared, acid-activated montmorillonite reached the same BP as TOBE. In the present study, we only reached a similar BP as TOBE for acid-activated CaB without Al pillaring. The conclusions of Falaras et al. (Reference Falaras, Lezou, Seiragakis and Petrakis2000) on the increases in surface area, pore volume and acidity and decrease in octahedral sheet oxides during acid activation are in accord with our results when a similar treatment was applied to CaB.
Variation in V, S, BP and pH depending on the mass fractions of x(H2SO4) and y(RxOy).
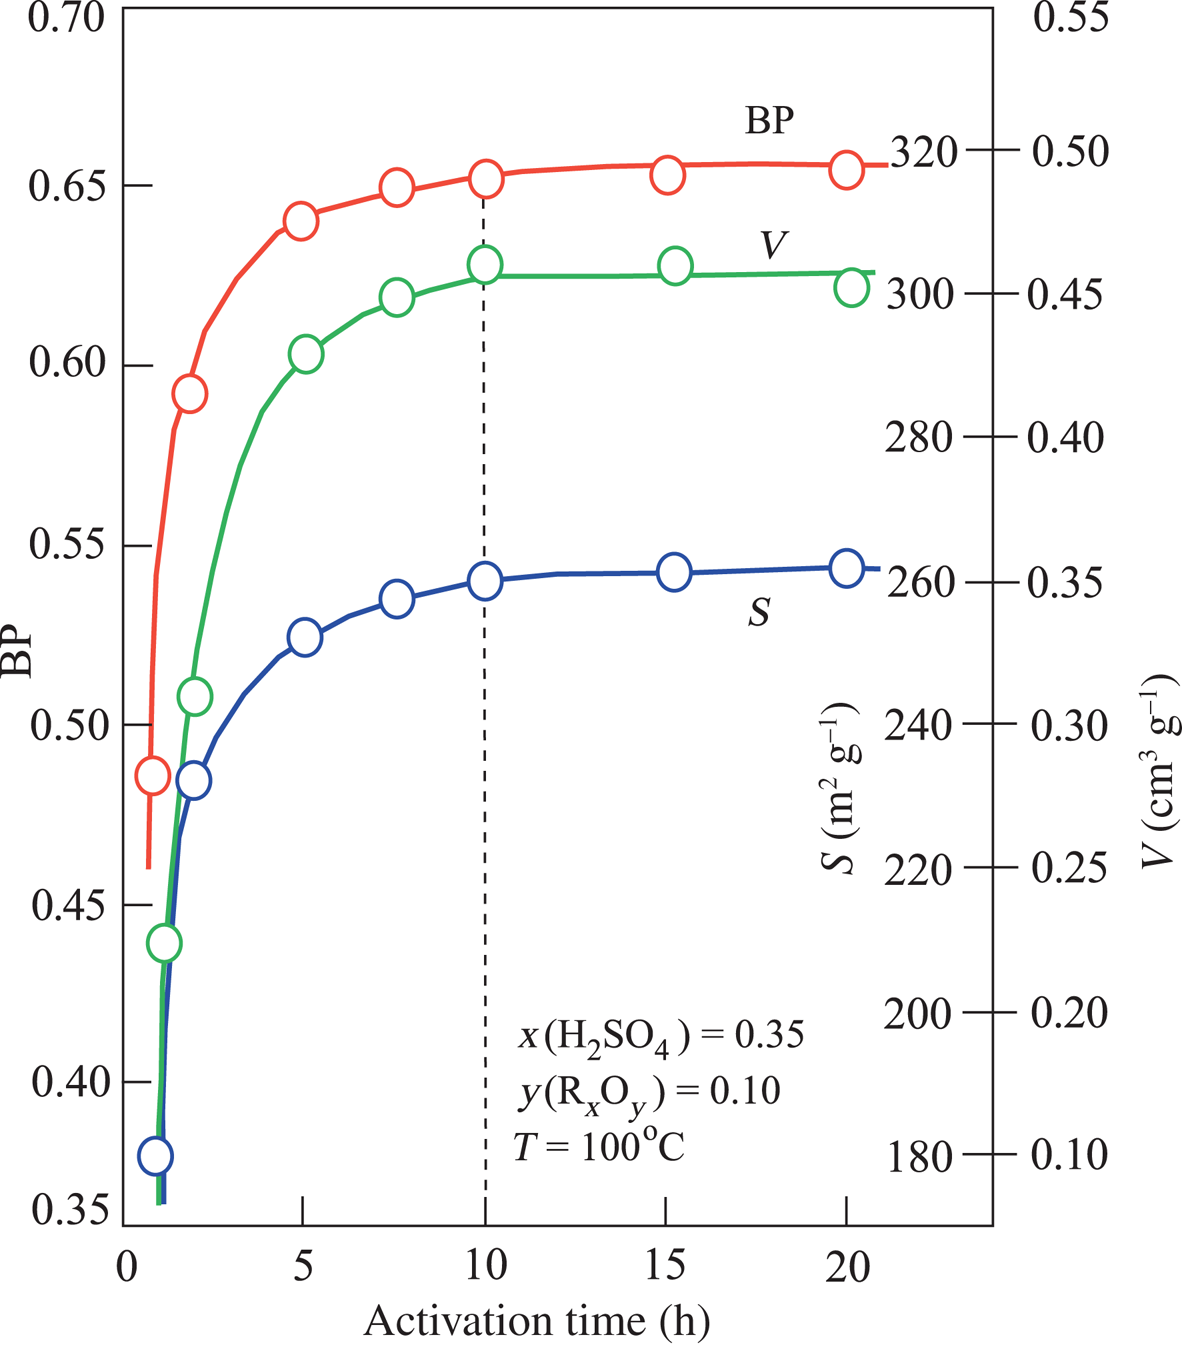
The V, S and BP values did not change with further increases in T after reaching the optimum activation conditions (Fig. 4). Based on these results, the optimum acid-activation temperature was specified as 100°C. In contrast, the V, S and BP values increased with increasing t until they reached a plateau after 10 h of treatment (Fig. 5). Even though increasing the acid-activation time from 2 to 10 h caused an increase of V = 0.46 cm3 g–1, S = 260 m2 g–1 and BP = 0.65, 10 h of heating for the activation of mud is probably not economic given the modest improvement in performance.
Variation in V, S and BP depending on the process temperature in experiments conducted for 2 h at the constant value of x(H2SO4) = 0.35 and corresponding y(RxOy) = 0.10.

Variation in V, S and BP depending on the process time in experiments conducted at 100°C at the constant value of x(H2SO4) = 0.35 and corresponding y(RxOy) = 0.10.
Variation in BP with the mean internal width (D) of the pores, which was calculated depending on the V and S values for all activated samples from the relationship of D = 4V/S using SI units.
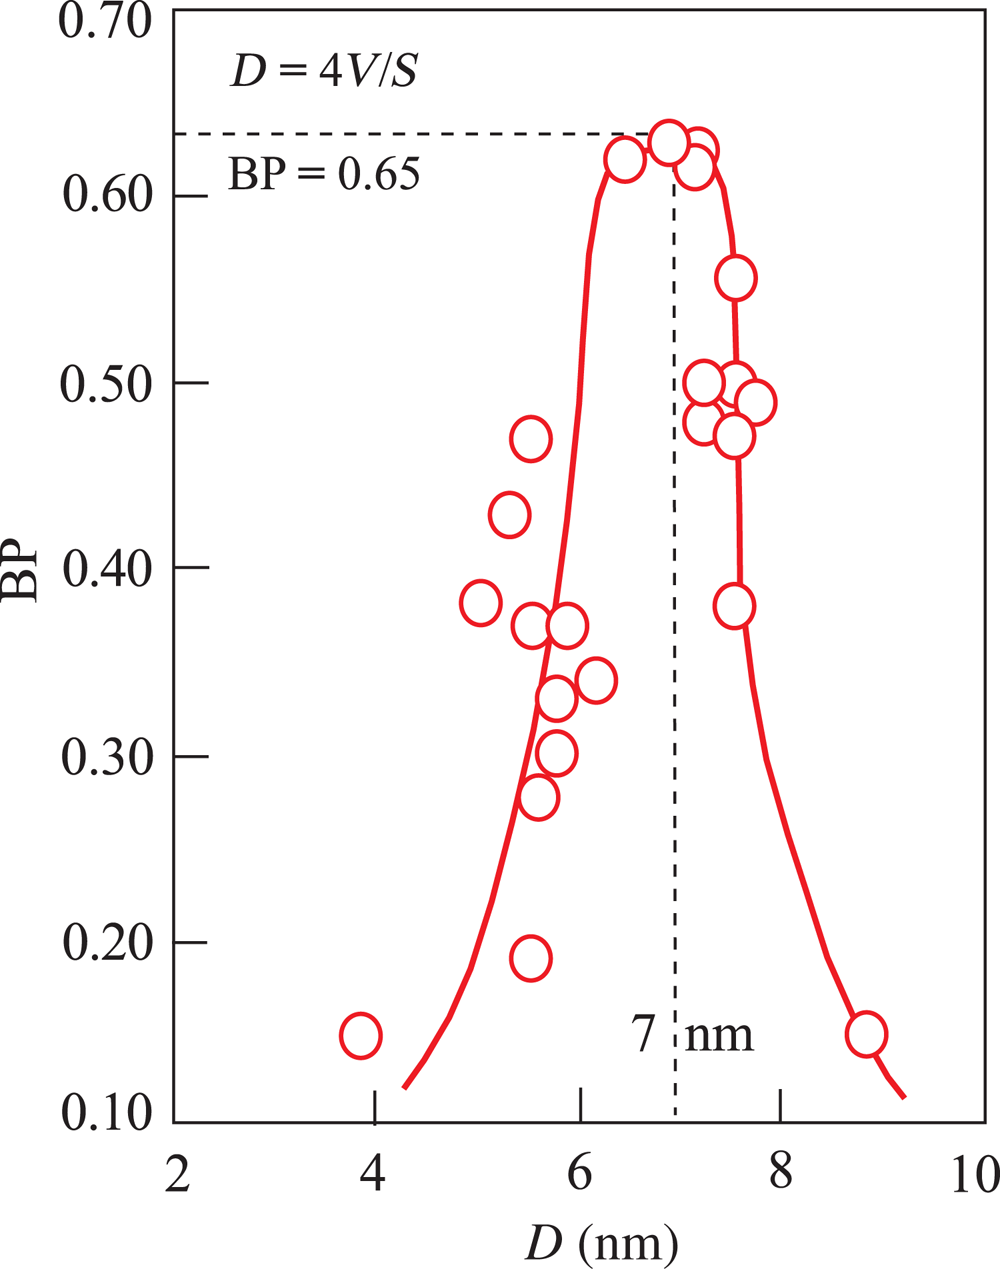
The mean mesopore size for each acid-activated sample was calculated from Equation 1. The variation of the BP as a function of D indicates that the effective bleaching mesopore sizes range from 4 to 9 nm. The optimum D value against the maximum BP is 7 nm (Fig. 6). Consequently, in addition to pH, D is more impactful on the bleaching of vegetable oils compared to the V and S values of the BE. Huang et al. (Reference Huang, Liu, Liu and Wang2007) investigated the impacts of pore-size distributions and specific surface areas of three attapulgite samples on the bleaching of soybean oil and suggested that the most effective pore size for the best BP is 0.8–3.2 nm. The similarity of the pore size of attapulgite to the diameter of the pigments enhanced the BP by enabling the rapid removal of these pigments. Even though various BEs were used in this study and that of Huang et al. (Reference Huang, Liu, Liu and Wang2007), the conclusion of Huang et al. regarding the importance of compatibility between the BE and pigments on the BP is in accordance with the present work.
The adsorption of coloured pigments onto the BE depends not only on the physicochemical interactions between large organic molecules and the BE surface, but also on the acidity and mesopore size. The compatibility in size between the pigments and internal widths of the mesopores in the BE is the most important parameter that controls the BP.
Conclusions
Various BEs were produced using H2SO4 activation of a CaB under varying mass fractions of H2SO4, heating temperature and contact time in an attempt to bleach an alkali-refined oil. The main conclusions are as follows:
(1) The 2:1 clay minerals such as montmorillonite and Ilt decomposed completely after treatment with an adequate amount of H2SO4. In contrast, the 1:1 kaolin group clay mineral Or as well as Qz, Opl-CT, and Opl-A were less affected by the activation.
(2) Activation results in a non-linear decrease in the Al2O3, Fe2O3 and MgO of the clays with increasing mass fraction of H2SO4. To fully constrain this relationship, the direction and the equilibrium state of the reaction between the octahedral ions and the amount of acid should be investigated in future studies.
(3) The micropore and mesopore volumes, specific surface area and BP of the BEs reach their maximum values when the mass percentage of H2SO4 and the mass percentage of undissolved metal oxide reach specific values. These maxima not only depend on the temperature of the activation, but also increase with increasing time when other variables are kept constant.
(4) The most effective internal width of the mesopores is 7 nm.
(5) The optimum conditions for the production of the most effective BE for an alkali-refined vegetable oil depends on the type and ratio of the raw bentonite and H2SO4, as well as the temperature and duration of activation.
(6) To obtain more comprehensive results, the optimum parameters need to be determined individually for each raw bentonite and edible oil pair.
Acknowledgements
The authors thank the reviewers and S. Kaufhold for their detailed and constructive comments that improved the quality and clarity of the paper. The authors are also grateful to G. Christidis for the editorial handling of this manuscript.
Financial support
This research was supported by Ankara University Scientific Research Projects Coordination Unit (19L0430007).


 Open access