

Introduction
Since the 1990s, induced earthquakes have been recorded in the Groningen field, located in the northern Netherlands. To date, more than 1000 M>1 events have been recorded, with the largest event a M w 3.6 in August 2012. Despite the relatively small magnitude of these earthquakes, seismicity in the Groningen field has led to substantial damage to surface infrastructure and housing, with several homes being declared uninhabitable. For future exploitation of the field it is important to study the source mechanisms and controlling parameters of the induced seismicity, so that likely trends in magnitude, stress drop and location may be incorporated in seismic hazard analyses, and potential mitigation strategies can be designed. Here we discuss the past observations and likely mechanisms of depletion-induced seismicity, and we present a method to model the source mechanics of depletion-induced earthquakes, combining static geomechanical modelling of the depletion-induced stress changes in a gas reservoir with fully dynamic modelling of the seismic rupture. We incorporate cohesion as a result of fault healing in the fault strength model. The geomechanical model is applied to a typical fault with a small offset in the northern parts of the Groningen field. We show how incorporating the fault offset in the geomechanical model leads to enhanced stresses on the fault, earlier nucleation of a seismic event and a reduced seismic rupture length. Additionally, most seismic energy remains in the reservoir formation or is radiated downwards, due to the unidirectional (downwards) propagating rupture and velocity contrasts between formations.
Occurrences of depletion-induced seismicity
Induced seismicity occurring in (the vicinity of) hydrocarbon fields is not a new phenomenon. In the early 20th century several large, damaging earthquakes may have been related to hydrocarbon production in California (Hough & Page, Reference Hough and Page2016). The extremely shallow depth and the proximity to the Inglewood gas field suggest a likely causative link to hydrocarbon production and the Inglewood M w 5 event in 1920. Other events identified by Hough & Page (Reference Hough and Page2016) likely associated with hydrocarbon production include several events near the Santa Fe Springs oil field (1923, M~3.5; 1929, M w 5 Whittier event), and felt shocks in the Long Beach and Richfield oil fields, as well as felt events and surface rupture reported in 1926 for the Goose Creek oil field in the USA (Pratt & Johnson, Reference Pratt and Johnson1926). Throughout subsequent decades, numerous cases of hydrocarbon-depletion-induced seismic events were reported in the literature, up to M>4. Notable instances include a series of M<4 near the Wilmington oil field in California (Kovach, Reference Kovach1974; Yerkes & Castle, Reference Yerkes and Castle1976), seismicity near a number of oil and gas fields in Texas (Pennington et al., Reference Pennington, Davis, Carlson, DuPree and Ewing1986; Doser et al., Reference Doser, Baker and Mason1991), a number of fields in Russia, Uzbekistan and Turkmenistan (Kouznetsov et al., Reference Kouznetsov, Sidorov, Katz and Chilingarian1995), and the Lacq gas field (M>4) in southern France (Grasso & Wittlinger, Reference Grasso and Wittlinger1990). The first seismic event in the Netherlands was recorded by the Royal Netherlands Meteorologial Institute (KNMI) in 1986. Since then, seismicity has been recorded in more than 30 Dutch gas fields (Van Thienen-Visser et al., Reference Van Thienen-Visser, Nepveu and Hettelaat2012; KNMI, 2015), with the Groningen field producing by far the most events. Felt seismicity is also occurring in several German gas fields, which are part of the same hydrocarbon basin (Leydecker, Reference Leydecker2003). There are a few cases where very large events occurred at depths 10–20km below the reservoir. In 1976 and 1984 several M s~7 events were recorded below the Gazli gas field in Uzbekistan, in a region previously observed to be aseismic (Eyidogan et al., Reference Eyidogan, Nábělek and Toksöz1985; Plotnikova et al., Reference Plotnikova, Nurtaev, Grasso, Matasova, Bossu, Knoll and Kowalle1996). A number of M>5 earthquakes occurred below oil fields in California, possibly induced by stress changes related to the hydrocarbon mass removal from the fields (Segall, Reference Segall1985). In both cases stress changes at these long distances from the reservoir are expected to be small, e.g. for the Coalinga field in California the net stress change on the fault may have been 0.05MPa (Segall, Reference Segall1985), a fraction of the coseismic stress drop.
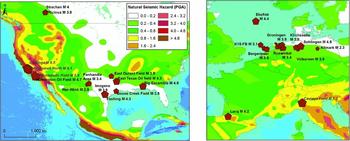
The locations and magnitudes of depletion-induced events reported in the literature to date are summarised in Figure 1. Most depletion-induced events occurred in sedimentary basins, which generally have a low natural seismicity rate.
Instances of depletion-induced seismicity reported in the literature, plotted on a map showing the natural seismic hazard in peak ground acceleration (PGA, ms−2) with 10% chance of exceedance in 50 years (Giardini et al., Reference Giardini, Grünthal, Shedlock and Zhang1999). The legend is the same for both figures. Fields with grey labels have been associated with significant seismicity far below the reservoir.
Mechanisms of depletion-induced seismicity
When a porous rock formation is depleted, the pore pressure declines, which causes compaction and stress changes within the reservoir formation and in the surroundings. This is known as poro-elastic stressing. These stress changes act on, and can potentially reactivate, pre-existing faults (pre-existing planes of weakness) that are ubiquitous throughout the earth's crust. Stress changes occur:
-
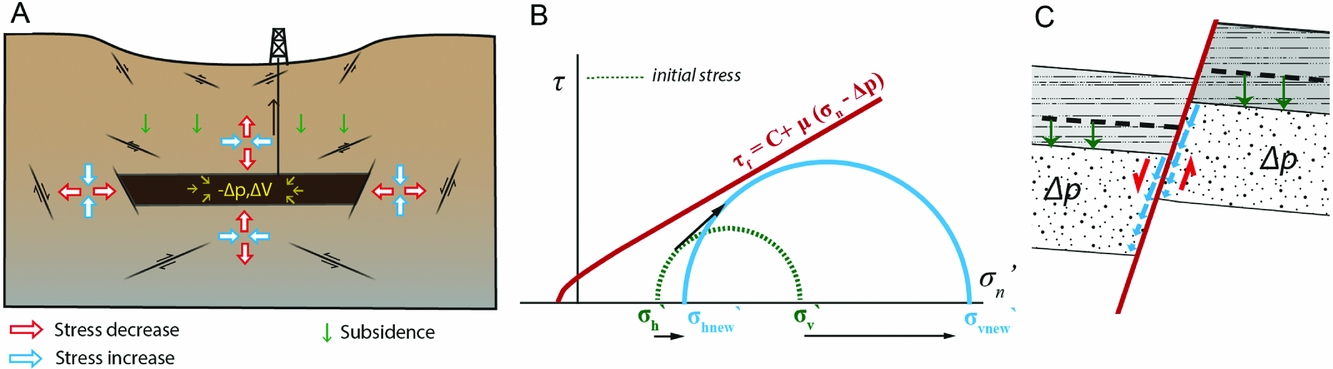
i. inside the reservoir. As the pore pressure decreases, the effective vertical stress is increasing (i.e. becomes more compressive) and the volume of the reservoir rock is decreasing. Vertically, compaction of the reservoir rock is mostly accommodated through subsurface deformation and ground subsidence. The total vertical stress change above a laterally extensive reservoir is therefore nearly zero. This means that the effective vertical stress increase is equal to the pore pressure decrease (Δσ vʹ=−Δp). Horizontally, however, the reservoir is coupled to the rock volume outside of it; hence the volume change will lead to a reduction in total horizontal stress and a smaller increase in the effective horizontal stress (Δσ hʹ=−Δpν/(1−ν)). As a result, the differential stress in the reservoir increases. This may bring faults within the reservoir closer to failure depending on the Poisson's ratio, which is one of the factors that influence the magnitude of Δσ hʹ (Fig. 2A,B): the lower the Poisson's ratio, the steeper the reservoir stress path and larger the potential for depletion-induced fault reactivation (e.g. Hettema et al., Reference Hettema, Schutjens, Verboom and Gussinklo2000; Van den Bogert, Reference Van den Bogert2015).
-
ii. outside the reservoir. Due to elastic coupling between the reservoir and the surrounding rock, the stresses around the reservoir will also be perturbed. The volume reduction of the reservoir rock in the horizontal direction also leads to a decrease in total horizontal stress beside the reservoir, and stress transfer from the shrinking reservoir (stress arching) to the surroundings increases the vertical stress on the sides just beyond the reservoir, both promoting normal faulting to the sides of the reservoir. Directly above the reservoir the lateral shrinking of the reservoir may cause increased horizontal stresses and decreased vertical stresses, promoting thrust or reverse faulting (Fig. 2A). An additional effect may be elastic unloading below the reservoir due to the removal of mass (Segall, Reference Segall1985).
(A) Illustration of poro-elastic stress changes and promoted faulting mechanisms outside of a depleting reservoir (redrawn after Segall et al., 1998). (B) Effective stress development inside a laterally extensive depleting reservoir undergoing uniaxial compaction, shown for an unstable stress path (arrow). The initial stress state is shown by green dashed semicircle, and the state in depleted reservoir by a blue semicircle. (C) Sketch of differential compaction across a fault.
For simple reservoir geometries (e.g. discs, rectangular reservoirs) the poro-elastic stress changes mentioned above can be calculated analytically (Geertsma, Reference Geertsma1973; Segall, Reference Segall1989; Segall et al., Reference Segall, Grasso and Mossop1994). However, hydrocarbon fields are often structurally complex, folded and faulted. To analyse the depletion-induced stress changes in complex structural settings, more complex (numerical) modelling is required. Studies analysing differential compaction of reservoir compartments separated by a fault (compaction on both sides of the fault is not equal, causing relative slip motions of opposite sign across the fault; Fig. 2C) showed that significant stress concentrations developed along that fault, in particular when offset along the fault was present (Roest & Kuilman, Reference Roest and Kuilman1994; Nagelhout & Roest, Reference Nagelhout and Roest1997; Mulders, Reference Mulders2003; Orlic & Wassing, Reference Orlic and Wassing2013; Van den Bogert, Reference Van den Bogert2015). Hence the effect of fault geometry on stress development is thought to play an important role in generating the seismicity in the Groningen field.
Modelling of depletion-induced seismicity
Many of the earlier modelling studies on fault reactivation in compacting reservoirs mentioned in the previous section have used elasto-plastic fault behaviour, where, after the depletion-induced stresses have exceeded the Mohr–Coulomb failure criterion, sliding on the fault is accommodated with a constant friction coefficient. The slip on the fault and expansion of the area of slip can only be increased by further depletion-induced stressing.
In reality, the strength of the fault may drop (rapidly) after exceeding peak strength, causing increased stress transfer to neighbouring areas and expansion of the slipping zone. Depending on the fault-weakening parameters, the slip on the fault can accelerate and grow outside of the nucleation area without further depletion. During a rapid reduction in strength, seismic waves may be generated. A number of more recent studies have incorporated fault-weakening behavior to model (depletion-) induced slip on faults (Wassing et al., Reference Wassing, Van Wees and Fokker2014; Zbinden et al., Reference Zbinden, Rinaldi, Urpi and Wiemer2017). Here fault slip was calculated in a quasi-static manner, i.e. inertial effects are not taken into account and wave propagation is not modelled. In this study we model fault weakening and seismic slip in a fully dynamic calculation (Cappa & Rutqvist, Reference Cappa and Rutqvist2012; Buijze et al., Reference Buijze, Orlic and Wassing2015a,b). For wave propagation the fully dynamic calculation is always required, but for fault slip and the reactivated fault area a fully dynamic (computer-intensive) analysis may to a first order (~10%) be similar to fault slip modelled in a quasi-static (less intensive) analysis (Wassing et al., Reference Wassing, Buijze and Orlic2016). Further research into the differences between quasi-static and fully dynamic modelling of induced seismicity is ongoing. Here we computed fully dynamic rupture induced by depletion, and compared a model with an offset fault to a model without offset on the fault, showing the large effect of the presence of an offset on the stresses and rupture on the fault.
Field observations and model set-up
We use a 2D plane strain model approach and DIANA Finite Element (FE) software v10.1(DIANA, 2016) to simulate fault reactivation, nucleation and seismic slip on a normal fault cross-cutting seven stratigraphic formations corresponding to the Rotliegend reservoir and over- and underburden. The model is similar to the model for depletion-induced seismicity presented in Buijze et al. (Reference Buijze, Orlic and Wassing2015a), but is more focused on the specific formations, fault geometries and field data from the Groningen field. Besides a more detailed lithology, the model uses different weakening parameters, focused on the cohesion rather than friction. In the following sections we present the model geometry and set-up and discuss the choice of input parameters on which the FE model was based.
Lithologies, fault geometries, and seismicity observed in the Groningen field
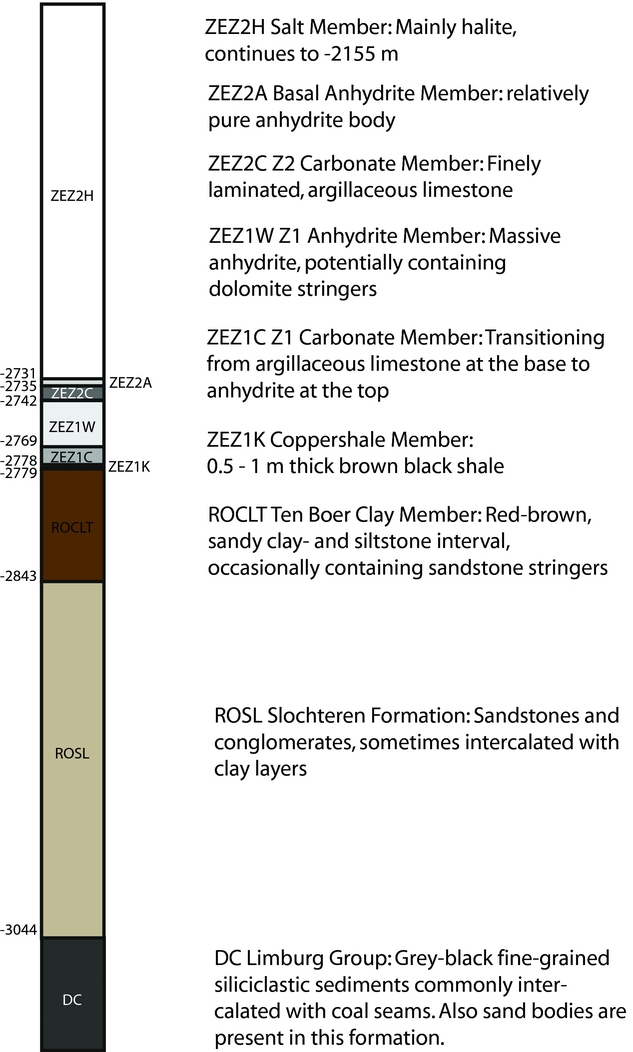
Figure 3 presents the stratigraphy of the reservoir formation and over- and underlying formations as encountered in the Stedum 01 well (SDM-01) (www.nlog.nl). In this well in the north of the Groningen field (Fig. 4A) a borehole array is currently monitoring induced seismicity; another borehole array was placed in the Zeerijp well. The main reservoir rock in the Groningen field is the Slochteren Formation, a sequence of fluvial and aeolian sandstones intercalated with silty claystones which belongs to the late Permian Upper Rotliegend Group. Towards the top also conglomerates and breccias are encountered. The thickness of the Slochteren in SDM-01 is 200m, but the thickness varies across the Groningen field from 100m in the south to ~250m in the north. In the Groningen field the Slochteren Formation is overlain by claystone of the Ten Boer Member of the Silverpit Formation, also belonging to the Upper Rotliegend Group, which contains sandstone streaks that may also be subjected to depletion. The thickness of the Ten Boer ranges from ~20m in the southeast to 80m in the northwest of the field; at the SDM-01 well it is 65m. The depth of the top of the Upper Rotliegend Group lies between 2600 and 3000m (Fig. 4A). The Ten Boer Member is overlain by the Upper Permian Zechstein Group. The base of the Zechstein Group consists of a 50m thick sequence of anhydrites and carbonates. The anhydrite–carbonate sequence is overlain by hundreds of metres of predominantly halite. The Slochteren reservoir unconformably overlies the Carboniferous Limburg Group which comprises siliciclastics intercalated with coal seams. The thickness of the Limburg Group below the Groningen field is 700 to over 1500m.
Stratigraphy in the northwestern part of the Groningen field, taken from the Stedum 1 (SDM-01) well (www.nlog.nl), with nomenclature and lithostratigraphic description from www.dino-loket.nl. See also Figure 4 for well location. Depths are in true vertical depth (m).
(A) Groningen field (black outline) coloured with depth of the top of the Rotliegend formation (www.nlog.nl). Faults imaged in the top of the Rotliegend are shown as the turquoise lines (www.nam.nl). Seismic events recorded by the KNMI since 1986 are shown by the red circles (www.knmi.nl, seismic catalogue retrieved 30 May 2017). The largest event (12 August 2012 Mw 3.6) is indicated by the white starred red circle, events with M 3.1–3.5 are indicated by the black starred red circle. (B) Faults in the Groningen field (grey) coloured by fault offset (www.nam.nl). Black squares indicate producing wells (including those with an imposed production cap), grey squares closed-in wells. The Stedum 1 (SDM-01) well and the Zeerijp 1 wells are labelled; at these wells borehole seismometers are in place at reservoir depth.
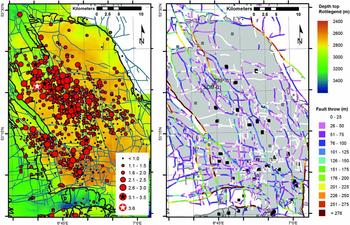
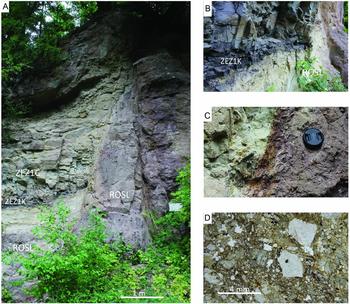
The Groningen field is characterised by faults of various orientations and dimensions such as length, vertical penetration and fault offset (Fig. 4). The fault dip is generally quite steep, between 65 and 90° (Wentinck, Reference Wentinck2015). Three main fault trends can be recognised: NNW–SSE, E–W and WNW–ESE. The NNW–SSE faults are the longest, and show the largest offset, with a maximum of 600m along the faults bounding the reservoir. Most major faults have offsets in the range 50–150m. Near the SDM-01 and ZRP-01, offsets vary from 25 to 250m. Also in the southwest some larger offsets were measured. The majority of the smaller E–W faults recognised from the seismic data have smaller offsets between 0 and 50m. Considering these offsets and the formation thicknesses, the top Slochteren sandstone may be juxtaposed against the Ten Boer Member and the (basal) Zechstein Group. Figure 5 presents a field example of a mesoscale fault (offset ~10m) in the Rotliegend and the Basal Zechstein Formation in the Harz Mountains in Germany. The Basal Zechstein is much thinner than observed in the Groningen field well logs, and the Ten Boer Member is absent here, but the photograph shows how the base of the Zechstein may be juxtaposed against Rotliegend sandstone by the fault offset. The fault from the outcrop was filled with cataclastic, quartz-rich material (Fig. 5D). The outcrop also shows that the transitions between formations may be very sharp (Fig. 5C).
(A) Normal fault with a ~10m offset in the upper Rotliegend (ROSL) Formation and base of the Zechstein Formation, Münden Quarry, Germany. The Coppershale Member (ZEZ1k) and the basal Zechstein carbonate sequence including ‘stinky dolomite’ are present (ZEZ1C) above the upper Rotliegend (note that the Ten Boer Member is not present at this locality). (B) Contact of (bleached) Rotliegend sandstone in the hanging wall with the overlying Coppershale Member. (C) Fault contact between bleached Rotliegend sandstone just below Rotliegend–Zechstein interface and the red Rotliegend sandstone in the footwall (right). (D) Micrograph of brecciated material in/very close to the fault surface.
The first seismicity in the Groningen field was recorded in 1991, more than 30 years after the start of production in 1959. Since then over 1000 events have been recorded, with the largest event a M w 3.6 in August 2012 (see Fig. 4B). Most seismicity occurred in the northwest part of the field, followed by the southwest (Fig. 4A); the southeast and northeast show significantly less (recordable) seismicity. For a detailed analysis of the seismicity through time, and the spatio-temporal relationship with production and compaction we refer the reader to e.g. Bourne et al. (Reference Bourne, Oates, Bommer, Dost, van Elk and Doornhof2015), Van Thienen-Visser (Reference Van Thienen-Visser, Pruiksma and Breunese2015) and Spetzler & Dost (Reference Spetzler and Dost2017).
Model geometry and elastic parameters
We based our geomechanical model on the stratigraphy as encountered in the northwestern parts of the field, summarising the SDM-01 litho-stratigraphy into seven model layers, by combining the ZEZ1K and ZEZ1C members into one layer (Fig. 6). The model dimensions are 4000m horizontally by 2000m vertically. The overburden above a depth of 2500m was not included in the model, to reduce the model size and computational time. Instead we applied a loading boundary condition to simulate the overburden weight. The model must be wide enough so that the influence of the boundary conditions does not significantly influence the calculated stress and induced deformation slip on the fault. A comparison of an 8000m wide model containing an offset fault to a 100000m wide model showed that the differences in stress after depletion between both models were no larger than 0.7% of the depletion pressure (Mulders, Reference Mulders2003). For the narrower model used in our study we expect stress differences on the order of 1% of the total depletion pressure. We evaluated the difference between extending the upper bound of the model to the free surface and simulating the overburden by applying a load boundary condition. We find the models with the load boundary to have 0.04MPa larger horizontal stress. Stress differences related to the model boundaries are relatively minor. Increasing the model size further would be at the cost of resolution on the fault, which would lead to poorer resolution of dynamic fault slip.
(A) Model geometry and central part of the finite element mesh in DIANA FEA. A 70° dipping fault offsets the stratigraphy (in this study, offset is 0 or 50m). The sides and base are supported by roller boundaries, and a top load is applied to simulate the overburden weight. (B) Mohr–Coulomb friction criterion for the interface elements modelling the fault, with a linear reduction in friction coefficient with inelastic shear displacement on the fault. (C) Mohr–Coulomb failure criterion for the interface elements modelling the fault with a linear reduction in cohesion C with inelastic shear displacement on the fault. Dc is the critical slip distance over which weakening occurs.
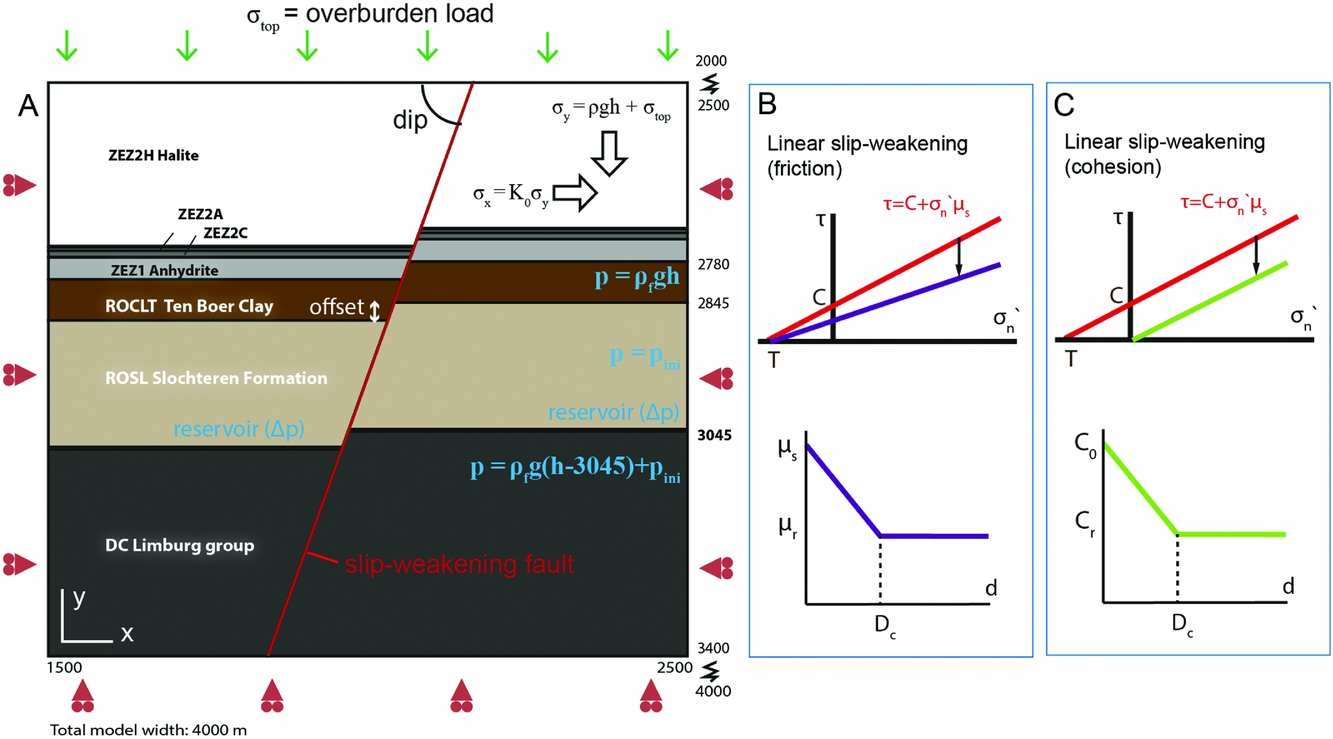
The formations were modelled with linear plane strain elements (i.e. assuming a very long reservoir in the out-of-plane direction), and the fault was modelled with interface elements for which we can specify elastic and fault frictional parameters (see ‘Fault friction and weakening through slip-dependent loss of cohesion’ below). To ensure good resolution, the element size along the fault was set to 1m, coarsening further away from the fault up to a size of 25m. Elastic parameters Young's modulus E and Poisson's ratio ν in the Slochteren Formation depend strongly on porosity. Here, for simplicity, we adopted a single value for E of 15GPa, a ν of 0.1 and a density of 2450kgm−3 consistent with a porosity of ~15–20% (Lele et al., Reference Lele, Garzon, Hsu, DeDontney, Searles and Sanz2015). The elastic parameters for the Slochteren and the other formations are summarised in Table 1. Note that the elastic parameters used here are static parameters; the acoustic Young's modulus retrieved from sonic logs may be twice as high (Wentinck, Reference Wentinck2015).
Input parameters for model formations. The depth is specified for the hanging wall of the offset fault.

A 70° dipping normal fault was included, cross-cutting the formations, in agreement with the commonly observed steep faults in the Groningen field. As mentioned in the introduction, the fault offset has a large effect on the stress development on that fault and in the reservoir. We chose a fault offset of 50m, within the range found near the SDM-01 well (see previous section). We compare the results to a 0m offset scenario to emphasise the differences.
Initial state of stress
The total vertical stress σ v is a function of the density and depth (σ v =ρgh); a gradient of 21–23MPakm−1 is common in the north of the Netherlands (van Eijs, Reference Van Eijs2015). In our model the vertical stress gradient was 22.4MPakm−1. The pre-depletion minimum horizontal stress is poorly constrained, since no minifrac tests were conducted in the Groningen field prior to the start of production, and mud loss data are unreliable (van Eijs, Reference Van Eijs2015). During production, two minifrac tests were performed in different wells at different depletion pressure (ΔP=15 and ΔP=20MPa). These measurements together with mud loss estimations from two other locations did not show a clear trend, making it difficult to constrain the virgin σ h or the evolution of σ h with depletion. We used an in situ total stress ratio K 0=σ h /σ v of 0.72 in the base-case model presented in this study, with an average σ h gradient of 16.1MPakm−1 in agreement with other modelling studies (TNO, 2013; Lele et al., Reference Lele, Garzon, Hsu, DeDontney, Searles and Sanz2015; Van den Bogert, Reference Van den Bogert2015). For the Zechstein overburden we assumed all shear stresses have relaxed over geological time due to creep of the halite and anhydrite, and used a K 0 of 0.9 for the anhydrites and carbonates and 1 for the halite. We have conducted a small number of sensitivity analyses for the K 0 ratio. An extensive sensitivity analysis is beyond the scope of this paper, but we suggest considering the sensitivity to the stress ratio K 0 in further analyses dealing with fault reactivation and seismicity in the Groningen reservoir, as was for example done in Buijze et al. (Reference Buijze, Orlic and Wassing2015a).
Initial pore pressure and pressure depletion
The initial reservoir pressure in the Slochteren Formation is 35MPa, which is overpressurised with respect to the hydrostatic pore pressure like many fields in the north of the Netherlands (Verweij et al., Reference Verweij, Simmelink, Underschultz and Witmans2012). For the overlying formations we imposed a hydrostatic pressure gradient, in the reservoir an initial uniform pressure p ini of 35MPa, and for the underburden also a hydrostatic gradient was imposed, but with an additional 5MPa created by the overpressure in the reservoir. History matching of the pressures in the field suggests most faults are not (fully) sealing, except those with very large offsets predominantly in the west and northwest (NAM, 2016). Hence for our 50m offset fault scenario we assumed the pressure in the Slochteren Formation decreases uniformly over the entire formation during depletion, with the fault elements bounding the reservoir exhibiting the same initial pressure and pressure decrease as the reservoir. The reservoir pressure and depletion pressure were also imposed in fault elements juxtaposing Slochteren against Limburg or Slochteren against Ten Boer. No depletion occurred in the Ten Boer and the underburden in the current model. The assumptions of pressure and pressure diffusion in the fault influence fault reactivation and slip; we will address this in the discussion.
Fault friction and weakening through slip-dependent loss of cohesion
The fault interface elements have a shear and normal stiffness which allow elastic deformation along the interface. Assuming the fault zone is thin, elastic displacements on the fault should be very small compared to deformation in the surrounding formations. To achieve this the stiffness should be as high as possible without inhibiting convergence in the model. Here we have set the interface stiffness to 10 times the shear modulus G of the surrounding formation; stiff enough to limit elastic deformation on the fault but not so stiff that the calculation becomes unstable. In addition to the fault stiffness, the shear strength τ f of a fault can be expressed by the Mohr–Coulomb criterion, which is governed by the cohesion C and the friction coefficient μ multiplied by the effective normal stress σ nʹ (Fig. 4B). The μ depends on the fault rock lithology; however, faults in the Rotliegend and surrounding formations are rarely cored. Outcrop studies and fracture analysis showed that fault cores in Rotliegend sandstone consist of cataclastic material, fault gouge and breccia (Ligtenberg et al., Reference Ligtenberg, Okkerman, De Keijzer, Grötsch and Gaupp2011; see also Fig. 6D). The studied fractures show evidence of cementation with anhydrite cement (Ligtenberg et al., Reference Ligtenberg, Okkerman, De Keijzer, Grötsch and Gaupp2011). Some research has also suggested that salt may have intruded the fault zones (BOA, 1993). Analogue models show how salt from the Zechstein Formation could intrude in dilatant brittle fractures created in the stiff basal anhydrites and carbonates, forming patches of salt along the fault (Urai et al., Reference Urai, Kettermann, Abe and Virgo2016). This is supported by finite difference models showing how creep of salt (in particular on offset faults) leads to a strong reduction in normal stress in the underlying formations (Wassing et al., Reference Wassing, Buijze and Orlic2017). In our model the stiff basal Zechstein rocks are underlain by 65m of Ten Boer clay, a more ductile rock type. It is uncertain whether dilatant fractures are likely to form in a fault through such a ductile formation, and whether salt could intrude. For the current study we have therefore assumed no salt intrusion has occurred and the fault zone in the reservoir was filled with cataclastic quartz-rich material.
The coefficient of friction μs of Rotliegend fault gouge in the in situ conditions was 0.6 (Hunfeld, Reference Hunfeld2015), in range with measurements on other quartz-rich fault gouges at normal stresses of ~25–35MPa, temperatures of 75–115°C and slow slip rates between 0.5 and 0.7 (Chester, Reference Chester1994; Tembe et al., Reference Tembe, Lockner and Wong2010; Samuelson & Spiers, Reference Samuelson and Spiers2012). The μ s of the Basal Zechstein, Ten Boer and Carboniferous under in situ conditions were 0.7, 0.4 and 0.4–0.5 respectively (Hunfeld, Reference Hunfeld2015). Hence for the fault within the Slochteren sandstone we use a μ s of 0.6, for the Limburg (Carboniferous) 0.5, for the fault within the Ten Boer 0.4 and within the basal Zechstein 0.7. Cohesion C is often ignored in studies of natural earthquake behaviour. However, at the relatively low normal stresses at the reservoir depth, cohesion may contribute significantly to fault strength. Experiments have shown that healing of fault gouge materials occurs under hydrothermal conditions, re-strengthening the gouge during the healing period (i.e. as cohesion increases, the failure line in Figure 6B and C would move up). When re-shearing the healed gouge, the strength gained in the healing period may also be lost (via unstable sliding); the longer the healing time, the greater the re-strengthening and the greater the stress drop after re-shearing (Muhuri et al., Reference Muhuri, Dewers, Scott and Reches2003; Yasuhara et al., Reference Yasuhara, Marone and Elsworth2005; Tenthorey & Cox, Reference Tenthorey and Cox2006). Under sufficiently long healing times the refracturing of healed gouge may be similar to fracturing of intact rock, e.g. analogous to fracturing an intact rock cylinder in a triaxial experiment (Reches, Reference Reches1999). On faults in Groningen, which have been inactive for a significant time, significant cementation and healing may have occurred and cohesion may thus not be zero. Quartz cementation in Permian sandstone faults was observed in reservoirs with a burial depth exceeding 2000m and is enhanced in small-grained cataclastic fault materials (Fisher et al., Reference Fisher, Knipe, Worden, Worden and Morad2000). We chose an intermediate value of C=3MPa for our base-case scenario, which is ~50% of the cohesion measured on intact porous sandstones (7–9MPa) from the nearby Ameland field (Hol et al., Reference Hol, van der Linden, Zuiderwijk, Marcelis and Coorn2015). For the clay-rich Ten Boer we assigned a lower cohesion of 1MPa (see Table 2 for an overview of fault friction and cohesion).
Input parameters for fault.

For the post-failure behaviour of the reactivated fault, a form of strength reduction must be prescribed. A sudden reduction in strength lies at the basis for the seismic behaviour that we observe; as the strength drops sufficiently fast, the fault starts sliding rapidly, driven by the elastic energy stored in the surrounding medium, and part of the energy related to the drop in strength is released in the form of seismic waves. Most rupture models use a slip (e.g. linear slip-weakening; Fig. 6B) or slip-rate and time dependent friction coefficient (rate-and-state friction) with zero cohesion. In the current model set-up the fault has cohesion due to fault healing. This cohesion must be (partly) lost upon reactivation, but very little research has been done on exactly how cohesion is removed with fault slip. Experiments show how the strength gained through healing (mostly cohesion) is removed over a certain amount of inelastic slip (e.g. Muhuri et al., Reference Muhuri, Dewers, Scott and Reches2003). Similar to the linear slip weakening friction we assumed cohesion dropped linearly from its initial value to its residual value (0 in this case) over a slip distance D c (Fig. 6C). Simultaneously, frictional weakening occurred on the fault. decreasing the friction with 0.05 from its initial value μs. The parameter D c and how it upscales is one of the major questions in earthquake science. Here we have chosen a D c of 5mm such that the fracture energy G related to the generation of new surface related to grain fracturing (1/2 (τ p − τ r) D c, where τ p–τ r=ΔC+Δμσ n) is ~105Jm−2. This is in agreement with G measured for earthquakes with slip of a few mm to a few cm (Nielsen et al., Reference Nielsen, Spagnuolo, Smith, Violay, Di Toro and Bistacchi2016), which is the slip typically measured in Groningen earthquakes (Kraaijpoel & Dost, Reference Kraaijpoel and Dost2013). We stress that the specific effects of cohesion (in combination with friction) on fault strength, fracturing and unstable sliding have barely been studied in the laboratory, and hence the input parameters are uncertain. However, the stress drop and fracture energy for the current weakening parameters roughly match the observations.
Model procedure and output parameters
The vertical stress is initialised by applying a gravitational load (overburden weight) to the model, so that σ v=ρgh. Part of the overburden weight is simulated by a constant load boundary condition at the top of the model, which is added to the gravitational load. The stress ratio K 0 (see Table 1 for K 0 of different formations) is then applied and equilibrium is calculated in the model (displacements computed to obtain equilibrium are removed after the equilibration). The stiffnesses of the formations were assumed constant during the initialisation phase to prevent the development of artificial stress concentrations at formation boundaries. After initialisation, the different elastic properties (Table 1) were assigned to the different formations. The pore pressures were prescribed in all formations, and the Slochteren Formation was then depleted uniformly over the entire reservoir volume. The changes in the effective and total stresses in and around the reservoir were then calculated in a nonlinear static analysis. These stress changes potentially reactivate the fault and cause (aseismic) sliding to occur on one or more elements. Once a patch of a critical size is slipping, instability occurs in the static model, signifying the onset of seismic slip; no further depletion is possible at that point without stress release. The concept of such a critical fault length (critical nucleation length) follows from the theory of linear weakening (Uenishi & Rice, Reference Uenishi and Rice2003). At that moment the analysis was switched from a static analysis to a fully dynamic time-dependent analysis including inertial effects, where the seismic slip event and the near-field wave propagation were computed (time step 0.1ms).
Both fault normal and shear stresses may be changing during depletion; to conveniently describe the net effect on the stability of the fault element the Shear Capacity Utilisation (SCU) is used:
 $$\begin{equation}
{\rm{SCU}} = \frac{{\rm{\tau }}}{{{{\rm{\tau }}_{{\rm{max}}}}}} = \frac{{\rm{\tau }}}{{C + ({\sigma _{\rm{n}}} - P)\mu }}
\end{equation}$$
$$\begin{equation}
{\rm{SCU}} = \frac{{\rm{\tau }}}{{{{\rm{\tau }}_{{\rm{max}}}}}} = \frac{{\rm{\tau }}}{{C + ({\sigma _{\rm{n}}} - P)\mu }}
\end{equation}$$
When the SCU is <1 the failure strength of the fault element has not yet been reached and the element is responding elastically; when it is 1 the fault element has reached the failure criterion and deforms (slips) plastically; when it is 0 no shear stress is present. Shear slip during seismic rupture d f denotes the relative displacement of the two formations adjacent to the fault with respect to each other. Similarly, the slip rate v f indicates the relative velocity at which the two adjacent formations move with respect to each other.
Results
Stress development on the 50m offset fault during depletion of the Slochteren Formation
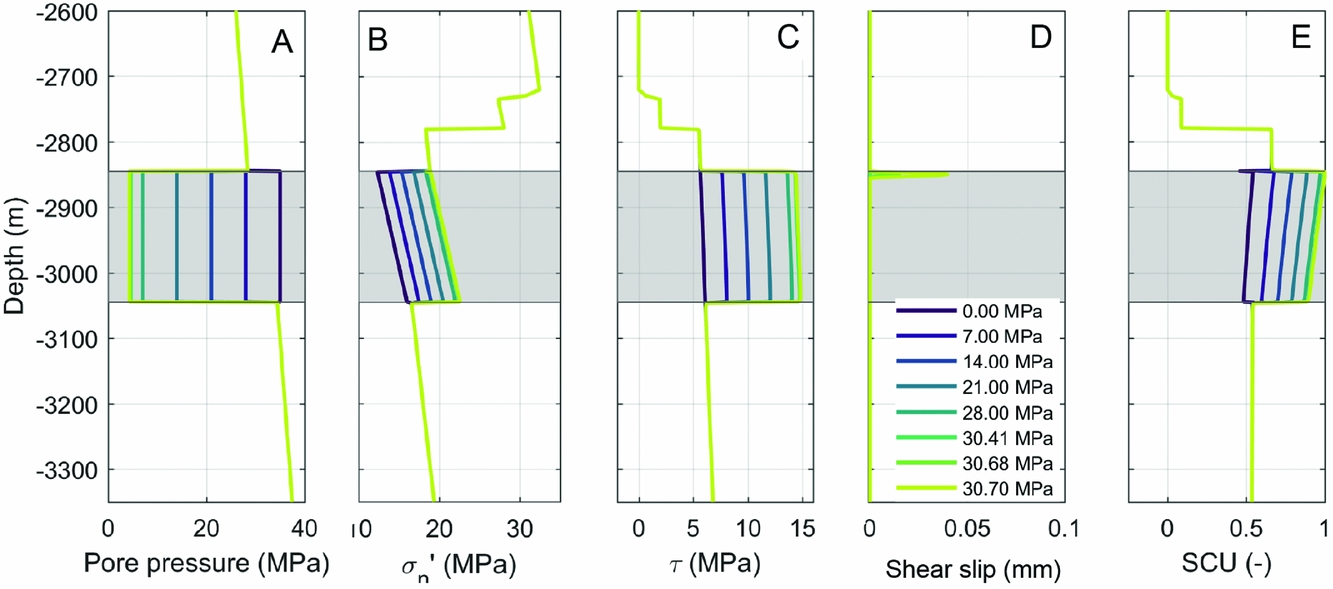
The stresses were initialised in the model according to the procedure described in the previous section. For the offset fault scenario, formations with different K 0 (e.g. 0.72 in the Ten Boer vs 1 in the Zechstein) were juxtaposed against each other across the fault. To obtain initial equilibrium, the K 0 near the fault deviated from the imposed K 0 value at the boundaries. This is evident in the irregularities in the initial stress field in the near-fault area in Figure 7B and C, and also in the heterogeneous initial normal and shear stresses on the fault (purple line in Fig. 8B and C). Small peaks in the initial stress can be observed near the formation boundaries (Fig. 8). In the Zechstein Formation at depths shallower than 2780m the normal stress was high and the shear stress is zero due to the imposed high stress ratio K 0 of 1. This also means the SCU (see equation 1) was also close to zero and the reactivation potential in the Zechstein was very low. Where Zechstein was juxtaposed against Ten Boer clay (2780–2845m), the σ n ʹ was still high (23MPa), but lower than for the Zechstein–Zechstein juxtapositions (30–32MPa). Where Ten Boer was juxtaposed against the reservoir (2845–2895m) σ nʹ is ~18–22MPa, which corresponded to a SCU of 0.5–0.6. The initial σ n ʹ in the reservoir was ~15MPa, and the initial shear stress τ was 6MPa, which places the reservoir at a SCU of 0.5. The SCU of the underburden was similar at 0.55.
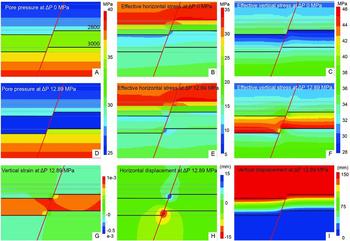
Model results of stresses, displacements and vertical strains in the formations in a zoomed-in region around the 50m offset fault. In the initial conditions (0MPa depletion): (A) pore pressure, (B) effective horizontal stress, (C) effective vertical stress. At 12.89MPa depletion, at the start of seismic instability: (D) pore pressure, (E) effective horizontal stress, (F) effective vertical stress, (G) vertical strain, (H) horizontal displacements, (I) vertical displacements. Stress units are in MPa, displacement units in mm.
On-fault data during depletion of the reservoir and initiation of aseismic slip. (A) Pressure in the reservoir. The pressure decrease ΔP is indicated by the different colours, with dark blue as the pre-depletion situation and yellow after ΔP 12.89MPa of depletion when seismic instability occurs. (B) Effective normal stress, (C) shear stress, (D) (aseismic) shear slip, (E) Shear Capacity Utilisation (0 = stable, 1 = sliding occurs). The depth interval of the footwall and the hanging wall of the Slochteren Formation is indicated by the grey areas on respectively the right and the left. The coloured lines indicate the amount of pressure decrease ΔP (see legend in (D)).

With depletion the reservoir compacted, causing stress changes within and outside of the reservoir (Fig. 7). After a depletion Δp of 12.89MPa, instability occurred in the model, indicating the onset of seismic slip. The effective horizontal stress σ hʹ within the reservoir had increased by ~2MPa, and the effective vertical stress σ vʹ increased by an amount equal to the pore pressure change (Δp 12.89MPa; Fig. 7D–F). The stress change was uniform up to 200 m from the offset fault; closer to the fault the stress state became different, because the fault does not yet accommodate any deformation (it is still locked). Stresses were relatively large near the top of the hanging wall and base of the footwall, and relatively small near the base of the hanging wall. Increased vertical strain builds up near the fault, in particular where Slochteren was juxtaposed against Slochteren (Fig. 7G). The overburden subsided with 0.14m, equal to the maximum compaction of the reservoir, and across the offset fault a gradient in vertical displacement formed (Fig. 7I).
Both the σ nʹ and τ increased with 5MPa with ongoing depletion in the reservoir depth interval (Fig. 8B,C). The net effect was a more critical state of stress on the fault in the reservoir interval as is shown by the high SCU of 0.8–1 at a Δp of 12.89MPa (Fig. 8E). The largest increase in SCU was observed at the top of the hanging wall and the base of the footwall; stress concentrations formed at the top of the hanging wall and base of the footwall, increasing nearly twice as much as in the reservoir centre. At the top of the Ten Boer overlying the hanging wall (2795–2845m) the SCU decreased. This fault segment was thus not the most critically loaded part under depletion conditions. Also, just below the reservoir (3045–3100m), the SCU decreased (because the shear stress decreases) so much that it almost became negative, which indicates a tendency to reverse faulting. Hence destabilisation occurred predominantly where reservoir was juxtaposed against reservoir. Reactivation first occurred at the top of the hanging wall at 10MPa depletion, and aseismic slip starts to occur (Fig. 8C). The aseismically slipping patch expands with continued depletion until the critical nucleation length is reached and instability occurs, signifying the onset of seismic rupture at 12.89MPa depletion. The maximum aseismic slip at that point was just below 2mm.
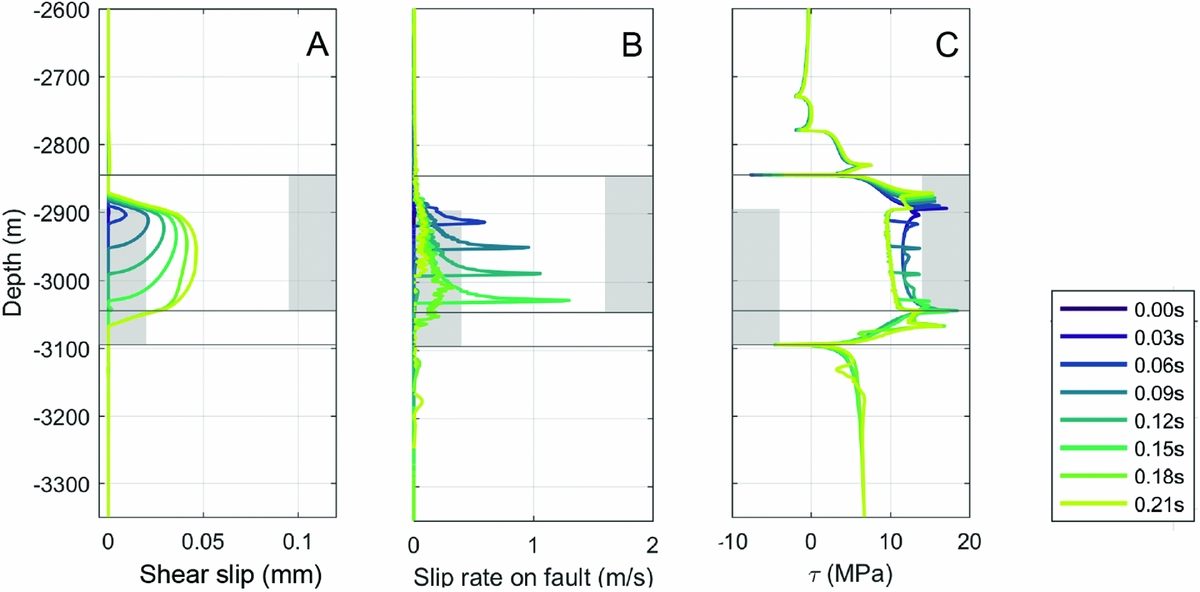
Seismic rupture on the offset fault
Slip on the fault started to accelerate from the nucleation site, the highly stressed zone at the top of the hanging wall at ~2895m depth. The expanding rupture propagated predominantly downwards into the reservoir (Fig. 9A). The seismic event propagated only ~20m into the overlying Ten Boer Member and was then arrested because it encountered the low shear stress in the Ten Boer that formed during depletion. Downwards propagation of the rupture front accelerated until 0.18s due to the favourable large shear stresses in the reservoir interval. The stress drop (difference in shear stress before and after the rupture) in the reservoir was ~2MPa (Fig. 9C). The largest slip rates occurred near the front of the downward-propagating rupture. Figure 9B and C show how the shear stress increases in front of the propagating rupture, bringing those parts of the fault closer to failure. Maximum slip rates of almost 1.3ms−1 were attained after 0.015s, achieving a maximum shear slip of 47mm in the reservoir. At 0.18s the downwards-propagating rupture was arrested at a depth of 3045m, at the base of the hanging wall. The shear stress on the fault below the reservoir was lowered during depletion, and during the rupture it was therefore too far from critical for the rupture to propagate. A lot of energy would be required to propagate further into this region, because the fault must first be brought to failure before it can slip. For larger dynamic cohesion and/or friction drops, events are more likely to propagate downwards. Alternatively, if the in situ shear stress was more critical, further propagation can occur (see further next section).
Seismic slip on the 50m offset fault (70° dip). (A) Relative shear slip along the fault; positive is in the downdip direction. (B) Slip rate on the fault. (C) Shear stress during dynamic rupture. The shear stress at t=0 is the shear stress developed during depletion of the reservoir (see also Fig. 8). Coloured lines indicate the time from the start of seismic rupture. The grey blocks to the sides indicate the depth interval of the hanging wall (left) and the footwall (right).

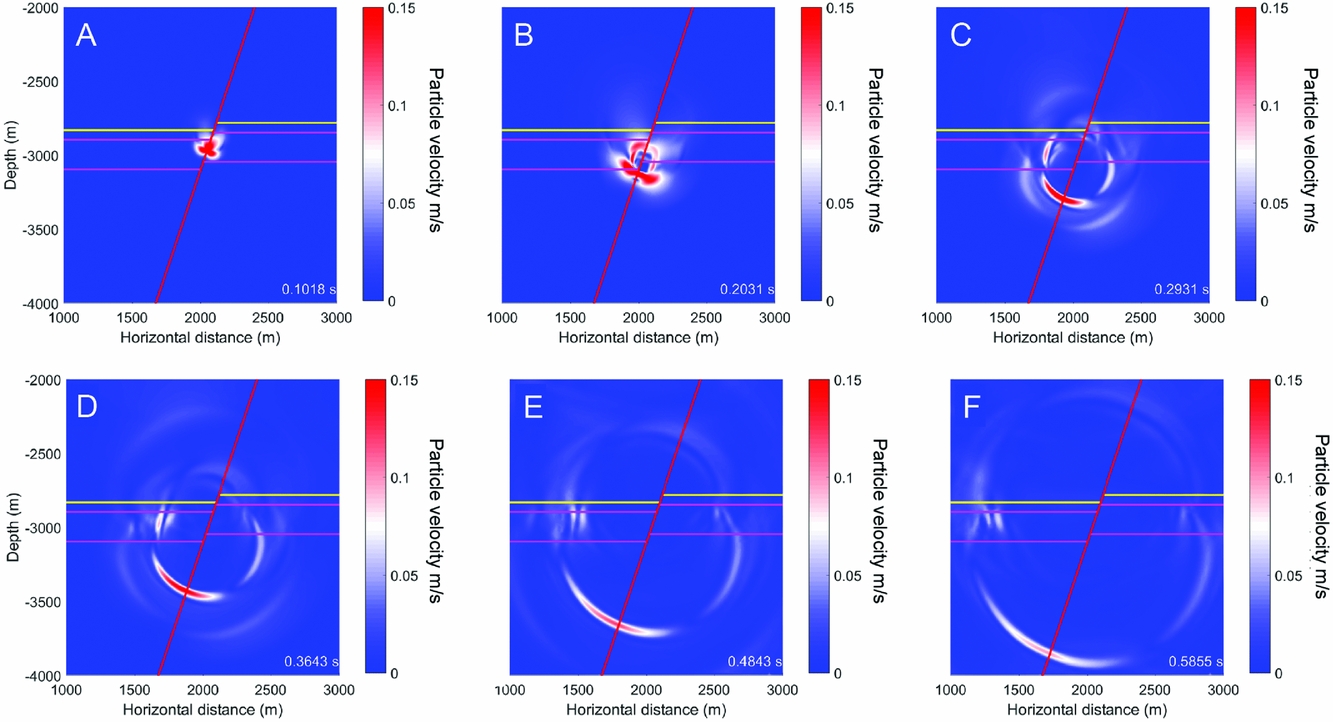
Figure 10 shows the particle velocities in the formations. During the seismic event the particle velocities in the formation directly adjacent to the slip patch were large, since the fault was slipping at >1ms−1 (Fig. 10A). After 0.2s, slip on the fault had stopped but radiated waves continued to propagate downwards (Fig. 10B) with amplitudes in the order of dms−1. The downward-propagating radiated wave amplitudes were much larger than those propagating upwards, because of the unidirectional (downward) directivity of the rupture as observed in Figure 9A and B. Figure 10D–F show how higher-amplitude waves also became trapped in the low-velocity Slochteren en Ten Boer Formation. The velocity contrast of the Ten Boer with the basal Zechstein was large, and waves travelled along the boundary in the reservoir or were reflected.
Wave propagation following the seismic event on the 50m offset fault. The snapshots illustrate different points in time counting from the start of the dynamic rupture phase (see bottom right). The colour scale indicates the particle velocity in the formations flanking the fault (red line). The top and base of the Slochteren are indicated by the pink lines, the top of the Ten Boer Member (base of the Zechstein) by the yellow line.

Comparison to a reservoir without offset: compaction and seismic rupture
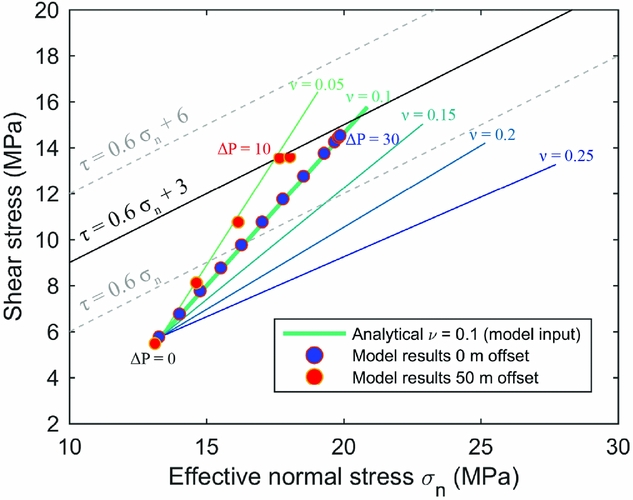
The stress state on the fault was very different for a reservoir cross-cut by a fault without offset (Fig. 11). Both the σ nʹ and τ increased with depletion, but the increase in stress occurs only within the reservoir interval and was relatively uniform; no peaks in stress formed near the formation boundaries. The SCU was largest near the top of the reservoir, starting at a level of 0.5. Fault reactivation first occurred at ΔP 29MPa, much later than the offset fault reactivated at ΔP 12.46MPa. Seismic instability occurred at ΔP 30.70MPa. The fault stresses just below and above the reservoir did not change due to the absence of offset. The difference in stress build-up between the 0m and 50m offset scenarios is clear when comparing the stress paths (Fig. 12). The stress path for the 0m offset scenario followed the analytical solution for poro-elastic stressing in a laterally extensive, uniaxially compacting reservoir (e.g. Hettema et al., Reference Hettema, Schutjens, Verboom and Gussinklo2000). However, the stress path in the 50m offset scenario was much steeper, reaching failure at much lower depletion pressures. Figure 12 also shows that if cohesion is present on the fault the timing of reactivation will be influenced significantly, because the angle between stress paths for realistic Poisson's ratios and the failure lines for a μ of 0.6 is small. As the failure line moves up due to the presence of cohesion, convergence of the stress path to the failure line will take significantly more depletion.
On-fault results as a function of reservoir depletion Δp (legend of Δp is shown in (D)) on a 0m offset 70° dipping fault cross-cutting the reservoir. (A) pressure, (B) effective normal stress, (C) shear stress, (D) (aseismic)shear slip, (E) Shear Capacity Utilisation (0 = stable, 1 = sliding occurs). The depth interval of the Slochteren Formation is indicated by the grey area. The coloured lines indicate the amount of pressure decrease.
Stress paths as a function of reservoir depletion at 2900m depth for the 0m offset and 50m offset fault models, and comparison to the analytically calculated stress path for uniaxial compaction in a laterally extensive reservoir depleting from 35 to 0MPa (initial stresses and pressure, stress ratio K0=0.72 and Poisson's ratio ν=0.1 are same as used in the numerical models). Analytically calculated stress paths for different ν (0.05–0.25) are shown for reference. The failure criterion as used in the numerical models (μ=0.6, C=3MPa) is shown in black, and two other failure lines with different C are depicted with grey dashed lines. The stress path for the 50m offset reservoir is steeper than for 0m offset due to local stress concentrations along the offset fault.

The relatively uniform shear stresses that developed during depletion (in contrast to the more peaked stress on a 50m offset fault) also had a profound effect on the propagation of rupture. The uniform, near-critical state of stress across the reservoir interval and the several MPa stress drop favoured downward propagation of rupture until entering the less critically stressed underburden. The slip rate on the fault was much larger than for the offset fault scenario (up to 3 vs 1.8ms−1), and the total length of the fault that slipped and the maximum slip were much larger than for the offset fault scenario. The entire reservoir interval slipped seismically, and the rupture event expanded for ~50m into the Ten Boer and underburden. No low shear stress region had formed above and below the reservoir (as in the 50m offset case), making it easy for rupture to propagate outside of the reservoir. The rupture did decelerate when entering the underburden which has a low SCU; during weakening the shear stress did not fall below the stress in the underburden (negative stress drop) and too much energy is required to propagate the seismic event further.
Seismic slip on the fault without offset (70° dip). (A) Relative shear displacement along the fault, positive is in the downdip direction. (B) Slip rate on the fault. (C) Shear stress during seismic rupture. The grey blocks indicate the depth interval of the reservoir formation.

In Figure 14 the 0m and 50m offset cases are compared for various in situ stress ratio K 0. The pressure required for reactivation is much higher for the 0m offset scenario as discussed in this section, and is also more sensitive to the K 0. Above a K 0 of 0.72, reactivation did not occur for 0m offset. For the 50m offset, reservoir fault reactivation occurred from the most critical K0 (0.68) up to the most stable K 0 evaluated (0.79). The pressure required for reactivation increased with K 0 from 7 to 18MPa. The slip patch length (length of the fault that slipped seismically) in a 0m offset reservoir was large compared to a 50m offset reservoir, propagating several hundreds of metres into the underburden depending on the K 0. For the 50m offset case, ruptures remained mostly confined to the reservoir interval. At the most stable K 0 of 0.75–0.79, only part of the reservoir was reactivated seismically; rupture remained confined to the high shear stress region that formed at the top of the hanging wall (see also Fig. 8).
(A) Sensitivity of pressure required for reactivation to in situ stress ratio K0 (σh/σv). Coloured symbols indicate the pressure change at the first instance of fault reactivation, open symbols connected with the dashed line indicate the pressure change when instability occurred and the seismic event started. (B) Seismic slip patch length (fault length that slipped seismically) as a function of in situ stress ratio K0. The thickness of the reservoir (200m) is indicated by the dashed line. Magenta triangles: 50m offset fault; green circles: 0m offset fault.

Discussion
In this study we show how the seismic source of depletion-induced earthquake can be simulated, including reservoir depletion, nucleation of seismic rupture, and subsequent near-field wave propagation by dynamic fault slip. A seismic rupture was modelled that propagated downwards on an offset fault, from the top of the hanging wall halfway through the reservoir. The model procedure presented in this paper opens up many links with field data, such as sizes, location and static stress drops of recorded events, but (due to the fully dynamic analysis) also with waveforms recorded in the two downhole monitoring arrays present in the field. Here we discuss several of the assumptions of the model and implications of the model results.
Large uncertainty exists in the pre-depletion minimum horizontal stress. The in situ stress, in combination with the static friction and/or friction drop on the fault, controls whether events are likely to propagate outside the reservoir or remain within the reservoir interval. We also assumed homogeneous depletion within the Slochteren Formation, without any depletion occurring in the Ten Boer or in the Carboniferous. However, sand lenses may be present within these formations that deplete with a time delay with respect to the reservoir. This will result in a more complex state of stress on the fault, depending on the size of these lenses. Additionally, incorporating the different responses of gas and water in the reservoir generates a more complex stress state (Zbinden et al., Reference Zbinden, Rinaldi, Urpi and Wiemer2017). Within the Slochteren Formation, compaction may be heterogeneous due to variations in porosity; this can also change the state of stress along the fault. Further modelling is required to determine whether these effects are likely to be minor with respect to the reservoir-scale trend or whether they may play an active role in the nucleation. In addition, recent experimental work has shown that deformation in compacting porous sandstones may be 20–60% irrecoverable (Hol et al., Reference Hol, van der Linden, Zuiderwijk, Marcelis and Coorn2015). This inelastic behaviour may lead to a different evolution of the horizontal stress; future modelling efforts will attempt to include the inelastic behaviour of the reservoir rock, and also of the caprock (salt creep).
It was assumed that depletion occurred evenly throughout the Slochteren Formation. This is supported by the reservoir modelling and history matching, which suggest most faults are not sealing. However, if faults were (partially) sealing, the delayed pressure response would influence fault slip (Zbinden et al., Reference Zbinden, Rinaldi, Urpi and Wiemer2017). Diffusion of pressure from the overburden and underburden formations and fault in response to the reservoir depletion would also influence slip. A decrease in pressure in the underburden fault would stabilise the fault, forming a barrier to propagating slip (Zbinden et al., Reference Zbinden, Rinaldi, Urpi and Wiemer2017), opposite to the diffusion effect for injection (Buijze et al., Reference Buijze, Orlic, Wassing and Schreppers2015b). Depletion of the Ten Boer Member also influences the stress changes, bringing a larger area closer to failure. We recommend that these factors be addressed in future work.
To our knowledge, this is the first study that dynamically models the nucleation and propagation of a seismic event with a cohesion-weakening function. The slip and slip rates modelled in this study are similar to those modelled using purely friction weakening (Buijze et al., Reference Buijze, Orlic and Wassing2015a). Dynamic frictional weakening may however be expected during seismic rupture; e.g. thermal pressurisation might occur when rapid slip heats up the fault rock and pore fluids, causing pressure build-up. The weakening mechanisms for relatively small earthquakes like those in Groningen have not been studied in the laboratory, and more research on this topic is recommended. The weakening function also has implications for the timing of seismic events. Any weakening function yields an aseismic slip phase, where the fault is slipping slowly until a critical nucleation length is reached and seismic instability can occur. This means there is a delay between the onset of fault reactivation and the onset of seismic slip, which may be quite large in time since the production and stress build-up in the field take place over decades. The nucleation length depends, among other things, on the inverse of the weakening rate, which in the case of the linear slip weakening is D c/(τ p–τ r) (or in this study D c/[ΔC+Δμσ n]) (Uenishi & Rice, Reference Uenishi and Rice2003). It is thus important to know the amount of weakening. Also the shape of the weakening function may be of great importance for the nucleation length The exact physical mechanisms governing healing, fracturing and unstable slip on (Groningen-type) faults are still poorly understood, and experiments under appropriate loading and boundary conditions must be conducted to gain a basic understanding of the governing mechanisms of (dynamic) weakening of fault materials relevant to the Dutch subsurface, as proposed in Spiers et al. (Reference Spiers, Hangx and Niemeijer2017).
We showed how the geometry of a reservoir offset along a fault can enhance stress changes on that fault and promote seismic slip, in agreement with previous work. For the case without offset (which corresponds to analytical solution for poro-elastic stressing inside a laterally extensive, uniaxially compacting reservoir) across the fault, the onset of seismic rupture (or nucleation) only occurred at significant depletion. For a more stable initial stress condition (K 0>0.72) the 0m offset fault would require a (significantly) lower friction angle to be reactivated. Offset on faults (less than the reservoir thickness) enhances the stress near the top of the hanging wall and base of the footwall, causing reactivation at considerably less depletion than for the 0m offset case. The hetereogeneous fault stresses caused by offset not only influenced the onset of slip, but also the size of the induced seismic event. Other offsets cause a different state of stress along the fault, and events nucleate at different levels of depletion depending on the offset (Buijze et al., Reference Buijze, Orlic and Wassing2015a; Van den Bogert, Reference Van den Bogert2015). In the Groningen reservoir many different faults are present with different offsets (Fig. 4), which are likely to be reactivated at different points in time, and also generate events of different sizes, giving rise to a lot of variability. Thus far a relationship between fault offset and earthquake occurrence in Groningen has not been straightforward, but many other factors may complicate the onset and size of seismic events, e.g. lithological variability, fault topography (roughness), heterogeneous depletion and compaction, location uncertainty, limited data, etc. The geomechanical modelling approach presented can help in addressing and understanding these effects, and provides many opportunities to link with observations from e.g. borehole seismometers. The geomechanical models indicate that geometry-enhanced stressing effect due to offset cannot be ignored in studies dealing with the timing and location of seismicity in the Groningen field. Additionally, the weakening behaviour (Δτ, D c) and the state of stress K 0 strongly influence the timing and size of events; we recommend that these parameters and their uncertainties be included in future work.
Conclusions
-
• The generation of a seismic event in a depleting reservoir was successfully modelled, including depletion-induced stressing, fault reactivation, nucleation, seismic fault rupture and near-field wave propagation
-
• The rapid loss of cohesion after fault reactivation can lead to seismic instability, similar to purely frictional weakening.
-
• Depletion caused critical stresses at both the top of the hanging wall and base of the footwall. Under the current modelling assumptions nucleation occurred at the top of the hanging wall.
-
• Faults which offset depleting reservoir compartments will be reactivated at much lower pressure drops than faults without offset, as the offset locally concentrates the stress build-up.
-
• Offset creates a more variable stress distribution along the fault, which influences the nucleation and propagation of events with low-stress regions acting as barriers. The zero-offset geometry creates a relatively uniform stress distribution along the fault, which causes reactivation at a much later stage but is more favourable for rupture propagation across the depleting reservoir depth interval.
-
• The largest-amplitude seismic waves are radiated downwards into the hanging wall, due to the directivity of the rupture (downwards-propagating), and the strong velocity contrasts with the overlying Zechstein Formation.
Acknowledgements
We thank the two reviewers for their supportive and useful feedback. We also thank our colleagues and acquaintances at TNO, Utrecht University, Shell and NAM for helpful discussions on this subject. We thank NAM for providing the fault data of the Groningen field. Part of the work has been performed within the framework of the M4ShaleGas project, funded by the European Union's Horizon 2020 research and innovation programme under grant agreement number 640715. This work was in part supported by contract number UI49294 awarded to Utrecht University by the Nederlandse Aardolie Maatschappij (NAM) in the framework of the research programme that the company initiated after the ML = 3.6 Huizinge earthquake in 2012.


 Open access