

1. BACKGROUND
One of the most effective methods to assess the dynamic parameters of ship motion is radar information. However, radar information is constrained by significant limitations. In practice, the position error for a navigation radar is not less than 30 metres. The use of radar information for collision avoidance is effective only for constant values of ship movement (Śniegocki, Reference Sniegocki2002). Radar and Automatic Radar Plotting Aids (ARPA) are limited by weather conditions and target manoeuvres. Detection of small objects is limited by sea clutter and unfavourable weather conditions. They also have a minimum range of detection, radar shadow effect and wave reflection. Radar information, usually presented in a polar coordinate system, is subject to measurement error of at least 1% of radar range and 1° of true bearing. Therefore, it appears rational to supplement the information derived from radar with additional information. A system that is claimed to be tailored to performing this task is AIS, delivering proper information automatically and continuously with accuracy of the information comparable to Global Navigation Satellite Systems (GNSS) (Felski and Jaskólski, Reference Felski and Jaskólski2013).
2. ANALYSIS OF AIS AS A SOURCE OF ADDITIONAL INFORMATION FROM A COLLISION AVOIDANCE POINT OF VIEW
AIS uses radio waves to transmit data of ship motion parameters and can deliver more accurate information than radar information, however for many watchkeeping officers it often looks less reliable than own radar information (Felski and Jaskólski, Reference Felski and Jaskólski2012a; Felski and Jaskólski, Reference Felski. and Jaskólski2012b). Use of AIS has led to the emergence of opinions on the imperfections of the system related to the lack of transmission or the transfer of unreliable information. Studies on the incompleteness and integrity of AIS information published to date are generally linked to the position reports (Message no. 1) and static and voyage-related data (Message no. 5). This problem was analysed, for example by Harati-Mokhtari et al. (Reference Harati-Mokhtari, Wall, Brookes and Wang2007), Bailey (Reference Bailey2005) and Hori et al. (Reference Hori, Arai, Okuda and Fujie2009).
One of the methods of statistical analysis of AIS information unfitness was presented by Harati-Mokhtari et al. (Reference Harati-Mokhtari, Wall, Brookes and Wang2007). The authors defined the types of mistakes and errors made by AIS users. Statistical analysis of AIS information quality is based on the modification of the reliability system model referred to as the “Swiss Cheese Model”. It was estimated that at least 80% of all recorded maritime accidents resulted from human errors. Therefore, the contribution of human error as the main factor leading to the increased number of maritime accidents was studied over a ten-year period 1991–2001. The most frequently occurring incorrect AIS information was a numeric string instead of destination and country name instead of port name. There were cases when Exact Time of Arrival (ETA) or destination field was reported: “not available”, “not defined”, or blank.
In 2005, similar research on AIS information was conducted in the Dover Strait, which is a high traffic intensity channel area, requiring reliable and complete navigational information. The research was conducted by Dover Coastguard Channel Navigation Information Service (CNIS), at the Vessel Traffic Service (VTS) area, over a seven day period (Bailey, Reference Bailey2005). Studies on reliability and completeness of AIS information were conducted by comparing two sources of information. Static information and voyage related data were compared with verbal information reported on Very High Frequency (VHF) Channel 11 to VTS operators upon entering and leaving the VTS area. It was assumed that information transmitted by radiotelephone was reliable, whereas AIS information might contain errors. Research details were divided into categories depending on transmitted information and it was shown that more than 50% of AIS ship destination information was incorrect. Almost the same results were obtained with draught however information about for example call signs, Maritime Mobile Service Identity (MMSI) and Course was incorrect in only 5%.
In addition, the Bailey research provided information on AIS dynamic data errors. In this area, course and speed information errors were observed. When applying comparison methods it is possible to examine the quality of AIS dynamic data by comparing it with VTS (radar) dynamic information. However, this methodology may be questioned, since the accuracy of course and speed determined by VTS sources has a relatively poorer quality than that from Global Positioning System (GPS) sensors. In five cases, the difference in course between shore radar and AIS dynamic information amounted to 180°. Presumably, the deviation concerned two different ships considered to be one ship and mistakes were made by VTS operators.
The knowledge of AIS information integrity is relatively low and therefore it can hardly be considered objective. It should be taken into consideration that the knowledge was obtained in the period of rapid implementation of the system. This resulted in a lack of operator training on AIS maintenance and it is potentially the source of many cases of improper system operation. Efficiency of navigation systems, including AIS, can be assessed using the value of processed information error. The errors are related to incorrectly reported position, course, speed or non-quantitative factors i.e. human factor errors.
It is important to remember that the abovementioned publications were prepared in the early stages of AIS implementation. In this context more interesting research in the area of navigation characteristics of AIS information was presented by Banyś et al. (Reference Banyś, Noack and Gewies2012). The analysis of AIS data sets describing the vessel traffic of the Baltic Sea led to a conclusion that specific parameters with relevance to navigation seemed to be defective or implausible. Essentially, it concerned the Heading (HDG) and the Rate Of Turn (ROT) parameters. The AIS data used in that analysis was recorded in September 2011 and covered vessel traffic in the Baltic Sea in the proximity of the north coast of Germany. It comprised the harbour area that included the Port of Rostock and its approaches and the sea area located in the Baltic Sea, east of Bornholm, between Trelleborg and Arkona (Figure 1).
Investigation areas of AIS data reliability.

All AIS data was provided by the German Federal Waterway Authority as a query from the Helsinki Commission (HELCOM) AIS database server. The complete one-month AIS dataset included Class A as well as Class B data messages. Every AIS transmission of Message types 1, 2 and 3 (dynamic position report Class A), 5 (static and voyage related data Class A), 18 (standard Class B equipment position report) and 19 (extended Class B equipment position report) were counted and placed into the corresponding geographic category. In the harbour area around 65% of the messages were unaffected. This means that around 35% of all AIS messages had one or more unknown values of the seven analysed variables. At 8% a significantly smaller percentage of transmitters had trouble sending dependable Speed Over Ground (SOG) and Course Over Ground (COG) data. Figure 2 shows that approximately 88% of the AIS messages with unknown values of ROT and HDG occurred when the SOG was less than 1 kn.
Histogram of the distribution of unknown values of ROT (left) and HDG (right) in relation to discrete arrays of SOG for Class A messages in harbour area.

It is important that 12% of the unknown values were sent by vessels moving at speed between 1 kn and 10 kn. Considering the overall results for ROT and HDG (28% of the affected messages) about 3% of the data can be declared crucial for the assessment of traffic situation, because of the movement of the vessels. For SOG lower than 1 kn, nearly 27% of all vessels contribute to the broadcasts of incomplete AIS messages. Additionally, the number of affected transmitters sending unknown values of ROT and HDG in relation to discrete arrays of SOG for Class A messages in harbour area is presented in Figure 3.
Number of affected transmitters sending unknown values of ROT (left) and HDG (right) in relation to discrete arrays of SOG for Class A messages in harbour area.

In the sea areas, approximately 92% of the messages are unaffected. The highest occurrence of unknown values was observed for ROT (about 5%) and HDG (about 4%). The navigation status is affected in about 2% of readings.
At speeds lower than 1 kn only a small number of vessels (less than 1%) is responsible for 25% of unknown values of ROT and 36% of unknown values of HDG (Figure 4). Additionally, a number of affected transmitters for unknown values for ROT (left) and HDG (right) in relation to discrete arrays of SOG for Class A messages in sea area are presented in Figure 5.
Histogram of the distribution of unknown values of ROT (left) and HDG (right) in relation to discrete arrays of SOG for Class A messages in sea area.

Number of affected transmitters for unknown values for ROT (left) and HDG (right) in relation to discrete arrays of SOG for Class A messages in sea area.

As the importance of AIS in everyday navigation increases, it has become clear that AIS data may not contain all the information necessary to properly support decision making on the bridge. Very similar investigation results were presented by Felski and Jaskólski (Reference Felski and Jaskólski2013) for the Gulf of Gdańsk. The investigated area with recorded data is presented in Figure 6.
Area of investigation in the Gulf of Gdańsk with the tracks of AIS ships.

The studies of AIS incompleteness were performed on the basis of recorded messages in txt files by means of a receiver situated in Gdynia. Each data set recorded to a file was treated as a series. Analyses were made on the basis of the statistical methods for every seven days. Data were recorded from 4 April 2006 to 8 January 2012 (selected 54 weeks - 378 days). Assessment of HDG and ROT incompleteness information was carried out in Message group 1, 2 and 3 according to ITU-R M. 1371 (2010) and is presented in Table 1.
Summary of ranges of correct and incorrect data for HDG and ROT (ITU-R M. 1371, 2010).

The number of incomplete messages during 24-hour recording for selected data components is presented in Figure 7. It is easy to observe that the most incomplete data are ROT and HDG during hourly investigations.
Hourly outcomes of incomplete VDM messages for selected AIS data components.

3. PRELIMINARY DISCUSSION OF INTEGRITY AND COMPLETENESS OF AIS INFORMATION
The quality of AIS information is a subject of interest for many researchers. In the available publications, authors described results of studies on completeness of AIS information derived from vessels. Furthermore, the availability of AIS service and coverage area of AIS was modelled by Aarsaether and Moan (Reference Aarsaether and Moan2009) and Hammond and Peters (Reference Hammond and Peters2012), but in the reference literature there are no studies of AIS information integrity available. Usually, the results published by researchers refer to completeness of AIS dynamic and static information. It was therefore assumed that the methods known from the theory of reliability characteristics would determine the integrity and completeness of AIS information. For the purposes of this study, it is proposed to define the term as follows:
Completeness of AIS information: For the purpose of this paper, authors characterised completeness as the degree of compatibility of AIS information received by users of the system with the message content specific to the system in accordance with the specifications ITU-R M.1371, for any given point within the service volume. In case of completeness, the lack of system usability was described as the incompleteness of AIS message No. 1, 5. The meaningful representation of AIS completeness is the limiting value that is defined as a completeness coefficient with the exponential life and failure time distributions.
Completeness of the information is identified with AIS information system availability. If we consider the navigational structure of a system operating in time, then X1, X2, X3, … Xn will be the working time and Y1, Y2, Y3, … Yn will be the time of failure (Specht, Reference Specht2003). The moments Z′n = X1+Y1+X2+Y2+…+Yn−1+Xn, n = 1, 2, …, N are moments of failures and Z″n = Z′n+Yn are moments of renewal. In addition, X1, Y1, i = 1, 2,… are independent and the working times and times of failures have the same distributions. The working state is binary 2, the state of failure is binary 1. A graphic representation of AIS data completeness is presented in Figure 8.
Graphic presentation of completeness of AIS data (Specht C., Reference Specht2003).
where: CM(t) – completeness of AIS data; β(t) – system state; X(n) – working time; Y(n) – time of failure.

The reliability structure of AIS may be defined by interval time between two consecutive AIS reports, which decide about its state. Let β(t) be the binary interpretation of the completeness state of the process.
 $$\beta \left( t \right) = \left\{\matrix{2, Z_n^{\prime \prime} \le t \le Z_{n + 1}^{\prime} \cr 1, Z_{n + 1}^{\prime} \le Z _{n + 1}^{\prime \prime}}\ for\ \,n = 0, 1, 2, \ldots N \right.$$
The state β(t) = 2 means that in the moment t the information of position report or static data or voyage related data are correct according to ITU-R M.1371. The information system is in the working state. In the opposite case β(t) = 2, the information of position report or static data or voyage related data are incorrect according to ITU-R M.1371. The information system is in the state of failure.
Assessment of the dynamic information integrity may be carried out in the message group 1, 2 and 3 and separately in message group 5. Message No. 1 provides information on navigation status, position, SOG, COG, ROT and HDG. Summary of the range of valid data and the value indicating incomplete data is presented in ITU-R M. 1371 (2010).
Message No. 5 contains static information: MMSI number, IMO number, call sign, ship name, type of vessel and its cargo, Voyage Related Data: draft and the port of destination. Summary of the range of valid data is shown in ITU-R M.1371.
If
 $$CM = \displaystyle{{\displaystyle{{{X_1} + {X_2} + {X_3} +. \;. \;. + {X_n}} \over n}} \over {\displaystyle{{{X_1} + {X_2} + {X_3} +. \;. \;. + {X_n}} \over n} + \displaystyle{{{Y_1} + {Y_2} + {Y_3} +. \;. \;. + {Y_n}} \over n}}}$$
then:
 $$E\left( X \right) = \displaystyle{{{X_1} + {X_2} + {X_3} +. \;. \;. \; + {X_n}} \over n}$$
and
 $$E\left( Y \right) = \displaystyle{{{Y_1} + {Y_2} + {Y_3} +. \;. \;. \; + {Y_n}} \over n}$$
where E(X) is the expected value of lifetime and E(Y) is the expected value of failure time.
It was assumed that completeness:
 $$CM = \displaystyle{{E(X)} \over {E\left( X \right) + E(Y)}}$$
so completeness can be computed as the sum probabilities of events:
 $$CM\left( t \right) = P[\beta \left( t \right) = 2]$$
Therefore completeness of AIS information CM can be written as follows:
 $$ \displaystyle{CM = \mathop {\lim} \limits_{t \to \infty} CM\left( t \right) = \mathop {{\rm lim}}\limits_{t \to \infty}}{1 \over {E\left( X \right) + E(Y)}}\mathop {\int} \limits_0^\infty R\left( u \right)du$$
and R(u) is the reliability function from:
 $${ \mathop \int \limits_0^\infty R\left( u \right)du = E(X)}$$
According to its functionalities AIS can be characterised by an exponential distribution of residence times of working and failure states due to the “memoryless”. Completeness of AIS data has an exponential distribution, if the density function of the random variable T – Time to Failure (TTF) is given by:
 $$f\left( t \right) = \left\{ {\matrix{ {\lambda {e^{ - \lambda t}}\,t \gt 0} \cr {0\quad\,\,\,\,t \le 0,}}} \right.$$
Then, cumulative distribution function of the random variable T (TTF) is given by:
 $$F(t) = \left \{ {\matrix{ {1 - {e^{ - \lambda t}},\,t \gt 0} \cr {0,\quad t \le 0}}} \right.$$
 $$F(t) = \left \{ {\matrix{ {1 - {e^{ - \mu t}},\,t \gt 0} \cr {0,\quad t \le 0} \cr}} \right.$$
where F(t) is the distribution of working time, G(t) is the distribution of failure time, λ is the failure rate and μ is the renewal rate.
From the properties of the exponential distribution:
 $${E_{\exp}} \left( {{X_i}} \right) = \displaystyle{1 \over {\lambda,}} $$
 $${E_{\exp}} \left( {{Y_i}} \right) = \displaystyle{1 \over \mu} $$
where E exp(X i) is the expected value of the exponential life distribution and E exp(Y i) is the expected value of the exponential failure distribution.
The operating time of the information delivered via AIS is characterised by the exponential distributions of the lifetime and the time of failures. Therefore, according to availability definition, the completeness is defined as follows:
 $$C{M_{\rm exp}}(t) = \displaystyle{\mu \over {\lambda + \mu}} + \displaystyle{\lambda \over {\lambda + \mu}} + {e^{ - \left( {\lambda + \mu} \right)t}}$$
Finally, we obtain (Specht, Reference Specht2003):
 $$C{M_{\rm exp}} = \displaystyle{{\displaystyle{1 \over \lambda}} \over {\displaystyle{1 \over \lambda} + \displaystyle{1 \over \mu}}} = \displaystyle{\mu \over {\mu + \lambda}}. $$
This is a new research approach. Parametric assessment of information completeness will depend on recorded messages from ships. Moreover, it is self-evident that:
 $$IC{M_{\rm exp}} = 1 - C{M_{\rm exp}}$$
where ICM exp is the incompleteness coefficient with an exponential distribution.
On the basis of the recorded data, during 24-hour recordings we can estimate moments of received complete and incomplete data. Then, on the basis of daily research scores we calculate weekly research outcomes. Each file record is treated as a series, however, to obtain reliable statistical results a group series was analysed. AIS information recorded for 378 days was used for completeness research.
 $$CM\left( {{t_1},{t_2}} \right) = \displaystyle{{\mathop \sum \nolimits_{i = 1}^n C{M_n}(t)} \over n}$$
where CM(t 1,t2) is the average completeness of AIS data in the interval [t1, t2] and CM(t)n is the completeness of AIS data, where n is the number of week.
It is possible to calculate:
 $$CM\!\left( {{t_1},{t_2}} \right) = \displaystyle{1 \over {{t_2} - {t_1}}}\mathop \int \limits_{t1}^{t2} CM\left( t \right)dt$$
Integrity of AIS information: According to the Federal Radio-navigation Plan (2005) integrity is the measure of the trust that can be placed in the correctness of the information supplied by a navigation system. Integrity includes the ability of the system to provide timely warnings to users when the system should not be used for navigation. In this paper authors consider the integrity as a measure of confidence in derived information of received AIS messages. This measure will be expressed by statistical methods.
To estimate AIS integrity information, the recorded data were compared with the ships database, received from the Maritime Office in Gdynia, which contains information about 6265 vessels.
To calculate integrity coefficient, the number of received VHF Data Link Message (VDM) lines as well as the number of ships during daily recordings were estimated. Therefore the integrity of AIS data for six variables was calculated according to the following formula:
a. Criterion of “lines”
(19) $${I_{(t1,t2)}} = \displaystyle{{number\; of\; VDM\; correct\; data\; for\; selected\; component} \over {number\; of\; opportunities\; for\; error\; VDM\; data}}$$
b. Criterion of “ships”
(20)$${\hskip-30pt I_{(t1,t2)}} = \displaystyle{{number\; of\; vessels\; transmiting\; VDM\; correct\; data\; for\; selected\; component} \over {number\; of\; vessels\; during\; daily\; recording}}$$


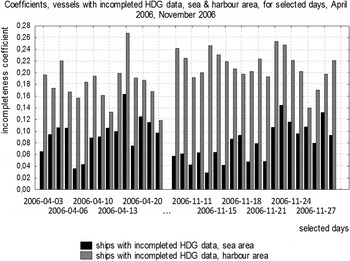
The investigation results of ROT and HDG data incompleteness are presented in Figures 9 and 10.
Incompleteness coefficients of HDG data in sea and harbour areas for all received data.

Incompleteness coefficients of ROT data in sea and harbour areas for all received data.

Detailed analysis of the information was excluded from further examination of the information transmitted by ships observed in port if the SOG was less than 4 knots. The results of the study, obtained through filtering of the data used for incompleteness analysis, are presented below.
It is clear to observe, that the quantity of incomplete information of HDG and ROT from the harbour area was larger than the one from the sea area. In addition, the improvement of completeness data related to sea area was observed in November 2006. Figure 9 and 10 present data related to the number of incomplete AIVDM lines (“lines criterion”) received by AIS users in the area. Data distribution depends on the frequency of information transmission that varies between ships. Additionally, some ships still navigate in the same region. This ship transmits incorrect data. It can be the reason for the disproportionate results.
Another approach is the criterion of “ships”, which relates data to the number of ships responsible for incomplete HDG and ROT information. The investigation outcomes are presented in Figures 11 and 12.
Incompleteness coefficient of HDG information in relation to ships in sea and harbour areas.
Incompleteness coefficient of ROT information in relation to ships in sea and harbour area.

Information comparison shows much greater values of incompleteness observed for the “ships criterion” than for the “lines criterion”. The difference is related to the time interval of transmitting incomplete data by ships.
Significant improvement of AIS information quality was observed during the following years. Comparison of investigated data for 2006 and 2010–2012 shows that incompleteness coefficient was less than 0·10 for HDG and ROT data for the “ships criterion” (Figures 13 and 14).
Incompleteness coefficients of HDG transmitted by ships in sea and harbour areas for period December 2010 to January 2011.

Incompleteness coefficients of ROT transmitted by ships in sea and harbour areas for period December 2010 to January 2011.

Analysis of the contents of the Position Report for the criterion “lines” in the Gulf of Gdańsk area found that 16% of messages lack the information concerning HDG. Message incompleteness was reported in 14% if ships moved at a speed of less than 4 knots. However, up to 12% from the group of incomplete messages came from ships located at the area of ports of Gdynia and Gdańsk, while 2% of incomplete data came from ships located at sea.
For the criterion “ships”, after data filtering: 20·5% of the vessels transmitted messages lacking HDG, 19·5% was related to the ships travelling at a speed of less than 4 knots, and 15% of ships were located in the area of the ports of Gdynia and Gdańsk.
At least 17% of messages for the criterion of “lines” contained incomplete ROT information. However, up to 15% of messages were from the ships located in the port area and their speed was less than 4 knots. On the other hand, for the criterion of “ships”, such a state was represented by 17% of vessels located in ports of Gdynia, Gdańsk and moving slower than 4 knots, whereas 22% of all vessels sent incomplete messages of ROT in area of Gulf of Gdańsk. The results of incompleteness of Heading and Rate of Turn data in the Gulf of Gdańsk, recorded by means of AIS from April 2006 to January 2013 are shown in Figure 15.
Incompleteness of AIS dynamic data in the Gulf of Gdańsk (from April 2006 to January 2013).

The research results give a reasonable proof of the possibilities for the use of AIS information in collision avoidance. In addition, it seems preferable to use the dynamic information derived from GNSS receivers. It is considered to use the position information derived from GNSS receivers to acquire the movement elements and determine the Closest Point of Arrival (CPA) and Time to Closest Point of Arrival (TCPA) of objects.
4. THE STUDY OF AIS INFORMATION QUALITY AS A POTENTIAL SOURCE OF SUPPLEMENTARY ARPA INFORMATION
On the basis of the above presented method, additional dynamic information was discussed as a potential source of supplementary information in collision avoidance. As HDG and ROT data was discussed above, now only position, SOG and COG will be discussed. These data types are derived from GNSS. A summary of the range of valid data and the value indicating incomplete data is shown in Table 2.
Summary of ranges of correct and incorrect data in the message No. 1 (ITU-R M. 1371, 2010)

For this purpose, the Polish Naval Academy used a Class A SAAB R4 AIS receiver. Preliminary results of research completeness of selected dynamic AIS information are presented in Figures 16, 17 and 18.
Geographical position coefficients of AIS data completeness.

Speed over ground coefficients of AIS data completeness.

Course over ground coefficients of AIS data completeness.

The statistical analysis of AIS information completeness: geographic position, based on 24-hour distribution for each seven days, its mean completeness, minimum, maximum and standard deviation from 12 December 2011 to 1 January 2012 are presented in Table 3. It is clearly visible (Figures 16 to 18), that AIS data completeness coefficient improved in 2010.
The statistical analysis of AIS information completeness: geographic position, based on 24-hour distribution for each seven days.

Where: CM(t1, t2) – completeness of AIS information, based on 24-hour distribution for each seven days.
The results for the criterion of “lines” and the criterion of “ships” provide a high completeness coefficient. For the criterion “lines” and criterion “ships”, the differences in coefficient completeness of the different measurement series are in the range of (0, 0·0763). High value of information completeness for the geographical position with low values of standard deviations and errors indicate the potential use of this information in anti-collision applications. In further studies, analysis of the completeness of SOG and COG has been omitted. This is the information that comes from the GNSS receiver. Furthermore, studies of these variables are similar to the results for the geographical positions.
Graphical presentation of cumulative distribution for the completeness exponential of AIS data CM exp(t), for the “lines” criterion and for the criterion of “ships” are shown in Figure 19. λ is the failure rate and CM.exp(t) is the completeness exponential of AIS data.
Cumulative distribution for the completeness of AIS data: geographic position left: criterion of “lines”, right: criterion of “ships”.

Cumulative distribution for the completeness exponential of AIS data: geographic position was determined in accordance with assumption of system working time (Time To Failure), with the use of 9072 hours of recorded data. The completeness criteria of AIS data, not presented in Tables 1 and 2, are presented in Table 4.
Summary of ranges of correct and incorrect data in the message No. 1 and 5 (ITU-R |M. 1371, 2010)

The integrity of AIS information is a separate issue that requires special attention in the case of AIS data application in collision avoidance. The results of research of AIS completeness and integrity information are presented in Tables 5 and 6. Each table shows cumulative analysis of completeness and integrity information and is based on research carried out from April 2006 to January 2012.
Synthesis of the results for completeness of AIS information components.

Synthesis of the results for integrity of AIS information components.

According to the results of research presented above the highest completeness coefficients are: geographic position, MMSI number, Call Sign and Ship Name–between 0.9867 to 0.9999, whereas the lowest completeness coefficient was observed for navigational status (0.9633 when criterion of “ships”).
The integrity coefficient reached the highest value for: IMO number and Call Sign. The lowest value of coefficient was observed for navigation status. It was found that the information unfitness was caused mainly by human error i.e. AIS receiver operators and installers.
Number of vessels transmitting incomplete or unreliable messages is not equal to the number of incomplete and unreliable communications. The difference stems from the variable interval data transmitted by the on board AIS. These differences can be seen by comparing the results in tables above and Figure 20.
Summary of the results for the selected components of the completeness and integrity of AIS data (Jaskólski, Reference Jaskólski2013).

5. SUMMARY
This paper presents an overview of the results of AIS information analysis as a potential source of supplementary ARPA information in collision avoidance. Investigation was conducted in the Baltic Sea at the Gulf of Gdańsk and east of Bornholm. The data collected in both areas have similar values that prove the correctness of the results. The research outcomes presented in the paper lead to the conclusion that AIS could deliver useful supplementary information in the process of collision avoidance. This information is a reliable source of data, especially in the context of SOG and COG. Additionally, AIS can deliver information about the HDG changes and ROT without delay. The problem of position accuracy was omitted in the article, since the study relates to the navigation characteristics of GNSS.
In addition the authors proposed the concept of defining completeness and integrity of AIS information.


