


INTRODUCTION
The colorful political history of northern Mesopotamia in the early–mid second millennium BC can be pieced together from rich textual sources (Charpin Reference Charpin2004; Van De Mieroop Reference Van De Mieroop2007). It began with a politically fragmented landscape after the Ur III period, then saw the rise of the charismatic ruler Shamshi-Adad I who, ca. 1800 BC, established a large kingdom encompassing the Assyrian heartland, Mari (Tell Hariri) on the Euphrates river and Shubat-Enlil (Tell Leilan) in the Upper Khabur. When the kingdom rapidly fell apart following Shamshi-Adad’s death in 1768 BC (lower Middle Chronology), much of northern Mesopotamia reverted to small independent states. In the 15th century BC, northern Mesopotamia came under the control of the Hurrian kingdom of Mittani—a major international player that vied for power with Egypt, Babylon, and Hatti. The weakening of Mittani in the early–mid 14th century BC is documented in the Amarna letters (Moran Reference Moran1992; Rainey Reference Rainey2015), after which control of northern Mesopotamia shifted to the emerging Middle Assyrian kingdom.
The study of second millennium BC northern Mesopotamia from an archaeological perspective was for many years hampered by political conditions, but the resurgence of fieldwork in Iraqi Kurdistan over the past decade has opened an exciting new chapter. A prerequisite for reconstructing history from the archaeological remains and making connections with the text-based history is a robust chronology. Traditionally this would be achieved within excavations via pottery typology and dateable finds that can be linked to the Mesopotamian political chronology, which is in turn based on Assyrian eponym lists and astronomical data. There are, however, three problems with this approach: (1) pottery typologies in northern Mesopotamia are generally rather coarsely defined during the Middle Bronze Age (MBA; Old Assyrian/Babylonian period; ca. 2000–1600 BC) and the Late Bronze Age (LBA; Mittani and Middle Assyrian/Babylonian periods; ca. 1600–1200 BC); (2) despite Mesopotamia’s comparative abundance of written material, precisely dateable finds and cuneiform tablets in archaeological contexts are the exception rather than the rule; and (3) ambiguities within the political chronology for Mesopotamia mean that its absolute dating is debated. Assyriologists are divided between a wide array of chronological models, with differences of up to 150 years. These include the High Chronology (Huber Reference Huber1982, Reference Huber1999, Reference Huber2000, Reference Huber and Gernot2012), higher/lower Middle Chronology (Smith Reference Smith1940; Nahm Reference Nahm2013), Low Chronology (Pruzsinszky Reference Pruzsinszky2009), Mebert Chronology (Mebert Reference Mebert2010) and “New Chronology” (Gasche et al. Reference Gasche, Armstrong, Cole and Gurzadyan1998a, Reference Gasche, Armstrong, Cole and Gurzadyan1998b).
Development of radiocarbon (14C)-based sequences at newly excavated sites in Iraqi Kurdistan will thus prove crucial to establishing robust, independent absolute chronologies for individual strata, sites and northern Mesopotamia as a whole. While recent 14C and dendrochronological data associated with written tablets at two Old Assyrian trading posts in eastern Anatolia (Kültepe and Acemhöyük) strongly support the Middle Chronology (Manning et al. Reference Manning, Griggs, Lorentzen, Barjamovic, Bronk Ramsey, Kromer and Wild2016; Manning et al. Reference Manning, Wacker, Büntgen, Bronk Ramsey, Dee, Kromer, Lorentzen and Tegel2020b),Footnote 1 similar 14C-based anchors must be sought through fieldwork in Mesopotamia proper. Further underscoring the need for 14C studies in northern Mesopotamia is the paucity of data from east Syrian sites excavated up until the early 2000s (e.g., Mari and Tell Brak). Unfortunately, this fieldwork was interrupted just as precise 14C dating with the aid of Bayesian statistics and sequences of short-lived organic materials gained wide use. As a contribution to changing this state-of-affairs, we present here the first 14C results from Kurd Qaburstan—one of the largest early–mid second millennium sites on the Erbil Plain.
KURD QABURSTAN (ANCIENT QABRA?)
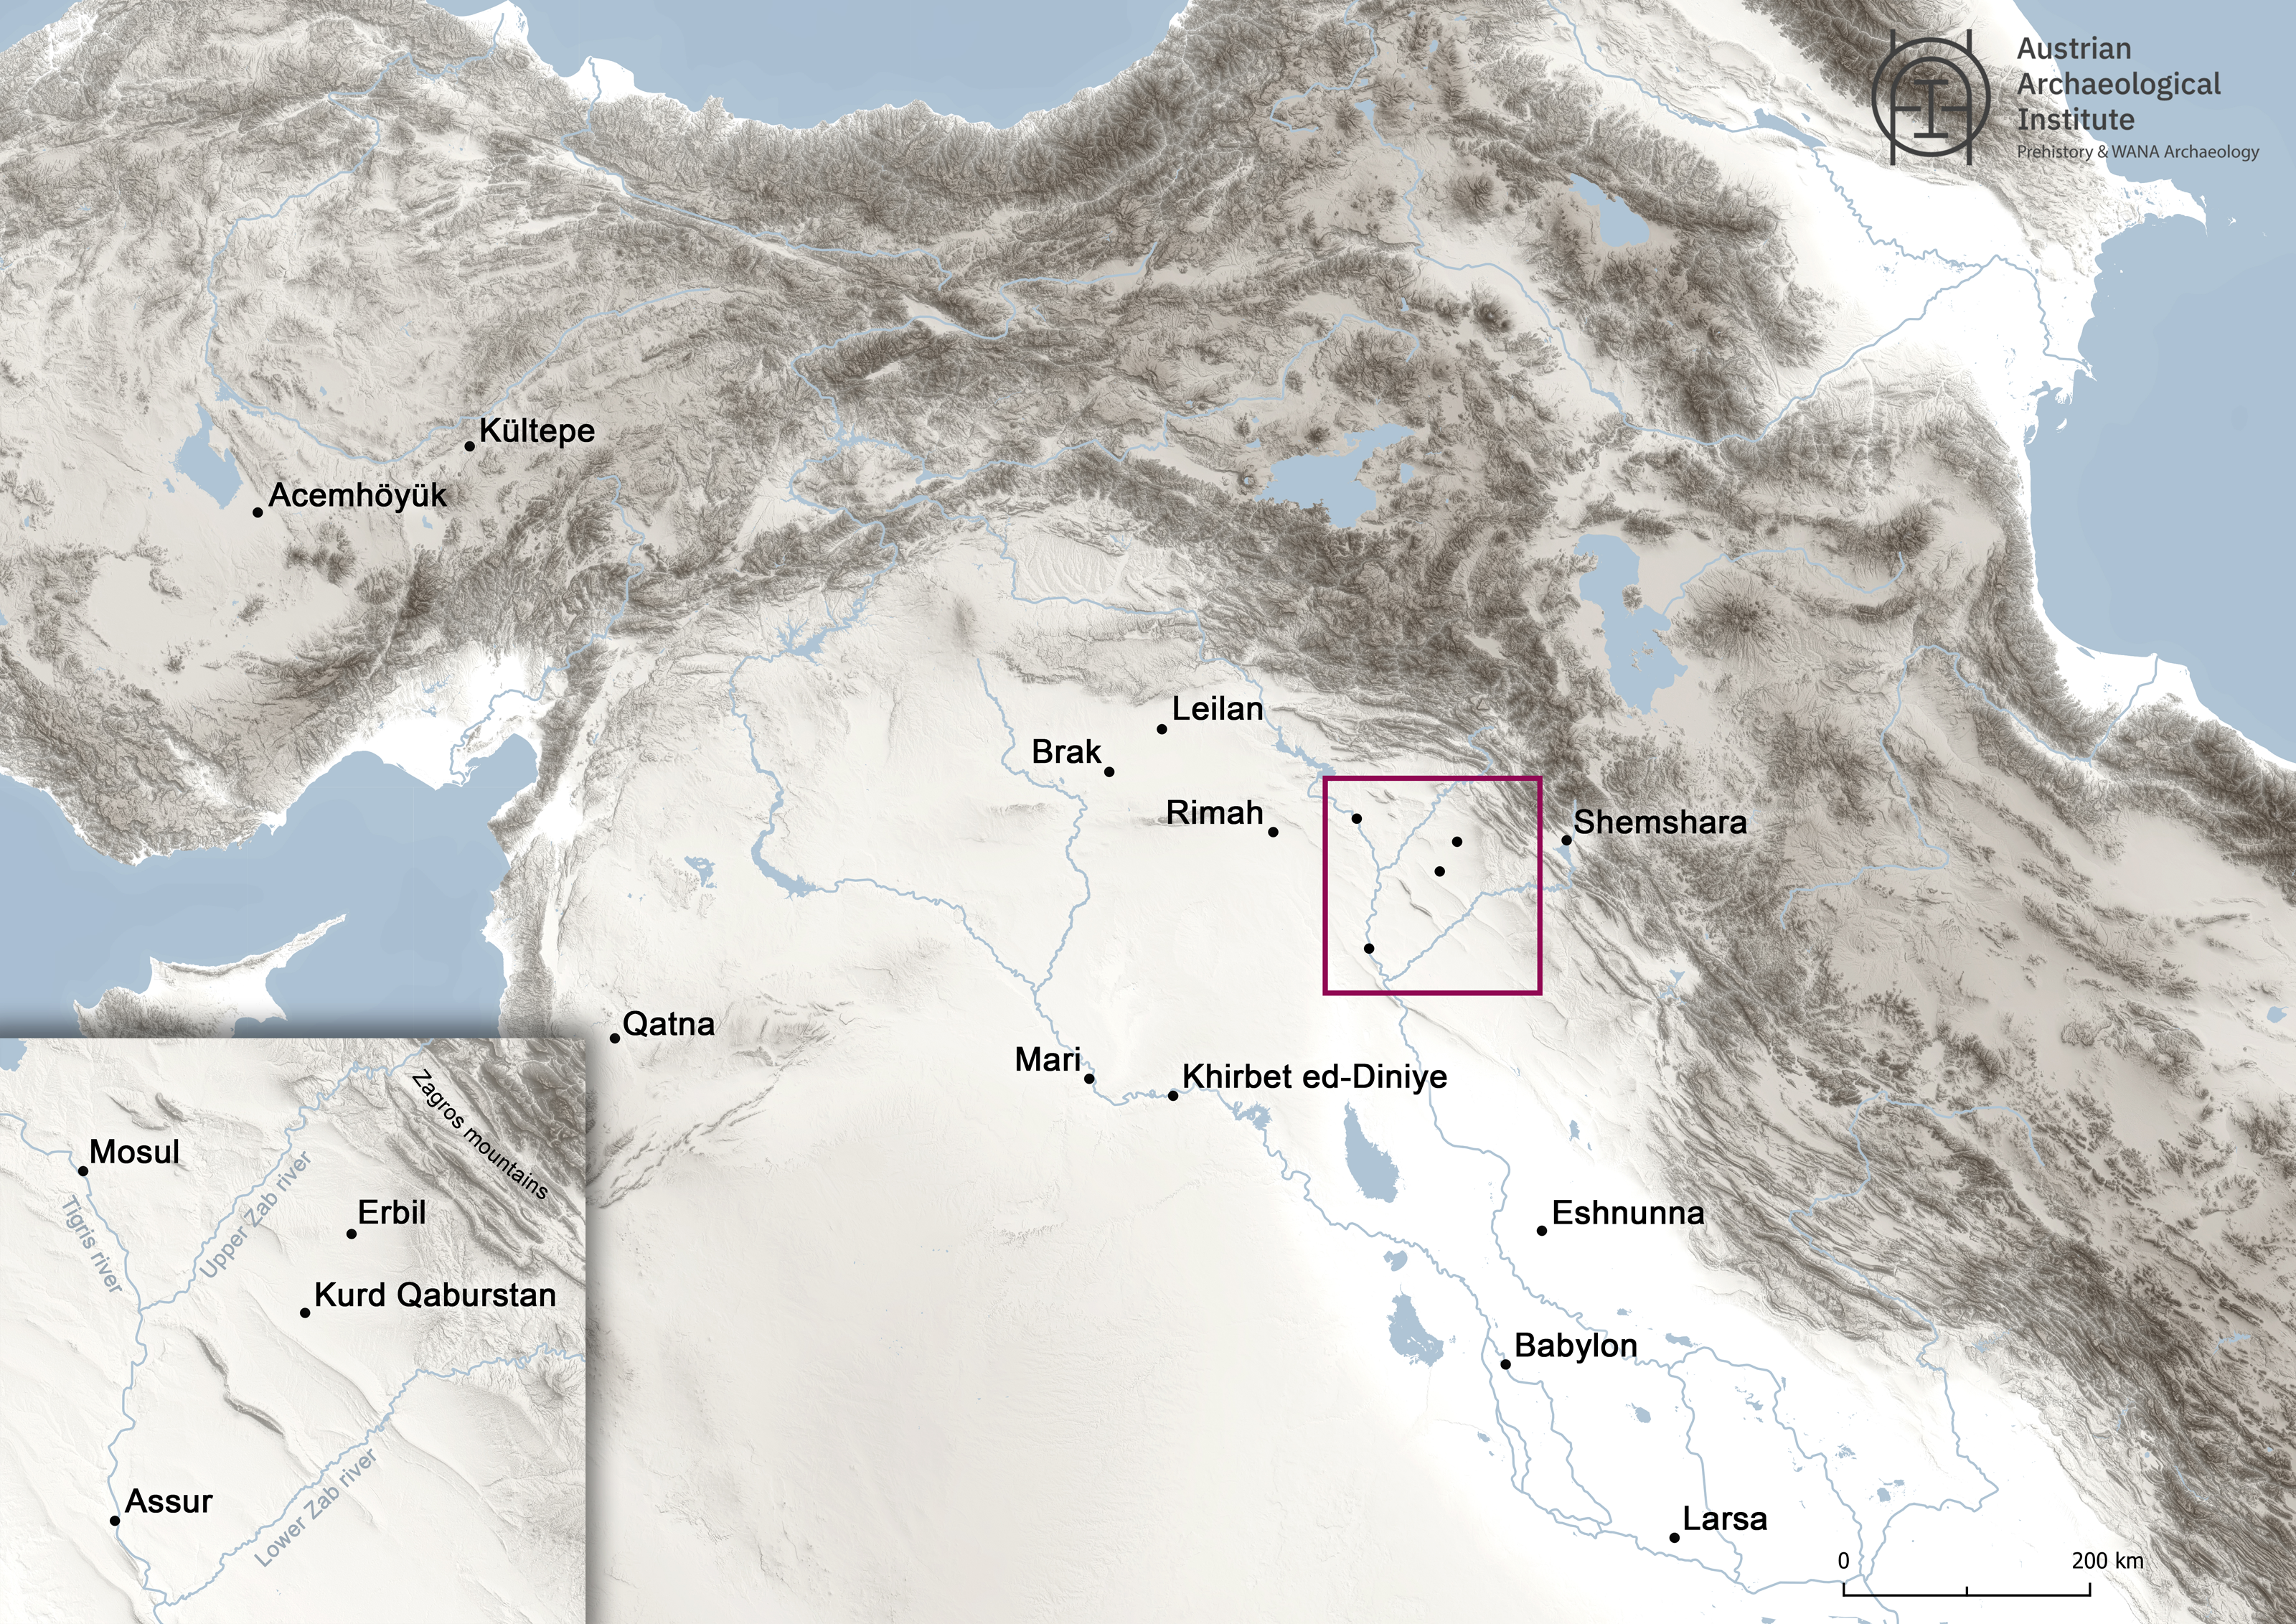
Twenty-two kilometers southwest of Erbil, Kurd Qaburstan is centrally positioned between the Tigris River (west) and the Zagros Mountains (east) and between the Upper and Lower Zab Rivers (north and south) (Figure 1). The ancient site consists of a central, 11-hectare high mound and an 84-hectare lower town, with the southeastern part of the lower town overlain by the modern village of Yedi Qizlar (Figure 2). Kurd Qaburstan was included in the 2012 Erbil Plain Archaeological Survey (EPAS) of Harvard University (Ur et al. Reference Ur, de Jong, Giraud, Osborne and MacGinnis2013), and since then has been explored through field excavations and geophysical survey by a team under the direction of Glenn Schwartz from Johns Hopkins University. Until now four field seasons have been completed (2013, 2014, 2017, 2022) and one study season (2016) (Schwartz Reference Schwartz, Kopanias and MacGinnis2016; Schwartz et al. Reference Schwartz, Brinker, Creekmore, Feldman, Smith and Weber2017, Reference Schwartz, Creekmore, Smith, Weber and Webster2022). Archaeological findings from the most recent (2022) season are only briefly mentioned here and will be presented in detail in future publications.
Location of Kurd Qaburstan and other sites mentioned in the text. (Map by M. Börner.)
Site layout of Kurd Qaburstan, with excavation areas and trenches of the Johns Hopkins expedition. LTNA =Lower Town North A, LTNB=Lower Town North B; HMNS=High Mound North Slope, HMSS=High Mound South Slope, HME=High Mound East, LTE=Lower Town East. The city wall is shown by a simple outline. Excavation areas with 14C data are marked: an asterisk (*) indicates dates from the MBA settlement, two (**) indicates dates from the LBA settlement.

Archaeological remains of the Middle–Late Bronze Age are of primary interest at Kurd Qaburstan, though hints of earlier epochs (e.g., Chalcolithic) and some in situ remains of later periods (e.g., Islamic) are known. Especially intensive occupation during the MBA is clear from surface survey and excavations, and geophysical survey by Andrew Creekmore has revealed a dense pattern of urban settlement across the lower town, encircled by a fortification wall with regularly spaced towers. During the MBA, the high mound hosted monumental and domestic architecture and appears to have had its own enclosure wall. In the subsequent LBA, the extent of the city reduced drastically, with occupation retracting to the high mound and northeastern lower town.
On account of the site’s prodigious size during the MBA, Kurd Qaburstan is tentatively identified with ancient Qabra (Ur et al. Reference Ur, de Jong, Giraud, Osborne and MacGinnis2013; Schwartz et al. Reference Schwartz, Brinker, Creekmore, Feldman, Smith and Weber2017), the capital of a kingdom based in the Erbil region (Charpin Reference Charpin2004; MacGinnis Reference MacGinnis2013). Qabra is best known in the context of a joint campaign by Shamshi-Adad I and his southern neighbor, Dadusha of Eshnunna, in 1773 BC (lower Middle Chronology) to conquer the region between the Upper and Lower Zab rivers. Two stone steles celebrate their defeat of king Bunu-Ishtar of Qabra (Ismail and Cavigneaux Reference Ismail and Cavigneaux2003; Schwartz Reference Schwartz, Aruz, Graff and Rakic2013). These events can also be traced in letters found at Mari and Shemshara (Charpin Reference Charpin2004). After the death of Shamshi-Adad, Qabra quickly regained its independence and maintained wide-ranging diplomatic relationships; from a Mari document, we even learn of a marriage between Qabra and the kingdom of Qatna in western Syria (Charpin Reference Charpin, Marti, Nicolle and Shawaly2015). Qabra disappears from the historical records after the Old Babylonian period, although “Baqarru” in Neo-Assyrian sources may be a later rendition of the same toponym (Deller Reference Deller1990).
SITE STRATIGRAPHY
Middle Bronze Age
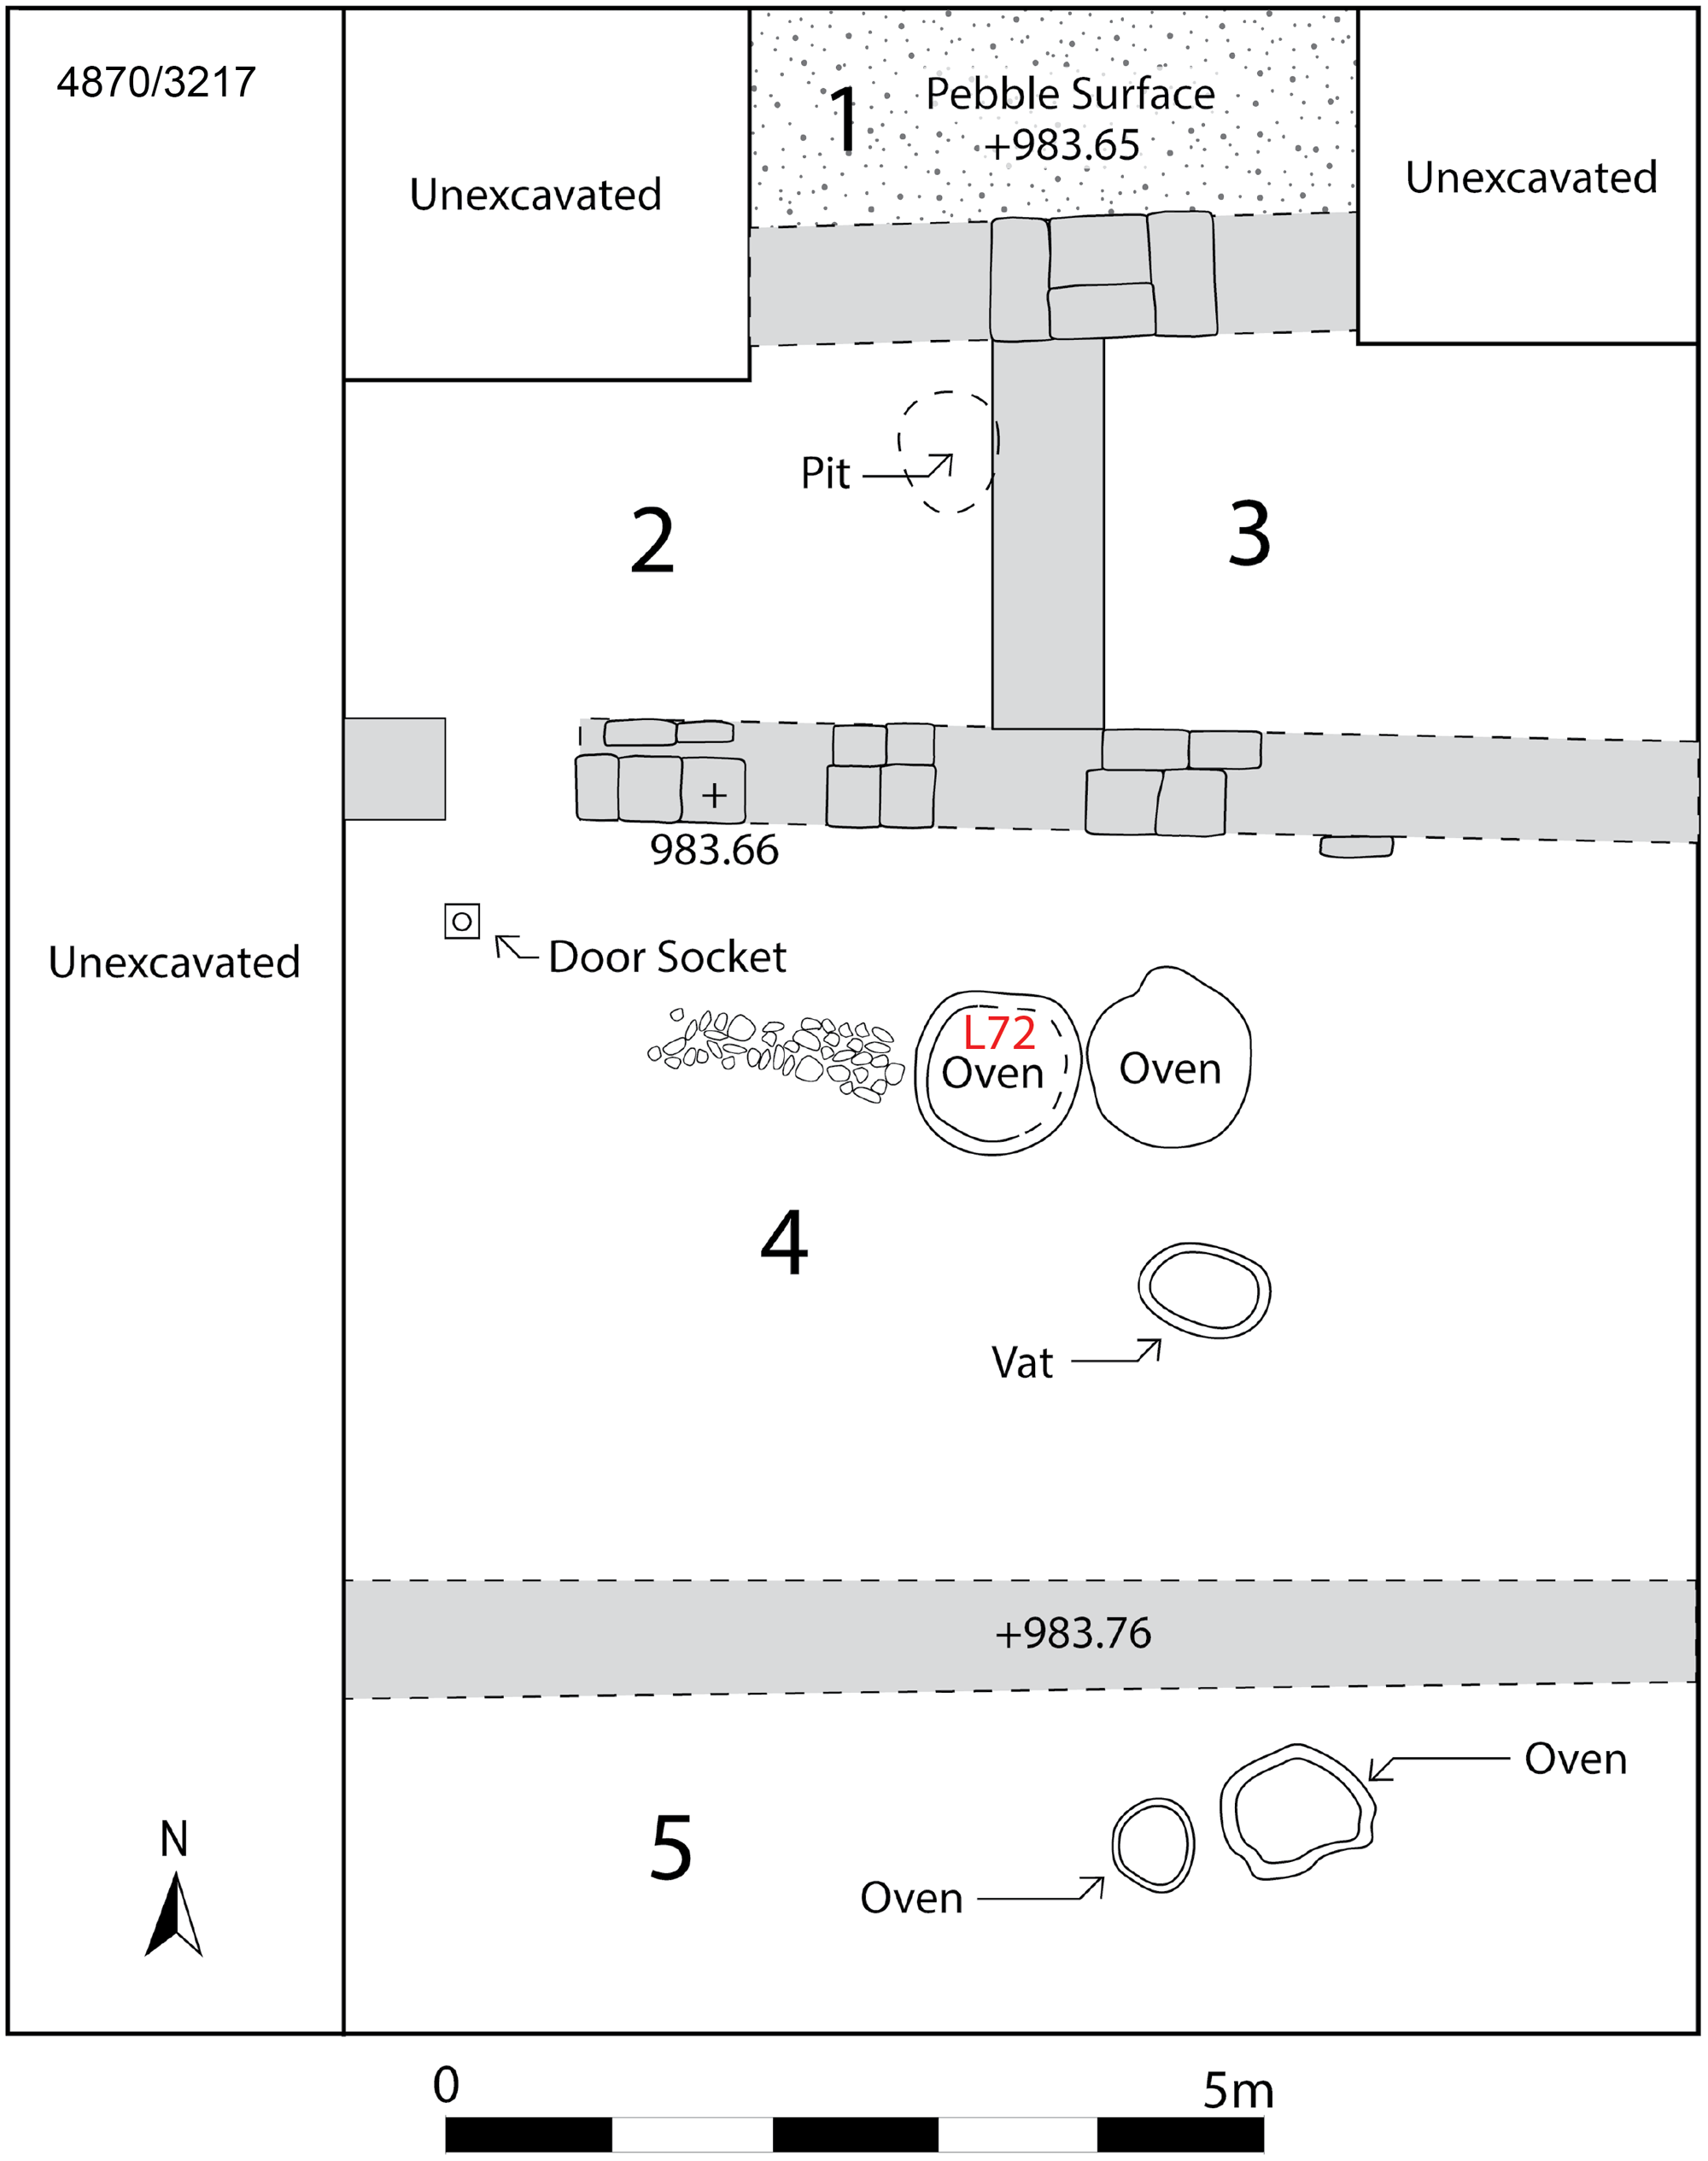
Only during the MBA was the entire lower town and high mound of Kurd Qaburstan occupied, as attested by remains exposed in multiple trenches across both localities (Figure 2, Table 1). In the lower town, in situ MBA remains typically appear just below the surface. Trenches excavated in the Lower Town North A (LTNA; trenches 4870/3225 and 4870/3217), yielded two MBA phases, the earlier phase (2) comprising outdoor surfaces and several rooms with clay ovens, a large vat and grinding stones (Figure 3). That food storage as well as preparation occurred in this building is indicated by the large quantity of in situ restorable storage vessels and kraters. A second (later) MBA occupation horizon with two subphases (1a–b) is more limited and includes surfaces, an oven and ceramic drain pipes. Excavation further east near the city gate in the Lower Town North B (LTNB; trench 5134/3350), also revealed a series of MBA phases (1–4) with surfaces and more limited architectural remains. Virgin soil was reached in the LTNB, showing that at least this part of the lower town was settled only during the MBA.
Stratigraphy of Kurd Qaburstan. 14C dated horizons are bolded. Chronological relationships between excavation areas are preliminary.

MBA domestic and storage area in the Lower Town North A (Phase 2). The location of Locus 72 (14C dated) is marked.
Geophysical survey, particularly magnetometry, revealed complex but well-ordered streets and urban neighborhoods inside the city wall; far from being a “hollow” city (cf. Ristvet Reference Ristvet, Laneri, Valentini and Pfälzner2012; Ur et al. Reference Ur, de Jong, Giraud, Osborne and MacGinnis2013), Kurd Qaburstan was densely inhabited. Magnetometry supplemented by excavation has revealed details of the city wall, its date confirmed by purely MBA material in the trenches sunk beside it (4666/3076, 4946/3454). In the eastern part of the lower town (LTE), magnetometry identified a temple, whose plan is paralleled by examples at Assur, Tell al-Rimah and Larsa (Schwartz et al. Reference Schwartz, Creekmore, Smith, Weber and Webster2022).
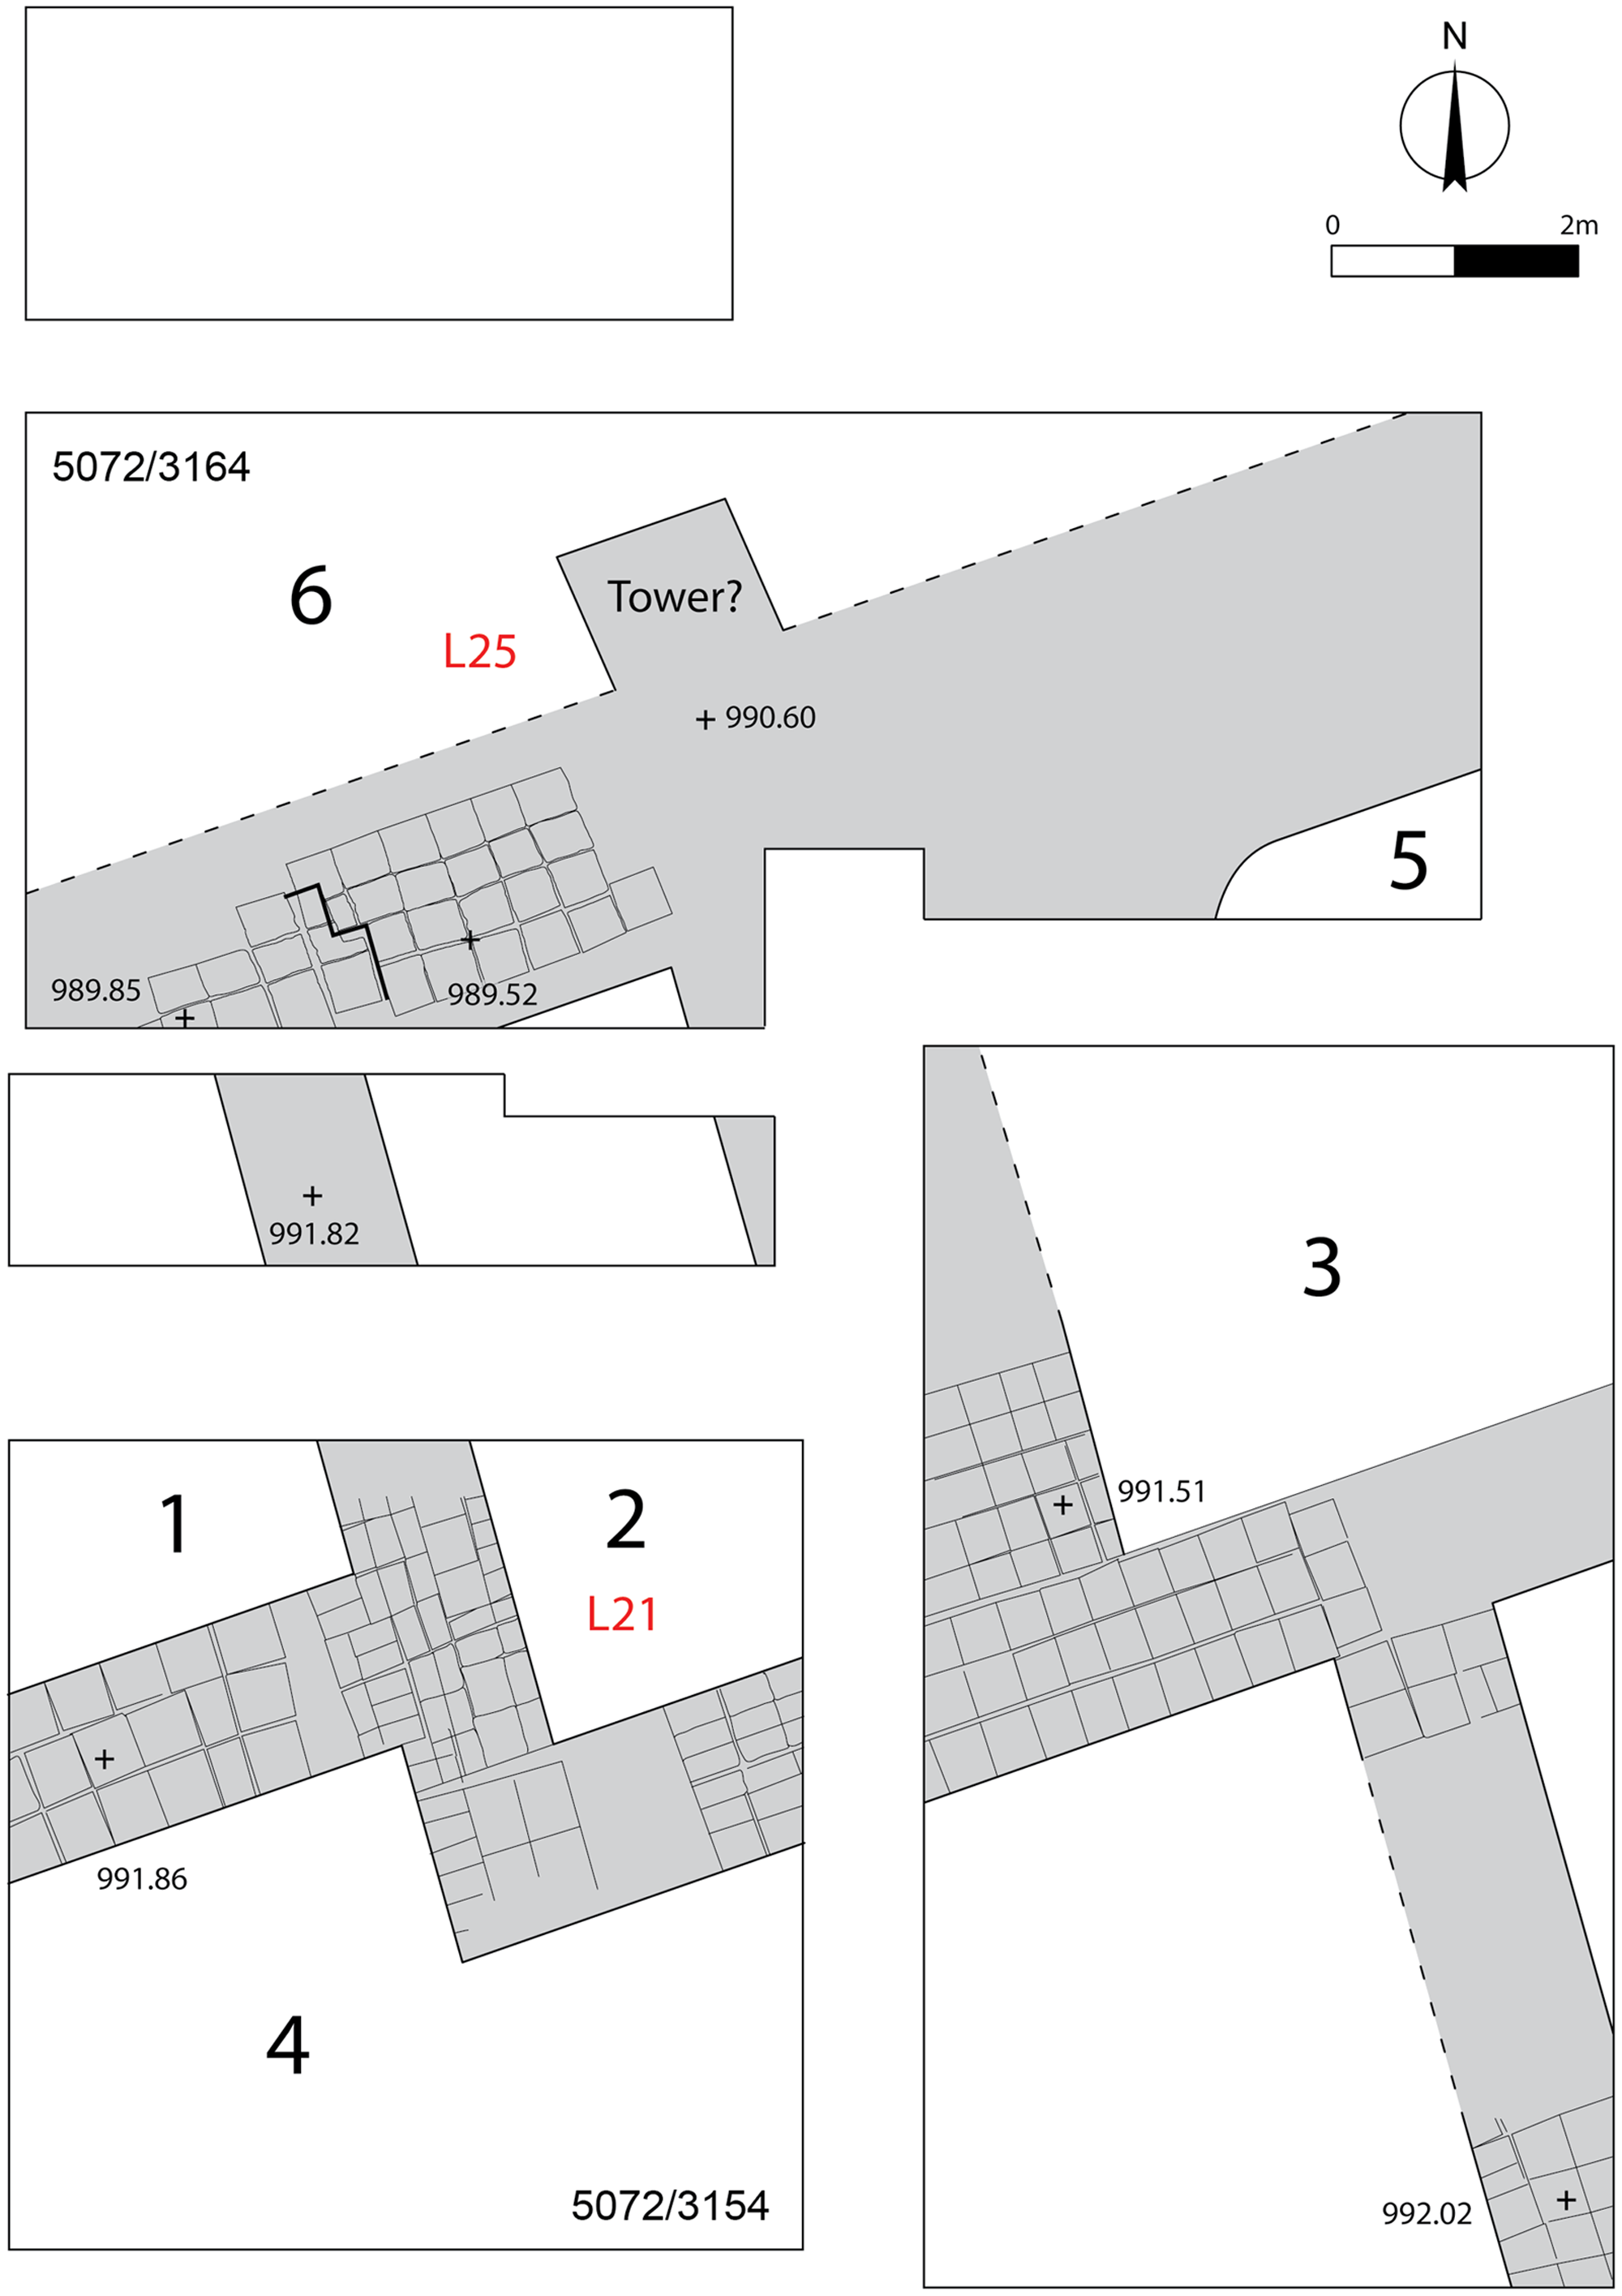
On the high mound, two phases of MBA domestic occupation have been exposed on the southern slope (HMSS; trenches 5065/2985, 5065/2973). The earlier features mudbrick architecture with complete pottery vessels, a bitumen-coated ceramic vat, and a baked brick drain, while the poorly preserved later phase includes only fragmentary architecture. On the northern slope (HMNS; trenches 5072/3154, 5072/3164, and 5078/3154), a step trench revealed large-scale architecture, including relatively thick-walled mudbrick architecture (higher step trench) and what appears to be an enclosure wall (lower step trench) (Figure 4). Excavation in the High Mound East (HME) during 2022 seems to have exposed a thick wall of the same MBA architectural horizon. That the MBA city was destroyed is suggested by quantities of burnt debris associated with both the large-scale building and enclosure wall on the HMNS and the thick HME wall. The same event might be reflected in the numerous in situ vessels found on surfaces of the lower town (LTNA Phase 2); if this is the case, then LTNA Phase 1 gives evidence of minor subsequent MBA occupation. Kurd Qaburstan’s MBA pottery is tentatively assigned to the middle part of the MBA, based on ample parallels with sites such as Mari, Khirbet ed-Diniye, Tell al-Rimah and Tell Leilan.
Large-scale building and probable enclosure wall of the MBA on the High Mound North Slope (Phase 2). Locations of 14C dated loci (21 and 25) are marked.
Late Bronze Age
The LBA occupation was restricted to the high mound and, as indicated by survey, probably the northeast part of the lower town. In trenches excavated in the east, north, and west parts of the high mound, stratified LBA remains have been encountered at shallow depth, overlain only by later (Achaemenid?) burials. The stratigraphy is best illustrated in HME trenches 5138/3051, 5133/3044, 5144/3044 and 5155/3044, where at least three architectural phases can be defined. The earliest distinct phase (3; Figure 5) has the character of an elite residence, with thick mudbrick walls, a bath-like feature, toilet and elaborate drainage system. The next phase (2; Figure S1a) comprises a mudbrick unit with lime-plastered walls and floors that was presumably used for craft production and domestic activities. The latest phase (1; Figure S1b) includes several fragmentary lime-plastered mudbrick walls, a lime-plastered floor, two burials, and a large pit containing ashy debris and over a hundred snail shells.Footnote 2 Abundant slag fragments in the debris of Phase 1 indicate pyrotechnic activity. Further excavation immediately south of trench 5155/3044 during 2022 revealed three, possibly four, LBA strata above the thick MBA wall mentioned above.
Late Bronze Age elite architecture on the High Mound East (Phase 3) with bath, toilet, and drainage system. Locations of 14C dated loci (21, 140 and 144) are marked.

The pottery of HME Phases 3–1 is similar, although a chronological progression is evident in the relative quantities of forms present. In total, the LBA pottery of Kurd Qaburstan suggests occupation primarily during the early part of this period.
14C SAMPLES AND MEASUREMENT
To form a preliminary 14C dataset (Table 2), samples were selected from botanical materials obtained via flotation from MBA and LBA contexts. The MBA samples come from the HMNS Phase 2 (three measurements) and LTNA Phase 2 (one measurement). In the former location, culm fragments were dated from two loci (5072/3154 L21, 5072/3164 L25), both representing burnt debris associated with the same large-scale mudbrick building (Figure 4), while in the LTNA a single sample of charred Vicia ervilia derives from an oven (4870/3217 L72; Figure 3).
14C dates from Middle and Late Bronze Age horizons of Kurd Qaburstan.

LBA chronology is addressed in the HME, where cereal grains were obtained from contexts of Phase 3 (5144/3044 L140 and L144; 5138/3051 L21; four measurements), from a horizon sandwiched between Phase 1 and 2 architectures (5155/3044 L46; two measurements), and from Phase 1 (5155/3044 L24 and L5; two measurements) (Figures 5 and S1). The grains come from ash-rich deposits or occupation debris within the buildings.
Accelerator mass spectrometry (AMS) 14C dating was carried out at the University of Groningen and ETH Zürich. Only single seeds or fragments were prepared for each measurement. At Groningen, samples were pretreated with an acid-alkaline-acid (AAA) protocol to remove carbon-bearing contaminants (Mook and Streurman Reference Mook, Streurman, Mook and Waterbolk1983; Dee et al. Reference Dee, Palstra, Aerts-Bijma, Bleeker, Bruijn Sd, Jansen, Kuitems, Paul and Richie2020), while at ETH Zurich the alkaline step was omitted. No difference due to pretreatment is evident when comparing the results, supporting the conclusions of Wild et al. (Reference Wild, Steier, Fischer and Höflmayer2013) that humic acids from such contexts yield reliable results.
The pretreated samples were combusted in an elemental analyzer (EA), and the resultant CO2 converted to graphite using the H2/Fe method. An isotope ratio mass spectrometer (IRMS) coupled to the EA measured δ13C for isotopic fractionation correction (Wacker et al. Reference Wacker, Němec and Bourquin2010b), and accelerator mass spectrometry (AMS) 14C analysis of the samples, along with standards and blanks, was made using a MICADAS (IonPlus®) accelerator (Wacker et al. Reference Wacker, Bonani, Friedrich, Hajdas, Kromer, Němec, Ruff, Suter, Synal and Vockenhuber2010a).
14C ages are reported in 14C years before present (BP) following international convention (Stuiver and Polach Reference Stuiver and Polach1977; Millard Reference Millard2014). Calibrated ages in calendar years were obtained using OxCal v 4.4.4 (Bronk Ramsey Reference Bronk Ramsey2009) and the IntCal20 calibration curve (Reimer et al. Reference Reimer, Austin, Bard, Bayliss, Blackwell, Bronk Ramsey, Butzin, Cheng, Edwards and Friedrich2020) interpolated to yearly intervals (Resolution = 1).
RESULTS
The independently calibrated dates form a coherent dataset consistent with the stratigraphy and relative ceramic dating (Figure 6). The four dates representing the MBA all point to the 19th and 18th centuries BC, with the three dates from the high mound spanning ca. 1875–1745 BC (68.3% high posterior density, hpd). Though physically separated, the contexts from the high mound and lower town do appear approximately contemporary. We must, of course, be aware that the MBA occupation probably extends earlier, since only the latest 1–2 phases are captured by current data.
Independently calibrated 14C dates from Middle and Late Bronze Age horizons, using OxCal v.4.4. Highest probability density (hpd) ranges at 68.3% and 95.4% are marked with bars below each result.

The LBA dataset from the HME primarily represents settlement during the second part of the 16th century and first part of the 15th centuries BC. Only GrM-19818 of Phase 3 appears to be an outlier, falling in the 17th century BC.Footnote 3 The LBA data may not have quite captured the earliest LBA in the HME, but there is nonetheless strong evidence of a major time gap between the MBA and LBA settlements.
To obtain more precise chronological information, the 14C data should be combined with the prior knowledge of stratigraphic order using a Bayesian approach (Buck et al. Reference Buck, Kenworthy, Litton and Smith1991, Reference Buck, Litton and Smith1992; Bronk Ramsey Reference Bronk Ramsey2009). In OxCal Model A (Figure 7), the LBA data is arranged in three sequential groups, while the MBA dates form a single phase. The MBA contexts from the HMNS and LTNA can only be correlated by pottery, and their precise relative order is unknown; however, we may be confident that both predate the LBA sequence in the HME.Footnote 4 Where archaeological horizons follow one another without any gap—notably the three LBA phases on the HME—single boundaries are applied. An extra boundary and empty phase allow for the absence of data for HME Phase 2, and for a substantial gap between the MBA and LBA settlements.
Bayesian 14C models, utilizing OxCal’s outlier analysis. Dates for key events and periods based on historical records and the lower Middle Chronology are shown for comparison. Model A: no offset. Model B: sensitivity test with a hypothetical 19 ± 5-yr offset. Individual probability distributions before and after modelling are shown in light and dark grey respectively, with bars below indicating 68.3% and 95.4% hpd ranges. Prior and posterior outlier probabilities are indicated in square brackets after the laboratory number, trench and locus. The OxCal code is provided in the supplementary material.

Despite careful selection of samples and contexts, it is difficult to wholly avoid risk of residual material. The Bayesian model uses OxCal’s outlier analysis functionality, with each date assigned a 5% “prior” probability of being an outlier. All dates with one exception provide a good fit within the model, as reflected by the calculated “posterior” outlier probabilities. Only GrM-19818 gave an elevated posterior outlier estimate (13%) and its influence is automatically down-weighted by the model. Wholly removing GrM-19818 from the model makes minimal difference to results but gives a narrower, more reasonable start boundary for HME Phase 3 (as opposed to spreading it across the 17th and 16th centuries BC); for this reason, we chose to exclude GrM-19818.
Model A obtains a somewhat narrowed estimate for the MBA occupation, favoring the late 19th and first part of the 18th centuries BC (Figure 7). The start of the later MBA horizon/s captured by the data is hard to estimate given the lack of a constraining earlier phase, but the destruction can be estimated at 1805–1733 BC (68.3% hpd; Table 3).
Modeled boundaries for MBA and LBA occupation at Kurd Qaburstan.
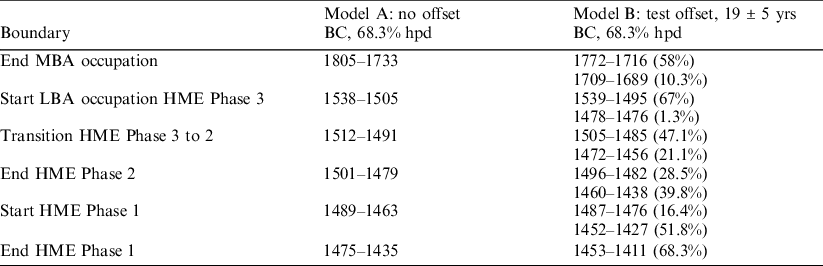
The start of LBA settlement at Qaburstan may not be quite captured by the current data, and the 2022 excavation could suggest one further phase. However, renewal of occupation evidently did not occur much before the second part of the 16th century BC: 1538–1505 BC (68.3% hpd; Table 3, start HME Phase 3). HME Phases 3–1 appear to cover not more than about a century, and the model yields precise estimates (within a few decades) for each transition. Phase 3 gave way to Phase 2 in 1512–1491 BC, Phase 2 ended 1501–1479 BC and Phase 1 began 1489–1463 BC (all cited at 68.3% hpd). The last LBA phase on the high mound came to an end 1475–1435 BC (68.3% hpd).
Recent studies of 14C measurements from known-age plants and dendrochronologically dated tree-ring series, including those underlying the IntCal13 and IntCal20 calibration curves, have identified small offsets that deserve brief consideration here. These arise because of minor regional effects, but also due to differences between new AMS 14C data and the “legacy” conventional 14C data that underlies much of the calibration curve. For the Levant and Egypt, comparison of AMS measurements of known-age samples with IntCal04 and IntCal13 initially suggested an average offset of ∼19 ± 5 years (Dee et al. Reference Dee, Brock, Harris, Bronk Ramsey, Shortland, Higham and Rowland2010; Manning et al. Reference Manning, Griggs, Lorentzen, Bronk Ramsey, Chivall, Jull and Lange2018), but in periods where the newly updated calibration curve (IntCal20) has been reinforced with high-resolution AMS data (e.g., 1700–1500 BC), the differences reduce to ∼12 ± 5 years (Manning et al. Reference Manning, Kromer, Cremaschi, Dee, Friedrich, Griggs and Hadden2020a, Reference Manning, Wacker, Büntgen, Bronk Ramsey, Dee, Kromer, Lorentzen and Tegel2020b; see also Brehm et al. Reference Brehm, Bayliss, Christl, Synal, Adolphi, Beer, Kromer, Muscheler, Solanki and Usoskin2021). The latter is considered mainly a regional effect, associated with growing season variation. Field crops with an earlier (spring–summer) growing season (e.g., cereals) record the cycle of atmospheric 14C concentration slightly differently than the central/northern European and North American trees that underpin the calibration curve.
To check for potential impact on our chronology at Kurd Qaburstan, we applied a 19 ± 5 yr offset in Model B (Figure 7, Table 3). This value was selected because our dates lie mainly before 1700 and after 1500 BC, in periods where IntCal20 still relies on legacy conventional 14C data.Footnote 5 In reality, the offset would have fluctuated a little over time, but in the absence of a detailed time series to trace it through the MBA and LBA, an average value of 19 ± 5 years provides a reasonable sensitivity test. Model B shifts more probability for the MBA settlement towards the mid-18th century BC and estimates destruction in the mid–late 18th century BC. There is minimal effect on the start of LBA occupation, but Phases 3–1 show increased probability near the mid-15th century BC.
DISCUSSION
While the quantity of 14C dates and the number of dated contexts at Kurd Qaburstan is currently modest, it provides a crucial first assessment of the site’s occupation history. The extensive MBA city can be securely placed close to 1800 BC, although it likely extended further back in the 2nd millennium BC based on underlying as-yet-undated MBA phases. Calamity apparently befell the city, resulting in its destruction by the mid-18th century BC (or possibly later in the century according to Model B). This 14C outcome fits comfortably with pottery analysis, which indicates a mid-MBA horizon, and is compatible with the site’s identification as Qabra (refer to Figure 7). It is conceivable that the burning of the large-scale building on the HMNS and/or the large in situ ceramic assemblage in the LTNA, might reflect the attack by Shamshi-Adad and Dadusha dated by textual sources to 1773 BC. Alternatively, the defeat of king Ardigandi and the pillaging of Qabra’s territory during the time of Mari’s Zimri Lim (1767–1753 BC) could also be fitting (MacGinnis Reference MacGinnis2013). Though highly speculative, we could suggest that the end of LTNA Phase 2 corresponds to Shamshi-Adad and the subsequent minor MBA settlement (LTNA Phase 1) reflects the post-Shamshi-Adad occupation. Widespread abandonment of the lower town and high mound could then be associated with the defeat of Ardigandi and the disappearance of Qabra from historical sources. A more finely resolved dating of Kurd Qaburstan’s MBA phases and further consideration of historical correlations will have to await further fieldwork and analysis.
Based on the current data and Bayesian model, the last MBA occupation may have been followed by a gap of some 200 years, between ca. 1750 and 1550 BC. Re-settlement on the high mound occurred by at least the late 16th century BC, with LBA occupation lasting until the mid-15th century BC. This is consistent with pottery analysis, which attributes the LBA assemblage of the HME to the early LBA. The settlement may in fact pre-date the region’s incorporation into the kingdom of Mittani, since historical evidence indicates that Assur and the Erbil region only came under its control in the later 15th century BC (Llop Reference Llop2011; MacGinnis Reference MacGinnis2014).
We can only make preliminary comments regarding how well the local evidence at Kurd Qaburstan fits with the various Mesopotamian chronologies. The 14C-dated MBA destruction seems more consistent with the Middle Chronology, taking into consideration historical links and the middle MBA character of the associated pottery. Also, LBA ceramic forms appearing already in the late 16th century BC does not favor ultra-low chronologies that would put the start of the LBA/Mittani period only after 1500 BC.
CONCLUSION
This paper presents an initial 14C-based chronology for the early–mid second millennium BC at Kurd Qaburstan on the Erbil Plain. The last phases of the bustling, fortified MBA city can be situated close to 1800 BC, with destruction/abandonment occurring by the mid- or late 18th century BC. The city never regained its extent and occupation density, and probably lay largely abandoned until the late 16th century BC. The LBA town that reemerged on the high mound can be quite precisely dated, with three phases lasting until the mid-15th century BC.
A comparison with historical records and the 14C-supported Middle Chronology shows that Kurd Qaburstan’s period of dominance on the Erbil plain corresponds to the time of Shamshi-Adad I and is compatible with an identification as ancient Qabra. The LBA town may pre-date incorporation of the Erbil Plain into the kingdom of Mittani, and the site apparently held little importance during the Mittani and Middle Assyrian periods.
Given the recent resurgence of fieldwork in Iraqi Kurdistan, we hope that the accumulating data at Kurd Qaburstan and other second millennium BC sites will soon lead to the development of an independent 14C-based chronology for northern Mesopotamia—one that can securely anchor the archaeological remains and facilitate more detailed comparisons with the region’s text-based history and political chronology.
ACKNOWLEDGMENTS
The authors would like to thank members of the Kurd Qaburstan Expedition, and staff of the University of Groningen and ETH Zurich AMS laboratories. LW was supported by Austrian Science Fund (FWF) START grant Y-932, “Tracing transformations in the southern Levant: from collapse to consolidation in the mid-second millennium BC”, directed by Felix Höflmayer. We are very thankful for the support of colleagues in the Antiquities Organization of the Kurdistan Region of Iraq, especially Kak Kayfi Mustafa, Director-General, Kak Mala Awat (Abubakir Othman), former Director-General, and Kak Nader Babakr, Director of Antiquities, Erbil. In the Erbil Department of Antiquities, we are also grateful to our representatives Kak Amir Karim Abdullah, Kak Gharib Ismail Bawa Murad, Kak Guran Muhammad Muhammad Amin, Kak Pishtiwan Ahmad Ibrahim, Kak Rojgar Rashid Hamed, Hiba Muhammad Abdul-Majid Xan, and Pawan Kamal Ahmad Xan. Funding for the expedition was provided by the National Science Foundation (grants BCS-1156171, BCS-1229061, Early Faculty CAREER grant 1054938), the National Geographic Society, the Johns Hopkins University, the University of Northern Colorado, the Metropolitan Museum of Art, GardaWorld International Protective Services, and the Arthur and Isadora Dellheim Foundation.
SUPPLEMENTARY MATERIAL
To view supplementary material for this article, please visit https://doi.org/10.1017/RDC.2023.36


 Open access