

INTRODUCTION
During the 1990s, anthropologists increasingly sought to understand the relationship between humans and space. This perspective, sometimes called the “spatial turn,” developed from ideas both within and beyond the discipline (Gregory Reference Gregory1994; Hayden Reference Hayden1995; Jackson Reference Jackson1984; Lawrence and Low Reference Lawrence and Low1990; LeFebvre Reference Lefebvre and Nicholson-Smith1991; Rapoport Reference Rapoport1969; Tuan Reference Tuan1977) and highlighted the ways in which buildings, landscapes, and other locales shaped people's practices and lives. As archaeologists embraced the spatial turn (see, for example, Ashmore and Knapp Reference Ashmore and Knapp1999; Tilley Reference Tilley1994), built environments or heavily modified landscapes became the center of attention and within those, buildings and other monuments dominated the spotlight. Pathways and open spaces, the topics of this article, received significantly less attention.
In this article, we explore pathways and open spaces in residential zones and treat them as components of pedestrian circulatory systems that reveal information about social life in cities. We compare data from two ancient cities—Angamuco in Michoacan and Chunchucmil in Yucatan—from parts of Mesoamerica rarely mentioned in the same breath: West Mexico and the Maya area. The relatively clear visibility of paths at Angamuco and Chunchucmil makes these two cities outliers where it is possible to reconstruct site-wide movement networks. Along with a handful of other Mesoamerican centers, such as Teotihuacan (Millon et al. Reference Millon, Drewitt and Cowgill1973), Cantona (García Cook Reference García Cook, Sanders, Mastache and Cobean2003), Mayapan (Pollock et al. Reference Pollock, Roys, Proskouriakoff and Ledyard Smith1962), and Nixtun Ch'ich' (Pugh and Rice Reference Pugh and Rice2017), we have the ability to create street maps for Angamuco and Chunchucmil, giving us a rare opportunity to study crucially important phenomena that usually remain invisible. These phenomena include how people's movements were channeled as they left their houses, the degree of centralization in the organization of urban mobility, the nature of social interactions afforded by the paths that people walk, and how paths create or maintain social identities. We focus on Angamuco and Chunchucmil because of our own extensive fieldwork at these two centers. Yet these analyses could profitably be expanded to other cities and we occasionally draw comparisons with these.
This article first looks at Chunchucmil and Angamuco individually and then compares them. As a first method of analysis, we used space syntax to look at the degree of integration and connectivity at Chunchucmil. We present the methodological details of this analysis in the section Space Syntax. Since space syntax does not actually reveal much new about the site (see below), we invest more heavily in a second method: analysis of the shapes, sizes, and other characteristics of the walking paths or streets (which we also call segments) and their intersections (which we also call nodes). Many of the intersections/nodes are precisely the kinds of open spaces that interest us. Regarding paths, we document variation in the widths and forms of paths and connect this variation to topographical constraints, logics of traffic management, processes of neighborhood identity formation, and inferences about the degree of centralization in city planning. With respect to open spaces, we document variation in form and size and connect these attributes to availability of terrain, the growth of path networks, and the purposeful provision of informal locales for mixed activities. We discuss additional details about these methods, developed by Solinis-Casparius (Reference Solinis-Casparius2019), in the section Segment and Node Analysis. We then compare Chunchucmil with Angamuco in terms of quantities, kinds, configurations, and sizes of pathways and open spaces in order to explore how a path network can constrain pedestrians and to study relations between population density and path density. We further infer differences in the location of informal activities and differences in the social experience of urban mobility.
CONCEPTUAL BACKGROUND
Pathways are sometimes seen not as purposefully built locales, but as byproducts, “grudgingly left over between a more or less disordered heap of buildings” (Mumford Reference Mumford1961:192). Paths are rarely seen as places where people reinforced social relations or were engaged for their creation. To some extent, the spatial turn has provided useful but mainly individualistic interpretations of moving through pathways as part of a phenomenological perspective (Edmonds Reference Edmonds1999; Tilley Reference Tilley1994) which has “experienced” criticism (i.e., Barrett and Ko Reference Barrett and Ko2009; Hodder Reference Hodder1999). When Mesoamerican archaeologists focus on open spaces, they usually study formal plazas—explicit architectural features delimited on most sides by buildings or walls—located at the center of sites (Ossa et al Reference Ossa, Smith and Lobo2017; Tsukamoto and Inomata Reference Tsukamoto and Inomata2014), without considering smaller, less-centralized open spaces in residential sectors.
The better-studied pathways in Mesoamerican cities tend to be causeways such as the raised stone sacbeob that often link ceremonial buildings in the Maya area (Keller Reference Keller, LeCount and Yaeger2010; Shaw Reference Shaw2008) or avenues such as the Street of the Dead in Teotihuacan (e.g., Flores Niño de Rivera Reference Flores Niño de Rivera2007; Morton et al Reference Morton, Peuramaki-Brown, Dawson and Seibert2012). Such pathways stand out for their formal construction systems and imposing dimensions, making them relatively easy to identify in the archaeological record. The paths that interest us differ and consist of the narrower, much more common, and much less thoroughly constructed routes that penetrate residential areas and articulate them within their cities. Though remote sensing and broad excavations in other parts of the world have revealed large path networks, archaeologists in Mesoamerica rarely find these kinds of paths, except when using intensive methods at small scales (see, for example, Robin Reference Robin2002:257). The excellent visibility of paths at Angamuco and Chunchucmil allow us to study the phenomena mentioned above: how people circulated through their cities, the degree of centralization in the construction of pedestrian networks, and the social relations and identities enabled by walking routes.
The open spaces that we explore consist not of major, formally built plazas or marketplaces, but rather spaces among or in between residential areas where a path widens, or where several paths intersect. Such open spaces are usually not paved or even leveled. Therefore, like paths, they are normally difficult to find, but can be discerned at Angamuco and Chunchucmil. Such spaces are a vital component of urban development and need to be explored systematically. They may seem incidental or accidental patches of ground not yet claimed or put to use. Yet given the high population densities and urban nature of these two cities, open spaces were most likely “consciously sustained in comparison to emptiness in a village or rural setting where open space is a simple correlate of low population densities” (Smith Reference Smith2008:222). Such spaces could be considered focal nodes of ancient neighborhoods (Chase Reference Chase2016; see Hutson [Reference Hutson2016] for detailed discussions of neighborhoods at Chunchucmil and Fisher and Leisz [Reference Fisher, Leisz, Comer and Harrower2013] for neighborhoods at Angamuco). Following Manuel Castells, Blanton and Fargher (Reference Blanton and Fargher2016:186) refer to these areas as spaces of collective consumption and note that they may support the goals of collective polities. As Stark (Reference Stark, Creekmore and Fisher2014:397) wrote, “our grasp of the spatial framework of ancient complex societies remains incomplete without more consideration of open spaces.” Our grasp of the social framework likewise remains incomplete simply because a large variety of activities take place in these open spaces, including games, gossip, trade, meetings, feasts, crafting, weddings, rest, and more (Smith Reference Smith2008:217; Wynne-Jones and Fleisher Reference Wynne-Jones, Fleisher, Creekmore and Fisher2014). Even if we cannot recover some of these activities through archaeological evidence, neglecting these spaces entirely will impoverish any account of how people created cities and lived in them.
Pathways and open spaces are fundamental components to understand the social and spatial development of urban centers. As we discuss below, space syntax at Chunchucmil confirms that residential neighborhoods are not better integrated with the site center than with each other. Similarly, closeness analysis at Angamuco shows that neighborhoods might be better integrated inward than to central areas of the site (see Solinis-Casparius Reference Solinis-Casparius2019). Yet other ways of analyzing paths and open spaces allow us to understand urban growth trajectories, neighborhood-level variations, and, in some cases, individual decision-making. Looking at paths and open spaces well beyond site centers helps us to identify and evaluate evidence of movement, settlement, and interaction occurring from the bottom-up. By studying variation in paths and open spaces within and between cities, we learn a bit about, to use a phrase that occasionally infuriates empiricists, “what life was like” (Fisher and Creekmore Reference Fisher, Creekmore, Creekmore and Fisher2014:22). Indeed, we make the case that the properties of paths and open spaces can tell us about the experience of ancient actors. This approach falls in line with de Certeau's (Reference de Certeau and Rendall1984) exhortation to move away from the totalizing simulacra of the map—the view from above—and attend to what happens on the ground as people move through the city (see also Robin Reference Robin2002, Reference Robin2013). Importantly, when we refer to “experience,” we speak less of, for example, how a Neolithic pastoralist feels when confronted by a third millennium menhir, and more of the general process through which built environments affect behavior (Rapoport Reference Rapoport and Kent1990:11; Smith Reference Smith2011). Even so, we heretofore avoid the word “behavior” and instead use “action” to emphasize the social consequences of what takes place on paths and open spaces. One of the most significant of these actions—walking—requires further consideration.
Walking in cities, what Corfield (Reference Corfield1990:132) called the “art of urban ambulation,” can be a rich sensory and psychological act, replete with “crowds, crushes, high hopes, hard paving stones, sore feet, strange encounters and street wisdom.” There is a large literature on the pedestrian experience in urban settings, even if we limit ourselves to a single city and time, such as Corfield's eighteenth-century London (Carter Reference Carter2008; Corfield Reference Corfield1990; Gehl Reference Gehl1987; Hitchcock Reference Hitchcock2004; Rydén Reference Rydén2012; Shoemaker Reference Shoemaker2004). This literature establishes a number of points, many of which resonate for Prehispanic Mesoamerican cities.
First, walking in cities is intersubjective. It brings together strangers of different gender, age, and economic background, and permits evaluation of others and self-reflection (Carter Reference Carter2008:3–8). Walking communicates—sometimes intentionally, sometimes unintentionally, sometimes both (Amato Reference Amato2004:2–8). Particular gaits and speeds, as well as where one looks and what one does with the arms and hands, can encode anything from cultural norms to individual moods. Walking and how one appears (via dress, ornamentation, body modification) while doing so perform identity and provide opportunities for self-aggrandizement. Walking therefore makes and reinforces intersubjective relations of equality, inequality, and other forms of difference, while also allowing for the creation of bonds across social divides. Though we cannot detect different kinds of walking in the archaeological record, the notion that walking is intersubjective is worth considering because intersubjectivity contributes to the creation of different forms of identity (ethnicity, occupational affiliation, social class), which in turn influences how social groups settle and map onto the city. Pathways and open spaces play an important role as settings for socialization in all settlement contexts, and particularly in cities with high population densities (>2,000 people per km2), such as those of Angamuco and Chunchucmil.
Second, walking among other people in a public space is not just a form of transit, but a potentially enjoyable experience in its own right. Busy places expose pedestrians (or idlers) to an array of unexpected events and compellingly different people and fashions. To assure our readers that this study is not merely a modern take on walking, we refer to ethnohistoric documents from sixteenth-century central Mexico. Spanish descriptions of Aztec marketplaces capture some of the excitement of these exposures, including flirtation, gossip, ribaldry, fights, punishments, displays of wealth, and more. Many people strolled in the market not to sell or buy, but for mere pleasure (Clendinnen Reference Clendinnen1991:47–48, 159; de Zorita Reference de Zorita1942:86; Durán Reference Durán1951:216–217; Torquemada Reference Torquemada1943:556). Moreover, during the sixteenth and seventeenth centuries, the Spanish Crown incorporated the land tenure system of ejido (McBride Reference McBride1923) as a way to formalize communal areas (such as open spaces) for public uses, such as hanging out, resting, and informal trade. Pedestrians and idlers convened in these areas. Of course, crowded streets had downsides, as highlighted in eighteenth-century London by abundant characterizations in poetry, novels, and even guides to newcomers. One such guide carried the title “Villainy Unmask'd Containing an Ample Discovery of the Many Surprising Tricks now Practiced by Rogues …” (Corfield Reference Corfield1990:138). Of course, London is very different from pre-Hispanic Mesoamerica. Though we mostly lack ethnohistoric documentation of Conquest-era street behavior for Mesoamerica, information on Aztec marketplaces conveys the potential for trickery surrounding interactions with strangers. Such markets had thieves, deceptive merchants, and other cheats, but also officials who patrolled the aisles, destroying false measures and apprehending swindlers (Cortés Reference Cortés1928:85; Sahagún Reference Sahagún1952–1980:65–67). Though street sharks targeted newcomers, growing cities in Mesoamerica depended on new arrivals for many reasons (Cowgill Reference Cowgill2015; Hutson Reference Hutson2016; Storey Reference Storey1992), and this must have resulted in a general tolerance and acceptance of strangers, as well as attempts to keep them safe (see also Corfield Reference Corfield1990:153–155). Pathways and open spaces had the potential for varied users and experiences beyond simply communication and movement.
In this article the archaeological evidence largely prevents us from documenting the many actions and actors using paths and open spaces. In fact, much of our data consists of rigidly quantified measures of spatial forms, areas, lengths, and widths—measures which can test relations within and between variables to uncover patterns in how people built and walked in their cities. Nevertheless, it is necessary to approach ancient pathways and open spaces with the understanding, grounded loosely in the ethnohistoric material, that walking paths and occupying open spaces were not merely empty actions, but rather social experiences with a variety of possible outcomes, some unintended, some positive, some negative. Thus, as we analyze paths and open spaces at Angamuco and Chunchucmil, we keep in mind the way that the characteristics of spatial features shape opportunities for social interaction.
BACKGROUND ON ANGAMUCO AND CHUNCHUCMIL
Angamuco (Figure 1) is located on the eastern edge of the Lake Patzcuaro Basin in western Mexico, about 5 km from Tzintzuntzan, the last capital of the Purépecha Empire. The site was first documented during a survey and LiDAR scanning project directed by Christopher Fisher in 2009 (Fisher Reference Fisher2011). A dedicated analysis of the road network was then directed by Solinis-Casparius in 2016. The site was originally settled during the Early Classic period (ca. a.d. 250), but then saw several episodes of urbanization through the Early and Late Postclassic periods (Cohen Reference Cohen2021). Preliminary results indicate that during its incorporation into the Purépecha Empire (ca. a.d. 1100–1530), Angamuco could have had a population of over 30,000 inhabitants, an extensive built environment containing over 40,000 architectural features situated on a malpaís (mid-Holocene lava flow), with an overall size exceeding 12 km2. The rugged terrain and shallow soil deposits have proven unsuitable for destructive modern agriculture or settlement, which makes the overall urban layout (architecture) and road network identifiable on the surface (Fisher and Leisz Reference Fisher, Leisz, Comer and Harrower2013; Fisher et al. Reference Fisher, Cohen, Solinis-Casparius, Pezzutti, Bush, Forest and Torvinen2019). The site continued to be inhabited several decades after the European conquest of the Purépecha Empire in 1530 and was fully abandoned sometime in the late sixteenth century.
(a) Map of immediate area around Chunchucmil, including some archaeological sites nearby; (b) map of immediate area around Angamuco, including other Purépecha sites; (c) location in modern Mexico of Angamuco, Chunchucmil, and other sites mentioned in the text. Maps by the authors.

A unique characteristic of Angamuco is its seeming lack of a core ceremonial center. Instead, Angamuco shows over 650 clusters of houses that we call complejos, some built atop human-made platforms and others taking advantage of the topography. Complejos have a combination of habitational and other functional architectural features, such as patios, water tanks, and wells. Complejos are bounded by a combination of topographic features (e.g., ridges), architectural structures (e.g., walls, terraces), and, in some cases, pathways. Each complejo seems to have at least one formal entrance facing an adjacent pathway in the form of a short staircase or ramp that connects to the path network. Scattered around the site there are several public buildings like pyramids, multi-room buildings, and plazas, some of them at open spaces (Fisher et al. Reference Fisher, Cohen, Solinis-Casparius, Pezzutti, Bush, Forest and Torvinen2019). We suggest that these features functioned as shared political and religious centers and helped to organize the population into a decentralized community of about 70 neighborhoods or districts. While there is not an apparent standardization of complejo or neighborhood sizes, and public-building complexes are not always located at the centroid of neighborhoods, the path network connects all these features throughout the site. Thus, it is possible that certain open spaces and public buildings within neighborhoods acted as focal nodes within Angamuco.
This urban model resembles the Purépecha city model, described as districts defined by task specialization, class, and ethnicity (Pollard Reference Pollard, Sanders, Mastache and Cobean2003). In between complejos there are several unclaimed areas, like terraces, open spaces, and paths. Throughout the site there is a complex network of more than 3,000 pathways of different dimensions and constructions systems (e.g., elevated, walled, paved, curbed, and simple trails), which, together with other movement infrastructure (e.g., ramps, stairs), connect all areas of the site (Solinis-Casparius Reference Solinis-Casparius2019). The path network indicates that the shape of the city is largely defined by the natural topography and not by the location of important features. The ruggedness of the terrain means that many pathways are sloped. In general, pathways help to define and lead to formal entrances into complejos, and lead out of the city and into the lake basin and other water reservoirs. Circulation within complejos was formalized through passages and corridors, although they have not been thoroughly mapped.
The classification of pathways for Angamuco is based on shape, slope, and experiential factors, but the most meaningful types are based on their width or the number of pedestrians that could fit abreast at the same time. These are: (1) pasillos (one user), (2) senderos (up to three users), (3) caminos (four users), and (4) calzadas (more than four users). Importantly, the analysis of pathways at Angamuco also included the crossroads, or nodes, which we organized according to their size, form, topology and the number of segments they connect.
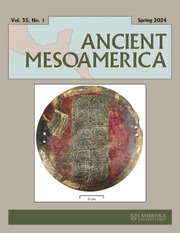
Chunchucmil (Figure 1) is located in the northwest corner of the Yucatan Peninsula in the driest area of the Maya world (Dahlin and Ardren Reference Dahlin, Ardren, Masson and Freidel2002). Dahlin began research at the site in the 1990s and was later joined by Ardren as co-director. The city reached its maximum population—between 31,000 and 47,000—in the sixth century a.d. (Hutson et al. Reference Hutson, Magnoni, Ardren, Blackmore and Hutson2017). At this time, Chunchucmil had a booming marketplace at the site center and relied, in part, on long-distance trade to feed itself (Dahlin Reference Dahlin2009). Chunchucmil differs from most other Maya cities because of its high population density (above 3,000 people per km2 in its 5.85 km2 residential core). The site map in Figure 2, which shows only architecture and causeways, highlights this high density and can be juxtaposed with Figure 3, which shows the street segments and nodes, along with the sizes of some of the largest nodes. Unlike Angamuco, Chunchucmil has a cluster of monumental architecture at the center of the site. One architectural compound at Chunchucmil is larger and more complex than the others, but other data suggest rule by council as opposed to dynastic rule typical of other Maya centers (Dahlin Reference Dahlin2009). Unlike most other Classic-period Maya sites, Chunchucmil lacks a clear central plaza. Chunchucmil has two major kinds of paths: (1) straight, wide (averaging 10 m) causeways, usually built to a height of 50 cm or more, and (2) narrower, wavy paths that we call streets (callejuelas in Hutson and Magnoni Reference Hutson, Magnoni and Hutson2017). Because the terrain at Chunchucmil is mostly flat (unlike Angamuco), no paths have any appreciable slope. The causeways link the monumental compounds, whereas streets connect houselots with other parts of the site. Street boundaries consist of parallel lines of stones (called albarradas), which in some cases stood several courses high. In contrast to causeways, most streets have no elevation—people walked on the minimally modified ground surface—though some streets had a low layer (usually < 20 cm) of gravel and cobbles. We call these cobbled streets (chichbes in Hutson and Magnoni Reference Hutson, Magnoni and Hutson2017). Streets generally connect house compounds with the site center and the periphery in a radial, hub-and-spoke pattern in which the site center is the hub. LiDAR data from Mayapan (Hare et al. Reference Hare, Masson and Russell2014) show that its main streets also follow a hub-and-spoke pattern, connecting the site core to the gates in the city wall. Such a hub-and-spoke pattern differs dramatically from the orthogonal layout at Teotihuacan. We identified 14 major spokes at Chunchucmil (Hutson and Welch Reference Hutson and Welch2016:103). The albarradas that mark the sides of streets usually also mark the boundaries of houselots at Chunchucmil. Many houselots have their own short street—a bit like a driveway—that connects the architecture at the core of the houselot with the street (or cobbled street) at the edge of the houselot. We call these alleys (callejón in Hutson and Magnoni Reference Hutson, Magnoni and Hutson2017). In a sense, alleys are dead-ends and were probably semi-private. Whereas people paved causeways with plaster, the surfaces of Chunchucmil's streets and alleys remained uneven, therefore demanding attention to footing (Ingold Reference Ingold2004). It appears that most Maya walked barefoot. Artists usually portrayed all manner of people (warriors, hunters, courtiers, market vendors) as barefoot on painted pots and murals (Carrasco Vargas and Cordeiro Baqueiro Reference Carrasco Vargas, Baquiero, Golden, Houston and Skidmore2012; Kerr Reference Kerr1989).
Map of Chunchucmil showing architecture in black. The mapped area consists of approximately 9.3 km2. Map by the authors.
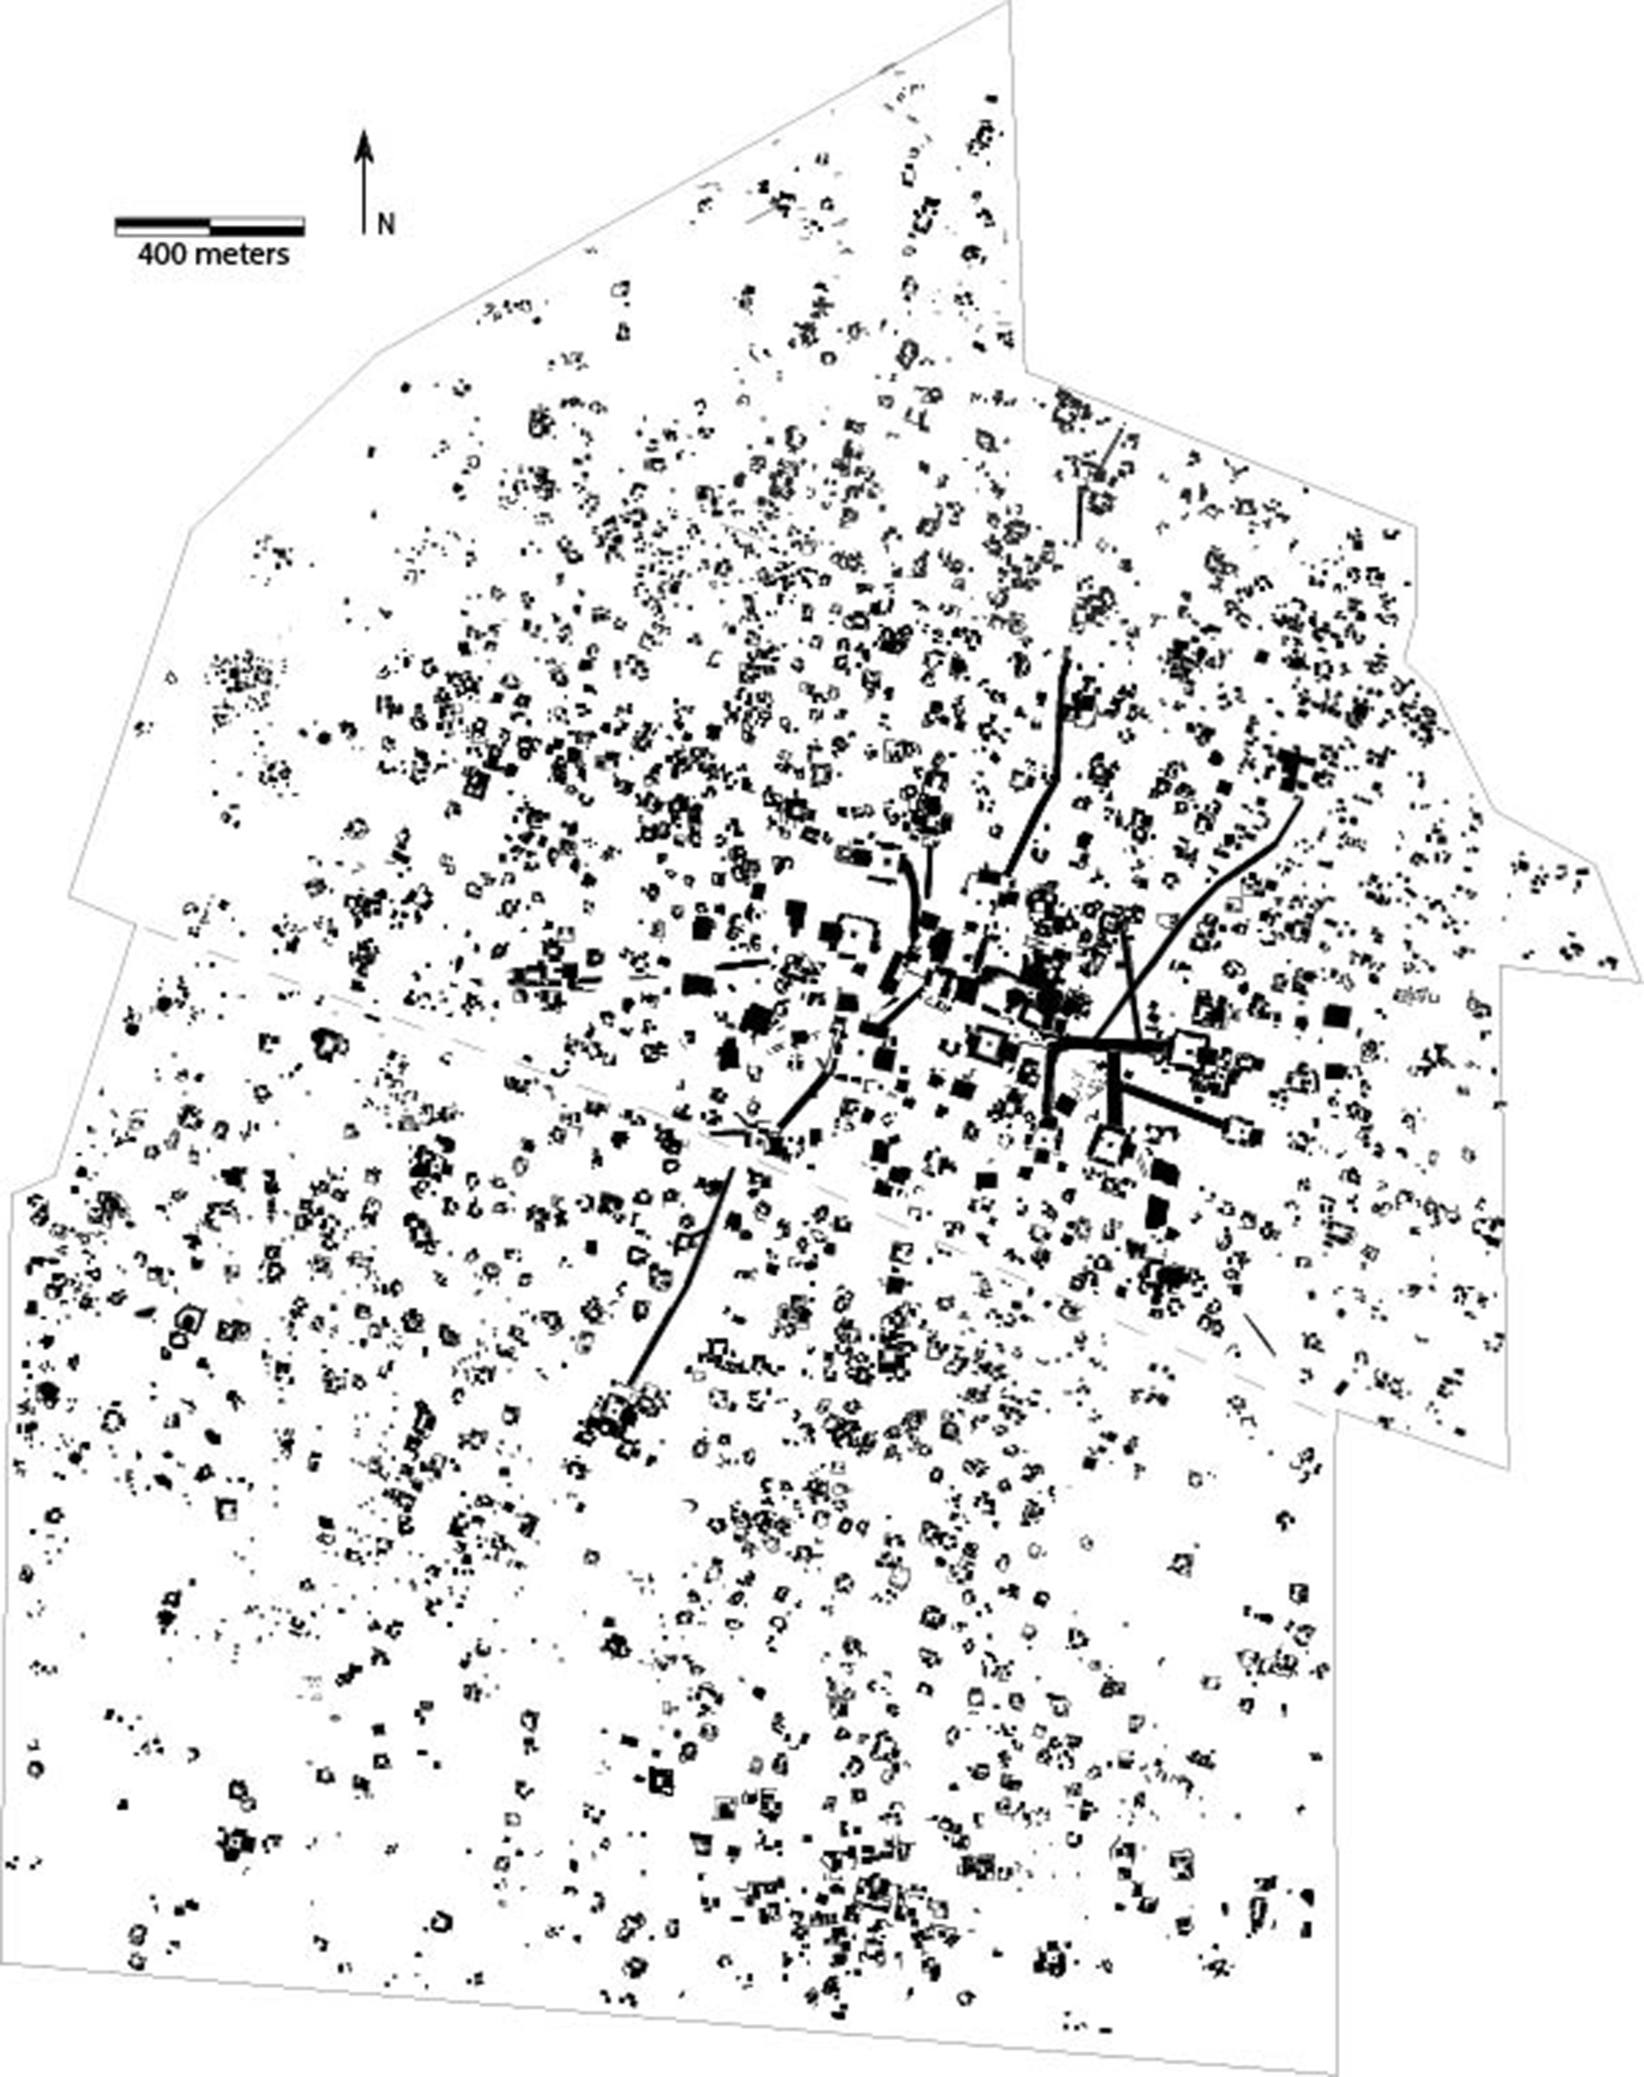
Network of paths/segments and intersections/nodes at Chunchucmil, showing the sizes of the largest nodes/open spaces. At the spot marked by an “x” (right of the “o” in the label “Spoke 12”), the segment may in fact be blocked, making it more dubious than other segments. The area inside the dashed circle represents a dense cluster of architecture (see Figure 2). Map by the authors.
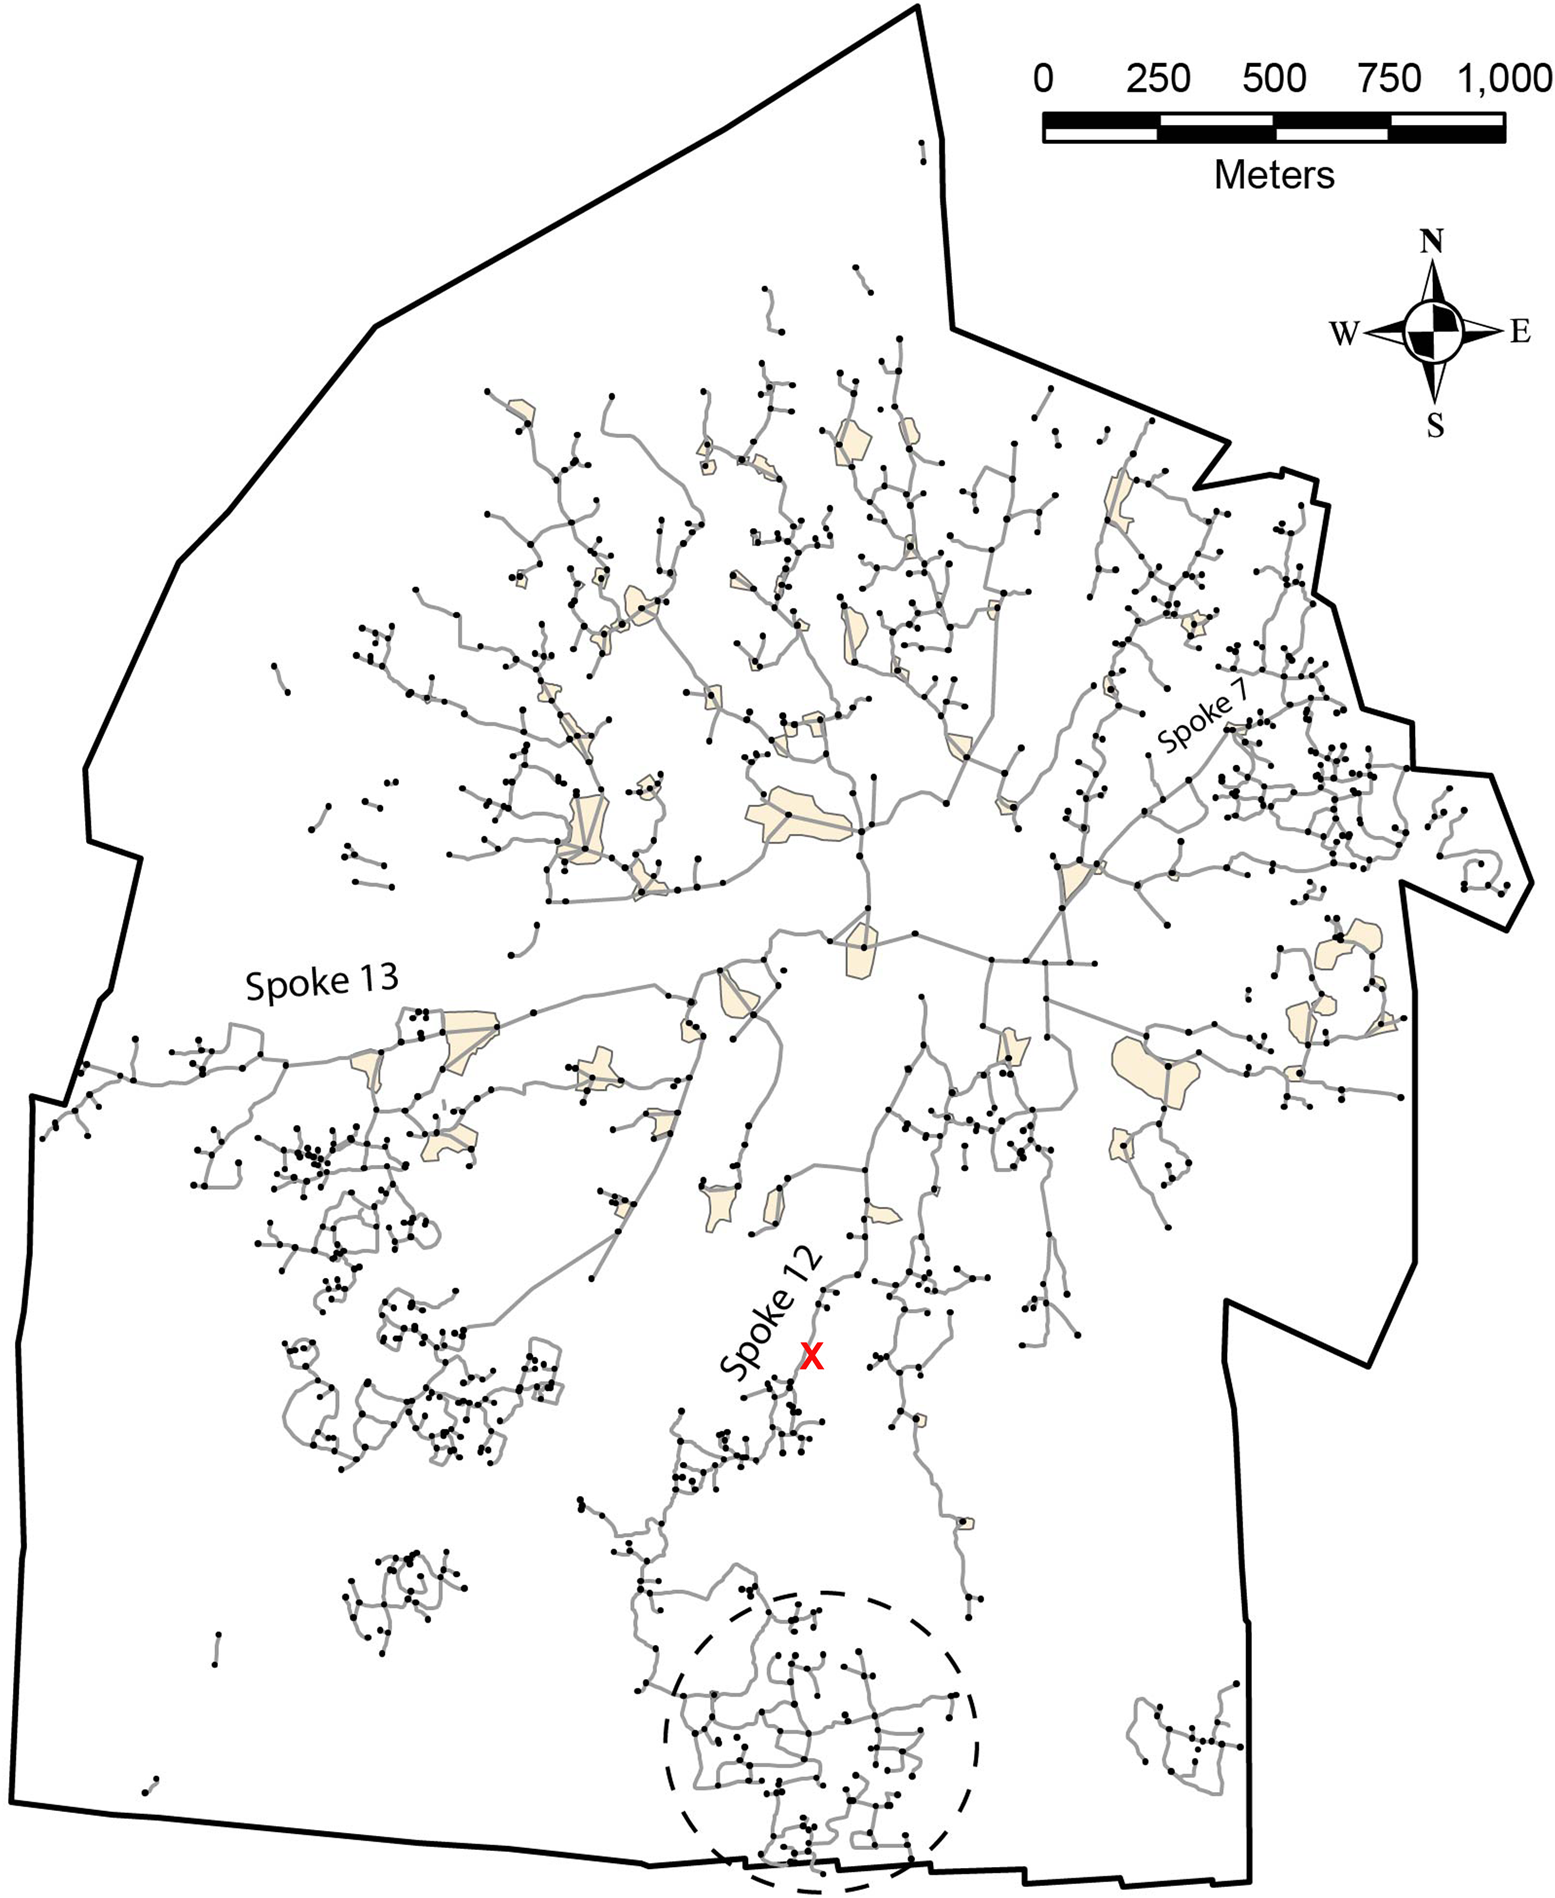
Angamuco and Chunchucmil differ in many ways, but they also share similarities. While new LiDAR coverage reveals Angamuco to be larger than Chunchucmil (new data suggest that Angamuco's area might extend to 26 km2, but that remains to be confirmed), both are densely populated urban centers. Whereas Chunchucmil's more than 30,000 inhabitants settled on about 15 km2, a similar number of inhabitants in Angamuco settled on 12 km2, making Angamuco's population density slightly higher. The residential areas of both cities are divided into discrete house compounds: the complejos of Angamuco and the houselots of Chunchucmil (Figure 4). Angamuco's complejos have about double the number of buildings as Chunchucmil's houselots. Chunchucmil has more of a monumental center than Angamuco, and this center clearly influenced the radial, hub-and-spoke pattern of Chunchucmil's pathways. Nevertheless, both cities may have experienced a more collective as opposed to monarchical form of governance (Dahlin Reference Dahlin2009). While complejos for Angamuco and houselots for Chunchucmil differ in size and number of residents, both represent a similar basic socio-spatial unit. Neighborhoods at Angamuco and Spokes at Chunchucmil might be analogous forms of community socio-spatial organization.
Comparison of housing units in Chunchucmil (houselots) and Angamuco (complejo). (a) A complete houselot at Chunchucmil (Group S2E1-I) surrounded by other partially shown houselots; note that the dotted lines represent albarradas which create paths surrounding houselots; (b) a single complejo at Angamuco (254); note that senderos, together with topography, create a boundary for the complejos and a formal entrance. Dotted lines represent internal circulation. Maps by the authors.
In sum, while certain characteristics of the urban layout differ between both sites, the path networks (including open spaces) in both cases are complex, extended, and generally inclusive. We are interested here in exploring in more detail to what extent the two examples of movement networks can be studied to explain socio-spatial expressions of Mesoamerican cities.
SPACE SYNTAX
Space syntax is a theoretical and analytical approach for quantifying aspects of the spatial layout of the built environment, like the accessibility of particular rooms in a building or intersections in a city (Hillier and Hanson Reference Hillier and Hanson1984). Though archaeologists most often use space syntax to analyze complex floor plans and interconnected outdoor plazas (Fisher Reference Fisher2009; Gilchrist Reference Gilchrist1988; Liendo Stuardo Reference Liendo Stuardo and Christie2003; Smith Reference Smith2003; Smith et al. Reference Smith, Chatterjee, Huster, Stewart and Forest2019; Steadman Reference Steadman2000; Stockett Reference Stockett2005), Morton and colleagues (Reference Morton, Peuramaki-Brown, Dawson and Seibert2012) have applied it to large city plans, such as that of Teotihuacan. Morton and colleagues (Reference Morton, Peuramaki-Brown, Dawson, Seibert, Rau and Schönherr2014:26) argue that space syntax can help archaeologists to get a better sense of how urban spaces reflect people's daily movements and interactions.
Two of the most used space syntax analyses involve integration and connectivity. A well-integrated location, such as a plaza or room, is one that is easy for people to reach, normally because there are many ways to access it and/or because it is centrally located in relation to other spaces. Also, a person in a well-integrated space can get to other locations in the built environment without much effort. Hillier (Reference Hillier1996) notes that since many people pass through well-integrated spaces, such spaces witness higher levels of co-presence, potentially stimulating the formation and strengthening of community bonds. Connectivity refers to the number of available adjacent spaces that border a particular space. The more adjacent spaces, the higher its connectivity. Connectivity and integration are related qualities of space and often lead to comparable interpretations. For example, Morton and co-authors arrive at similar conclusions using both analyses, stating that “high connectivity is an important ingredient in determining how ‘busy’ or ‘quiet’ any particular space is likely to be” (Morton et al. Reference Morton, Peuramaki-Brown, Dawson, Seibert, Rau and Schönherr2014:28), and that “the degree of integration of a space can be used as a predictor for how ‘busy’ or how ‘quiet’ that space will be” (Morton et al. Reference Morton, Peuramaki-Brown, Dawson, Seibert, Rau and Schönherr2014:29).
The first step in measuring integration and connectivity is to create a base map of bounded space. This was possible for Chunchucmil because its segments were mapped as spaces bounded by albarrada walls and other features (that is, as areas), but not possible for Angamuco, since its segments were mapped as lines. Thus, the space syntax analysis features only Chunchucmil. We used the central 4 km2 of Chunchucmil for the base map, created in Adobe Illustrator. This 4 km2 contains the site center and about two-thirds of the residential core. Chunchucmil's streets continue beyond the 4 km2 area delimited here, often reaching the end of the urban area at the periphery of the site. We limited our base map to 4 km2 because including the city's open edges skews connectivity measurements and strains computational power. We imported our base map, saved in Adobe Illustrator as a .dxf file, into DepthmapX (an open-source package available at https://github.com/SpaceGroupUCL/depthmapX/releases) to calculate connectivity and integration. DepthmapX does this by producing an axial map, or a representation of the network using only straight vectors, called axial lines, and analyzing each of these lines. Axial lines are line segments that connect any two intervisible corners or bends in the outline of the base map (Hillier Reference Hillier1996:131). Areas with lots of corners or bends will have lots of axial lines. The axial map is then used to calculate integration and connectivity in different ways.
For integration, each axial line gets a score based roughly on how many other lines a pedestrian, starting out from that line, must walk in order to reach the rest of the lines in the axial map. A high score indicates poor integration. Scores are symbolized from violet (least integrated) to red (most integrated). Figure 5a shows that the best-integrated part of Chunchucmil (in red, or, for black and white visualizations, the lines in white) is at the site center. This result merely provides quantitative support for the intuitive observation that Chunchucmil's site center is a principal part of the city. The site center is a relatively short walk on the path network to all other areas of the base map due to the radial configuration of Chunchucmil's streets. Uncoincidentally, the best-integrated area also contains the site's central marketplace, its ballcourt, and a sizable portion of its largest temples. Generations of varied actors from multiple parts of the site purposely shaped Chunchucmil's streets such that it would be relatively easy to get to the institutions that were key to the city's population.
Space syntax analysis of the central 4 km2 of Chunchucmil. (a) Axial map highlighting integration, rendering the most integrated part of the site in red (or white, for black and white figures) and the less integrated parts in blue (or darker grey, for black and white figures); (b) axial map highlighting connectivity, rendering the most connected part of the site in red (or white, for black and white figures) and the less integrated parts in blue (or darker grey, for black and white figures). Maps by the authors.
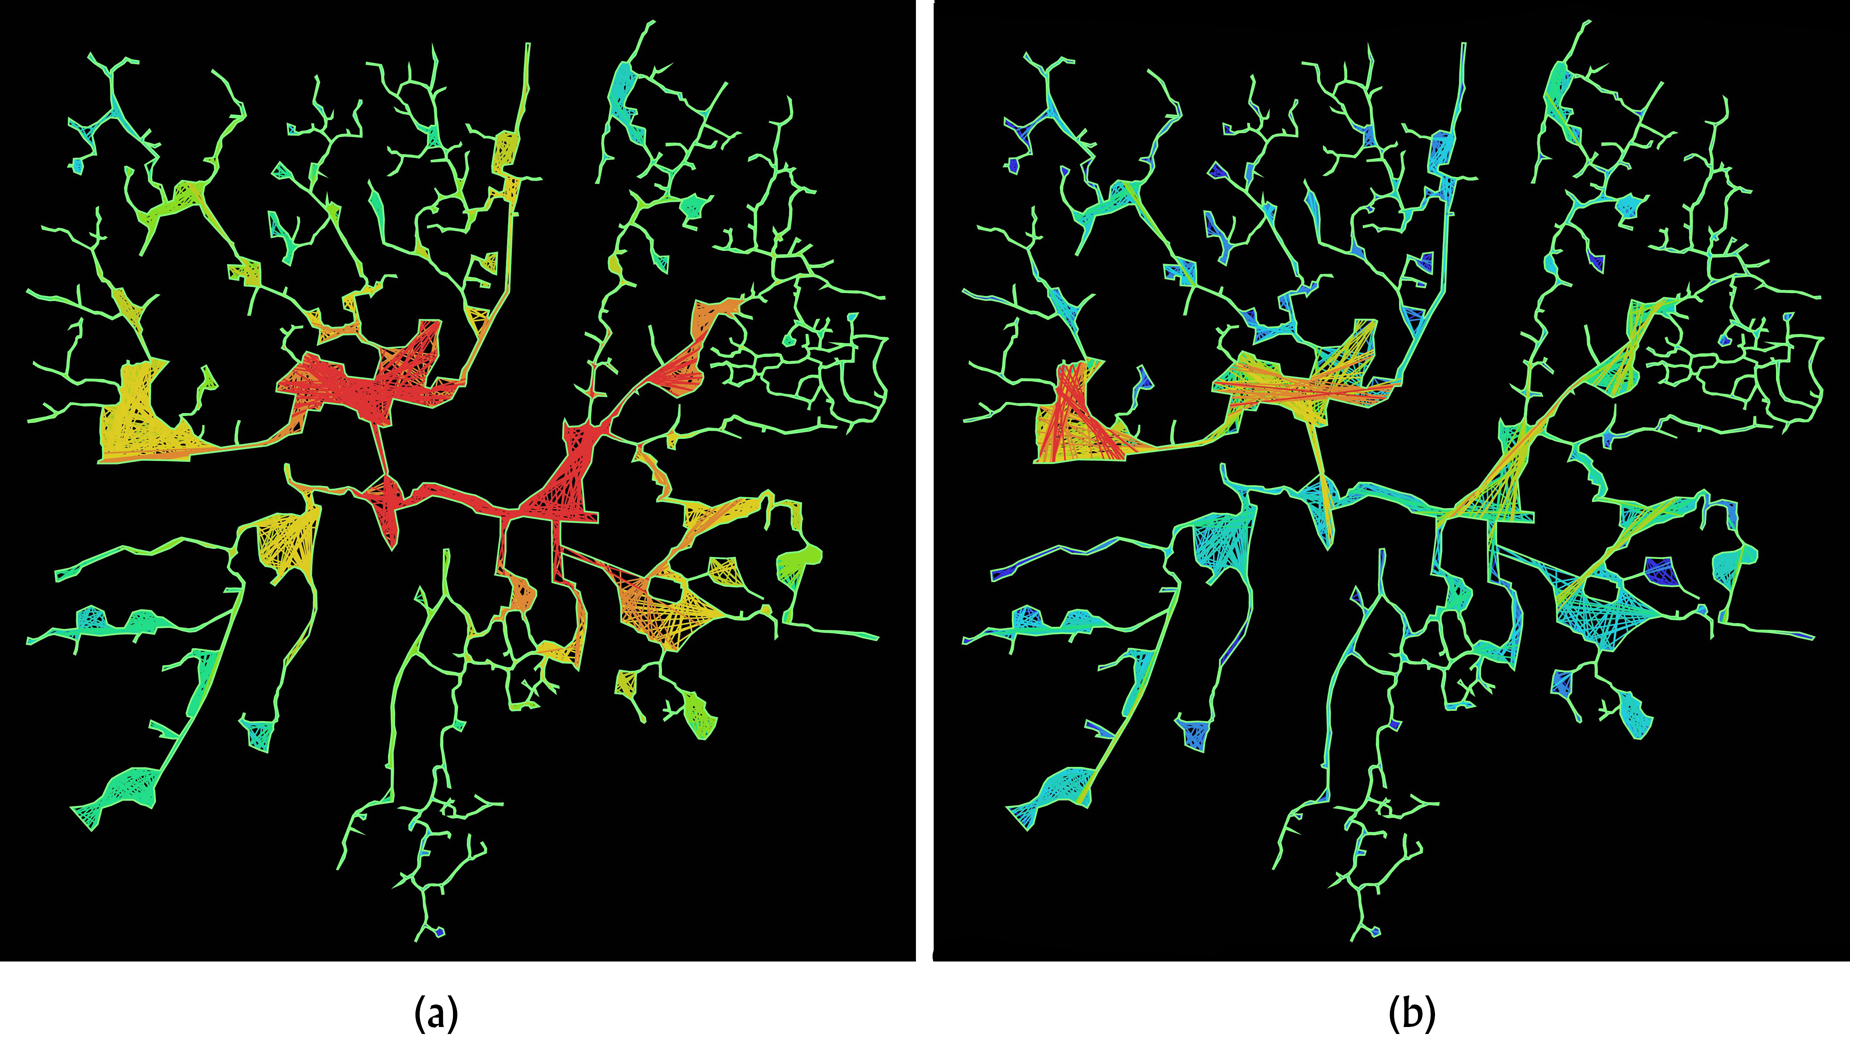
The connectivity of an axial line is a measure of how many other lines cross it. Thus, longer lines and lines in areas of the city with the most axial lines (usually large open spaces) will have the highest connectivity scores (colored red, whereas violet indicates the least connected lines). Unfortunately, the number of lines in a particular part of a city can be a function of the bendiness of the boundaries of the walkable area in the base map. Since DepthmapX creates an axial line for every pair of intervisible vertices, a bendier boundary will have more vertices and therefore more associated axial lines. This boosts the connectivity of that area such that connectivity sometimes ends up measuring the bendiness of particular parts of the basemap as opposed to the number of spaces adjacent to a particular location. Figure 5b shows the distortion: the best-connected area is an open space bordered exclusively by residential houselots at the far west of the map. DepthmapX does not give equally high connectivity scores to the most integrated part of the site (the red area in Figure 5a) because, even though many streets and causeways (and their affiliated axial lines) lead there, they do not all arrive at the same spot. The discrepancy in Figures 5a and 5b between the most connected location and the most integrated location highlights the difference between connectivity and integration. Of the two concepts, integration seems to be more central to how the people of Chunchucmil planned their city. Though neighborhoods are not well-integrated with each other, they are well-integrated with the city center. The poor integration between neighborhoods means that getting from one neighborhood to another might have been inconvenient. This interpretation reinforces a similar conclusion based on the radial, hub-and-spoke pattern of Chunchucmil's paths (Hutson and Welch Reference Hutson and Welch2016; Magnoni et al. Reference Magnoni, Ardren, Hutson, Dahlin, Creekmore and Fisher2014). Space syntax provides several tools to explore path networks, and, as demonstrated here, not always with a direct interpretation. The Chunchucmil example illustrates how the analysis of ancient path networks requires a more detailed study of the material attributes of both walking surfaces and intersections as they were likely used. We believe that the analysis of segments and nodes undertaken below better explains how city plans shape experience and is more easily applicable to both sites.
SEGMENT AND NODE ANALYSIS
The segment and node analysis required a network of path segments and nodes (intersections) in ArcGIS for each of the two cities. Solinis-Casparius (Reference Solinis-Casparius2019) developed the procedure for creating such a network. Segments (lines in GIS) consist of all path-like features, regardless of their dimensions, shape, orientation, or construction system. Nodes (points in GIS) are places where segments begin, end, or intersect. Nodes have a variety of forms, including simple (these are essentially dead-ends, such as when a segment ceases at a complejo or houselot), Y-shaped (when three segments join in a “Y” intersection), T-shaped (when three segments join in a “T” intersection), X-shaped (where four segments conjoin), multi (when more than four segments conjoin), and plaza (when two or more segments feed into a large open space). Nodes also have a linkage value, which refers to the number of segments linked to a particular node. Nodes that represent an intersection of segments were also digitized in GIS as polygons, where possible, in order to calculate the area of a node. All these features have been geolocated using the UTM coordinate system. During the creation of the geodatasets for the point-and-line features of each network, variables not identifiable in the GIS environment, such as segment width, were added manually, while other variables, such as segment length and open space/node area, were calculated within ArcGIS.
For Angamuco, two different mapping procedures were used to record the network of paths and nodes. LiDAR data were used to create the network for the entire site, which produced data on certain attributes of segments and nodes such as length, linkage, and shape (see below). Additionally, around 14 percent of the site was ground-verified and more intensively mapped with high-precision GPS units in 2016 to pick up multiple details not visible in LiDAR, such as slope, width, and area (Solinis-Casparius Reference Solinis-Casparius2019). This 14 percent sample was collected over five weeks of dedicated field mapping in 2016 and consists of four randomly selected, non-adjacent areas that roughly align with neighborhoods as defined by Fisher and Leisz (Reference Fisher, Leisz, Comer and Harrower2013). The sample accounts for 1.68 km2 of the built environment. This sample was also used as a control for LiDAR ground verification, as presented in Solinis-Casparius’ (Reference Solinis-Casparius2019) dissertation.
For Chunchucmil, the network was recorded from the site map, which was completed in 2006 using techniques of pedestrian survey, georeferenced with high-precision GPS units (Hutson and Magnoni Reference Hutson, Magnoni and Hutson2017). Some potential cobbled streets were left out of the Chunchucmil network since they looked more like houselot boundaries than paths. We should note that not only were the ancient paths at Angamuco constructed very differently from those at Chunchucmil, but there has also been more modern disturbance at Chunchucmil. The disturbance consists largely of the construction of a modern paved road, early twentieth-century narrow-gauge rail lines and field walls for henequen farming, and occasional ranching activities. No more than 5 percent of Chunchucmil's network has been disturbed in this way, but some paths at Chunchucmil are either completely missing or not as clearly demarcated, requiring more inference. For Angamuco, we calculate that only about 2 percent of the network has been affected by modern urbanization and agriculture. In both cities, all paths recorded are Prehispanic.
Segment and Node Analysis within Chunchucmil: Multiple Planning Logics and Intra-Site Variation
In this section we use details of segments and nodes within Chunchucmil to uncover multiple different logics at play in designing the pedestrian network. These involve economizing logics, non-economistic differences from houselot to houselot, and neighborhood-based variation across the site.
Chunchucmil Segments
We identified 1,116 segments at Chunchucmil, totaling 53,156 m (Figure 3). As Table 1 and Figure 6 show, streets are the most common form by length, followed by houselot alleys and causeways. Approximately 58.5 percent of the segments are straight, while 26 percent feature a single curve, and 15.5 percent are sinuous, with two or more curves. The average width of non-cobbled streets is 3.3 m, with a median width of 2.9 m. This average treats all streets equally, regardless of length. If we weight the streets by length, such that longer streets have more of an effect on the mean than shorter streets, the result is about the same: the weighted mean width of streets is 3.46 m. Assuming that many people at Chunchucmil sought to visit the marketplace, ballcourt, temple pyramids, and other open spaces at the site center, streets closer to the center would get more foot traffic. For traffic management, we might expect that such streets would be wider to accommodate more people. Indeed, we found a weak, but statistically significant negative correlation between street width and distance from the site center (Pearson's r =−0.267, p < 0.001), indicating that as distance from the site center increases, street width decreases.

Summary of quantitative data for paths/segments at Chunchucmil, arranged by type of path.
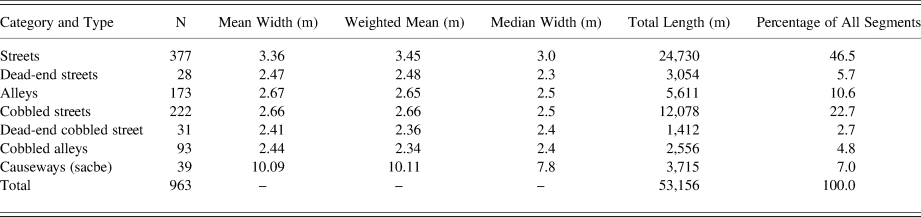
Streets are significantly wider than houselot alleys, and this holds for both non-cobbled (t = 5.16, p < 0.001) and cobbled (t = 2.48, p = 0.014) versions of the two features (see Table 1). Common-sense traffic management would predict these outcomes. Since only the people living in or visiting a specific houselot use a particular houselot alley (they are terminal segments of the network), fewer people traverse them. Thus, they do not need to be as wide. Likewise, “dead-end” streets (ending at a quarry, for example) are normally narrower than other streets, and this fact holds for both non-cobbled (t = 2.78, p = 0.006) and cobbled (t = 1.90, p = 0.059) versions (see Table 1). Practical logic would suggest that since fewer people walk alleys and dead-end streets, these streets can be narrow. Yet practical logic (Sahlins Reference Sahlins1976) does not reign everywhere. Several houselot alleys are wider than the streets into which they feed. This result arouses various speculations. Did some households consciously create wide entrance alleys as a way of showing off? The space within houselots was valuable for gardening and a variety of other activities (Hutson et al. Reference Hutson, Stanton, Magnoni, Terry and Craner2007). Ceding houselot space to make room for streets between houselots may have been a tricky negotiation. Could some people have expanded their houselot walls over time to gain more space, thus cutting into the width of streets, such that a few streets ended up being narrower than alleys?
Cobbled streets, with an average width of 2.63 m, are generally narrower than non-cobbled ones (t = 5.93, p < 0.001), just as cobbled alleys are generally narrower than non-cobbled alleys (t = 2.28, p = 0.024). The narrower width of cobbled segments might be attributed to the fact that they are more costly to construct (they require stone fill), yet this explanation overlooks the fact that cobbled streets are largely confined to spokes 7, 12, and 13 (see Figure 3 for the location of these spokes; Hutson and Welch Reference Hutson and Welch2016:121). In other words, cobbled streets are not just a narrower version of non-cobbled streets; they seem to be a different category of segment, related in some way to differing community identities within the city. This observation foregrounds a discussion of intra-site variation.
Looking at differences in the pedestrian network across the site reveals several insights. In spokes 7, 12, and 13 (Figure 3), the radial, spoke-like aspect tends to disappear toward the edge of the site, replaced by a pattern that more closely resembles a honeycomb. In this pattern, exemplified by spoke 7, as seen in Figure 7, houselots have streets on more sides and there are more possible routes to walk from the periphery to the center. Indeed, some houselots in these spokes have more than one alley entrance, providing choices of how to enter the network. More potential routes mean proportionally more nodes (as measured in nodes per linear meter of segment), and proportionally more linear meters of segments (as measured in linear meters per houselot), both of which are empirically true for spokes 7, 12, and 13. The honeycomb aspect of these spokes accords well with the fact that these areas differ from other areas of the site in their preference for cobbled streets. As discussed below, these three spokes also exhibit remarkable similarities in the frequencies of different node forms.
Map of spoke 7 at Chunchucmil, showing bounded houselots, the path network, and other details. Map by the authors.

With regard to spoke 12, the segment map (Figure 3) tells only part of the story: when we look at the architecture, we see that the southernmost concentration of segments (circled by the dotted line in Figure 3) articulates a cluster of houselots with higher settlement density than the area between here and the site center (Figure 2). Furthermore, at the spot marked by an “x” in Figure 3 (near the “o” in the label “Spoke 12”), the segment that links this cluster to the site core may in fact be blocked, making it more dubious than other segments. Was this southern cluster a spatially discrete settlement that flourished prior to Chunchucmil's Classic-period boom and eventually lost its discreteness as the city grew, enveloping it and filling the empty space between it and the site center? Excavations in this south area, though limited, do not fully support this scenario, as the area appears to lack a sizable occupation prior to the city's major period of growth in the middle of the Classic period. As an alternative, this area may have been a distinct neighborhood that developed coevally with the rest of the city.
Chunchucmil Nodes
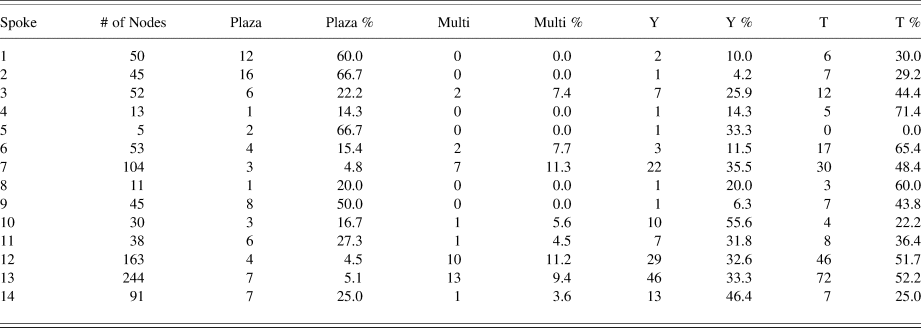
We identified 1,089 nodes at Chunchucmil. Figure 8a shows the frequency of the different node forms, while Figure 8b shows the frequency of the different node forms and the frequency of the kinds of linkages (Chunchucmil, first column). A plurality of these nodes (n = 470) are simple nodes, and nearly all of these simple nodes are the locations where a houselot alley ceases at the entrance to a houselot. Table 2 provides information on the frequencies of the different node forms broken down by spoke. We call attention to the striking similarity in the percentages of different node forms in spokes 7, 12, and 13, which we highlight in Figure 9. The number of nodes for which we have area measurements (n = 419) is much smaller than the total number of nodes because the area of simple nodes cannot be measured and because the area of several others was not clear. Sizes vary widely, from 2.1 m2 to 16,727.9 m2 (Table 3), though we observed some patterns. For example, nodes connected to a houselot alley (n = 158) tend to be smaller than other nodes (t = 3.66, p = 0.0003). Economizing logic predicts this result: since only the people living in or visiting a specific houselot use a particular houselot alley, one might presume that fewer people traverse them. Thus, the nodes they connect to could be smaller, not needing to accommodate as many people.

Pie charts showing the proportion of node types at each spoke/neighborhood at Chunchucmil. Note the similarity between the charts for spokes 7, 12, and 13 (top row). Charts by the authors.

Data on node forms by spoke, Chunchucmil.
Summary statistics of node sizes at Chunchucmil arranged by node form.
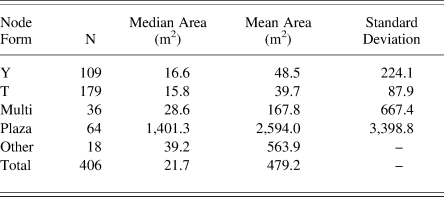
Though the largest nodes are generally found within 1 km of the site center, we found a weak but significant positive correlation (r = 0.243, p < 0.001) between node size and distance from the center. In other words, nodes further away from the site center tend to be larger. This outcome counters a crowd management logic, which would predict that nodes further out would be smaller, since they might be handling less foot traffic. Since the availability of space toward the edge of the path network is no different from the availability near the center (only beyond the edge of the path network, in the residential periphery, do we see large amounts of space not encircled by albarrada walls), settlement density and availability of space cannot explain the positive correlation. Indeed, the amount of space per houselot exhibits no correlation with distance from site center (Magnoni et al. Reference Magnoni, Hutson and Dahlin2012).
Of the nodes where three or more segments meet (n = 509), 85 (16.7 percent) are plaza nodes. Recall that plaza nodes occur when two or more segments feed into a large open space. Such nodes are rather informal and contrast sharply with the site's formal plazas: the quadrangular, artificially leveled plazas bordered by pyramids and range structures in the site core. The largest plaza nodes are larger than the largest formal plazas. The 17 largest informal open space plazas contain a total of about 112,000 m2, as opposed to about 42,000 m2 for the site's 17 largest formal plazas.
Segments and Nodes in Angamuco: Community-Standardized Movement Infrastructure
Here we describe different physical and experiential characteristics of segments and nodes at Angamuco to explain how inhabitants of the site achieved a standardized movement infrastructure. This effort included simple key architectural features for formalizing paths that required the involvement of small groups of people, perhaps at the neighborhood scale.
Angamuco Segments
Exactly 2,620 segments, with a calculated total length of 61,010 m, were identified for the entire site of Angamuco, using LiDAR-derived data (Figure 10). In Table 4 and Figure 6, we show a distribution of segments by their length, slope, and shape. Unfortunately, digital extraction of pathways from LiDAR alone does not allow for much detailed information on these features (e.g., their width and construction style). More useful is the 14 percent field-verified sample which contains 419 segments with a total linear extension of approximately 22,500 m.
Summary of quantitative data for paths/segments at Angamuco, arranged by category, type, and subtype on field-verified sample.
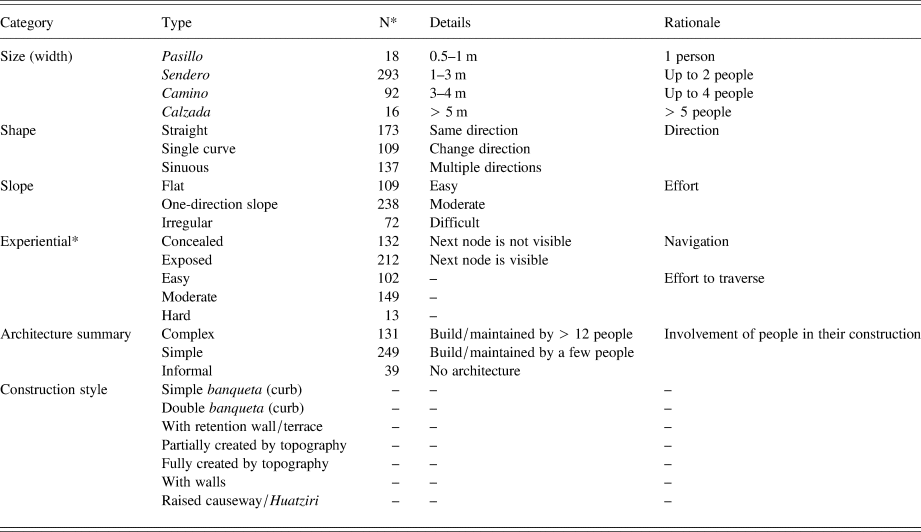
*Counts for experiential categories do not total 419 surveyed segments.
Network of paths/segments and intersections/nodes at Angamuco, highlighting two dense areas (A and B). Map by the authors.

The average width of segments in the sample is 2.41 m, with a median width of 2.7 m. The most common type of paths (by their width) are senderos (1–3 m wide), totaling about 70 percent of the sample (n = 293), followed by caminos (3–5 m wide, n = 92) and calzadas (>5 m wide, n = 16), together representing 26 percent of the sample, and lastly, pasillos (<1 m wide, n = 18), with about 4 percent of the sample. Importantly, circulation within complejos, where movement was possible through pasillos (passages), was not systematically mapped and thus was not included in this analysis.
Segments were also classified by their shape and slope. Shape and slope do not merely describe the geometry of Angamuco's segments. More important, they permit inferences about the experience of travel and navigation and social relations, including the labor involved during their construction. For shape, we refer to the general pattern of the segment, using three categories: (1) straight, following one general direction, (2) single-curve, leading pedestrians to change their horizon view once, and (3) sinuous, with multiple changes in direction and horizon view. Almost half of the segments in the sample are straight (41 percent, n = 173), 33 percent are sinuous (n = 137), and 26 percent (n = 109) are single curve. For slope, the sample is divided into three categories: flat (26 percent, n = 109), unidirectional slope (57 percent, n = 238), and irregular (17 percent, n = 72). Flat segments are relatively easy to traverse, and since the topography at Angamuco is generally rugged, flat paths most likely required modification and construction. Unidirectional slope segments usually required moderate effort to traverse (the slope can be gentle or steep, but is not usually extended for a long distance). Irregular segments are typically difficult to walk because there is more than one slope. At first, there seems to be a correspondence between the shape and slope of the segments. For example, when considering all segments, regardless of their width, most straight segments are also flat, both indicative of landscape modification. Conversely, most sinuous segments have more than one slope (irregular; Figure 11a). However, looking at this distribution for only senderos (the bulk of segments in Angamuco), the distribution of straight segments that are flat or have one-slope is very similar (Figure 11b). More telling is that there is essentially the same proportion of curved segments in the site regardless of their width (pasillos, senderos, caminos, calzadas). This distribution perhaps shows that the placement of pathways responds to topography (elevation) and other elements in the built environment, such as buildings and platforms for complejos. Pathways are created to go around natural and built features. Instead of showing an overwhelming transformation of the landscape to place pathways (e.g., massive causeways, large number of flat pathways), there is an enormous aggregate of smaller path-building projects, each requiring some modification of the landscape and likely carried out by small groups of people.
Charts comparing the distribution of shape to slope in segments of Angamuco. (a) Distribution of all segments regardless of their width; (b) distribution of senderos only (1–3 m wide). Charts by the authors.

The evidence of construction and maintenance of the pathways adds to these observations. There are essentially two architectural features in all segments: the walking surface (either paved, tamped down, or eroded), and the path boundaries (elements used to define the limits of the walking surface that include curbs, alignment of rocks, walls, a platform, or the topography). Seven different construction styles that mixed these features (e.g., elevated causeways, curbed, sunken) can be combined into the following three classes: (1) complex paths (31 percent, n = 131) that would require the involvement of several dozen people to build (e.g., elevated causeways, paved roads); (2) simple paths (60 percent, n = 249) that require a few people to create (e.g., alignment of rocks or short walls); and (3) informal paths (9 percent, n = 39), which do not show evidence of construction or landscape modification other than an eroded walking surface (similar to hiking trails). We suggest that massive pathway construction projects would have been directed by some sort of central government. There are certainly several examples of that effort in Angamuco between the layout of the segments (shape and slope) and their architectural features. Most of the pathways at Angamuco, however, show modest construction (simple), probably built by neighbors or family members with no central oversight.
Finally, a little over a third of paths end at plazas or patios (ca. 30 percent, n = 123), and 71 percent of these are senderos. In other words, instead of building large, wide, and complex causeways to reach open spaces, residents of the site built and used pathways for two to three individuals. In sum, it appears that the common Angamuco path is short (44 m long), about 2 m wide, follows the natural topography, and has a simple construction, not necessarily to make traveling easier, but enough to help navigation (one or two alignments of medium-size rocks or curbs define the walking surfaces). These common paths usually connect to small nodes or end at medium-size open spaces (3–25 m2).
Angamuco Nodes
We identified 3,620 nodes for the entire path network and 379 in the field-verified sample. The total area of all nodes in this sample is 1,040 m2. Table 5 and Figure 9 show the frequency of nodes from the field sample, based on their size, form, and linkage. Most of these nodes (n = 193, or 51 percent) link three segments either in Y (42 percent) or T (12 percent) forms; nodes that link four segments (n = 20, or 5 percent) usually have an X form (8 percent), although some are plazas; very few of them link more than four segments (n = 11, or 3 percent), and the rest are dead-ends (n = 116, or 30 percent) or with a sunken patio or plaza form (n = 27, or 7 percent). The nodes were part of a complex network that expanded in all directions and connected houses and resources evenly. Moreover, if some Y and T nodes are interpreted initially as being a single path that was later connected by another path, forming a junction, this configuration might suggest that the network developed organically.
Summary of quantitative data for nodes at Angamuco, arranged by category, type, and subtype on field-verified sample.
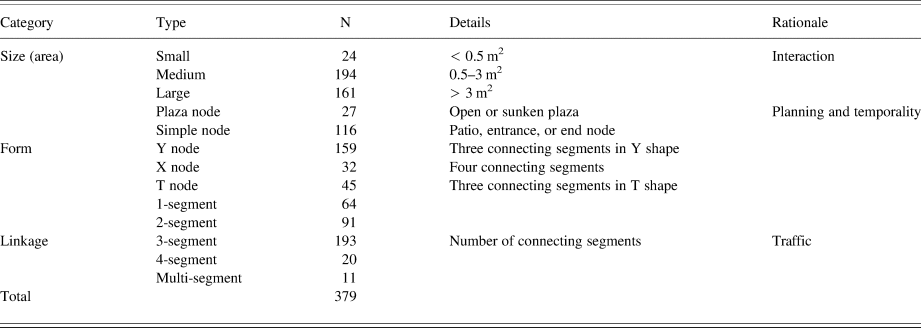
The size of the nodes is a good indicator of the functioning of the path network as a movement system, as well as the location and abundance of open spaces. Most nodes are medium size (52 percent, n = 194), which is to say, no more than 3 m2. This size means that they were not created as mixed-use activity spaces, but rather as mere crossroads: places where people simply passed from one segment to another. While small nodes (0.5 m2) were identified in the field, they accounted for only 6 percent of the sample (n = 24). These are typically within complejos, which were not systematically mapped. We consider small nodes mainly as the intersections of narrow pasillos. However, large nodes, which constituted 42 percent of the sample (n = 161), have more variation in size and likely function. Large nodes can measure anywhere from 3 m2 to 280 m2. The linkage to large nodes varies as well, some connecting to two or as many as five other paths. These junctions were all considered plaza or patio nodes, which are very large open or sunken areas, with or without stone architecture to help define their dimensions (just like the plazas identified throughout the site). They might have hosted diverse cultural activities, such as markets, religious celebrations, and other kinds of gatherings, and definitively functioned as destinations in the network, as opposed to medium and small nodes that have a predominantly connecting role. Significantly, about 40 percent (n = 51) of large and plaza nodes are also simple nodes. As in Chunchucmil, simple nodes resemble dead-ends and are found at locations where surrounding topography already creates an impasse (similar to sunken plazas). We suspect that some of these impasses were eventually modified to provide access, so at some point a ramp or set of stairs would be created to enter previously simple nodes (see Solinis-Casparius Reference Solinis-Casparius, Ellis, DeSanto and Howey2022 for an example). Finally, simple nodes are not limited to large nodes. About 40 percent of them (n = 36) are medium size and have been associated with patios or small areas for growing food or entrances to complejos.
In sum, the distribution and characteristics of nodes in Angamuco point to two main conclusions. On the one hand, the most common nodes at Angamuco are medium nodes which do not require much construction (they look just like a small open meeting of paths). These nodes are generally very close to each other, since segments that connect them are usually short (< 20 m). This grouping further adds to an organic network that likely developed as residents in the community (neighborhoods) collectively negotiated the space. On the other hand, the considerable amount of plaza nodes provided many open spaces favorable for socialization and community activities. Such public spaces might have a fundamental role in the social integration of the city.
Comparison between Angamuco and Chunchucmil
Segments
Neither city has an orthogonal layout like that of Teotihuacan, suggesting that both cities resulted from what Smith (Reference Smith2011:179) has called generative planning: organic growth guided by household or neighborhood leaders as opposed to central authorities (Magnoni et al. Reference Magnoni, Ardren, Hutson, Dahlin, Creekmore and Fisher2014:167). Yet Chunchucmil's network of segments differs from Angamuco's because its streets have a radial, hub-and-spoke pattern that directs people into the center (or out to the periphery). Lateral movements, from one neighborhood to another, are not as easy. At Angamuco there are normally multiple ways of getting from one edge of the site to another. The pedestrian's route options are more restricted at Chunchucmil. Though Angamuco lacks a center, the distribution of segments reveals two distinct areas, or a more compact urban layout within the city (labeled A and B in Figure 10). This patterning of the pathways, and likely the architectural features that they connect, might reflect two unique cultural compositions different from the rest of the site (something like the spokes in Chunchucmil). They could also attest to urbanization processes occurring at different times than the rest of the site (see Solinis-Casparius Reference Solinis-Casparius2021 for a discussion on this point). Yet these two areas are not segregated from the rest of the path network. The inclusiveness, accessibility, and functionality characteristics of Angamuco's path network remain through and beyond these two areas. In other words, circulation between these two areas and from them to any other part of the site is viable and easy.
Close quantitative comparison shows that Angamuco's pedestrian network is more dense than Chunchucmil's: 13,084 m of segments per km2 versus 9,164 m per km2. The slightly higher density of segments at Angamuco matches a slightly higher population density. Thus, the number of paths per person at the two sites is about the same. Angamuco's streets are generally more curved (or cause more changes in the pedestrian's horizon view) than Chunchucmil's, likely a result of the much more rugged terrain at Angamuco. The average width of the 419 segments that could be measured at Angamuco is 2.4 m compared to 3.2 m for the 989 whose width could be measured at Chunchucmil. These differences have consequences for the experience of walking ancient streets. The narrower segments at Angamuco bring people closer together as they pass each other. The streets of Angamuco are thus a bit more intimate than those at Chunchucmil, perhaps stimulating/forcing more social interaction between pedestrians, even if such interactions pass quickly (Solinis-Casparius Reference Solinis-Casparius2019:408–410). The fact that Angamuco's domestic units (complejos) have more buildings than Chunchucmil's domestic units (houselots) may relate in some way to these differences. The spoke pattern at Chunchucmil means that people living adjacent to the same spoke must traverse some of the same paths before they get to the center or periphery of the city. Thus, people living by the same spoke see each other often and such face-to-face contact may create or strengthen community identities (Keith Reference Keith and Smith2003; Smith Reference Smith2011).
Surprisingly, in both sites we found a similar length of segments. The mean and median length of segments are 57 and 43 at Chunchucmil (n = 1,118) and 60 and 46 at Angamuco (n = 2,620). A cursory examination of the Teotihuacan map (Millon et al. Reference Millon, Drewitt and Cowgill1973) shows that most segments measure between 40 m and 60 m long, very similar to Chunchucmil and Angamuco. LiDAR mapping at Mayapan (Hare et al. Reference Hare, Masson and Russell2014) reveals that this city's streets were longer, but this is because Mayapan has fewer streets per houselot and per hectare than the other cities. Causeways at Maya site cores tend to be longer than the residential streets discussed in this article (Shaw Reference Shaw2008), in the same way that the segments of Teotihuacan's Avenue of the Dead are longer than its residential streets. Congruent with the pattern of longer site core segments, the streets and avenues at the core of Nixtun Ch'ich' range between 50 m and 200 m long. Chunchucmil and Angamuco are filled with features, either architectural (houselots or complejo boundaries, terraces, patios, wells, etc.) or natural (topography, water reservoirs, etc.). The residents of both places interlinked these landscapes, formalizing access by building short paths.
At both sites, most of the paths seem to be designed not by central authorities, but by neighbors actively engaged in defining how to settle in the land and how to walk to places. Yet at Chunchucmil, the hub-and-spoke pattern placed more constraints on its pedestrians. In this sense, the two cities reflect a dissimilar pattern of path networks. Chunchucmil's paths draw people to the site center. In contrast, Angamuco's urban network is not uniform: it has two areas of high density of pathways located at distant points of the site (Figure 12). These two areas afforded different accessibility, connectivity, experience of travel, and interaction potential for their residents. They are good examples that within one city, several motivations for movement are reflected in the urban layout.
(a) Map of Angamuco path network, showing (b) areas of dense (1) and sparse (2) path networks. The difference in the patterns (dense versus sparse) could be the result of several factors, including unique regions of the site that developed at different time periods and responded differently over time to social factors, or with different social/ethnic configurations than the rest of the site. Map by the authors.

Nodes
We also identified significant differences and correspondences amongst nodes at both sites. One of the starkest differences is the size of nodes. Most of Angamuco's nodes are smaller than Chunchucmil's (see Table 5), and this pattern is partly an unremarkable consequence of Chunchucmil's wider segments. Yet in both sites, people constructed many nodes to function as more than simple crossroads. In Chunchucmil, 119 of the 409 measurable nodes exceed 50 m2, and in Angamuco, 15 out of 379 are larger than 50 m2, and as many as 146 out of 379 are between 3 m2 and 50 m2. This difference in size entails several experiential possibilities. Large nodes provide space for pedestrians to pause and congregate. Some congregations may have been planned, what Goffman (Reference Goffman1963) called social occasions, whereas others were merely loose and transitory, what Goffman called gatherings. We wonder if there were shade trees or expedient structures like awnings. The list of activities that could take place runs long: resting, peddling, people-watching, loitering, courting, crafting, chatting, child's play, neighborhood meetings, music, etc. As noted above, Angamuco's residential complejos are larger than Chunchucmil's residential houselots, so it may be that at Angamuco more of these activities took place not at nodes, but within complejos. Yet it may also be that people used relatively narrow streets for social interactions (Nishimura Reference Nishimura, Creekmore and Fisher2014:103). Chunchucmil clearly differs from old-world cities in Mesopotamia and Cyprus, in which streets measuring 2 m wide were some of the only open spaces within neighborhoods (Fisher Reference Fisher, Creekmore and Fisher2014; Nishimura Reference Nishimura, Creekmore and Fisher2014). As we mentioned above, open spaces in dense cities did not occur by accident (Smith Reference Smith2008:217). People deliberately maintained them and, in Angamuco's case, built them as sunken plazas (Bush Reference Bush2012). Blanton and Fargher (Reference Blanton and Fargher2016:186) note that open spaces as sites of assembly can facilitate collective action. Along these lines, autocrats may have tried to limit open spaces as a way of restricting social occasions and stifling the creation of a civil society unchoreographed by central authorities (Fisher Reference Fisher, Creekmore and Fisher2014; Golden and Scherer Reference Golden and Scherer2013).
The frequencies of node linkages at Chunchucmil and Angamuco are somewhat similar, as shown in Figure 8. The distribution of nodes by linkage in both sites further reinforces the direct relationship between the component of the movement network and the general pattern of the city form.
Considering segments and nodes together, a higher ratio of segments to nodes indicates more choices for movement, which might indicate that local groups and/or leaders provided people with more options for getting around the city. In other words, more streets for ease of movement can be seen as a public good, and the provision of public goods has been envisioned as a key characteristic of collective governance (Blanton and Fargher Reference Blanton and Fargher2008; Feinman and Carballo Reference Feinman and Carballo2018; Kohler et al. Reference Kohler, Smith, Bogaard, Peterson, Betzenhauer, Feinman, Oka, Pailes, Prentiss, Stone, Dennehy, Ellyson, Kohler and Smith2018). Furthermore, Blanton and Fargher (Reference Blanton and Fargher2011:508) argue that collective governments require more options for movement because administrators must be able to traverse cities efficiently, collecting information and revenue. Thus, Blanton and Fargher proposed that cities with higher degrees of collective governance should have high ratios of segments to nodes. Indeed, Blanton and Fargher (Reference Blanton and Fargher2016:184–185) found a positive correlation between the degree of collective governance and the ratio of segments to nodes. Though a strong case for collective governance can be made for Angamuco and Chunchucmil, segment/node ratios for Angamuco (0.74) and Chunchucmil (1.03), are relatively low compared to the collectively governed cities in Blanton and Fargher's sample (each is above 1.15, with an average ratio of 1.27). The low ratio for Chunchucmil is not surprising given that radial, hub-and-spoke patterns simply have fewer segments per node as compared to, for example, an orthogonal layout. Blanton and Fargher (Reference Blanton and Fargher2011:511) found that radial patterns are more common in non-collective polities. Yet two aspects of Chunchucmil's layout align very well with collective interests. Chunchucmil's very high settlement density (compared to other Maya cities) greatly improves efficiency of travel time, and its abundance of large open spaces throughout the residential areas can be considered public goods.
DISCUSSION AND CONCLUSION
Chunchucmil and Angamuco are two of the very few Mesoamerican cities where detailed mapping has produced nearly complete street maps. Thus, we have a rare opportunity to study how the bulk of the population moved through cities, how people worked together to organize a network of paths and open spaces, what kind of interactions these features afforded, and how they contributed to the formation of social identity. Having found that space syntax methods confirmed our intuitive understandings but did not generate new findings, we applied a segment (paths) and node (intersections) analysis to both sites, recording segment variables such as width, length, form, and curvature, and node variables such as size, form, and number of linked segments. Many of the nodes at both sites are open spaces, allowing us to record details about the configuration of shared public spaces that are less formal than monumental plazas often found in site cores.
Two conclusions present themselves without the need for detailed quantitative analysis. First, the path networks of Chunchucmil and Angamuco are very different from the orthogonal network at places like Teotihuacan or Nixtun Ch'ich'. The paths at Chunchucmil and Angamuco adhere to no single orientation and most were not designed by central authorities. Yet this pattern does not mean that Angamuco and Chunchucmil's streets were byproducts of desultory rambling. On the contrary, the specific results of the segment and node analysis show that intentional planning went into path networks. For example, at Chunchucmil, particular neighborhoods chose to build streets that were narrower than elsewhere and floored with gravel and cobbles. These neighborhoods also shared the same preferences for node types. At Angamuco, virtually all paths are explicitly marked in some way, either by modifying the topography, such as cutting through natural ridges, by building walls, ramps or elevated causeways, or by simply placing curbs to define their contour. All segments seem to have been placed in negotiation with other urban elements, like complejo platforms, terraces, and reservoirs within the city. Segments serve a circulation purpose by connecting to the entrances of all complejos or leading to public areas. In both cities, maintenance over the sometimes long life-histories of streets may obscure aspects of those streets’ initial planning.
A second set of conclusions regards the connection between path networks and political organization. Collective rulership has been claimed for Angamuco, Chunchucmil, and Teotihuacan (see Blanton et al. Reference Blanton, Feinman, Kowalewski and Peregrine1996 for the latter), yet only Teotihuacan has an orthogonal street pattern that, according to Blanton and Fargher (Reference Blanton and Fargher2016:182), facilitates the high degrees of communication required by collective governments. Furthermore, people at Angamuco and Chunchucmil built starkly different path networks. People at Angamuco could proceed in almost any direction when they left their residential complejos, whereas people at Chunchucmil had to go toward the site core or toward the periphery before they could get to a different residential area of the city. Though Chunchucmil probably had rule by council, the pull of its site center warped its circulatory affordances. Thus, the inter-site comparison shows that the degree of political collectivization and centralization does not predict the kind of mobility that people experienced. Even so, the average length of path segments, the linkage values for nodes, and the linear meters of pathway per person at the two sites are very similar, suggesting concordance in basic parameters.
Quantitative results of the segment and node analysis revealed other differences between Chunchucmil and Angamuco. For example, Chunchucmil generally has wider paths and larger nodes (broader open spaces) than Angamuco. Assuming that the similar paths per person ratio at the two sites means a similar degree of crowding, Angamuco's narrower paths meant more intimate encounters between people. The larger open spaces at Chunchucmil might indicate a greater capacity for planned and unplanned interactions. Given that open spaces were bounded by stone albarrada walls at Chunchucmil and built with sunken patios at Angamuco, these spaces, like the paths, were not casual byproducts of other spatial processes, but rather planned and integral features of the circulatory networks. At the same time, the narrower paths and smaller open spaces at Angamuco might result from Angamuco builders often working on sloped terrain that is absent at Chunchucmil. Within Chunchucmil, variation in path width generally follows expectations for managing traffic and crowds, though variation in the size of open spaces is harder to explain.
Regarding social identity, we found neighborhood-level differences at Chunchucmil in node form, path construction (cobbled), and path width. When a person from one of the neighborhoods with narrower cobbled streets walked into a neighborhood with wider, uncobbled streets, this difference could be experienced in an embodied fashion, non-discursively reinforcing the sense of difference that contributes to identity. This finding is an important one in that neighborhood identity grows not merely from face-to-face interaction (Hutson Reference Hutson2016; Keith Reference Keith and Smith2003; Smith Reference Smith2010; Thompson et al. Reference Thompson, Meredith and Prufer2018), but also from how one moves in the world and the integrative landmarks one encounters (Brown et al. Reference Brown, Perkins and Brown2003; Peuramaki-Brown Reference Peuramaki-Brown2013). Similarly, preferences on the design of movement infrastructure are also observed at a neighborhood level in Angamuco. Instead of differences in path materiality, we observed patterns of path morphology (shorter and more curved paths) in at least two areas (neighborhoods).
Future research should extend beyond Angamuco and Chunchucmil, expanding on the methods presented here and applying them to cities, such as Teotihuacan, Mayapan, and Cantona. These and other urban centers in all areas of Mesoamerica might show a compelling relationship between their movement networks and the involvement of their residents in the resulting urban layout if we attend to detailed spatial analysis of pathways.
The study of movement in Mesoamerican cities has the potential to help us understand unique urban phenomena that are generally challenging for archaeologists, like quotidian interaction, informal activities, and community negotiation of space. Through this article we presented an exploratory analysis of the movement infrastructure in two massive cities, and while this work needs to be refined and expanded, we have identified two components to extend our understanding of urban life: pathways and open spaces.
RESUMEN
Angamuco, ubicado en el centro de Michoacán, y Chunchucmil, en el oeste de Yucatán, son dos de los pocos ejemplos de ciudades mesoamericanas con mapas viales relativamente completos. Estos mapas brindan una oportunidad única para estudiar cómo la mayor parte de la población se movía a través de ambas ciudades; cómo sus habitantes trabajaron juntos para crear redes de caminos y espacios abiertos; qué tipo de interacciones permitieron estos rasgos; y cómo contribuyeron a la formación de identidades sociales. Una vez que la aplicación de algunos métodos de sintaxis espacial (Space Syntax) confirmó nuestras primeras observaciones respecto a la red de caminos de Chunchucmil sin generar nuevos hallazgos (por ejemplo, qué zonas de la ciudad tienen más fácil acceso), empleamos un nuevo método inspirado en la teoría de grafos que llamamos análisis de segmentos (senderos) y nodos (intersecciones) en ambos sitios. Este análisis nos permite registrar y evaluar ciertas variables de cada segmento en la red vial como el ancho, el largo, la forma, la pendiente y la curvatura, además de variables de los nodos, como tamaño (área), forma y número de segmentos vinculados. Los resultados de este trabajo nos permitieron obvervar que muchos de los nodos en ambos sitios son en realidad espacios abiertos (similares a plazas en otros sitios mesoamericanos), lo que nos ayuda a registrar detalles sobre la configuración de espacios públicos compartidos que son menos formales que las plazas monumentales. El análisis también reveló diferenciación entre zonas habitacionales como barrios, coordinación laboral a nivel local y esfuerzos intencionales para crear espacios de reunión que pudieron haber complementado la gobernanza colectiva propuesta para ambos sitios. Aunque Angamuco y Chunchucmil difieren en términos del patrón general de sus redes viales peatonales—por ejemplo, que la red de Chunchucmil es más extensa— ambas ciudades comparten similitudes en términos de densidad de caminos y tipos de intersecciones.
ACKNOWLEDGMENTS
Fieldwork at Angamuco and Chunchucmil was permitted by the Consejo de Arqueología, INAH Mexico and the Yucatan and Michoacan Centros-INAH, whom we thank for their support. Major funding for research at Chunchucmil came from the National Science Foundation and the National Geographic Society, in the form of grants awarded to Bruce Dahlin and Traci Ardren. Aline Magnoni co-directed the mapping operations at Chunchucmil. Funding for Angamuco and the road-mapping project came principally from the National Science Foundation. We also thank Christopher Fisher and the LORE-LPB project, who initiated research at this site. Many thanks to José Luis Urrutia Jácome, Kyle Urquhart, Kate Boston, Andee Dow, and Kiyo Gutiérrez for their generous and dedicated fieldwork, mapping streets at Angamuco. We thank numerous scholars and volunteers, especially the people from the villages of Chunchucmil, Kochol, and Santo Domingo in Yucatan, who made this work possible, as well as the Community of Fontezuelas, Michoacan, for their collaboration and permission to work on their ejido land.


 Open access