

Introduction
Quoted biopsy rates which include fine needle aspiration biopsy, core biopsy and excisional biopsy are hard to find but a recent report [1] of 3.6 : 1 benign : malignant ratio for mammographic screening is similar to our own institution and earlier reports of 7.3 : 1 [2] may well be an accurate reflection of biopsy rates for symptomatic breast problems. These biopsy rates reflect the situation where ultrasound is used as an adjunct to mammography with a significant number of abnormal mammograms and abnormal clinical findings. When ultrasound is used to screen the clinically and mamographically dense but normal breast some small occult cancers are detected but with a benign; malignant ratio of almost 10 : 1 [3] rising to almost 20 : 1 if complex cysts which need aspirating are included plus follow up of more presumed benign lesions [4].
Accurate assessment of breast cancer extent is another area which is in need of improvement. Recent publications report reoperation rates of 50% following breast conserving local excision [5,6]. Magnetic resonance (MR) is being recommended as the imaging method of choice to assess extent of tumour within the breast [7] but its greater cost than ultrasound means that development of more accurate methods of ultrasound measurement of tumour extent could provide significant cost savings by reducing reoperation rates.
Elasticity imaging
Palpation is the oldest method available for the detection of breast tumours. Before the advent of diagnostic imaging it was the only non-invasive way that breast tumours could be diagnosed. The variety of terms including rubbery, craggy or rock hard used to describe tumours relate to the ease with which the mass may be distorted by pressure. Such terms are a very crude estimation of the elasticity (deformability) of the tissues. Deformability (ease of changing shape) is part of the algorithm to determine the likelihood of malignancy in routine breast ultrasound but it only has moderate sensitivity in many lesions except for semi normal conditions such as gynaecomastia (benign lesions are more easily deformed than malignant lesions).
Measurement of tissue deformation, with applied force, by analysis of the returning ultrasound echoes, was described over 20 years ago [8,9]. Ultrasound tissue elasticity has been an area of increasing research for the last two decades [10–12] and has been applied to many different clinical situations including breast, prostate, skin [13], intra-operative brain imaging [14], cardiac [15,16] and vascular imaging [17–19]. Though most advanced in ultrasound, elasticity imaging is also being explored in other modalities including MR and computerised tomography (CT) [20].
The physics of elasticity, described by Hooke's law, Young's modulus and Poisson's ratio, is based in mechanics and relates to the distortions which occur when matter is subjected to an external force or forces. Hooke's law states that strain is proportional to stress, and therefore the ratio of the two is a constant that is commonly used to indicate the elasticity of the substance. Young's modulus is the elastic modulus for small deformations and is the force per unit cross-sectional area of the material divided by the fractional increase/decrease in length resulting from the stretching/compressing of a material. Because compression along the line of the force results in distortions to the sides of that force line the ratio of the (lateral plus elevational) strain to the axial strain is defined as Poisson's ratio. The elasticity or stiffness of the tissues can be determined from changes in returning ultrasound echoes when the tissues are subjected to a load or force.
A wide variety of approaches can be used determine the elasticity of different tissues based on comparing whole frame raw ultrasound data (radio frequency (RF) data) while changing the external force applied to tissues. Changes in this RF data can be recognised if there are distortions in some areas but not in others. The distortions are a reflection of the stiffness or elastic properties of the tissues under the investigation. Several different methods are being used to produce changes of pressure within tissues for elastography imaging. These have ranged from simple direct single compressive forces to well-defined pressure waves with the use of external vibrating sources, which can be either pure mechanical or sound generated, to forces generated by cardiac and vessel pulsatile motion. A variety of techniques are used for analysis including Doppler effects, vibration propagation, tissue velocity measurement, tissue displacement and A-line analysis and cross correlation [21].
One of the earliest real time clinical descriptions of demonstration of stiffness which could not be perceived by simple compression was the utilisation of the vibration of a patient's voice (vocal fremitus) and its effect on power Doppler images showing the Doppler signals within malignant lesions but not in benign lesions [22,23]. The vibrational characteristics of tissues are also related to their elasticity. That vibration is demonstrated by power Doppler. If the patient makes a sound with a constant pitch such as that associated with the ‘eeeeee!’ though very crude, and both operator, equipment and patient dependent, some idea of variation in tissue elasticity could be demonstrated (Fig. 1).

Figure 1. While using colour Doppler the patient is asked to say ‘Eeeeee’. The amount of vibration transmitted through the tissues is related to the elasticity of the tissues. The tissue movement is detected by the power Doppler. The lesion which is demonstrated is a fibroadenoma which is stiffer (and vibrates less) than the surrounding tissues.
Pressure waves can be generated in tissues using external low frequency (10–1000 Hz) mechanical or acoustic vibration sources (dynamic vibrations) [24,25]. Using conventional linear array ultrasound probes, high energy focused ultrasound can be used to produce a single pressure wave (pulsed excitation) [26]. The vibromechanical and acoustical methods have the advantage of producing a uniform strain field but have proved to be more complex and difficult to standardise (surprisingly) than simple mechanical freehand (static) compression [27,28].
Freehand comparative compression elastography [29] uses changes on digitised echo lines from the tissue region of interest before and during deformation to determine differences in elasticity in adjacent tissues. The returning pulse from a single sound wave gives a line of high-frequency data, and much of the information in this ultrasound data is currently not utilised for producing the greyscale image. If the RF data line is broken up into small segments, called kernels, it is possible to identify unique waveforms which are specific for a very small area or depths of tissue. As tissues are deformed these kernels will themselves not change as much in length as the distances between them (Fig. 2). Since the kernels have a unique waveform within them they can be identified along two pulses which are fired in quick succession down the same wave path or sound path. As tissues are deformed the change in distance can be used to determine the relative stiffness of the tissues (Fig. 3). If it is known how much force has been used to compress those tissues an absolute measure of tissue elasticity could, in principle, be calculated. With free hand compression in vivo it is not possible to accurately estimate the forces involved so a comparative strain map of adjacent tissues is produced.
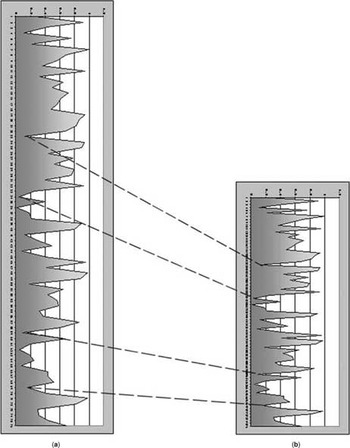
Figure 2. A diagrammatic representation of the effect on a short segment of returning echo RF data from the small same region of tissues before (A) and after (B) compression of the tissues. Kernels (short segments of RF data) do not compress as much (and are therefore more recognisable on each line) then the gaps between the kernels. The high-amplitude pulses can be recognised from both scan lines and the decrease in the gap between them indicates the distortion of that piece of tissue which occurs when compression is applied. These distances will be dependent on the elasticity of that part of the tissue being examined.

Figure 3. A diagrammatic representation of an echogenic soft lesion and a less echogenic stiff lesion showing the change in RF data lengths before (A) and after compression (B). As the tissues are slowly compressed scan lines through the same position are compared in a temporal fashion. The change in kernel positions before and after compression allows comparative elasticity differences between the two lesions and their surrounding tissue to be calculated. Comparing all scan lines in one ultrasound B-mode frame with the next B-mode frame enables a strain map to be constructed for the entire B-mode frame.
Freehand or compression elastography is the method of sono-elastography imaging which is currently becoming available for real time use with the present generation of new top end ultrasound machines. Two systems are well advanced making use of the RF signal of the returning ultrasound waves. One uses motion tracking [30,31] while the other uses a combined auto correlation method which uses phase domain processing (similar to pulsed Doppler) and correlation of the phase component of the signal for displacement measurement [32–36]. The tissue under investigation is compressed with the transducer while the scan line RF data is analysed and compared with previous image frames. The same region of interest is kept within the frame from image to image, whist slowly deforming the tissues with the probe. Small amounts of displacement of between 0.5 and 2% are necessary between frames to allow estimation of stiffness [30,31].
Recent work has confirmed that cancers tend to appear larger in a strain (elasticity) image than in the typical ultrasound greyscale (B-mode) image (Fig. 4) while the benign lesions tend to appear smaller in the strain image than in the greyscale (B-mode) image (Fig. 5) [37,38]. The extent of the strain image of cancers may be more accurate in demonstrating tumour size than the greyscale (B-mode) image [39].

Figure 4. The B-Mode image shows that the fibroadenoma (within white arrows) is larger than the elasticity footprint (within white arrows) demonstrated in the elasticity image on the right. The more yellow and orange the stiffer the region. Note the greater stiffness of the pectoral muscles (red arrows) than the overlying breast tissue.
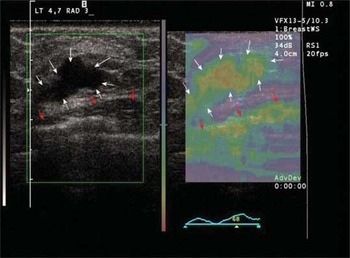
Figure 5. B-mode of an intraductal cancer on the left, elasticity (strain) image on the right. White arrows indicate the tumour and its elasticity footprint. Red arrows indicate pectoral muscle surface and its associated strain map.
Elasticity imaging adds useful diagnostic information which can help clinical management. Particular areas where it is showing promise are in the accurate, unequivocal identification of lesions such as fat islands, which can be a source of confusion, particularly for the less experienced breast sonographer. The absence of any stiffness confirms the benign nature of the ultrasound abnormality. Initial work suggests that elasticity imaging may add to the accuracy of ultrasound determined tumour extent as it can demonstrate areas of tumour related stiffness in adjacent tissue to the grey scale abnormality. Elasticity or strain imaging is a very different method, technique and image to learn, but increasing skill in interpretation appears to be providing greater accuracy in diagnosis. Like colour Doppler, used as a stand alone method of differentiating benign from malignant, it is reasonably sensitive and specific, but taken with other observations within breast ultrasound imaging, it can help to improve diagnostic accuracy.
Acknowledgements
I thank Prof. D. O. Cosgrove and Prof. T. J. Hall, Dr K. Satchithananda, Dr N. Zaman and Dr S. Comitis for critical comment on earlier drafts of this article.


