


Introduction
The implementation of AI-assisted decision-making across a variety of contexts has revealed several overarching challenges such as finding conditions that enable complementarity, assessing reliance strategies, and providing the right amount of transparency (Steyvers and Kumar, Reference Steyvers and Kumar2023). Decision-making in engineering design, like many expertise-driven professions, requires the consideration of many tradeoffs, adding complexity to collaborative human–AI interactions. In particular, questions remain about the influence of a model’s output on decision scenarios where there is no clearly defined “right” or “wrong” answer, or when there is uncertainty (Shahinur et al., Reference Shahinur, Ullah, Noor-E-Alam, Haniu and Kubo2017). There is evidence that in uncertain domains (where uncertainty cannot be resolved until the event has taken place), people, and particularly experts, prefer to use human judgment even when assisted by algorithms that can outperform them (Dietvorst and Bharti, Reference Dietvorst and Bharti2020). Engineering design can be considered such a domain because uncertainty often cannot be resolved until after costly testing or deployment procedures.
A typical engineering design process consists of several stages, such as planning, concept development, detail design, testing, and refinement. At each stage, humans must make numerous decisions related to the design (Eppinger and Ulrich, Reference Eppinger and Ulrich1995). The engineer often utilizes several methods and sources of information, including objective measures obtained from controlled testing or “rule of thumb” heuristics from experience, to make these decisions. Additionally, engineers have the increasing ability to augment their design process using computational methods and machine learning models (Egan and Cagan, Reference Egan and Cagan2016). For instance, models can be used to synthesize general concepts according to text descriptions, turning ideas into reality (OpenAI, 2021; Poole et al., Reference Poole, Jain, Barron and Mildenhall2022), or to automate the evaluation of early-stage design concepts for novelty (Camburn et al., Reference Camburn, He, Raviselvam, Luo and Wood2020). Models can also be used to synthesize designs that meet specific engineering requirements, such as airfoils with particular lift-to-drag ratios (Chen and Ahmed, Reference Chen and Ahmed2021) or part interdependencies (Chen and Fuge, Reference Chen and Fuge2019). Data-driven surrogate models can then allow engineers to simulate their designs more efficiently and enable design optimization across these numerous options for the testing and refinement phase (Wang and Shan, Reference Wang and Shan2006). Intelligent assistants have even been developed to augment engineers across multiple phases of complex system design (Bang et al., Reference Bang, Virós Martin, Prat and Selva2018). While computational models for design generation or evaluation can assist decision-making, engineers will typically make the final choices on how to utilize the model outputs for design activities.
The assistance of computational models and interfaces may benefit engineers in making difficult design decisions or navigating an expansive design space. However, enabling overall improvement in outcomes through AI-assisted decision-making relies on the ability to calibrate human trust in assistive systems (Zhang et al., Reference Zhang, Liao and Bellamy2020). Therefore, it is important to investigate what happens when these models are incorrect or when their outputs fail to adequately align with users’ intentions. There can be significant financial or safety-related costs to the outcomes (i.e., final designs) if suboptimal decisions are made during the design process. These poor decisions might stem from erroneous judgments or actions on the human side (Tehranchi et al., Reference Tehranchi, Bagherzadeh and Ritter2023), erroneous information provided by any computational tool that is used, or a combination of both (Chong et al., Reference Chong, Raina, Goucher-Lambert, Kotovsky and Cagan2022). Engineering designers can use their domain expertise to recognize errors in computational output at the cost of diminishing trust in the systems.
To investigate the behavioral impact of AI in such challenging decision contexts, a series of experiments were conducted where participants (engineers) were asked to select an optimal design while trading off between multiple objectives. During decision-making, participants were provided with imperfect AI assistance, in the form of a suggested solution from a simulated model, along with information to make their own judgments.
We aimed to address the following research questions:
-
1. What is the impact of a model’s suggestions on multi-criteria decision-making:
-
(a) when the decision is objective (i.e., there is a right answer)?
-
(b) when the decision is subjective (i.e., there is no right or wrong answer)?
-
-
2. How does increasing the number of decision criteria impact suggestion acceptance?
-
3. How does example-based explainability impact suggestion acceptance?
The results provide insights into decision-making behavior and performance during human-machine collaboration for an uncertain, multi-objective task in engineering design.
Related work
Human trust in automation and acceptance of algorithmic or AI advice
A survey on studies of human interactions with technology reveals that a variety of human factors, such as trust, mental workload, and automation accuracy, affect whether automation (defined in this case as a machine agent carrying out a previously human function) is used by a human or not (Parasuraman and Riley, Reference Parasuraman and Riley1997). Trust can be divided into beliefs or behavior, the latter of which is often referred to as reliance. While trust beliefs are often related to person-specific factors like prior experiences, trust behavior is often related to the specific task (Kahr et al., Reference Kahr, Rooks, Willemsen and Snijders2024). Humans can exhibit both overreliance and underutilization of automation, influenced by different combinations of these factors. Overreliance can be caused by using automation as a decision heuristic, a possibility for experts and non-experts alike. Underutilization, on the other hand, is often a result of a lack of trust from the human side (Parasuraman and Riley, Reference Parasuraman and Riley1997). Prior work frames the lack of proper reliance on “machine advice” as two conflicting human biases: algorithmic appreciation and algorithmic aversion. Algorithmic appreciation refers to humans preferring assistance from an algorithm over another human (Logg et al., Reference Logg, Minson and Moore2019), while algorithmic aversion refers to resistance to accepting recommendations from algorithms (even if they may outperform humans) (Dietvorst et al., Reference Dietvorst, Simmons and Massey2015). Experimental results relating to algorithmic appreciation vs. algorithmic aversion are inconsistent, with empirical evidence for some tasks supporting algorithmic appreciation and others indicating algorithmic aversion (Dietvorst et al., Reference Dietvorst, Simmons and Massey2015; Logg et al., Reference Logg, Minson and Moore2019; Dietvorst and Bharti, Reference Dietvorst and Bharti2020; Kumar et al., Reference Kumar, Patel, Benjamin and Steyvers2021). Prior work has found that appreciation of algorithmic advice reduces when people choose between the algorithm and their own judgment and when they have domain expertise. Notably, in forecasting experiments, experts exhibit reduced accuracy compared to non-experts due to their discounting of algorithmic advice (Logg et al., Reference Logg, Minson and Moore2019). Supporting algorithmic aversion, evidence shows that people are likely to disregard suggestions after observing a mistake, even if the algorithmic results outperform human decisions on average (Dietvorst et al., Reference Dietvorst, Simmons and Massey2015).
Additionally, studies have revealed that providing people with just the right amount of information can improve trust (Kizilcec, Reference Kizilcec2016) and perceptions of a model (Cai et al., Reference Cai, Jongejan and Holbrook2019). Particularly in the engineering field, humans may be more inclined to integrate AI suggestions into their work if they know how those suggestions were generated (Naser, Reference Naser2021). However, explaining the inner workings of a complex model at prediction time is a difficult task. Some studies of explainable AI methods reveal that explainability correlates with trust, accuracy, social competence, and performance (Leichtmann et al., Reference Leichtmann, Humer, Hinterreiter, Streit and Mara2023; Silva et al., Reference Silva, Schrum, Hedlund-Botti, Gopalan and Gombolay2023), but others indicate that explanations can also impair outcomes or depend on highly accurate models to be impactful (Papenmeier et al., Reference Papenmeier, Kern, Englebienne and Seifert2022; Westphal et al., Reference Westphal, Vössing, Satzger, Yom-Tov and Rafaeli2023; Kahr et al., Reference Kahr, Rooks, Willemsen and Snijders2024). Perceived explainability also varies across different methods, with simpler approaches like language-based and case-based explanations being perceived as more explainable than methods like probability scores (Silva et al., Reference Silva, Schrum, Hedlund-Botti, Gopalan and Gombolay2023). Case-based decision support, where related examples are shown in conjunction with a model’s prediction based on similarity, is an approach towards better aligning automation with humans when the final decision lies with the human decision-maker (Liu et al., Reference Liu, Tian, Chen, Feng, Chen and Tan2022). Because it may be difficult to generate language-based explanations for complicated engineering contexts (e.g., explaining the mechanism of a surrogate model for structural simulation), this study explores example-based explanations to investigate the potential influence of model explainability on decision-making.
Human-computer collaboration in engineering design
The vision for human-computer collaboration in engineering design has been to take advantage of engineers’ ability to formalize problems while overcoming the cognitive limitations of considering many variables (Egan and Cagan, Reference Egan and Cagan2016; Viros-i-Martin and Selva, Reference Viros-i-Martin and Selva2021). Models and algorithms that account for multi-objective decision-making are particularly useful in addressing the complexity of engineering design problems (Deb, Reference Deb2014). Prior work finds that bringing humans in the loop during multi-objective optimization, using a decision-making paradigm called trade space exploration or through an interactive algorithm, helps the search for optimal solutions in the face of complex design considerations (Simpson et al., Reference Simpson, Carlsen, Malone and Kollat2011; Souaille et al., Reference Souaille, Petiot, Misdariis and Lagrange2022). A study of side-by-side human-robot trade space exploration for system design finds that collaboration leads to better designs than solo efforts. However, downsides arise when humans become aware of and frustrated by the limitations of the agent and its suggestions (Law et al., Reference Law, Dhawan, Bang, Yoon, Selva and Hoffman2018).
The impact of algorithmic or AI advice for design has also been examined through tasks such as drone or truss structure design. In the case of drone design, AI assistance impacts the overall quality of an individual’s final design submissions over several objectives. Design quality is higher when participants (both self-reported experts and non-experts) are provided with AI assistance compared to when they design alone (Song et al., Reference Song, Soria Zurita, Nolte, Singh, Cagan and McComb2022). Beyond individual designers, AI assistance has also been shown to impact design teams in the case of truss design. Experimental results find that AI assistance appears to hurt the performance of high-performing teams (Zhang et al., Reference Zhang, Raina, Cagan and McComb2021). These studies demonstrate the potential for human-AI collaboration in engineering design by measuring differences in performance when participants either have or lack access to AI assistance (Law et al., Reference Law, Dhawan, Bang, Yoon, Selva and Hoffman2018; Zhang et al., Reference Zhang, Raina, Cagan and McComb2021; Song et al., Reference Song, Soria Zurita, Nolte, Singh, Cagan and McComb2022). However, performance improvements might only be realized if people are willing to accept helpful AI assistance when it is provided, as well as able to recognize erroneous AI assistance. The tasks in engineering design studies tend to be more open-ended compared to the tasks in many studies on acceptance of algorithmic advice, which have a ground truth for comparison. The study conducted here introduces some of the open-endedness typical of design by investigating multi-objective decisions while maintaining a similar structure to previous studies on algorithmic appreciation and aversion by utilizing repeated decision-making trials.
Methods overview
Two stages of human subjects studies were conducted to explore the impact of model output on decision-making. The studies each consisted of a task, where participants made repeated decisions, and a post-task survey, where participants answered questions related to the task and themselves. The common structure of these studies is outlined in this section, while study-specific differences are addressed in the “Experiment 1: Two Objective Tradeoff” and “Experiment 2: Three Objective Tradeoff” sections. The first study was conducted in August 2021, and the second study was conducted in November 2023.
Task
The context for both experiments was the redesign of a jet engine bracket for additive manufacturing. The task was based on the real design challenge hosted by General Electric on GrabCAD, where engineers had to assess a weight vs. strength tradeoff and submit optimized bracket designs, which were then evaluated using finite element analysis.Footnote 1 A dataset of these designs, their properties, and their performance was made publicly available, and a subset was used as the stimulus set for this study (Whalen et al., Reference Whalen, Beyene and Mueller2021). For both experiments, participants in our studies were asked to weigh several performance requirements (two or three depending on the experiment) for a set of design decisions. The context and instructions provided to participants are included below:
-
• Background: “Loading brackets play a critical role on jet engines. They must support the weight of the engine during handling without breaking or warping. The brackets may be used only periodically, but they stay on the engine at all times, including during flight.”
-
• Instructions: “In this task, you will have to weigh the tradeoff between [three] performance requirements: strength and deformation vs. size and weight [vs. manufacturing time], for a series of design options that optimize the bracket. The bracket will be additively manufactured.”
-
• Load Conditions (with an accompanying figure from the original challenge1): “To simulate engine transport and maximum load carrying capacity, the part has been subjected to the displayed individual load conditions.”
Participants were then introduced to the information that would be available to help them make their decisions during the task:
-
• Designs: 3D models of the designs that could be inspected through rotation and zoom
-
• Response to load: Visualizations of the displacement field from simulation under worst-case loading
-
• Objective Values: Graphs showing the design’s mass, maximum displacement across any of the loading conditions, and (Experiment 2 only) manufacturing time via metal 3D printing
-
• Model Assistance: The model’s suggestion for the better design choice (“You will receive help from the results of an optimization model trained on many designs. The best answer will be suggested based on the model results, though they may not always be right.”)
-
• Explanation (Experiment 2b only): An example-based explanation of the suggestion (“To help understand why the model is suggesting a particular design, you will also be shown an example of a similar design that would be suggested.”)
The “model” was simulated and the actual mechanism for determining the suggestion is explained in the “Dataset” section. This model could be erroneous, determined by whether it correctly suggested a better design according to the multi-objective criteria. Finally, before proceeding to the main set of trials, the participants completed practice to become familiar with the interface and task. Directly after the set of practice trials, they were given feedback on how many times they selected the optimal design during practice (e.g., “You selected the more optimal design 3/4 times”), but no information about which specific trials they answered correctly.
Dataset
There were 381 bracket designs in the dataset, representing the global design space explored during the GrabCAD challenge. Each design had an associated mass, maximum displacement (determined across the four loading conditions in the original challenge), and category (determined qualitatively in the dataset (Whalen et al., Reference Whalen, Beyene and Mueller2021)). Additionally, manufacturing time via metal 3D printing was estimated for each design using the Markforged Eiger software.Footnote 2 Bracket designs were ranked based on the concept of Pareto optimality with two or three equally weighted objectives, using non-dominated sorting (Srinivas and Deb, Reference Srinivas and Deb1994). The Pareto frontier refers to where no individual criterion can be made better without making another criterion worse. Therefore, to classify the multi-objective performance of each design via non-dominated sorting, the Pareto optimal set was calculated iteratively across the designs: (1) the Pareto optimal set (designs on the Pareto frontier using the relevant criteria) was found across the full set of designs, (2) that optimal set was removed, (3) the Pareto optimal set was calculated again for the rest of the designs, and (4) the process was repeated until each design was in one of the sets. The results of this process are visualized for two objectives and three objectives in Figure 1, where the lower (i.e., earlier) iterations indicate the more globally optimal designs as opposed to the higher (i.e., later) iterations. Using two objectives, this procedure resulted in 21 sets with a median of 19 designs per set (range: [1, 38]). Using three objectives resulted in 11 sets with a median of 27 designs per set (range: [1, 88]). This method provided a quantification of designs that were “better,” “worse,” or “similar” in performance, considering all objectives. The rankings were used to quantify which design was suggested to the participants as the model’s suggestion.
Non-dominated sorting, an iterative process of calculating rankings based on Pareto optimality, was used to quantify comparisons between pairs of designs based on multi-objective criteria. Iteration 0 refers to the globally optimal set of designs.

This simulated model was intended to emulate data-driven models, which make use of large amounts of data that humans cannot synthesize on their own. In this experiment, participants could only access a local set of designs (the two designs they decided between), while the simulated model assessed which design was better based on the global set (all the designs that were submitted as solutions in the challenge). The non-dominated sorting calculation was based only on designs that were explored during the original challenge, excluding any potentially better (but unknown) designs left unexplored. Real data-driven models share this limitation, as they may struggle to reach new areas of a design space. While there was no fuzzing factor used to rank the design alternatives and subsequently classify trials and their suggestion type (i.e., the experimental design conditions), the Appendix contains a post-hoc analysis of the impact of conducting the ranking procedure with a fuzzing factor (i.e., a fuzzy Pareto front in each iteration).
Experiments
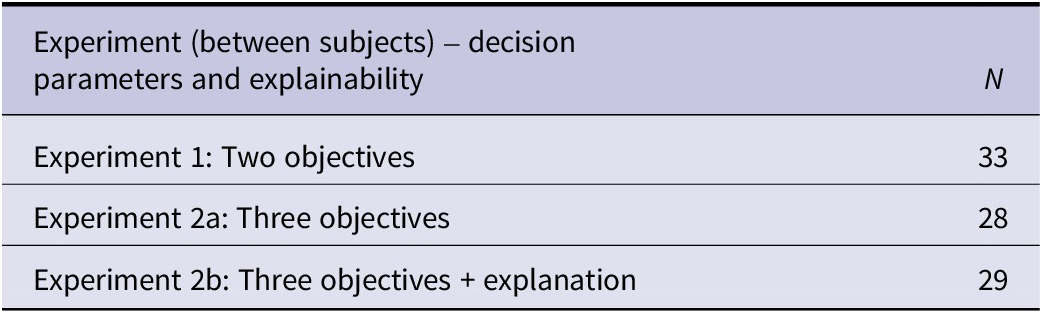
Table 1 outlines the different behavioral experiments conducted. The first experiment focused on the two objectives, weight vs. strength, originally emphasized in the challenge. However, we hypothesized that increasing the number of objectives increases the complexity of the task and may impact reliance on suggestions. Therefore, a second experiment was conducted with the addition of a third objective, manufacturing time, and an additional between-subjects manipulation to supplement the decision with an example-based explanation. Data collection for these experiments was IRB-approved and participants in all experiments were compensated $10 for their time ($20/hr). To be eligible for any part of the study, participants indicated that they were over the age of 18 and had taken at least one university course in structural/solid mechanics.
Experiments conducted and the number of participants in each
Experimental design
Each experiment (1, 2a, and 2b) had one manipulation, which was the correctness of the model’s suggestion, as shown in Table 2. The model’s suggestion could be correct (suggesting the better design), incorrect (suggesting the worse design), or equivalent (both designs are considered optimal and a random one is suggested). Participants in each experiment were exposed to all conditions (suggestion types) with the 30 total trials shuffled pseudo-randomly. A prior study shows high initial confidence in AI among engineering designers, which rapidly decreases with exposure to a 20% accurate AI agent, but stays stable with an 80% accurate AI agent (Chong et al., Reference Chong, Raina, Goucher-Lambert, Kotovsky and Cagan2022). Therefore, in this study, the accuracy of the model was set to 71% (only counting trials where there is a “ground truth” for the better design), with only 20% of the total trials being completely incorrect. An increased level of accuracy means that fewer trials are presented for the incorrect condition compared to the correct and equivalent conditions. However, sufficiently high accuracy ensures that participants do not immediately lose trust in the suggestions due to a poorly performing model, reducing changes in trust across trials over time. Constraints on the task length and the number of suitable stimuli limited the number of trials conducted for each participant to 30. Every participant had the same four practice trials prior to the main task, containing only correct and incorrect suggestions with similar accuracy to the remaining trials (75%). This approach was intentional, allowing participants to develop an intuition for the approximate model accuracy before starting the main task. Participants were given feedback on how many times they selected the optimal design during practice (e.g., three out of four times), but no information about which trials they answered correctly or the true model accuracy that was specified (71%). Additionally, participants were required to have a basic level of expertise (understanding of the performance criteria), limiting the pool to those who had an engineering background, at minimum having taken a structural/solid mechanics course to ensure understanding of the strength criterion.
Conditions and trials in each experiment

Stimuli
The stimulus sets were selected so that their multi-objective properties would represent the global space (shown in Figure 1) of designs. A total of 60 bracket designs (two designs per trial for 30 trials, shown in Figures 3 and 8) were presented to participants for the main block of each experiment, with an additional eight for four practice trials and one for the instructions. None of the stimuli were repeated within an experiment and the trials (i.e., the stimulus pairs) were presented in a randomized order to each participant during the task to account for ordering effects.
To mitigate potential confounds, several properties were balanced within the stimulus sets, ensuring that each condition contained stimuli with similar characteristics. First, the degree of domination between designs (i.e., the difference between iterations when each was considered optimal) was balanced (except for the equivalent condition, where the iteration was the same) resulting in trials both close and far apart in the multi-objective space. The designs had to be at least 4 iterations apart to avoid cases where they would be too similar to feasibly compare. Next, the difference between the performance values of each design pair was balanced, as this represents the primary information expected to guide decision-making. In particular, the displacement delta was balanced so that each condition contained approximately the same number of trials with smaller or larger differences in stiffness. Each design in the dataset was associated with a category label (block, flat, arch, beam, and butterfly), referring to the rough general shapes of the brackets. These labels were used to ensure that designs in each stimulus pair were matched and categories were balanced across conditions. Despite the careful selection of the stimulus set, some factors could not be fully accounted for due to the visual diversity of designs in the dataset, the qualitative nature of category labels, and the uneven distribution of designs across categories. Since the procedure was repeated for the three-objective tradeoff after the completion of the first experiment, we attempted to maintain similar stimuli properties between Experiments 1 and 2. Experiments 2a and 2b consisted of the same stimuli, with 2b containing an additional 30 unique designs that were presented as the example-based explanation for each trial.
Interface
The task was deployed online and participants were directed to a Google Forms survey after completion. The data from the task was collected through a custom online interface developed in Unity (using the Unity Experiment Framework (Brookes et al., Reference Brookes, Warburton, Alghadier, Mon-Williams and Mushtaq2020)) and sent to a database in Amazon Web Services. Since the two design alternatives were presented side-by-side, a counterbalancing factor was included within each suggestion type to account for whether the suggested design was on the right or left. There were slight modifications to the interface to incorporate the additional complexity of Experiment 2, explained in more detail in the “Interface” section within the “Experiment 2: Three Objective Tradeoff” section.
Survey
Participants completed a survey after the task and were asked questions about the perceived accuracy of the model, the information used to make their decisions, and the strategy used during the task. They also indicated their knowledge about the task domain and their experience in engineering or design. Knowledge of the relevant topics was rated from 1 to 7 [“Rate your knowledge of structural/solid mechanics (e.g., 4, taken 1 course)” and “Rate your knowledge of multi-objective optimization models (e.g., 4, familiar with multi-objective optimization models)”]. Participants in the group provided with an example-based explanation were given additional questions regarding their use and interpretation of these examples.
Experiment 1: two objective tradeoff
The first experiment involved participants making pairwise decisions utilizing a tradeoff of two objectives: mass and maximum displacement.
Methods
Participants
Data was collected from 33 participants recruited from a university’s design, mechanical engineering, and materials science engineering departments. Participants ranged from 19 to 31 years old (M = 22.5, SD = 3.0). 21 participants were men, 10 were women, and 2 were non-binary. There were 17 undergraduate students, 13 graduate students (PhD and masters), 2 working professionals, and 1 recent graduate. 25 participants indicated that they had 0–4 years of engineering/design experience, while 8 indicated that they had 5–9 years of engineering/design experience. Their self-reported knowledge of structural mechanics ranged from 2 to 7 (median = 5) and their knowledge of multi-objective optimization ranged from 1 to 7 (median = 3).
Interface
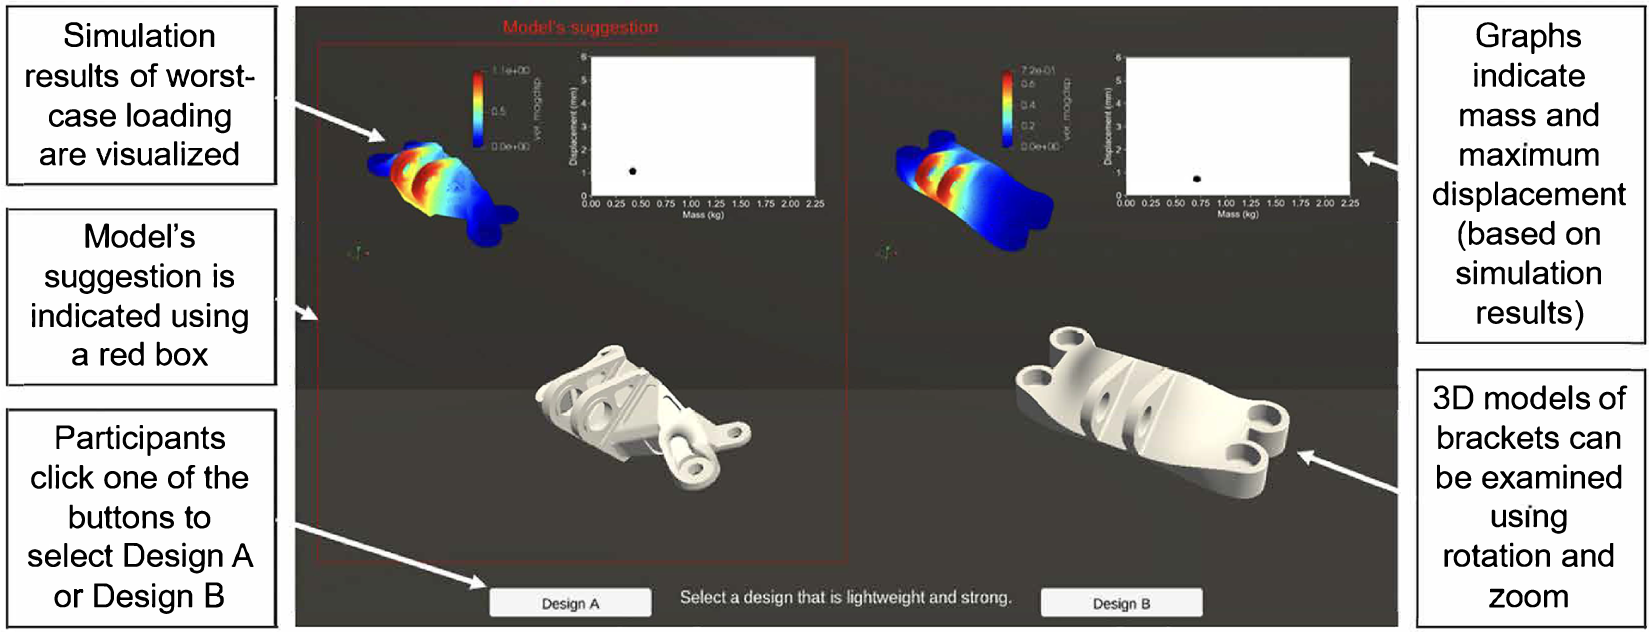
The original interface was designed to provide participants with information to make their own decisions, as well as indicate which option the model would suggest. Figure 2 shows the interface and the types of information available, including a rotatable 3D object.
Participants were instructed to select designs using the interface shown.
Stimuli
The stimuli seen by each participant were selected to represent the design space available in the dataset, considering the two objectives of mass and maximum displacement. The performance values across each objective for the stimuli in each condition are shown in Figure 3 compared to full design space.
Performance values of bracket stimuli in each condition.

Results
Data was collected about the designs selected by the participants as well as the time spent on each trial. Prior to analyzing the data from the first experiment, four trials (of 990 trials total, not including practice trials) were removed because the response time was not greater than 500 milliseconds. This threshold is above the time required to consciously recognize and respond to a visual stimulus and was chosen prior to data analysis (Grill-Spector and Kanwisher, Reference Grill-Spector and Kanwisher2005).
The effect of model error on suggestion acceptance and performance
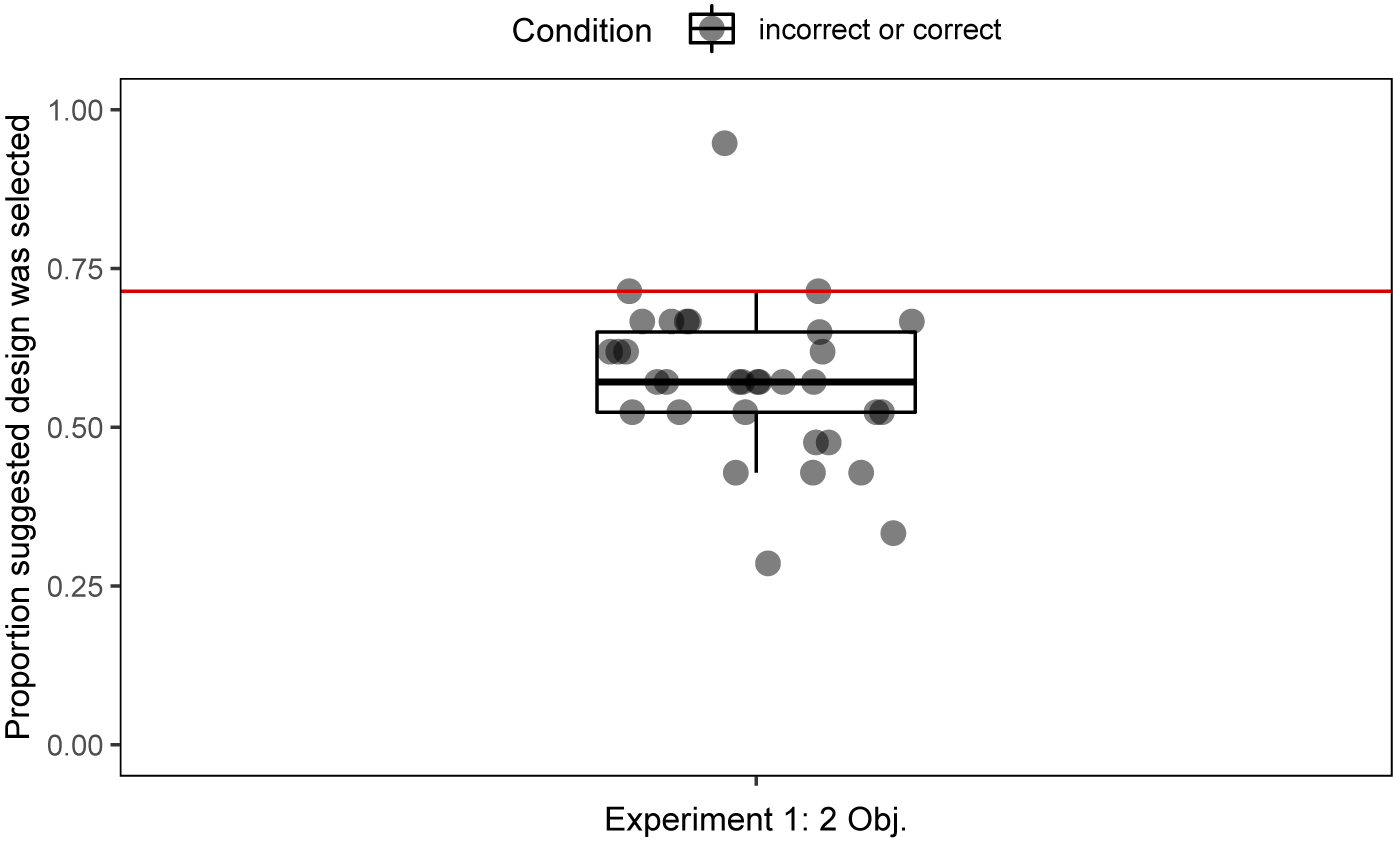
The trials were analyzed to investigate how the simulated model’s suggestion of a better or worse-performing design solution impacted participants’ decision-making. Thus, only conditions with a ground truth (“correct” and “incorrect”) were included in these analyses. Figure 4 shows the proportion of participants’ decisions that aligned with the provided suggestions (median = 0.57). The proportion of decisions that was expected to align with the suggestions, if the participant and the simulated model agreed completely, was 71%, the actual proportion of correct suggestions. A non-parametric Wilcoxon signed-rank test was conducted as the data violated the assumption of normality, showing a significant difference between the hypothesized value and the observations (W = 24.0, p < 0.001). When the performance of the two alternatives differed, participants’ selection of the suggested design was lower than expected. The participants’ performance was also quantified by participant accuracy, the proportion of the time the better-performing design was selected (the same design as the model’s suggestion in the correct condition and the non-suggested design in the incorrect condition). The median overall participant accuracy was 0.76 and participant accuracy was higher when given the incorrect suggestion (median = 0.83) vs. the correct suggestion (median = 0.73). A Wilcoxon signed-rank test was conducted, indicating that there was a significant difference in the participant accuracy (i.e., participants’ likelihood to accurately ignore a bad suggestion compared to accurately use a good suggestion) across the incorrect and correct conditions (W = 152.0, p = 0.02).
Probability of selecting the suggested design across all participants (median = 0.57) vs. the expected proportion (0.71) (W = 24.0, p < 0.001).
The effect of suggestions in uncertain scenarios
The equivalent condition was analyzed to investigate how suggestions impacted participants’ decision-making when both options were similar in overall multi-objective performance. These design pairs were ranked optimal in the same iteration, but differed in values along each objective (e.g., high mass and low displacement vs. low mass and high displacement). Figure 5 shows the proportion of selections that aligned with the model’s suggestions for each participant (median = 0.78). Considering that the suggestion in this condition was arbitrarily left or right, it was expected that the participants’ design selections would align with the model’s suggestions 50% of the time. However, a Wilcoxon signed-rank test shows a significant difference in participants’ proportional selection of the suggested design compared to the expected value in this experiment (W = 5.0, p < 0.001). When both design options were close in performance, but involved a bi-objective tradeoff, participants chose the model’s suggestion more frequently than chance alone. A Pearson correlation indicates a moderate positive correlation between the proportion of a participant’s selections aligned with the model’s suggestion (in the equivalent condition) and the participant’s accuracy (rp = 0.36, p = 0.04). Participant accuracy (incorrect and correct conditions only) tended to be higher for those who followed the model’s suggestion even when both choices were valid as the “better” design (the equivalent condition).
The proportion of trials in the equivalent condition where participants chose what the model suggested (median = 0.78) vs. the expected proportion (0.50) (W = 5.0, p < 0.001).

Trial-by-trial design properties and implications on decision-making
To qualitatively examine if specific properties (i.e., the mass or displacement) of the designs affected suggestion selection in a way that may explain the findings, a follow-up analysis was also conducted by considering each trial separately and aggregating across participants. Each trial was then examined by condition and the difference in properties between its suggested and non-suggested design. Differences across the correct trials for Experiment 1 (shown in Figure 6a) implied that the group (and not just individuals) made some decisions with an implicit weighting of criteria. If the suggested design had a higher deformation but the tradeoff for lower mass was not subjectively enough, the suggestion was followed less often (though the mass tradeoff for those trials was considered “enough” by the optimization procedure).
The difference in stimuli properties along each objective (a positive value indicates a higher value for the suggested design): (a) for all conditions and (b) as a visualized interpolation for the “equivalent” condition only.
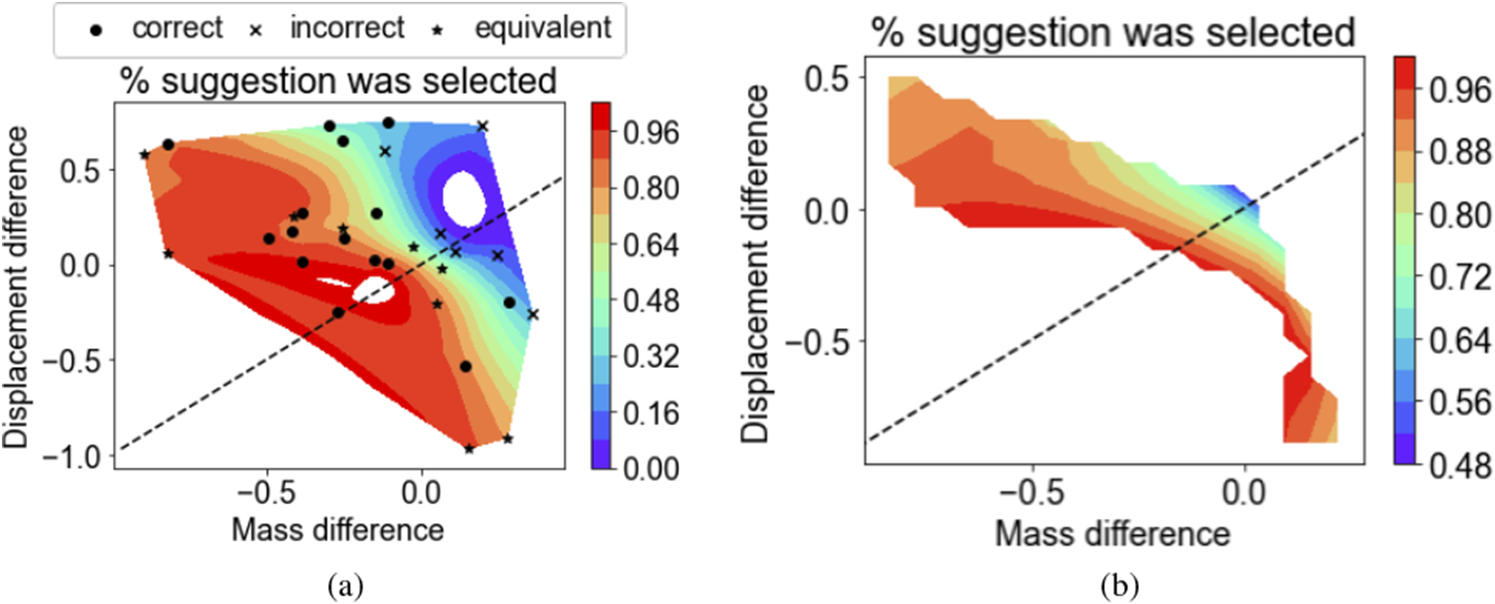
Yet preferential weighting of criteria was not necessarily applied in the equivalent condition. The preferential weighting of the deformation objective might lead participants to select the suggested design only if its deformation was lower in this condition (a negative difference). However, this was not the case. Even in trials where the deformation was higher for the suggested design, most of the participants selected the suggestion, as shown in Figure 6a. Looking only at the equivalent condition, Figure 6b demonstrates that lower suggestion selection in this condition was unlikely because of dependence on one objective over another. Instead, when the differences between both of the properties were close to zero, the decision was arbitrary and the suggested design was selected by closer to 50% of the participants. The percentage of participants selecting the suggested design was much higher when the designs were similar, but the tradeoff was not as easy to assess (larger differences in mass and displacement).
Experiment 2: three objective tradeoff
The second experiment involved participants making pairwise decisions utilizing a tradeoff of three objectives: mass, maximum displacement, and manufacturing time, with half of the participants having additional information in the form of an example-based explanation.
Methods
Participants
Data was collected from 57 participants recruited from a university’s design, mechanical engineering, and materials science engineering departments. Participants ranged from 18 to 36 years old (M = 23.0, SD = 3.4). 34 participants were men, 17 were women, 1 was non-binary, and 5 preferred not to say. There were 23 undergraduate students, 29 graduate students (PhD and masters), 3 working professionals, and 2 who preferred not to say. 43 participants indicated that they had 0–4 years, 12 indicated that they had 5–9 years, and 2 indicated that they had 10+ years of engineering/design experience. Their self-reported knowledge of structural mechanics ranged from 2 to 7 (median = 5) and their knowledge of multi-objective optimization ranged from 1 to 7 (median = 4).
Interface
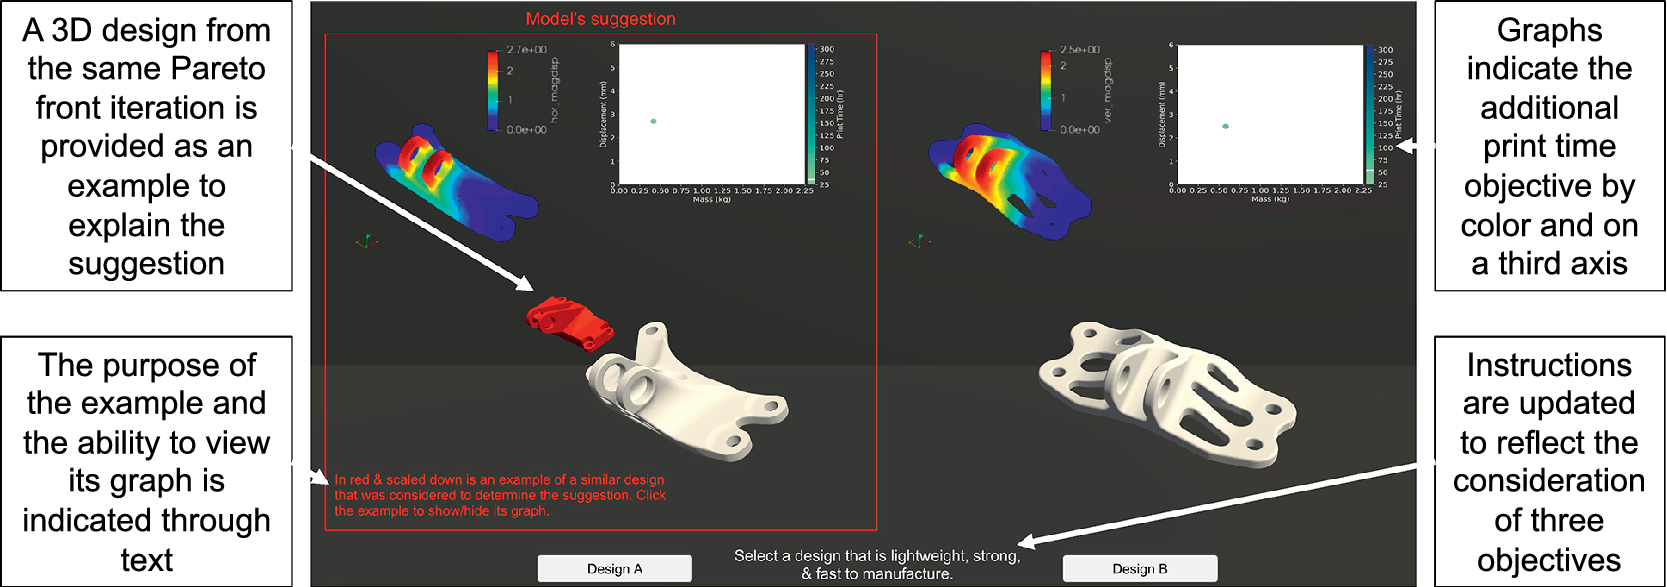
The interface was modified slightly from Experiment 1 to indicate that three objectives should be considered. Notably, in both Experiment 2a and 2b, the graph was updated to include a third axis indicating manufacturing time. In Experiment 2b only, an additional 3D model was included that was explained as “an example of a similar design that was considered to determine the suggestion.” This 3D model could be clicked to show and hide an additional performance graph for the example. Figure 7 shows the modified interface for Experiment 2b and the types of information available.
Interface for three objective decisions with an example-based explanation. The examples (highlighted on the left) are present only in Experiment 2b, while the additional objective (highlighted on the right) is present in both Experiment 2a and 2b.
Stimuli
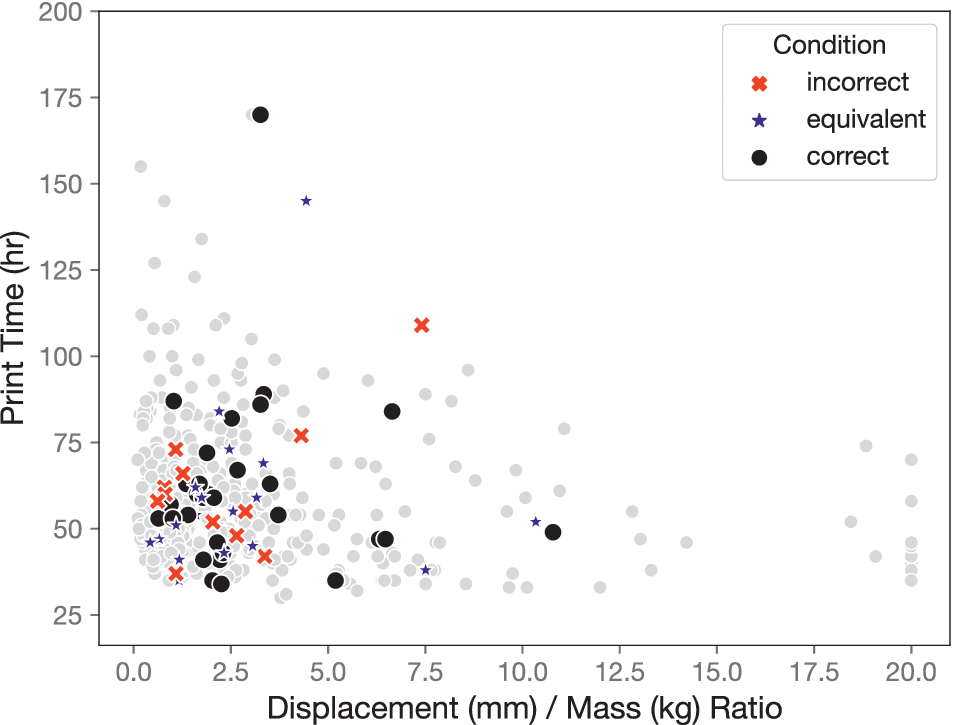
The stimuli seen by each participant for Experiment 2 were selected to represent the design space available in the dataset, using the three objectives of mass, maximum displacement, and print time, while maintaining similar coverage to the stimuli in Experiment 1. The performance values across each objective for the stimuli in each condition are shown in Figure 8.
Performance values of stimuli in each condition across three objectives.
Examples
Case-based reasoning is often used as an explanation method for classification models. The simulated model was treated like a classification model (suggesting a design as better vs. worse), where the equivalent condition was on the decision boundary. In Experiment 2b, an example of an alternative design the model would have suggested was provided to help explain the model’s suggestion for the trial. The examples were randomized with respect to their specific properties (e.g., visual, mass, displacement, or manufacturing time) but were ranked equivalently to the suggested design (Pareto optimal in the same iteration). The example, along with its associated functional quantities (on a graph), was presented to provide participants with insights into the classification process (non-dominated sorting) without having to explicitly describe it, as the description may not be possible for more complex models. The aim was to understand if the presence of the example changed the acceptance of suggestions across suggestion types, particularly in the equivalent and correct cases where both over- and underreliance were observed in the previous experiment.
Results
Similar to Experiment 1, trials with a response time below 500 milliseconds were removed before analyzing the data.
The effect of model error on suggestion acceptance and performance
The trials were again analyzed to investigate how the simulated model’s suggestion of a better or worse-performing design solution impacted participants’ decision-making. Figure 9 shows the proportion of participants’ decisions that aligned with the provided suggestions (median = 0.62).
Probability of selecting the suggested design across all participants (median = 0.62 for both Experiment 2a and 2b) vs. the expected proportion (0.71) (W = 40.0, p = 0.00056, W = 35.0, p = 0.00013).
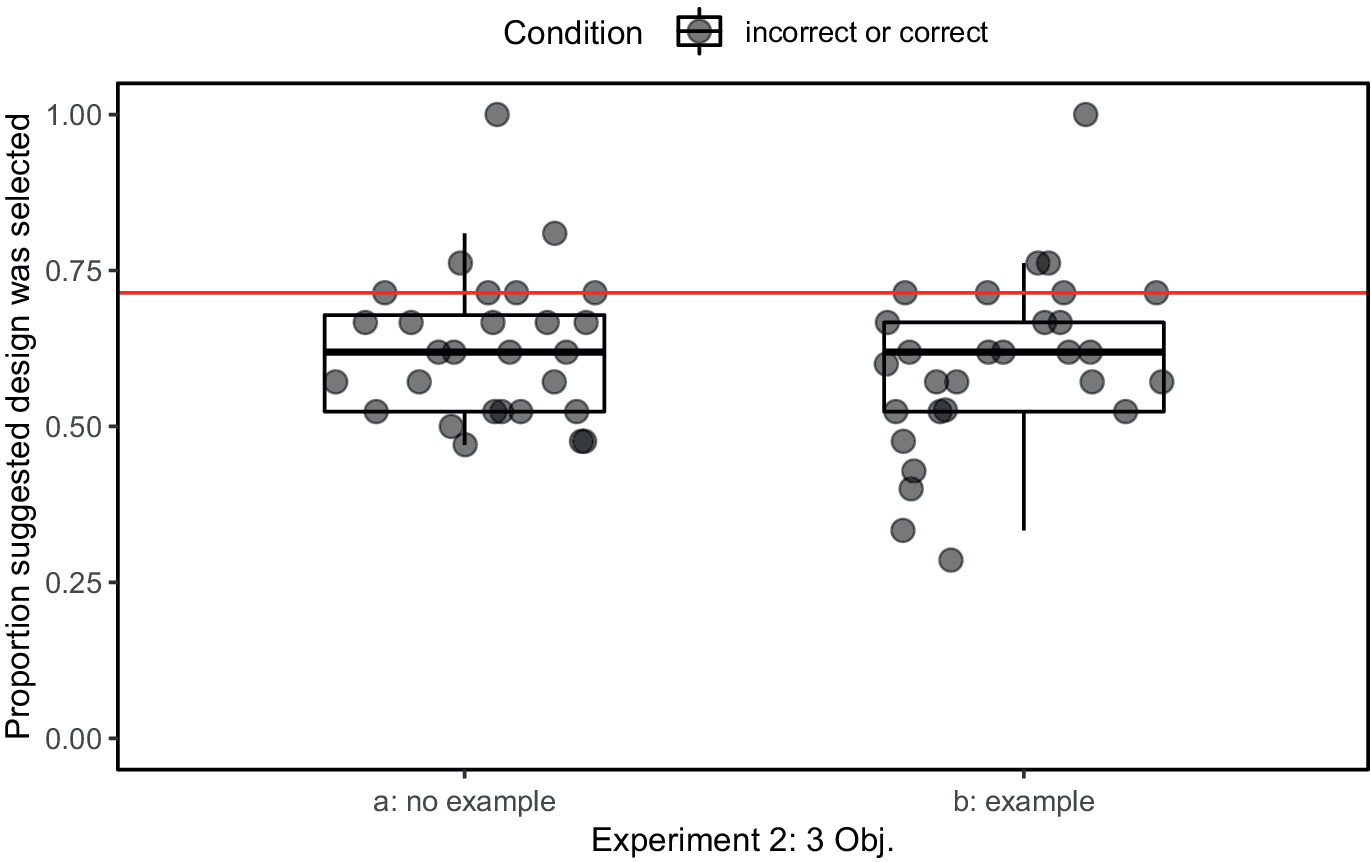
The proportion of decisions that were expected to align with the suggestions if the participant and the simulated model agreed was 71%, the actual proportion of correct suggestions. A non-parametric Wilcoxon signed-rank test was conducted as the data violated the assumption of normality, showing a significant difference between the hypothesized value and the observations (W = 40.0, p = 0.00056, W = 35.0, p = 0.00013). When the performance of the two alternatives differed, participants’ selection of the suggested design was again, lower than expected. Participants had a median overall accuracy of 0.76 in the no-explanation group and 0.75 in the example-based explanation group, respectively. In these experiments, there was no significant difference observed across participant accuracy in the incorrect (median = 0.67 and median = 0.83) and correct (median = 0.76 and median = 0.73) conditions based on Wilcoxon signed-rank tests (W = 173.0, p = 0.50, W = 77.0, p = 0.39), indicating that participants were just as likely to miss a correct suggestion as they were to follow an incorrect one.
The effect of suggestions in uncertain scenarios
The equivalent condition (design pairs sorted as optimal on the same iteration, but differing in values along each objective) was again analyzed to investigate how suggestions impacted participants’ decision-making when both options were close in multi-objective performance. Figure 10 shows the proportion of selections that aligned with the model’s suggestions for each participant (median = 0.45 and median = 0.44). Considering that arbitrarily the left or right was suggested for the equivalent condition, it was again expected that the participants’ design selections would align with the model’s suggestions 50% of the time. A Wilcoxon signed-rank test shows no significant difference in participants’ proportional selection of the suggested design compared to this expected value (W = 165.0, p = 0.56 and W = 160.0, p = 0.22). When both design options were close in performance, but involved a three-objective tradeoff, there was no evidence that participants chose the model’s suggestion differently than selection by chance. Correspondingly, there was no significant correlation between participants’ suggestion selection in the equivalent condition and their accuracy (rp = 0.16, p = 0.41 and rp = 0.12, p = 0.55).
The proportion of trials in the equivalent condition where participants chose what the model suggested (median = 0.45 and median = 0.44) vs. the expected proportion (0.50) (W = 165.0, p = 0.56 and W = 160.0, p = 0.22).

Trial-by-trial design properties and implications on decision-making
A heatmap surface for the trials in the three objective case (mass, displacement, and print time), aggregated across participants, is shown in Figure 11a. The comparison of mass and maximum displacement differs from the heatmap in Figure 6a implying that manufacturing time was, in fact, utilized by participants to make decisions in the second experiment. In this more complex case, however, no clear trends emerge regarding the impact of specific stimulus pairs’ performance values on suggestion selection. However, prioritization of the strength criterion can be seen: when the correctly suggested design has a lower mass and print time, but a higher maximum displacement, the suggested design (a good suggestion) was often ignored (“green” area in the heat map).
The difference in stimuli properties along each objective (a positive value indicates a higher value for the suggested design): (a) for all three objectives and (b) as pairwise comparisons of each objective.

Modeling decision-making for experiments 1 and 2
To compare all conditions (and groups in Experiment 2), the behavioral data for each experiment was fit using two generalized linear mixed models (GLMM) with logit link functions (i.e., logistic regression).
GLMM for design selection
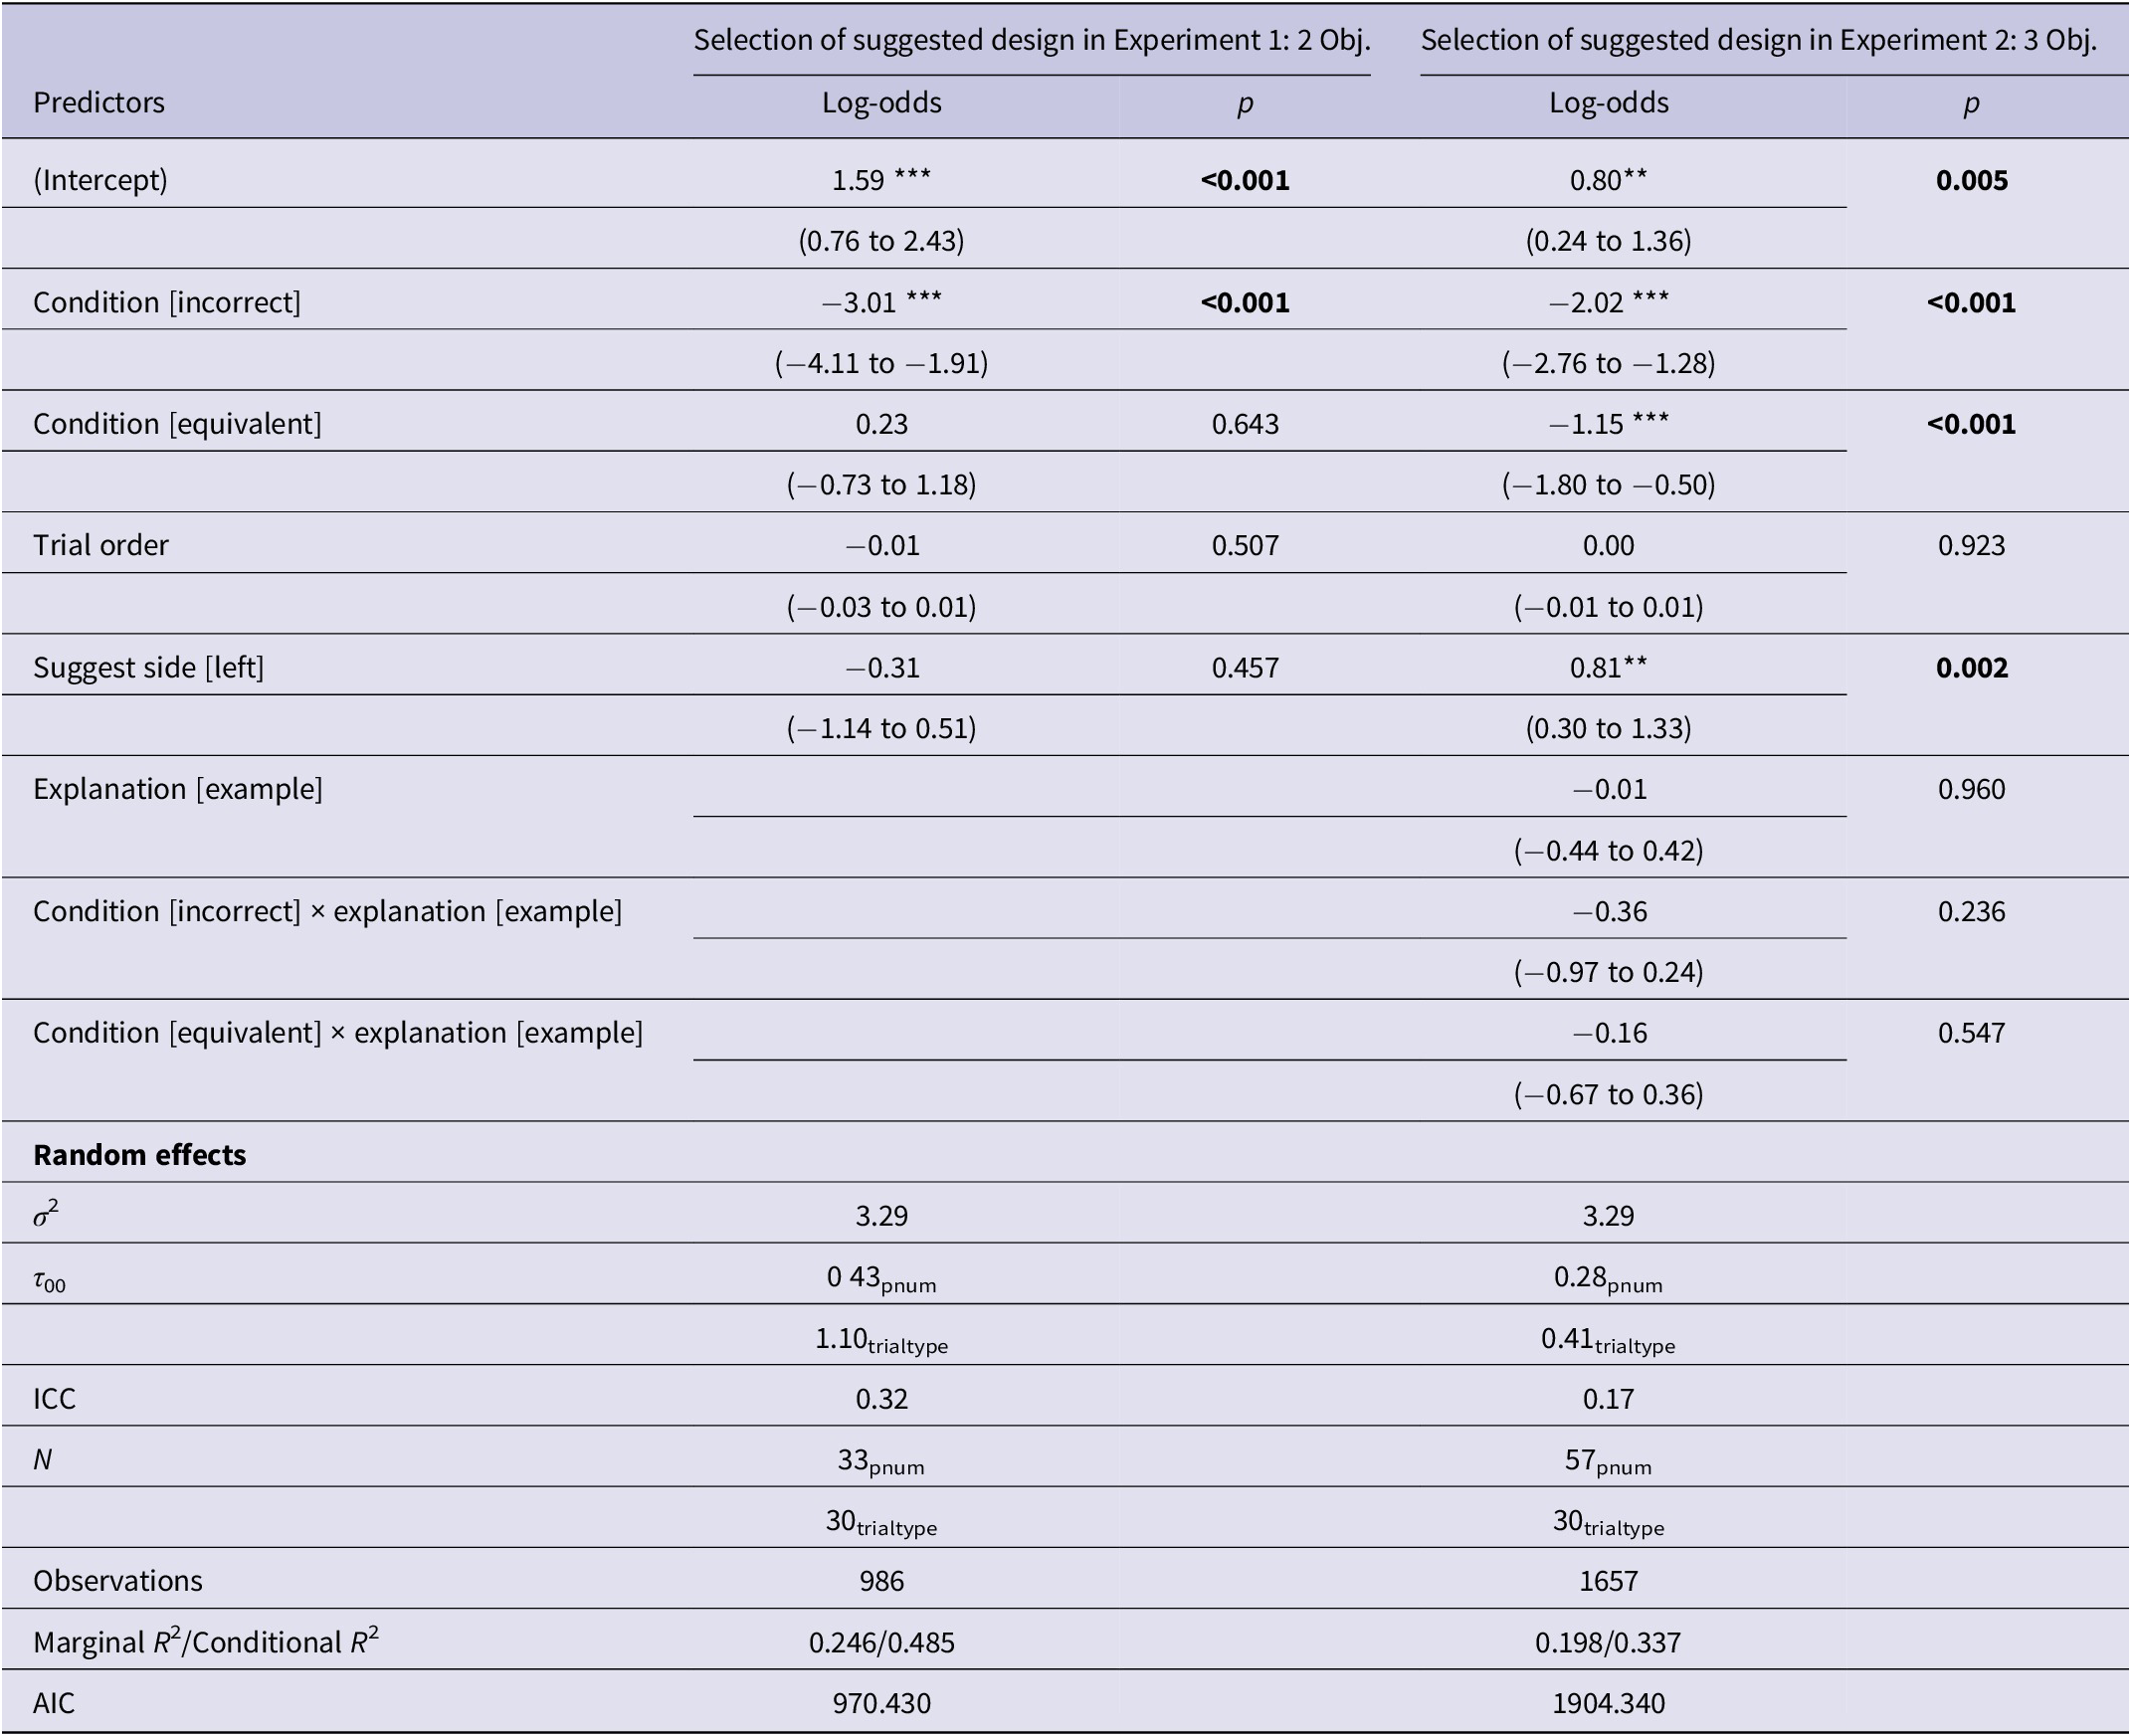
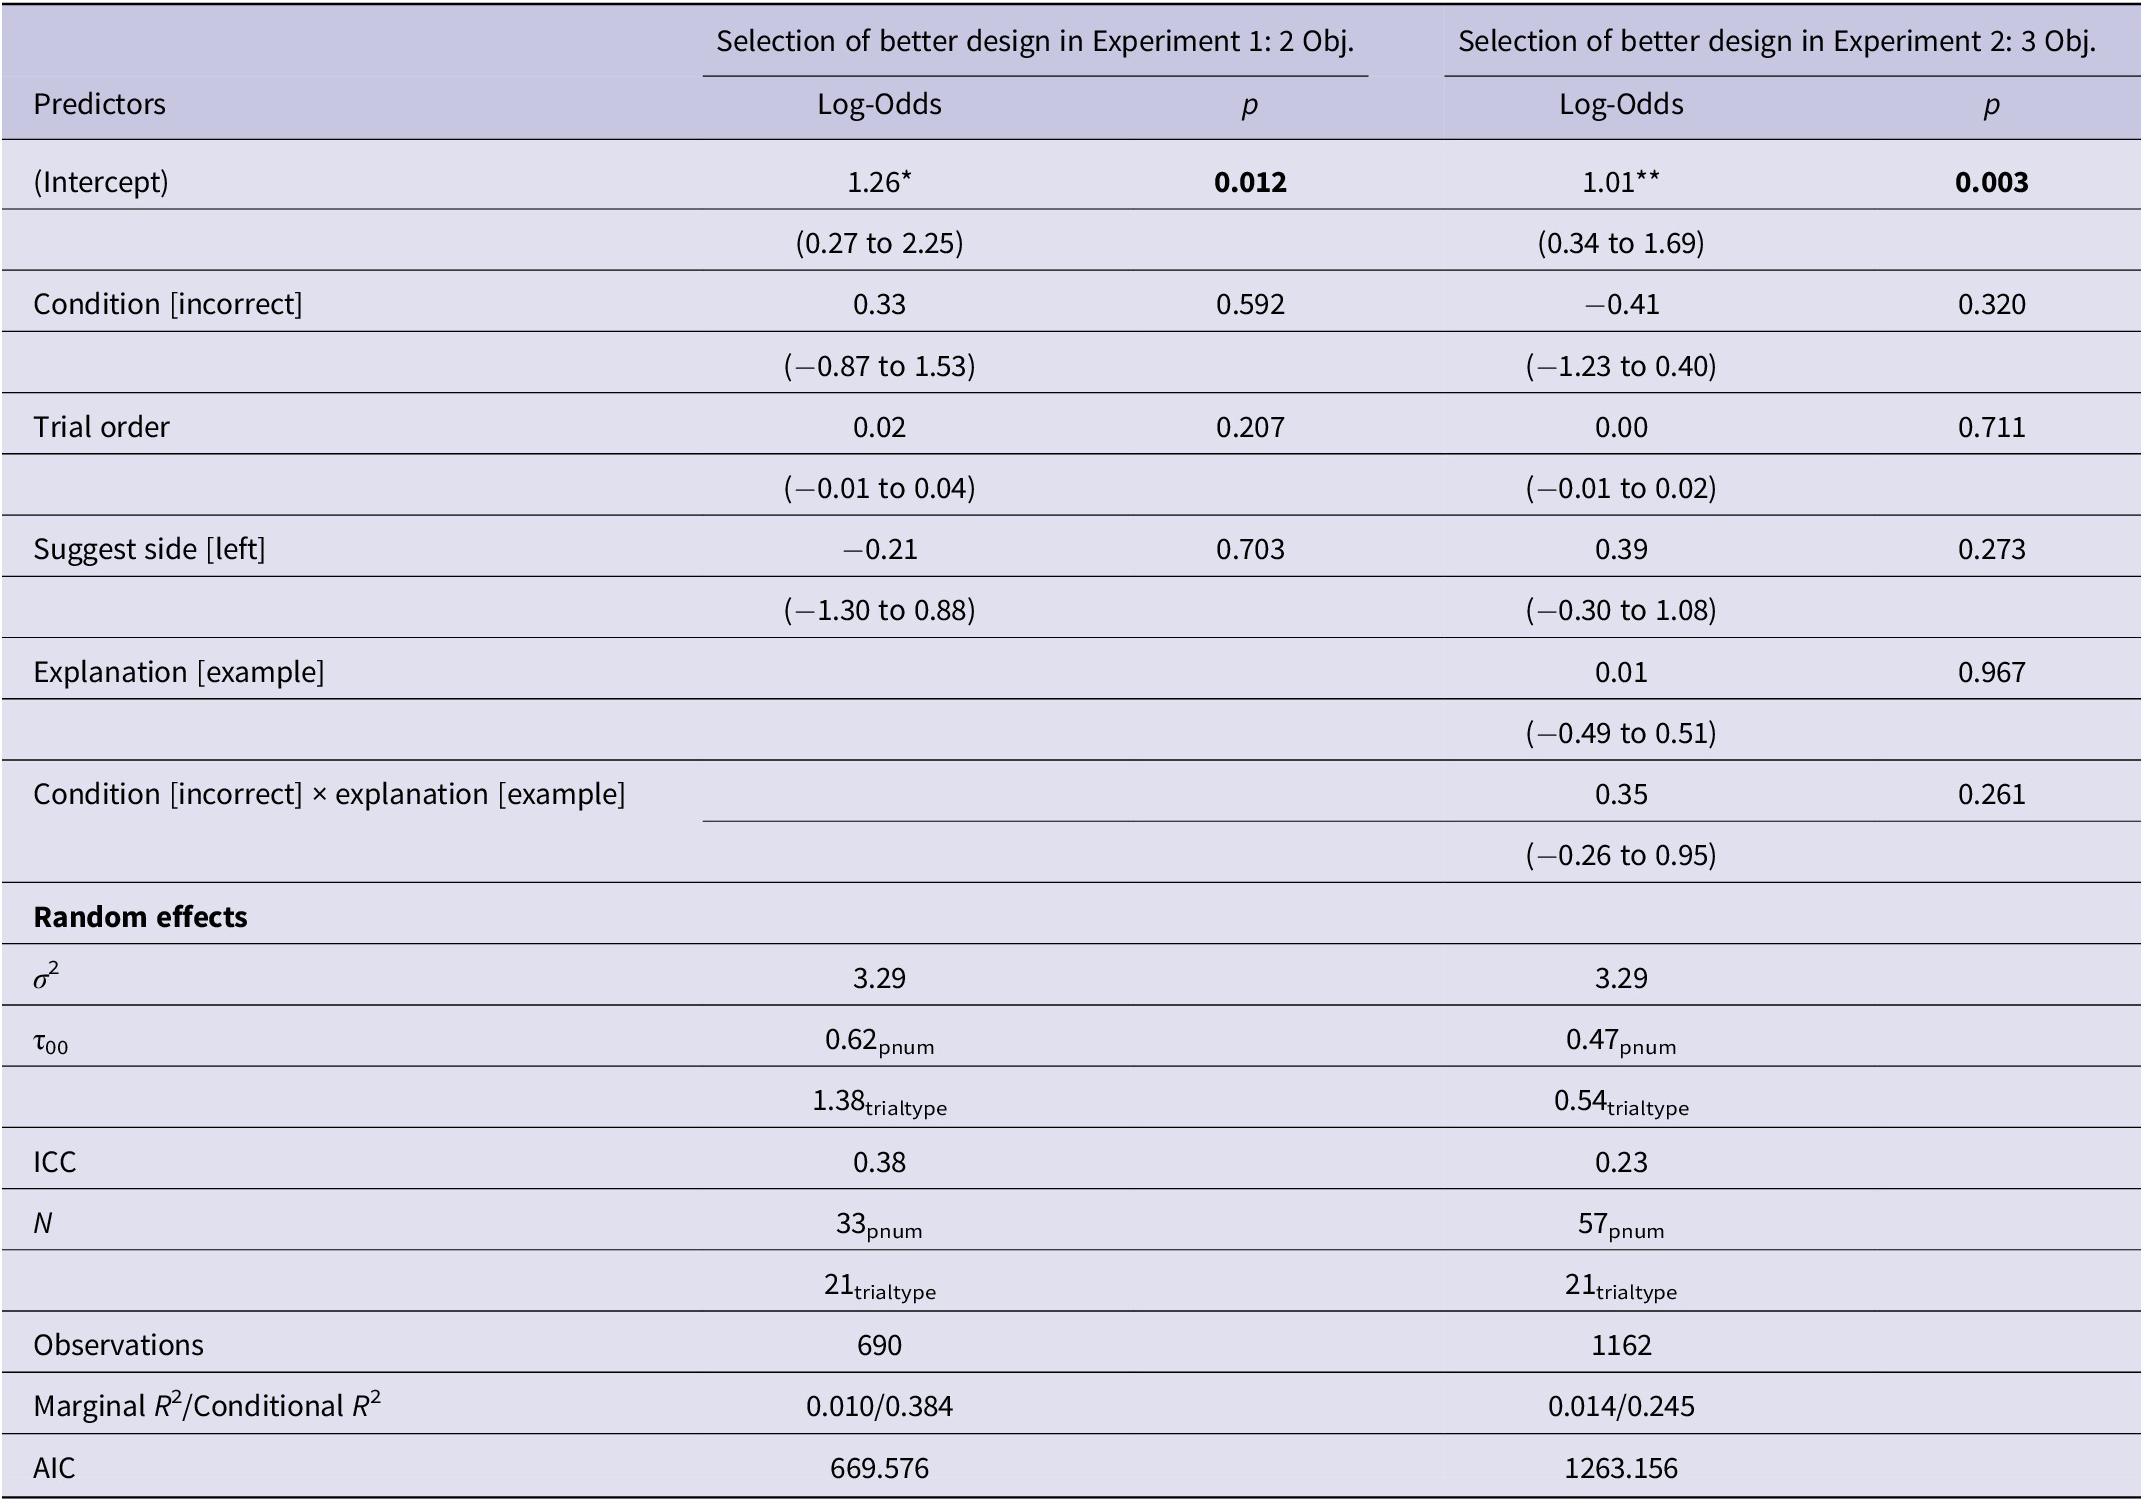
For the first model, the outcome variable was coded as follows: selection of the suggested design (1) or the non-suggested design (0). The main predictor was the condition (using dummy coding). Covariates were also included for the suggestion side (1 for left, 0 for right), which was balanced in each condition, and the trial order (numeric, starting at 1 for the first trial), since the different trial types were presented in a randomized order. For Experiment 2, an additional predictor was included to account for whether or not the participant was in the group exposed to the example-based explanation (0 for no explanation, 1 for example) and its two-way interaction with the condition (i.e., suggestion type). The considered random effects were variations by participant (to account for repeated measures) and by trial (to account for differences in the stimuli). Several models were compared using the Akaike Information Criterion (AIC) with varying random effects structures. The final model selected for each experiment contained both random effects due to trials and participants, but only varying intercepts, balancing model complexity with the limited amount of data available. These random effects account for the impact the specific participant or type of trial might have on variability in the dependent variable (i.e., selecting a specific design) compared to a group-level estimate. The results are shown in Table 3 where the reference levels of the categorical predictors are the correct condition and the right suggestion side.
Suggestion selection models for Experiments 1 and 2
*p < 0.05, ** p < 0.01, *** p < 0.001.
For Experiment 1, the model shows that, in the correct condition, the suggested design is selected more (accurately following a good suggestion) than the non-suggested design (mistakenly ignoring a good suggestion) (b = 1.59, p < 0.001). The suggested design is selected less in the incorrect condition (accurately avoiding a bad suggestion) than in the correct condition (b = –3.01, p < 0.001). There is no significant difference in selecting the suggested option between the equivalent and correct conditions (b = 0.23, p = 0.643), indicating very similar slopes (i.e., no sign of participants treating the equivalent and correct conditions differently). Figure 12a shows the predicted probabilities that result from the GLMM fit data from Experiment 1.
Group-level predicted probabilities from GLMMs compared to real participant selection data.

The interpretation of the GLMM for Experiment 2 remains largely the same, with the additional reference level being the no-example-explanation group. However, the suggested design is now selected less often in the equivalent condition compared to the correct condition (b = –1.15, p < 0.001). Figure 12b shows the predicted probabilities that result from the GLMM fit to data from Experiment 2. The results also indicate that the example-based explanation is not a statistically significant predictor of suggestion selection, accounting for interactions with the condition (i.e., suggestion correctness). There is some evidence in Experiment 2 of a tendency to select the suggested design more often on the left side compared to the right (b = 0.81, p = 0.002), but trial order is not a significant predictor in either experiment. In both experiments, consideration of random effects (clustering structure induced by repeated measurements within the subject and repeated trial types) reveals that variability due to the trial type is greater than variability due to the participant (tau 00, the between-subject or -item variance). The Intraclass Correlation Coefficient (ICC) shows that approximately 32% and 17% of the variance in the model is explained by the random effects for Experiments 1 and 2, respectively.
GLMM for accuracy
For the second GLMM, the outcome variable was coded as follows: selection of the better design (1) or the worse design (0). Again, the covariates for the suggestion side (1 for left, 0 for right) and the trial order (numeric, starting at 1 for the first trial) were included. This model analyzes the accuracy across the correct and incorrect conditions at a trial level, rather than the overall accuracy aggregated for participants and conditions. The results of the GLMMs are shown in Table 4, with the predicted probabilities and real participant-level data shown in Figure 13.
Accuracy models for Experiments 1 and 2
*p < 0.05, **p < 0.01, ***p < 0.001.
Group-level predicted probabilities from GLMMs compared to real participant accuracy data.

Despite a statistically significant difference between accuracy across the correct and incorrect conditions at the participant level in Experiment 1, the condition is not a statistically significant predictor of accuracy at a trial prediction level. For Experiment 2, neither the condition nor the presence of an explanation is a statistically significant predictor of accuracy, shown as predicted probabilities with interactions and real participant-level data in Figure 13b. There is no evidence of trial order or suggestion side significantly predicting better design selection in either experiment.
Insights from survey
Perception of model accuracy
The effect of several self-reported factors related to knowledge and perceptions was inspected to determine if these factors were related to participants’ performance and decision-making. There was no evidence of a correlation between accuracy and participants’ self-reported knowledge (1–7 Likert scale value) in the topics of structural mechanics (rs = 0.18, p = 0.32, rs = 0.12, p = 0.53) and multi-objective optimization (rs = 0.26, p = 0.88, rs = 0.15, p = 0.27,) in Experiment 1 or 2. Figure 14 shows the distribution of self-reported perceived model accuracy, with a median of 70% in Experiment 1, 70% in Experiment 2a, and 60% in Experiment 2b. Given that the accuracy of the suggestions was set to be 71% (excluding trials in the equivalent condition), participants demonstrated a clear ability to assess how often they were receiving correct suggestions. (This perception may have developed at the practice stage.) The range of perceived accuracy responses was slightly greater for Experiment 2b than for Experiment 2a or 1. Participants in Experiment 2, as a whole, followed suggestions less than in Experiment 1, driven primarily by the difference in the equivalent condition. Yet, their overall perception of the model’s accuracy remained relatively unaffected, with only a slight decrease in Experiment 2b, where the example-based explanation was provided.
Distribution of participants’ answers to the question “What percentage of the time do you think the model suggested the better design?” (median = 70%). The answer choices ranged from 0 – 100% in increments of 10.

Self-reported decision-making strategies
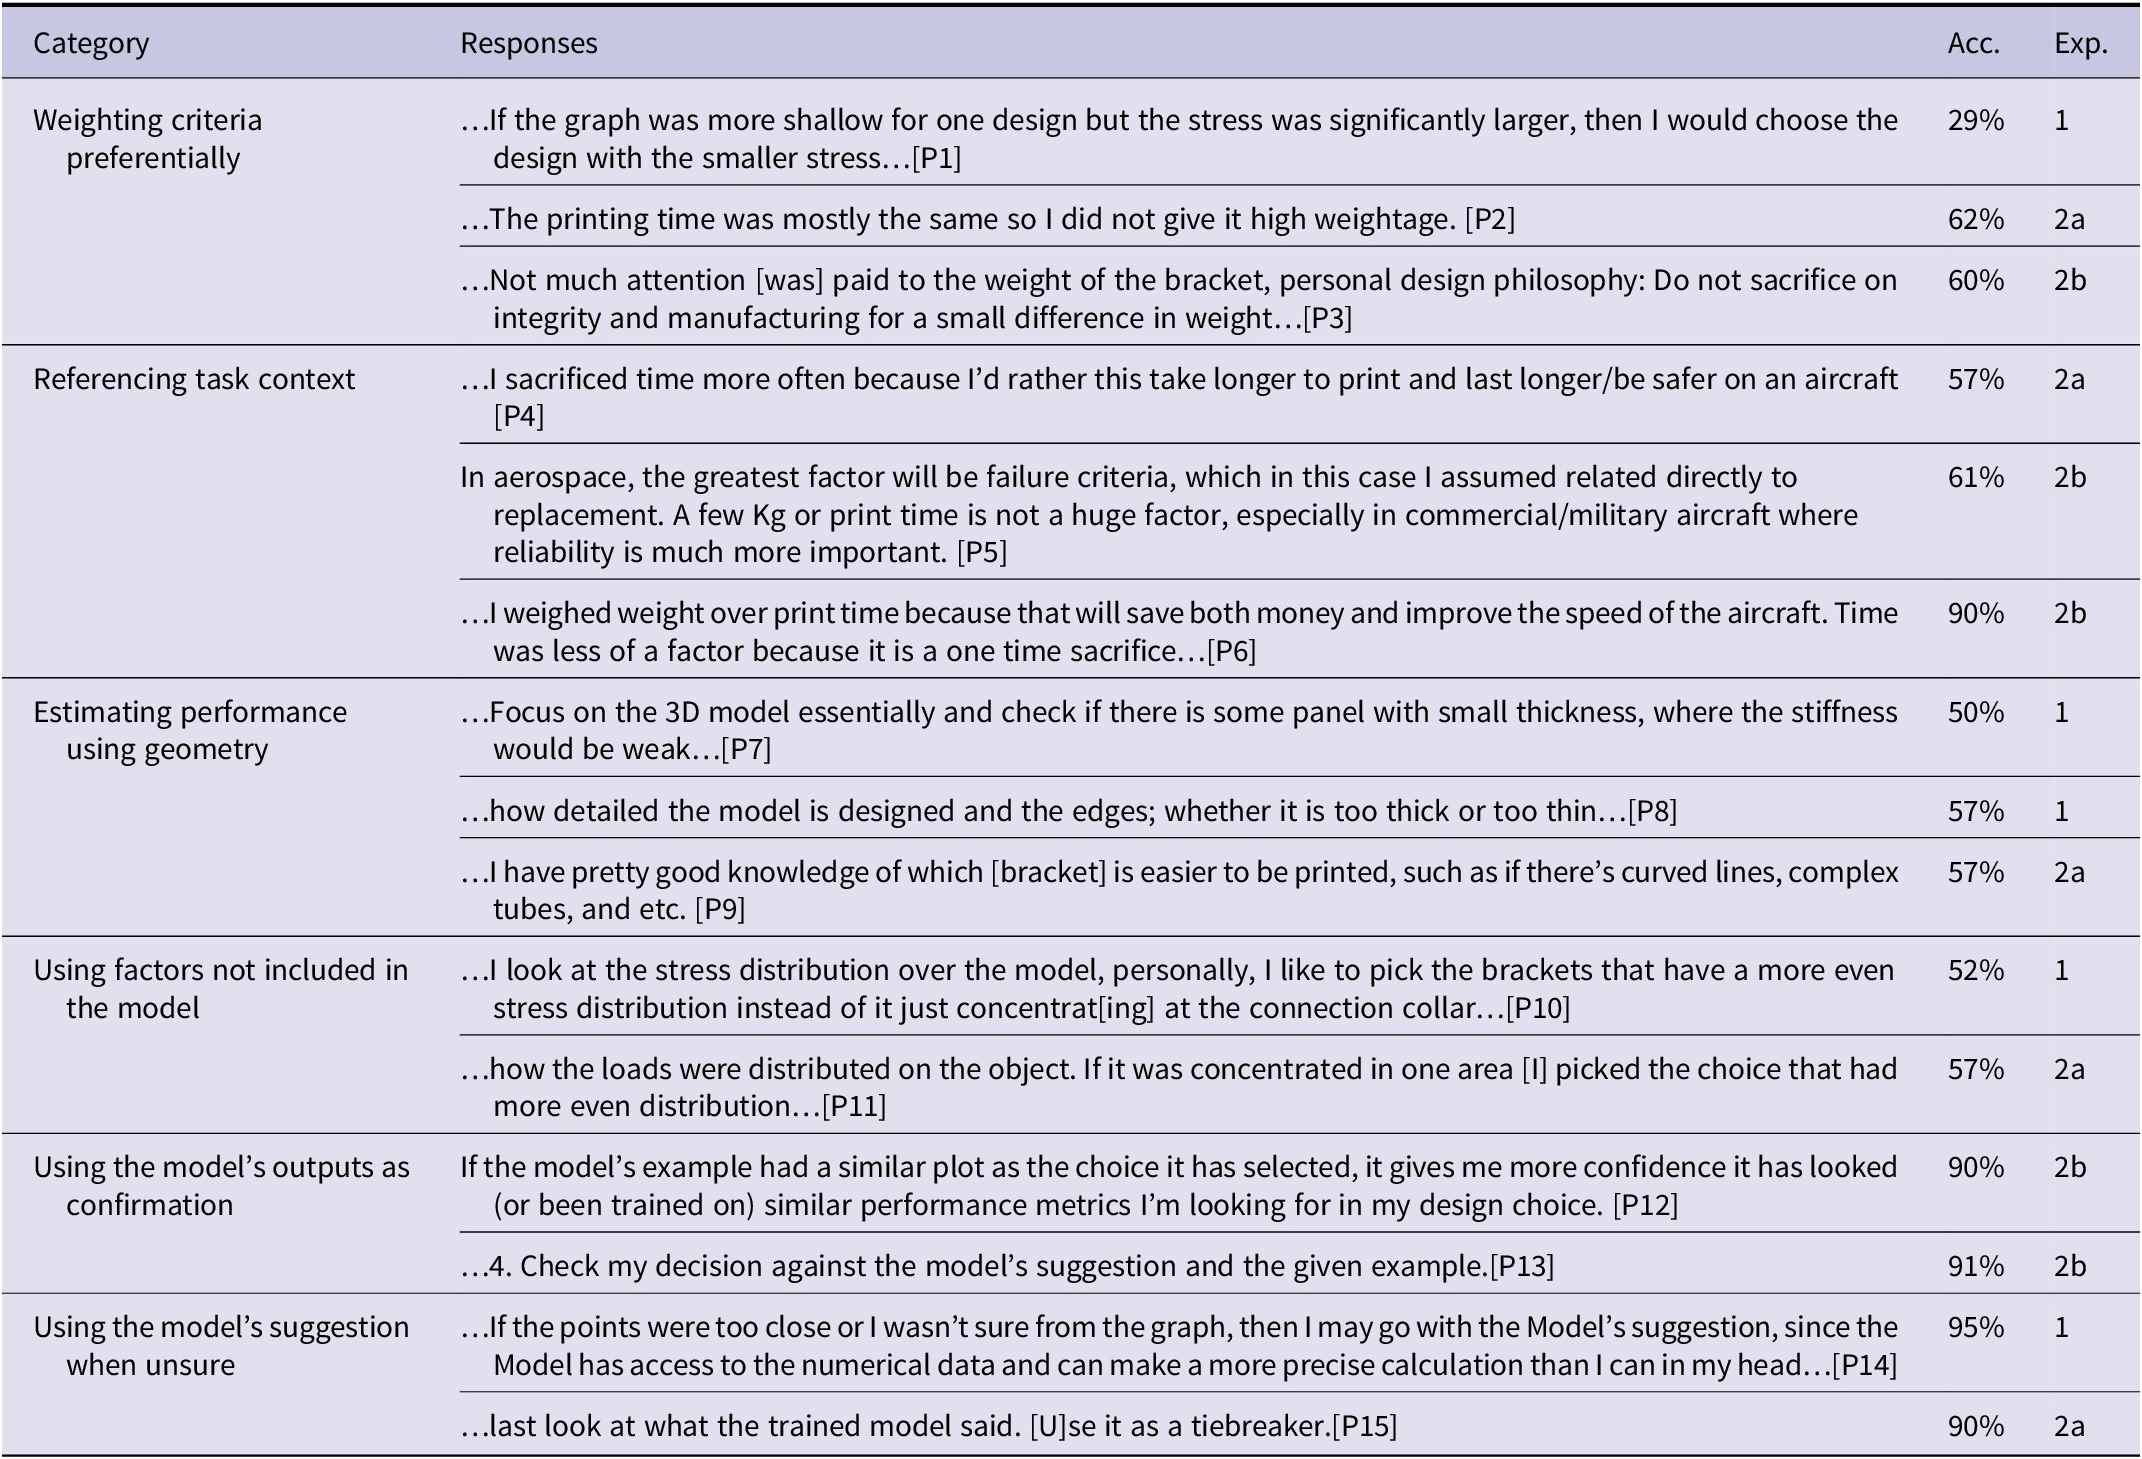
Participants’ design selections revealed the outcomes of their decision-making, while survey questions provided more insight into how suggestions were used and why a person may have performed poorly/well. Overall decision-making strategies were described in answers to the open-ended questions (“Please describe your decision-making process and strategy in detail.” and “Did the examples help explain the model’s suggestions to you? Based on your answer above, why or why not?”) and are briefly outlined below. Table 5 shows common strategies that appeared across experiments.
Strategies and reasoning from open-ended survey questions
Experiment 1: 2 Obj. One of the participants [P15] who achieved the highest accuracy had the following strategy, using their own judgment by synthesizing the provided information, but also recognizing when they would benefit from assistance from the suggestion:
…‘If part A has less than half the weight of part B and also less than twice the deflection, then part A has a better strength to weight ratio and is the better part’. If I was given a more explicit cost/benefit function then I could have optimized better, eg ‘I need the deflection to be below this value, and from there the lowest weight it best’. If the points were too close or I wasn’t sure from the graph, then I may go with the Model’s suggestion, since the Model has access to the numerical data and can make a more precise calculation than I can in my head …
Experiment 2a: 3 Obj. One of the participants who achieved the highest accuracy (90%) in this experiment had the following strategy, using the third objective to help make a final choice:
I looked at the graphs and tried to compare the values in both options. If two of the metrics seemed to be in the same range, I considered the third to be the deciding factor. If all three metrics were vastly different, I checked what option the model selected. In case it made sense to me, I went along with it. I believe the most important factor for me was displacement, followed by time and then weight.
Experiment 2b: 3 Obj. + example. In this experiment, when asked whether the examples helped explain the model’s suggestions, responses were divided (15 yes and 14 no). When asked about why or why not the examples helped, one participant [P5] identified how the simulated model worked, stating “the model did I believe [take] all factors in equally, instead of having some ranking or prioritizing (when it would fail).” However, this participant’s accuracy score was lower, likely because they used their knowledge to prioritize an objective instead of agreeing with how the model worked. Another participant [P6] was unable to understand how the simulated model worked using the example-based explanation, stating “…there was little correlation between the examples and the part, especially in their graphs.” A participant’s response to being asked about the example-based explanation demonstrates the challenge of finding the right way to explain the model’s suggestion:
…I don’t think just an image can explain the intricacies of an optimization algorithm – but there really isn’t any concise way to explain why an optimization algorithm did what it did…
Discussion
As computation is used to assist increasingly complex decision-making, it is important to understand the effects of erroneous or questionable model output on these decisions. In this study, these effects were examined in a multi-objective engineering design decision context. The major outcomes from Experiment 1 (bi-objective) and Experiment 2 (tri-objective) were as follows:
-
1. In both Experiment 1 and 2, when there was a clear correct or incorrect answer, AI suggestions were followed less than expected (Figures 4 and 9).
-
(a) In Experiment 1, there was an observed difference in accuracy by incorrect vs. correct suggestion types.
-
(b) There was no evidence that incorrect vs. correct suggestion type differed for predicting accuracy in either Experiment 1 or 2 (Figure 13).
-
-
2. When both design alternatives equivalently satisfied the task (the equivalent condition), suggestion selection behavior differed across Experiments 1 and 2.
-
(a) In Experiment 1, arbitrary AI suggestions were followed more than expected (Figure 5).
-
(b) In Experiment 2, arbitrary AI suggestions were not followed any differently than expected (Figure 10).
-
(c) In Experiment 2, there was evidence that the equivalent vs. correct suggestion types differed for predicting design selection (Figure 12b).
-
-
3. There was no evidence that example-based explanations of AI suggestions impacted decisions in Experiment 2 (Tables 3 and 4).
An analysis of individual trial types and reported strategies revealed that preferential weighting of criteria may have been utilized differently in Experiments 1 and 2. In Experiment 1, the model’s suggestion, rather than a weighting of criteria, was used in the equivalent condition when the performance values were very different from each other. However, in Experiment 2, reliance on the model’s suggestion was not observed, with many participants explicitly stating the order in which they considered the objectives for decision-making instead. Low accuracy resulted when this weighting was highly misaligned with how the model was specified (e.g., when a participant ignored an objective completely, considering it unimportant). A misaligned weighting was sometimes due to context-specific considerations of engineering design for the aerospace industry. Some also made their decisions based on factors not accounted for by the simulated model (e.g., stress distribution rather than maximum displacement) or used intuition about a specific objective rather than utilizing the information given (e.g., assessing print time based on geometry) – perhaps due to the overload of information available. The model’s suggestions and example-based explanations were mentioned as aids to both confirm and make final decisions, whether they were followed or not.
Engineers utilized machine suggestions less than expected in objective scenarios
Based on the results, participants appeared to rely on their own judgment and not on the suggestions in the incorrect and correct conditions, often selecting the alternative design even when the correct one (at least, specified as correct using non-dominated sorting) was suggested. A statistically significant difference in participants’ selection of suggested designs and the expected proportion (57% and 62% instead of 71%) in the correct and incorrect conditions indicated suggestion underutilization. Survey responses, which sometimes explicitly mentioned not using the suggestions, supported the observed behavior. However, when the participants were unable to synthesize the provided information to determine the right ratio of mass and deformation or mass, deformation, and print time, not utilizing the suggestions harmed their overall performance. In Experiment 1, participant accuracy was higher for the incorrect suggestion condition compared to the correct suggestion condition (83% vs. 73%), suggesting that participants were more likely to successfully ignore incorrect suggestions than properly follow correct ones. While the overall accuracy was similar between Experiment 1 and 2, the condition-level accuracy difference did not persist in Experiment 2, when participants made three objective decisions. Here, participants often ignored good suggestions, but similarly often mistakenly followed bad ones.
These results align with prior work that observes algorithmic aversion (Dietvorst et al., Reference Dietvorst, Simmons and Massey2015; Kumar et al., Reference Kumar, Patel, Benjamin and Steyvers2021) and finds that experts may hurt their accuracy by disregarding the algorithm’s suggestions (Logg et al., Reference Logg, Minson and Moore2019). The group of participants in our study were not necessarily experts in the topic. Though they were required to meet a minimum amount of knowledge in the general area, participants’ performance without any suggestions was not assessed. Relatively consistent participant accuracy and qualitative survey responses indicate at least a baseline ability to make the decisions necessary for the task, which may explain the similarity in findings. Here, the participants actually demonstrated slightly greater overall accuracy than the model in both experiments (75–76% compared to the model’s 71%, excluding equivalent trials). Particularly in Experiment 1, it was evident that accuracy was elevated by participants’ ability to identify better designs when the model could not (incorrect suggestions), but diminished by frequent cases where the participants did not follow a correct suggestion. Prior studies of AI assistance in engineering design have found that AI assistance improves design quality for individuals (Law et al., Reference Law, Dhawan, Bang, Yoon, Selva and Hoffman2018; Song et al., Reference Song, Soria Zurita, Nolte, Singh, Cagan and McComb2022), yet in this study, these opportunities for improvement are underutilized. In the context of human-computer collaboration in engineering design, the incorrect and correct conditions represent scenarios where the computer can easily find a better design (by ensuring the design is closer to Pareto optimal) compared to a human. Therefore, our finding of algorithmic aversion may conflict with humans’ desired ability to leverage the strengths of computation.
Qualitative insights from participants’ open-ended answers demonstrated that low participant accuracy was sometimes explained by a difference in how participants were making decisions (weighing one objective over the other) and how the model was providing suggestions (weighing both objectives equally). Thus, low accuracy may not always reflect poor performance or lack of knowledge but alternatively a mismatch between what the human vs. the model deemed important for the task. These types of responses reflect realistic situations where a specific criterion must be prioritized, although the participants in this task were not instructed to do so. In a more realistic setting, there may be additional factors involved in the process of selecting a design. For example, the background information for the task indicated that the brackets would be made using additive manufacturing. When the print time was excluded in Experiment 1, design choice may have been influenced by a participant assessing manufacturability, despite its lack of inclusion in the simulated suggestion or the provided information. Even when manufacturing time was included in Experiment 2, strength was often prioritized over any other objective by those who carefully considered the context of the bracket being used for aircraft. Perhaps, in reality, an equal weighting of objectives is more likely to be applied after ensuring that strength meets a safe threshold. Overall, participants’ decisions often represented a design mindset, rather than a purely computational mindset (Kelly and Gero, Reference Kelly and Gero2021), sometimes resulting in a lack of alignment with the study-specified model.
Engineers demonstrated over-reliance on machine suggestions when the better design alternative was uncertain, but only when given fewer decision parameters
The results indicate that participants made their own informed decisions rather than relying on suggestions in the ground truth conditions, even though, in those conditions, the better design could be determined computationally. On the other hand, the equivalent condition represents a collaborative scenario where the strengths of human decision-making might be particularly important. A computer can output several viable solutions based on multi-objective criteria but may not be able to distinguish between them. Counterintuitively, in Experiment 1, participants readily followed suggestions in the equivalent condition. This was demonstrated by a statistically significantly higher proportion of suggestion selection than expected in the equivalent condition (78% instead of 50%) and qualitative data on decision-making strategy. The outcomes from the GLMM also support this result, with selections in the equivalent condition closely matching those in the correct condition. The correlation between a participant’s suggestion selection (equivalent condition) and their accuracy (incorrect and correct conditions) indicates that participants who were more willing to accept the model’s suggestion did better in Experiment 1. Thus, participants who were less likely to choose the suggestion in the equivalent condition (indicating less reliance on the model) were more likely to fail to follow the model even when it was correct. This, in turn, affected their overall accuracy. When the third objective of manufacturing time was added in Experiment 2, the results changed only for the equivalent condition. In Experiment 2, there was no evidence of overutilization in the uncertain case, while accuracy (representing behavior in the other conditions) remained similar to Experiment 1. It is possible that in Experiment 1, the decision parameters were underspecified. As a result, perhaps participants had a hard time making decisions in the uncertain case and used the suggestion as a deciding factor. This may have also been compounded by a slightly lower self-reported knowledge of multi-objective optimization (a median rating of 3 vs. 4) for Experiment 1 participants.
Outside of the engineering design domain, a study of AI advice acceptance reveals that when people lose self-confidence, they may begin to rely on poor AI suggestions (Chong et al., Reference Chong, Zhang, Goucher-Lambert, Kotovsky and Cagan2022). However, these results are reversed when a similar study is done in the context of an engineering-specific task: lower self-confidence and higher confidence in the AI are associated with a lower likelihood of accepting suggestions. Thus, the association between confidence and acceptance may be confounded by factors related to the task (Chong et al., Reference Chong, Raina, Goucher-Lambert, Kotovsky and Cagan2022). While participants in our study tended not to follow model suggestions that were clearly wrong, in Experiment 1, they were more likely to follow arbitrary ones when the decision was less clear, perceiving them as correct. Prior studies also indicate that once a design team starts following the advice, they often stop exploring the design space themselves (Zhang et al., Reference Zhang, Raina, Cagan and McComb2021) and that a collaborative agent can decrease coverage of the design space explored (Law et al., Reference Law, Dhawan, Bang, Yoon, Selva and Hoffman2018). The results of our studies reinforce concerns around the influence of computational outputs on decisions, even if they are not clearly poor suggestions, particularly if a person does not have the full information about the factors they should consider on their own. Thus, the results show the delicate balance necessary to take advantage of human-computer collaboration during complex design decisions.
Considering the impact of model accuracy and explainability
Research suggests that trust in a model increases when its observed accuracy surpasses a user’s own performance (Yin et al., Reference Yin, Wortman Vaughan and Wallach2019). In our experiment, participants may have judged early on (e.g., during practice trials) that their accuracy would exceed the model’s accuracy, potentially affecting their trust and subsequent utilization of the model’s suggestions. Prior work indicates that trust in automated systems tends to decline only when accuracy drops to 70% (compared to 100%, 90%, or 80%) (Yu et al., Reference Yu, Berkovsky, Taib, Conway, Zhou and Chen2017), while studies in engineering design show stable trust at 80% model accuracy (Chong et al., Reference Chong, Raina, Goucher-Lambert, Kotovsky and Cagan2022). Our model’s accuracy was 71%, which may have been near the threshold for eliciting reduced trust. Additionally, the presence of equivalent trials may have influenced participants’ perceptions of the model’s accuracy. Depending on whether the participants considered the equivalent suggestions as correct or incorrect, they might have perceived the model to be between 50% and 80% accurate. Therefore, it is possible that a higher model accuracy may prevent underutilization in the correct/incorrect conditions. However, a higher perceived accuracy might also correspondingly increase over-utilization in the equivalent case, depending on the complexity of the task. Additionally, in this work, the example-based explanation did not significantly boost participants’ overall accuracy. A very slight increase in accuracy for identifying bad suggestions in the presence of the example-based explanation vs. none provides an indication that an example-based explanation might be primarily helpful in identifying bad suggestions. Yet if increased identification of bad suggestions also leads to failure to follow good suggestions (i.e., a loss of trust in the suggestions), overall participant accuracy will not improve. The failure of explanations to improve trust in models, and sometimes even decrease trust, has been observed in studies in various domains. When provided with explanations that are not meaningful to humans, participants have been observed to underestimate model accuracy. One theory for this is that explanations that are not meaningful to users can lead to expectation mismatch, reducing trust (Glass et al., Reference Glass, McGuinness and Wolverton2008; Kahr et al., Reference Kahr, Rooks, Willemsen and Snijders2024). Furthermore, there is evidence that accuracy greatly outweighs explanation for facilitating trust (Papenmeier et al., Reference Papenmeier, Kern, Englebienne and Seifert2022). Additionally, the benefit of an explanation – in particular an understandable one – on reliance has been observed to be greater when paired with a high-accuracy model (Kahr et al., Reference Kahr, Rooks, Willemsen and Snijders2024).
Limitations
Several limitations that should be considered. Design decisions, such as those investigated here, take place over a longer timescale and often involve more context than provided in the current studies. This effect is amplified when more objectives are introduced. Additionally, errors in data-driven models related to engineering may be more subtle than the error introduced here, which involved suggesting the wrong design in its entirety. Despite using a real dataset and context, the simulated nature of the model limits the study’s ecological validity. Additionally, despite ensuring a baseline level of knowledge, participants’ lack of specific domain expertise (i.e., experience designing parts for jet engines) may impact the results. Some limitations relate to the study setup, such as a small sample size and counterbalancing (for instance, switching the underlying stimuli associated with correct and incorrect model responses for a subset of the items). Though the bracket design pairs presented as stimuli were balanced across several properties (e.g., category and criterion values), there may have been small differences in trial difficulty across conditions caused by latent differences in the stimuli sets. In particular, including a third objective increases the size of the non-dominated sets during sorting as demonstrated in the “Dataset” section. Therefore, the trials in Experiment 2 may have been easier as the stimuli pairs may have been “further apart” than those in Experiment 1. This decrease in trial difficulty may have offset any increased task difficulty, potentially explaining the observed similarity in participant accuracy across the two experiments. We must also note the increasing amount of information in the three different interfaces and how this information was presented. Particularly, the way the information is presented can impact whether an objective is considered more important or easier to prioritize, especially in the absence of domain-specific knowledge.
Implications and future considerations
The results from this study provide insights into human-AI interaction for multi-objective, technical tasks and motivate many avenues for future research. Based on the results, there may be nuance to reliance strategies based on the type of individual decision (in this case, decisions that require more objectivity vs. subjectivity), as well as depending on the task parameters (in this case, two vs. three objective scenarios). These subtleties must be addressed in systems meant to support decision-making for complex tasks – such as those within engineering design. Furthermore, strategies like improving explainability alone cannot address scenarios where a model’s “correct” outputs conflict with humans’ contextualized decision-making. Instead, adaptivity may be necessary. Recent work has illuminated the importance of mental models (Bansal et al., Reference Bansal, Nushi, Kamar, Lasecki, Weld and Horvitz2019), compatibility (Bansal et al., Reference Bansal, Nushi, Kamar, Weld, Lasecki and Horvitz2019), and keeping humans in the loop (Aoki, Reference Aoki2021) in human-AI collaboration, offering ways to address these challenges. While the current set of experiments does not incorporate these considerations, the results indicate a greater tendency towards algorithmic aversion (as opposed to algorithmic appreciation), supporting the necessity to account for these factors when developing methods of human-computer collaboration for multi-objective contexts. Further examination of decision-making scenarios where a model’s output can be perceived as right or wrong depending on intentions and contextual factors could be useful. For instance, differences between human vs. machine problem-solving approaches could be evaluated and communicated to allow humans to properly assess how much they should rely on computational systems. Alternatively, mismatches in decision-making might be used to drive automatic adaptation of systems to users in cases where the users have domain knowledge that is not computationally encoded. Uncovering engineering designers’ decision-making behaviors in settings where they utilize computational systems can help reveal where general findings around human-AI collaboration apply, and when special considerations must be made for difficult, multi-objective contexts. Consequently, this knowledge can be used to develop intelligent tools that effectively fit into domain experts’ decision-making processes.
Conclusion
This study investigates the effect of suggestions from a simulated computational model during a challenging decision-making task. The suggestions are provided to participants who must determine the better engineering alternative for an aircraft bracket design problem, with two types of tradeoffs: (1) strength and weight or (2) strength, weight, and manufacturing time. The results indicate that the tendency to follow the AI suggestion varies. Participants often underutilize suggestions when there is a ground truth, correctly ignoring bad suggestions, but also ignoring good ones in the process. This finding might be explained by participants’ likeliness to trust their own decision-making, even at the risk of performing worse, matching how domain experts underutilize algorithmic assistance in other contexts. When presented with an uncertain choice between designs, participants only overutilize the model’s suggestions when given fewer (2 vs. 3) competing objectives to fulfill during decision-making. This highlights a paradoxical over-, under-, or appropriate suggestion reliance, depending on task parameters (i.e., number of objectives) and decision types during the task (i.e., suggestion correctness). Such variability in reliance behavior must be accounted for to enable effective human-computer collaboration for highly technical, multi-objective engineering contexts.
Data availability statement
Data used for the study stimuli are openly available at: https://dataverse.harvard.edu/dataset.xhtml?persistentId=doi:10.7910/DVN/XFUWJG.
Acknowledgments
The authors acknowledge Kristin M. Divis, Breannan C. Howell, Laura E. Matzen, and Zoe Gastelum (Sandia National Laboratories) for guidance on experimental design and Whalen et al. (Reference Whalen, Beyene and Mueller2021) for making the bracket data publicly available. Initial results from one experiment were published at the Design Computing and Cognition Conference (Nandy and Goucher-Lambert, Reference Nandy and Goucher-Lambert2022).
Funding statement
This research was supported by grants from Sandia National Laboratories and Regents of the University of California. The findings represent the views of the authors and not necessarily those of the sponsors.
Competing interest
The authors declare no competing interests exist.
Appendix: impact of fuzzy classification
A modification was made to the non-dominated sorting procedure to investigate the impact of a fuzzing factor, using both a 1% and 5% threshold (Smaling and de Weck, Reference Smaling and de Weck2004; Fitzgerald and Ross, Reference Fitzgerald and Ross2012). In the modified procedure, instead of ranking only designs that were directly on each Pareto front together, designs that were in the Pareto front or within the fuzzy threshold (1 or 5% of the range) for all objectives were ranked together. With this new way of ranking, the trials considered correct, incorrect, or equivalent could change. An analysis of these changes reveals that the overall observation of suggestion underutilization in the objective cases remains. The observation of overutilization of the equivalent suggestions in the bi-objective task also remains. The results for equivalent suggestions in the tri-objective cases vary based on the specific threshold and are inconclusive.
Reclassifying results for Experiment 1: two objective tradeoff
The model accuracy changes when reclassifying the conditions using the fuzzing factor for Experiment 1. At the 1% threshold, 16 trials are classified as correct, 8 as equivalent, and 6 as incorrect, resulting in an accuracy of 73%. At the 5% threshold, 16 trials remain correct, while 10 are classified as equivalent, and 4 as incorrect, increasing the accuracy to 80%. Figure 15 shows how often the suggested design was selected compared to the expected proportion (the new model accuracies).
Probability of selecting the suggested design vs. the expected proportion for the correct and incorrect conditions using reclassification under the 1% and 5% thresholds in Experiment 1.

Using both thresholds, the proportion of suggestions selected remains below the expected proportion for the ground truth case (correct and incorrect conditions). Figure 16 shows how often the suggested design was selected compared to the expected proportion (0.5) for the equivalent condition.
Probability of selecting the suggested design vs. the expected proportion for the equivalent conditions using reclassification under the 1% and 5% thresholds in Experiment 1.

Reclassifying at both thresholds, the proportion of suggestions selected is still above the expected proportion of 0.5, similar to what was observed using the original ranking. The effect is less pronounced using a larger fuzzy threshold. Note that with the new classification, the stimuli properties and suggestion side are not explicitly balanced. Therefore, it is possible that the expected proportion for the equivalent condition may not hold if there is, for example, a bias towards the left or right.
Reclassifying results for Experiment 2: three objective tradeoff
Again, model accuracy changes when reclassifying the conditions using the fuzzing factor for Experiment 2. At the 1% threshold, 17 trials are now considered as correct, 4 as equivalent, and 9 as incorrect, resulting in an accuracy of 65%. At the 5% threshold, 15 trials are now considered correct, 11 equivalent, and 4 incorrect, raising the accuracy of 79%. Figure 17 shows how often the suggested design was selected compared to the expected proportion (the new model accuracies).
The probability of selecting the suggested design vs. the expected proportion (0.5) for the correct and incorrect conditions using reclassification under the 1% and 5% thresholds in Experiment 2.

Using both thresholds, the proportion of suggestions selected is again below the expected proportion for the ground truth case (correct and incorrect conditions). Figure 18 shows how often the suggested design was selected compared to the expected proportion (0.5) for the equivalent condition for Experiment 2.
Probability of selecting the suggested design vs. the expected proportion for the equivalent conditions using reclassification under the 1% and 5% thresholds in Experiment 2.

Reclassifying at both thresholds, the proportion of suggestions selected compared to the expected proportion of 0.5 varies based on the threshold. In one case, it is above the expected proportion, while in another case, it is below the expected proportion. This differs from the results obtained from the original ranking, which found no evidence of a difference from the expected proportion of 0.5 in the three objective cases. The large difference, particularly at the 1% threshold could be attributable to the small number of trials left in the equivalent condition after reclassification.


 Open access