


Scientific classification
Domain: Eukaryota
Kingdom: Plantae
Phylum: Spermatophyta
Subphylum: Angiospermae
Class: Dicotyledonae
Order: Rosales
Family: Rosaceae
Genus: Pyracantha
Species: angustifolia (Franch.) C.K. Schneid
Synonym: Cotoneaster angustifolius Franch.
EPPO code: PYEAN
Names and Generic Status
The genus Pyracantha (family Rosaceae) is commonly referred to as firethorn, pyracantha, or pyracantha bush. The name “pyracantha” is derived from the Greek words “pyr,” meaning fire, and “akanthos,” a thorn,” hence “fire-thorn,” describing the fiery red berries and sharp thorns typical of plants in this genus (Johnson et al. Reference Johnson, Smith and Stockdale1951). The genus is also known by other vernacular names; these include brandend-bos and vuurdoorn in Dutch; burning bush, Christ’s thorn, evergreen thorn, everlasting thorn, fiery thorn, yellow firethorn, narrowleaf firethorn, slender firethorn, woolly firethorn, orange firethorn, and white thorn in English; arbre-de moise, buisson-ardent, epine-ardente, petit-corail, and pyracanthe in French; brennender-busch, feuerbusch, feuerdorn, feuerstraucher, and immergruner-weissdorn in German; geelbranddoring in Afrikaans; ponaponana in Sesotho; agazzino, marruca-nera, and prunogazzerino in Italian; zhǎi yè huǒ jí and 窄叶火棘 in Chinese; pirakanta uzkolistnaya in Russian; and tachibanamodoki, kamatuka, and kankasus in Japanese (Brako et al. Reference Brako, Rossman and Farr1995; Csurhes et al. Reference Csurhes, Weber and Zhou2016; Egolf and Andrick Reference Egolf and Andrick1995; EPPO 2020; Kobisi et al. Reference Kobisi, Seleteng-Kose and Moteetee2019; White et al. Reference White, Cheal, Carr, Adair, Blood and Meagher2018).
The genus Pyracantha consists of 16 species of woody, evergreen, thorny shrubs (GBIF 2019; Plant List 2013; Serviss Reference Serviss2009). The species include: Pyracantha angustifolia (Franch.) C.K. Schneid, Sichuan firethorn [Pyracantha atalantioides (Hance) Stapf], scarlet firethorn (Pyracantha coccinea M. Roem.), Pyracantha crenatoserrata (Hance) Rehder, Nepalese firethorn [Pyracantha crenulata (D. Don) Roem.], Pyracantha crenulata-serrata Rehder, Pyracantha densiflora T.T. Yu, Chinese firethorn [Pyracantha fortuneana (Maxim.) Li], Pyracantha inermis J.E. Vidal, Formosa firethorn [Pyracantha koidzumii (Hayata) Rehder], Pyracantha rogersiana (A.B. Jacks) Coltm.-Rog (Plant List 2013). To date, no critical overview of the genus has been published, but species in the genus have many synonyms, which is indicative of earlier confusion regarding the taxonomy of the Rosaceae (Plant List 2013). There are many cultivated hybrids and varieties of these species that vary mostly in plant size, fruit size, and fruit color (Egolf and Andrick Reference Egolf and Andrick1995; Meyer et al. Reference Meyer, Mazzeo and Voss1994; see also “Intraspecific Variation” and “Hybrids”).
Description and Account of Variation
Species Description
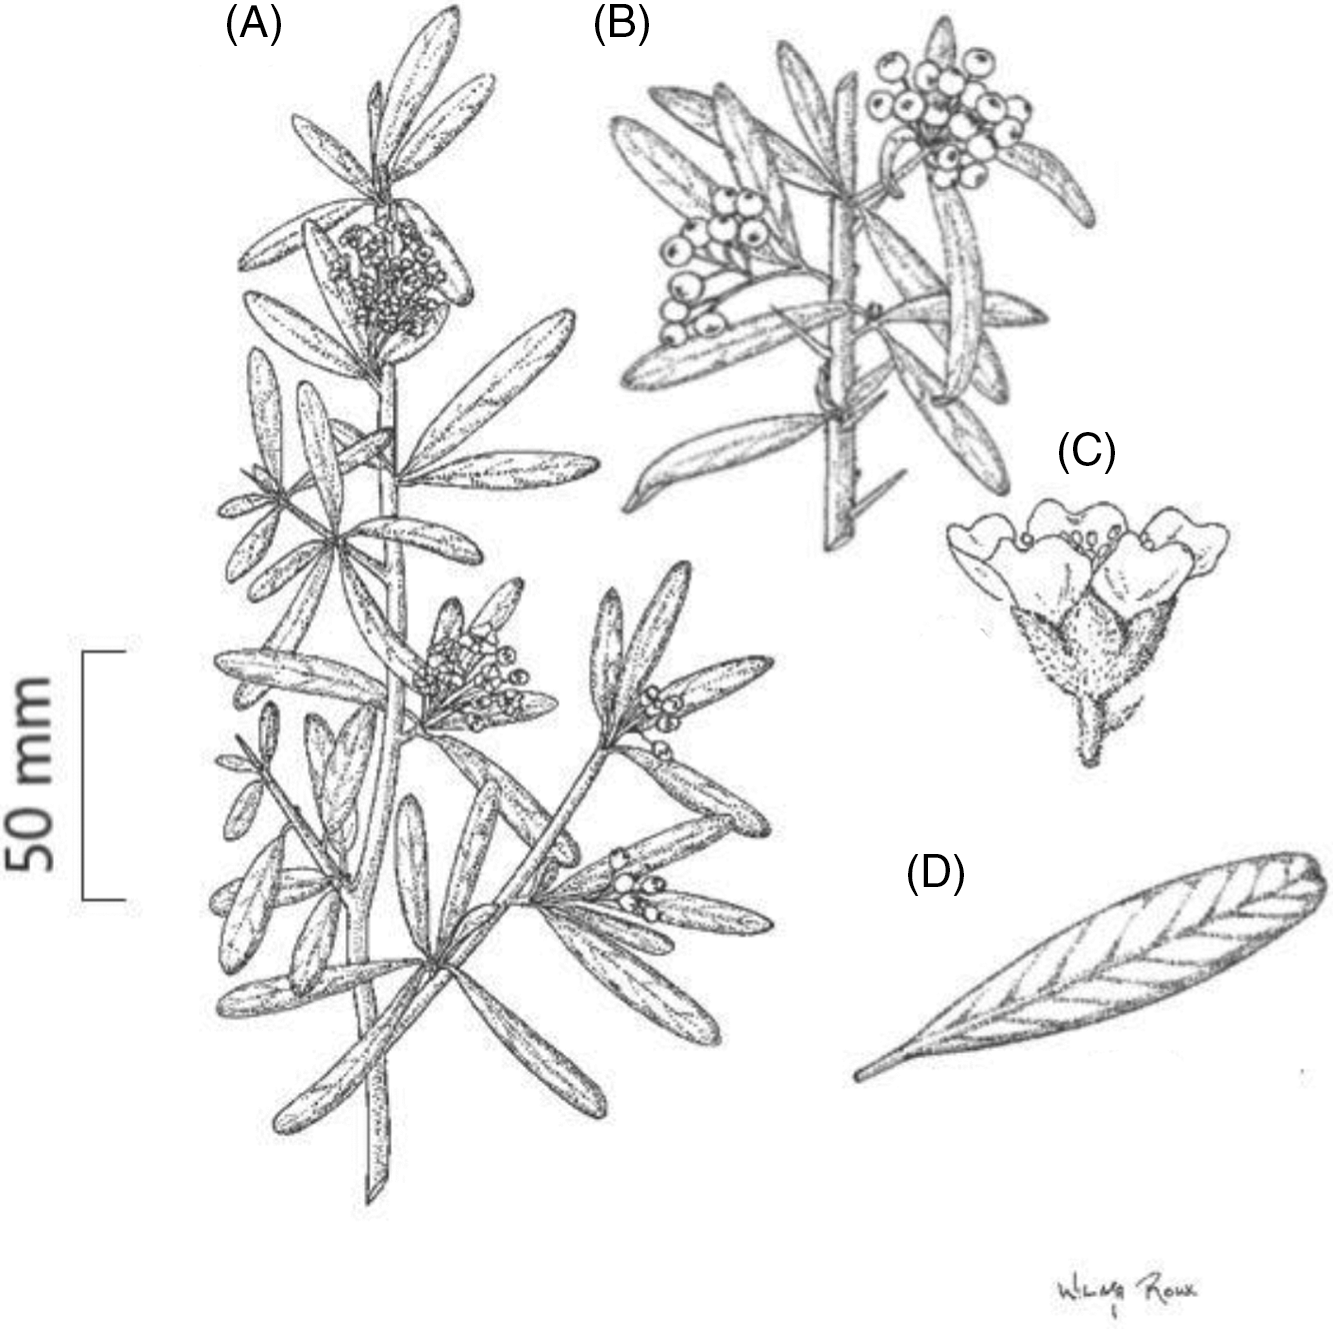
Pyracantha angustifolia is a dense upright evergreen shrub or small tree growing up to 6 m in height, with thorny branches (eFloras 2008); however, trees more than 6-m tall have been recorded in South Africa (Adams Reference Adams2020). Stems are stiff with sharp-pointed woody spines that have leaves (Retief and Meyer Reference Retief and Meyer2017). The branchlets of the main stems are dense (Figure 1). When young, shoots are grayish-yellow in color and often tomentose, turning glabrous with age and changing in color to a dark purple (eFloras 2008). Leaves are alternatively arranged. They are dull dark green above and grayish in color beneath (Figure 2). The leaf blades are oblong to oblanceolate-oblong, ranging from 10 to 50 mm in length and between 4 and 12 mm in width. The leaves have a diagnostic notched tip (Figure 1D). Young leaves are tomentose, turning glabrous with age. Flowers are arranged in compound corymb 2 to 4 cm in diameter. The corymb can contain several to 30 flowers. Both the peduncle and calyx are tomentose and gray in color (Figure 2D). These flowers have five white petals (5 to 12 mm across; Figures 1C and 2D), five small sepals, and 20 stamens. Fruits (pome) when young are initially grayish/green in color, turning either orange-red or orange-yellow with age (Henderson Reference Henderson2011) (Figure 2A and C). Mature fruits range between 5 and 8 mm in diameter. Green to gray sepals remain around the fruit (Csurhes et al. Reference Csurhes, Weber and Zhou2016; eFloras 2008; Nesom Reference Nesom2010; Retief and Meyer Reference Retief and Meyer2017; Weber Reference Weber2003).
Vegetative and reproductive characteristics of Pyracantha angustifolia. (A) A branchlet with sharp, pointed, leaved thorns and flowers arranged in a compound corymb on terminal meristems, (B) fruits growing in clusters, (C) flower side view showing pedicel and calyx covered in woolly hairs, and (D) an oblong-shaped leaf blade with a notched tip. Illustrated by Wilma Roux and reproduced with permission.
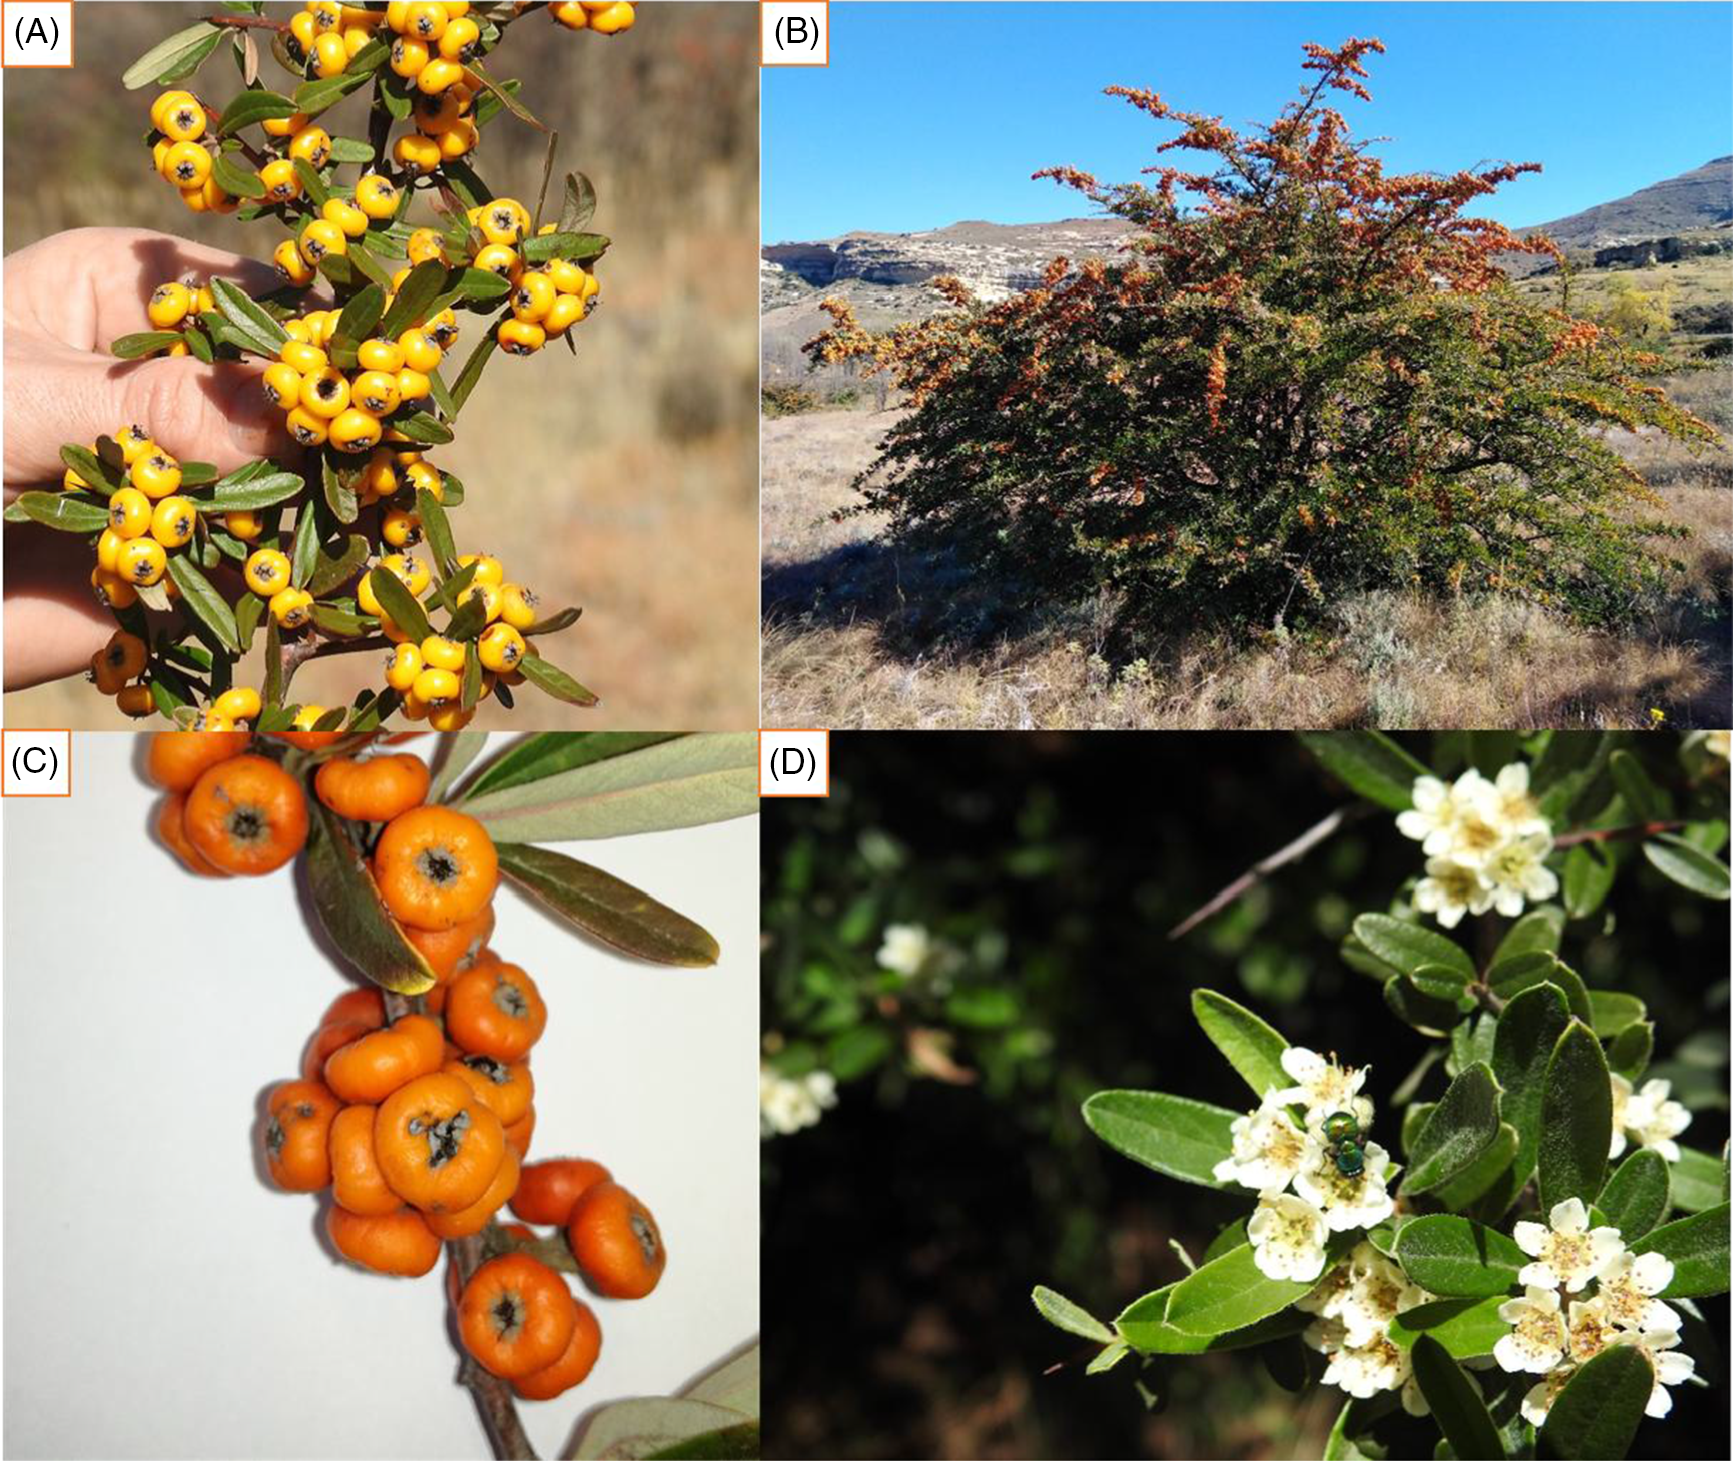
Pyracantha angustifolia in Clarens, eastern Free State, South Africa. Orange-yellow or orange-red berries (5–8 mm across) are produced in large numbers from April to October (A–C), while white flowers (5-mm long) are produced in October to December (D) (Adams Reference Adams2020).
Distinguishing Features
The flowers and fruit of all Pyracantha spp. are somewhat similar, with several species possessing similar characteristics. According to Egolf and Andrick (Reference Egolf and Andrick1995), it is plausible that two or more Pyracantha spp. populations are in reality only interbreeding populations of the same species, because Pyracantha spp. populations overlap geographically. As such, the species are distinguished primarily based on leaf characteristics. However, because leaf dimorphism may occur on the same plant or among seedlings in a population, the taxa cannot be accurately designated by using only a limited sample of specimens (Egolf and Andrick Reference Egolf and Andrick1995). As such, Pyracantha is considered a rather homogenous genus, whose species and varieties are difficult to identify (Bertrand et al. Reference Bertrand, Cadic and Belin1992). Additionally, field identification of most Pyracantha spp. is complicated, because there are multiple ornamental cultivars of the genus (Csurhes et al. Reference Csurhes, Weber and Zhou2016; Egolf and Andrick Reference Egolf and Andrick1995). However, of the 16 known species of Pyracantha, P. angustifolia is distinguished by leaf and flower morphological traits (Jocou and Gandullo Reference Jocou and Gandullo2019). The leaf blades are 4- to 8-mm wide, with the lower surface being densely and persistently tawny-puberulent to puberulent-villous, while the margins are entire (Nesom Reference Nesom2010; Retief and Meyer Reference Retief and Meyer2017). Additionally, the calyx is hairy (Retief and Meyer Reference Retief and Meyer2017) (Figure 1C).
Intraspecific Variation
There are several varieties of P. angustifolia, most of which did not result from controlled selective breeding or hybridization. The majority of new Pyracantha spp. cultivars are chance seedlings selected because of growth habit, fruiting characteristics, hardiness, or disease resistance (Egolf and Andrick Reference Egolf and Andrick1995). The origin of many cultivars is further obscured by the reintroduction of an established cultivar under a new name because of lost identification or to promote sales (Egolf and Andrick Reference Egolf and Andrick1995). Examples of some known P. angustifolia cultivars include, P. angustifolia ‘Gnome’, P. angustifolia ‘Gnozam‘, P. angustifolia Yukon Belle™, and P. angustifolia ‘Yukon Jack’ (Egolf and Andrick Reference Egolf and Andrick1995). Other cultivars arose from hybrids of P. angustifolia with other congenerics or cultivars; for example, ‘Massagnensis’ (P. gibbsii × P. angustifolia), ‘Navaho’ (P. angustifolia × P. ‘Watered’), ‘Scarlet Thornless’ (P. angustifolia × P. crenulata), and ‘Gold Rush’ (P. angustifolia × P. crenato-serrata). The Pyracantha genus consists of varieties that are largely unknown or of poorly identified origins. However, some preliminary analysis on varietal recognition has been done using enzymatic markers (Cadic et al. Reference Cadic, Gallet and Courtin1992). Compilations by Meyer et al. (Reference Meyer, Mazzeo and Voss1994) and Egolf and Andrick (Reference Egolf and Andrick1995) indicate that potentially hundreds of cultivars exist.
Closely Related Species
Pyracantha is most closely related to Cotoneaster and Crataegus. All three genera share similar habitats in their invaded ranges and can often be found growing together, potentially facilitating one another’s establishment and spread by aiding sapling survival through nurse-plant effects (Tecco et al. Reference Tecco, Díaz, Gurvich, Perez-Harguindeguy, Cabido and Bertone2007). Pyracantha spp. are distinguished from Cotoneaster spp. by the presence of thorns, usually crenate or serrate leaves, flowers in corymbs, five pistils that are dorsally connate to the calyx tube along the basal half, and fruit with five nutlets. In addition, no Cotoneaster spp. have thorns on their stems. Pyracantha is distinguished from Crataegus spp. by having two fertile ovules in each carpel, rather than a single, evergreen unlobed leaf, and leafy thorns (Egolf and Andrick Reference Egolf and Andrick1995). Pyracantha angustifolia is often misidentified as P. fortuneana or P. koidzumii; however, P. angustifolia is easily distinguished by the characteristic pubescence on the adaxial face of the leaves, the receptacle, and the calyx (Jocou and Gandullo Reference Jocou and Gandullo2019).
Hybrids
The cultivated Pyracantha spp. are confused by hybridization. As with many members of the Rosaceae, hybridization can occur easily, and intermediate seedlings occur spontaneously (Egolf and Andrick Reference Egolf and Andrick1995). For example, the cultivar ‘Lalandei’ (common name: Lalandei pyracantha) was recognized as a clone as early as 1874 and is still propagated from seed by many nurseries. These seedlings did not perpetuate the parent plant but became the progenitors of additional variations that are still identified as ‘Lalandei’. There are minor variants among the cultivars grown today as ‘Lalandei’; some of the superior ones are designated as cultivars (Egolf and Andrick Reference Egolf and Andrick1995).
As with other commonly cultivated species, placing a plant in one or another species may be an artificial classification, because hybrids of Pyracantha cannot be unequivocally assigned to a single species in its typical expression. Several cultivars are explicitly indicated by Meyer et al. (Reference Meyer, Mazzeo and Voss1994) to be of hybrid origin (P. koidzumii × P. fortuneana; P. koidzumii × P. coccinea). Compilations by Meyer et al. (Reference Meyer, Mazzeo and Voss1994) and Egolf and Andrick (Reference Egolf and Andrick1995) indicate that more than 350 cultivars exist worldwide, particularly in temperate regions.
Economic Importance and Environmental Impacts
Detrimental
Pyracantha angustifolia forms dense thickets, leading to the exclusion of other plants, because the canopy alters microenvironmental conditions necessary for growth of some native plants while facilitating differential recruitment of species that do not form seedbanks (Giantomasi et al. Reference Giantomasi, Tecco, Funes, Gurvich and Cabido2008). These dense thickets prevent access due to the plants’ thorns (Csurhes et al. Reference Csurhes, Weber and Zhou2016). In southern Africa it is listed as a problem plant, because it replaces native vegetation and pastures (grass), contaminates seedbanks, and blocks access by livestock and humans (Wells et al. Reference Wells, Balsinhas, Joffe, Engelbrecht, Harding and Stirton1986). In Argentina, it interferes with the recruitment of native woody species and enhances recruitment of other invasive plant species (Giantomasi et al. Reference Giantomasi, Tecco, Funes, Gurvich and Cabido2008). This contrasting effect is largely a result of the plant’s canopy creating unfavorable conditions for seed germination and sapling survival of several seed-propagated plants, while favoring others, especially exotic species (Giantomasi et al. Reference Giantomasi, Tecco, Funes, Gurvich and Cabido2008). In addition to its ecological and physical impacts, the weed has several chemical impacts. Most if not all species in the genus produce hydrogen cyanide, which is found in small quantities in the leaves and seeds of the plants (VRO 2020). If ingested, the seeds of Pyracantha spp. may cause mild stomach ailments (Brickell Reference Brickell1996). If ingested in excess, they can cause respiratory failure and death in some animals (VRO 2020). In 1997, a total of 187 birds of the Bombycilla genus (waxwings) died suddenly from poisoning in Nagano Prefecture, Japan (Maruyama Reference Maruyama1998). Subsequent inquiries revealed that the esophagi of some birds were choked with Pyracantha seeds/fruit, and lethal concentrations of cyanide were found in the birds’ stomachs and esophagi (Maruyama Reference Maruyama1998). In addition to chemical impacts, stems are often spine-tipped, presumably to deter browsing, hence often injuring animals (Webb et al. Reference Webb, Sykes and Garnock-Jones1988). The thorns on Pyracantha spp. often contain infectious bacteria (Padhye et al. Reference Padhye, Davis, Bear, Reddick, Sinha and Ott1998). In South Africa, the species is increasingly spreading into valuable grazing land, riverine habitats, and protected areas. In addition, the plant is forming dense stands along roadways, power lines, and fences from which its seeds are being spread by humans and birds. The resulting increased chemical and mechanical management strategies, especially where the species is encroaching on road verges, suggest the plant is starting to have noticeable economic impact.
Beneficial
In Argentina, there is a positive interaction between P. angustifolia and some native woody plants. The dense canopy shading by P. angustifolia provides smaller trees/bushes and seedlings mechanical protection against ungulates, thereby ensuring a richer diversity of native species (Tecco et al. Reference Tecco, Gurvich, Díaz, Pérez-Harguindeguy and Cabido2006).
Pyracantha is primarily used in the horticultural industry (Bass Reference Bass1996). Within the horticultural industry it is highly regarded for its ability to withstand cold temperatures, especially in regions that receive frost. The shrub produces spectacular displays of orange berries in autumn and winter. Additionally, in Argentina, Martínez and Manzano-García (Reference Martínez and Manzano-García2019) suggest the species has ethnobotanical importance because of its ornamental use and the ecosystem services that it provides, such as shade and food for birds. Due to its short stout thorns and dense foliage, the shrub is also extensively used as a barrier plant, including use as decorative windbreaks and security hedges (Bromilow Reference Bromilow2001; Csurhes et al. Reference Csurhes, Weber and Zhou2016; Giantomasi et al. Reference Giantomasi, Tecco, Funes, Gurvich and Cabido2008; Henderson Reference Henderson1983, Reference Henderson2011).
To a lesser extent, the plant is also used for walking sticks in India and bonsai in Japan (Burger et al. Reference Burger, Frankenhuyzen, van Goffau and Ulenberg1985). In South Africa, the berries are often eaten by humans; children walking to and from school often consume the berries, as the shrubs grow along roadsides, thus facilitating the spread of the species (Shah et al. Reference Shah, Tewari, Bisht and Tewari2006). Pyracantha fruits have been used as traditional medicine as a result of their cardiac, diuretic, and tonic properties. They can be cooked to make jams, jellies, sauces, and marmalade (Keser Reference Keser2014). In the Limpopo Province of South Africa, the roots are harvested and boiled and used to treat bodily pains (Semenya et al. Reference Semenya, Tshisikhawe and Potgieter2012). In North America, the fruits are also regarded as suitable for making wine (Alatorre Reference Alatorre1977).
Geographic Description
The plant has been widely planted and has subsequently become naturalized in many countries. It is currently known from at least 22 countries, including Argentina (Urcelay et al. Reference Urcelay, Longo, Geml and Tecco2019); Australia (Moreschi et al. Reference Moreschi, Funes, Zeballos and Tecco2019); Brazil (Guix Reference Guix2007); Canada, Columbia, England, and France (de Villalobos et al. Reference Villalobos, Vazquez and Martin2010); the French Polynesian Islands and Hawaii (GBIF 2019); Italy, Japan, Mexico, New Zealand, Portugal, and Russia (GBIF 2019; Van Valkenburg et al. Reference Van Valkenburg, Brunel, Brundu, Ehret, Follak and Uludag2014); South Africa (Henderson Reference Henderson2007); Spain and the United States (Cadic 1983; Andreu and Vilà Reference Andreu and Vilà2011); Germany (Brändle and Brandl Reference Brändle and Brandl2012); Lesotho (Kobisi et al. Reference Kobisi, Seleteng-Kose and Moteetee2019); and Swaziland (Henderson Reference Henderson2007). However, there is generally sparse knowledge on the distribution and invasive status of P. angustifolia globally. Pyracantha angustifolia is indigenous to Tibet; Sichuan, Yunnan, Guizhou, and Hubei provinces, and Chongqing municipality; all of which are located on the southwestern side of China (Figures 3 and A4; eFloras 2008).
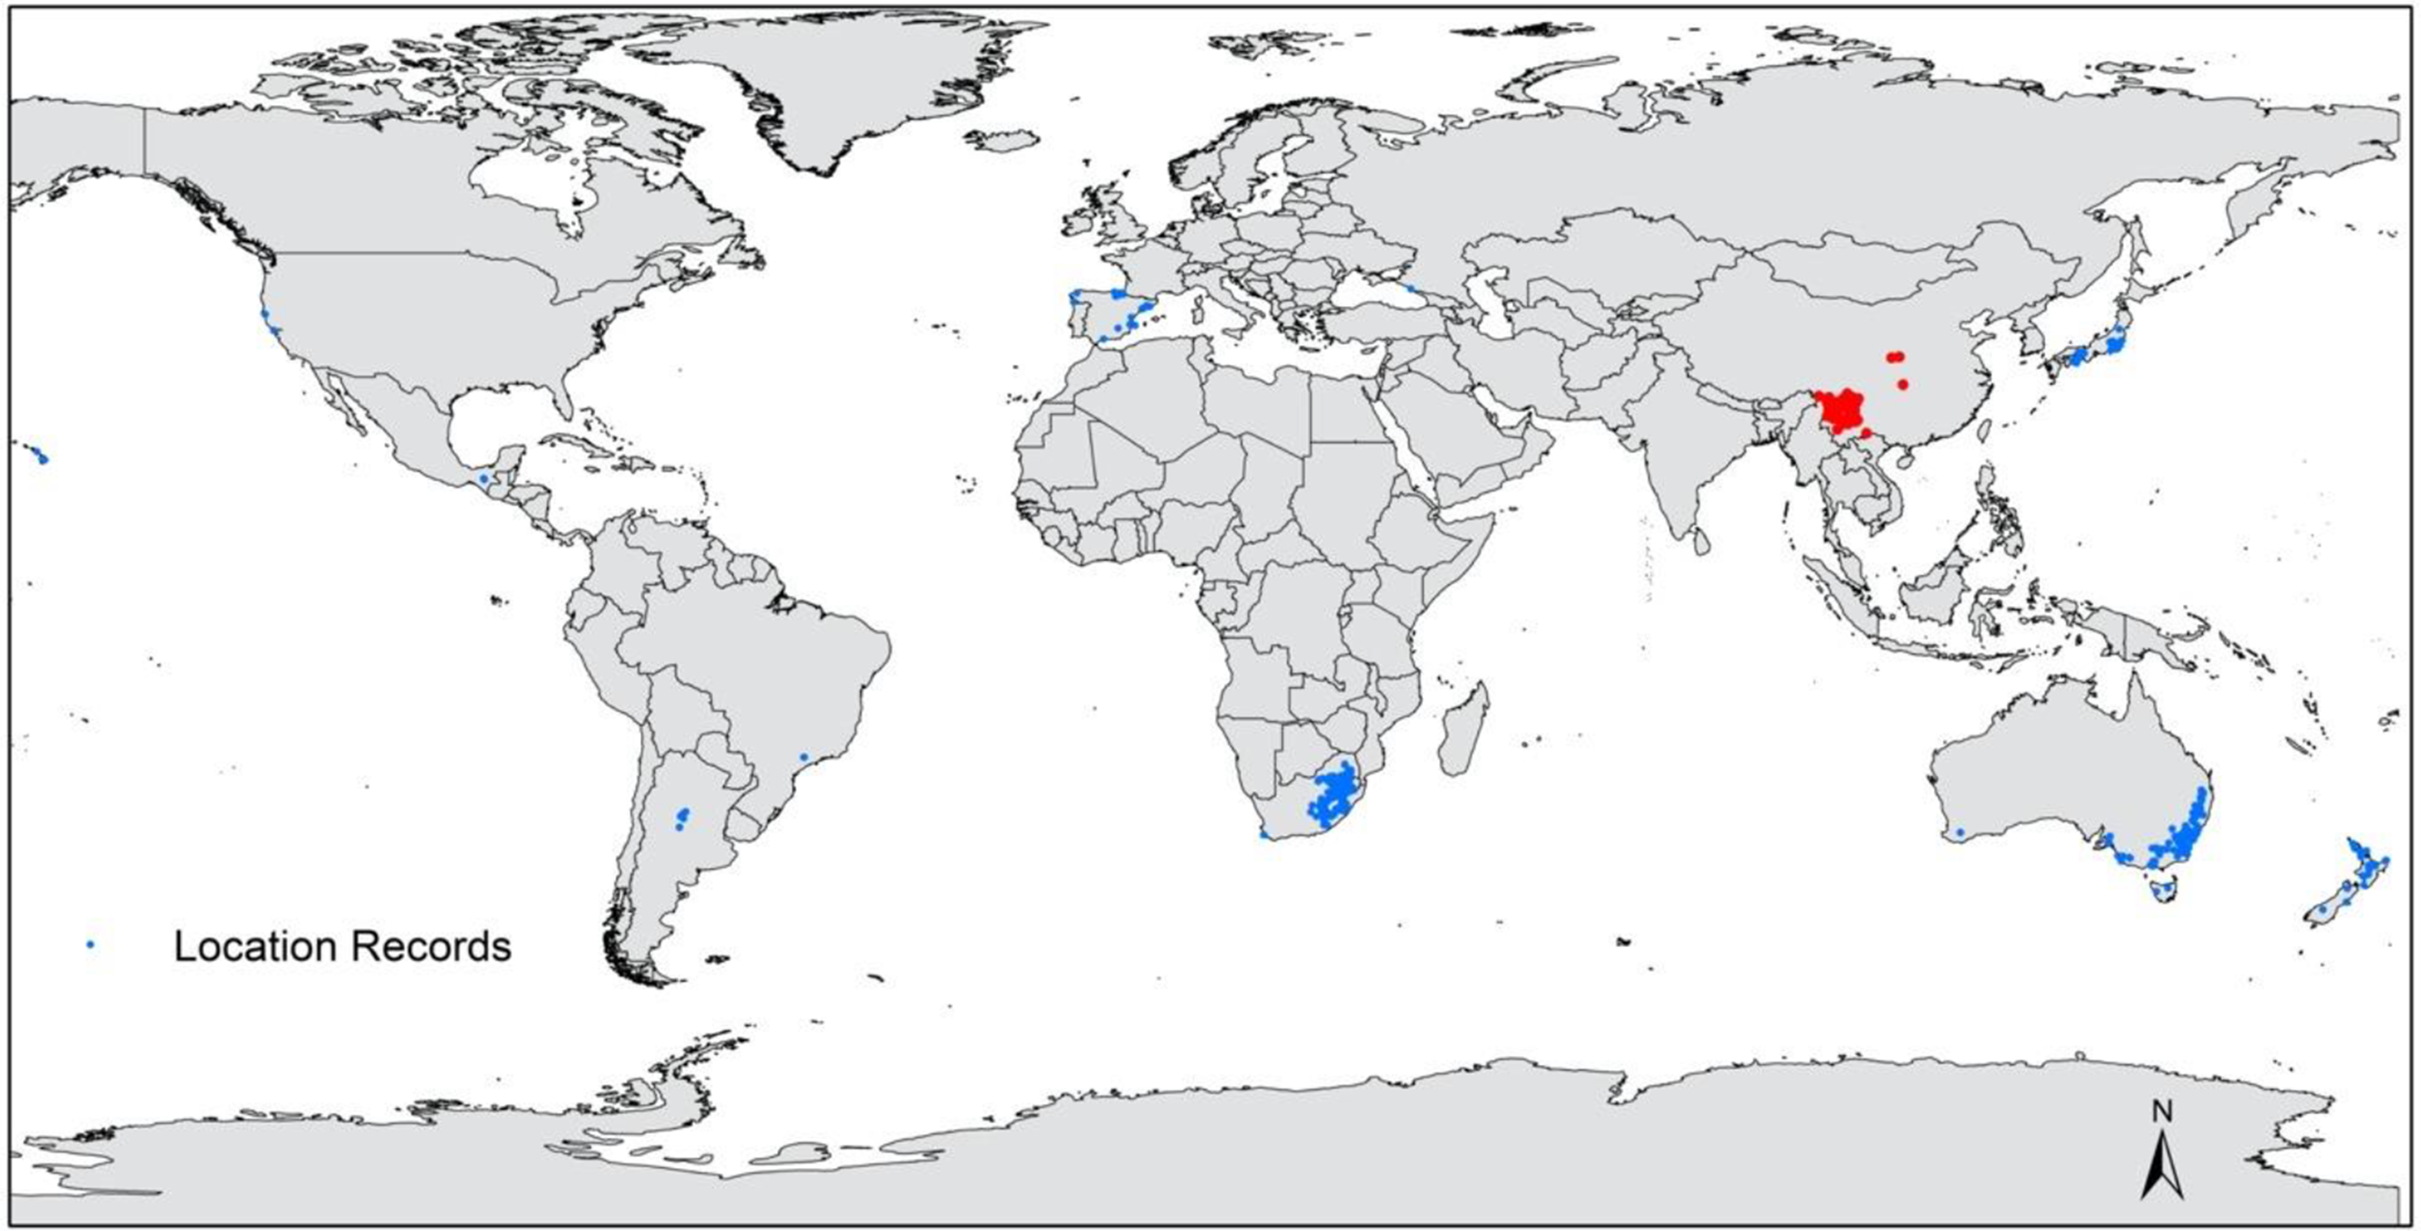
Global distribution of Pyracantha angustifolia representing native (red) and invasive population (blue) data sourced from the Southern African Plant Invaders Atlas (Henderson Reference Henderson2007; L Henderson, personal communication), Atlas of Living Australia (n.d.), GBIF (2019), and L Adams personal observations (see Adams Reference Adams2020).
Cumulative increase in the number of recorded sites (from herbarium records) for Pyracantha angustifolia in South Africa, Japan, and Australia (adapted from the Atlas of Living Australia [n.d.]; GBIF [2019]; and the Southern African Plant Invaders Atlas [Henderson Reference Henderson2007; L Henderson, personal communication]).

South Africa
Pyracantha angustifolia has a broad distribution in South Africa, with records from all nine provinces. Although it is occasionally found in large areas of its invaded range, it is particularly abundant in Gauteng, Free State, and Eastern Cape provinces (Figure A7). In South Africa, the plant is predominantly found along rivers and rocky ridges on the South Africa Lesotho border in the Free State Province, with large infestations near the towns of Ficksburg and Fouriesburg. It is invading fallow lands and roadsides in Gauteng Province (L Henderson, personal communication; G Martin, personal observations). There has been a relatively faster increase in the number of recorded sites in South Africa compared with two other heavily invaded regions, Japan and Australia (Figures 4, A4, and A5).
Pyracantha angustifolia invasions in eastern Free State, South Africa. Such invasions included rocky hills on farms (A); prior open grasslands showing complete invasion (orange-tinted bushes) (B); roadsides, resulting difficulties in observing oncoming traffic for drivers (C); riparian systems (D); and open grassland converted to woody habitat (E) (Adams Reference Adams2020).

Australia
Pyracantha angustifolia is widely naturalized in southern and eastern Australia, with a few populations in the southwestern region of Western Australia (Atlas of Living Australia n.d.) (Figure A2). While most of these populations are generally scattered and localized there are more significant populations in the tableland regions of New South Wales, in the Australian Capital Territory (ACT), and in Victoria (Figure A5). Additionally, it has naturalized in the cooler parts of southeastern Queensland and in southeastern South Australia in higher-altitude areas (Weeds of Australia 2019).
Japan
The plant has escaped cultivation in Japan and has spread extensively enough to be declared an invasive alien plant. A noticeable feature of the invasive flora in mainland Japan is the lack of woody species and invaders of forest areas. Pyracantha angustifolia and Robinia pseudoacacia L. (Fabaceae) are two of the few naturalized invasive woody species in Japan (Auld et al. Reference Auld, Morita, Nishida, Ito and Michael2003; Mito and Uesugi Reference Mito and Uesugi2004). The plant is more abundant in the south of Japan, and smaller populations are found in the northeast (Figure A4).
United States
The species has also escaped cultivation and grows widely in the southeastern United States and can be found naturalized in California and Georgia (Cal-IPC 2006; EDDMapS 2009; Nesom Reference Nesom2010). The largest infestations in the United States are recorded from the following Hawaiian Islands: Maui Island, O‘ahu Island, Kauai Island, and Hawai‘i (Big) Island (Pratt and Bio Reference Pratt and Bio2012).
Russia
The species is naturalized near the city of Sochi, Russia, a narrow coastal strip of land that experiences milder winters than the rest of the country. In this area, several evergreen trees and shrubs have escaped from cultivation and become naturalized, including P. angustifolia (Nobis et al. Reference Nobis, Ebel, Nowak, Turginov, Kupriyanov, Nobis, Olonova, Paszko, Piwowarczyk, Chen and Gudkova2014).
Climatic Requirements
In its native range (southwest China), P. angustifolia grows in warm temperate (Mediterranean) to cool and humid subtropical climates (GBIF 2019) (Figure A4). It favors high-altitude grasslands and cool climates with moderate water availability, and full sun or part shade (Xiwen and Walker Reference Xiwen and Walker1986). In its native range, it experiences wet summers and autumns with dry winters and springs, but the plant is also able to survive in some very dry subtropical areas (Xiwen and Walker Reference Xiwen and Walker1986).
In its invaded range, the plant grows in Mediterranean, subtropical, and tropical climates (Randall Reference Randall2001). Pyracantha angustifolia is a relatively cold-tolerant species, able to survive down to −18.9 C for a limited time; thus it is also adapted to survive in cooler climates (Henderson and Musil Reference Henderson and Musil1984; Shin Reference Shin2011). However, outside its native range, the plant grows in varying climatic conditions and biomes, mainly tropical grasslands, subtropical rain forests, subtropical dry forests, and temperate forests. Pyracantha angustifolia is widely planted but is a prominent invader in only one biome (grasslands), and it is likely that environmental factors have limited its distribution. The species is largely restricted to high-altitude grasslands, where it appears that freezing winter temperatures are needed to trigger seed germination (Henderson Reference Henderson1989). The plant can tolerate strong winds but not maritime exposure (VRO 2020). It often grows in woodland sunny edges or in dappled/partial shade (Flora of China Editorial Committee 2003).
Based on the Köppen-Geiger climate classification system (Kottek et al. Reference Kottek, Grieser, Beck, Rudolf and Rubel2006), P. angustifolia mostly inhabits warm temperate climates (Table 1; see figures in the Appendix). The only exception is South Africa, where the plant grows in a broader range of climates. For example, P. angustifolia grows in the semiarid grassy plains of South Africa, which receive 250 to 500 mm of rain annually (steppe climate; Figure A7). In contrast, the plant grows in areas that receive some rainfall during all seasons in most countries, including other biomes on the eastern side of South Africa (fully humid; Table 1). Additionally, there are some occurrences in temperate areas that are dry during the summer (Australia, Spain, and the United States) and winter (Argentina, China, Mexico, and South Africa) seasons (Table 1). The climate of the plant’s native range in China (Köppen-Geiger zone Cfb; Table 1) is also the most frequent across the invaded range of the plant (Figures A4–A9).
Global occurrences of Pyracantha angustifolia based on the Köppen-Geiger climate classification (Kottek et al. Reference Kottek, Grieser, Beck, Rudolf and Rubel2006). a

Global potential distribution area of Pyracantha angustifolia estimated using the MaxEnt model (grid cell mapping was 0.5° × 0.5°). Yellow to red shading indicates suitable climates, while blue dots show the current known distribution. The model is estimating the potential for naturalization. The plant may be found outside the modeled area under cultivation.

Substratum
Pyracantha angustifolia grows best in well-drained, moisture-retentive loamy soils (VRO 2020). It typically grows in a wide range of soil textures, from light sandy to medium loamy to heavy clay soils (Bean Reference Bean1919). In the Chinese provinces of Guizhou, Hubei, Sichuan, Xizang, Yunnan, and Zhejiang, the species grows as thickets on slopes, often growing on roadsides, at elevations between 1600 and 3000 m (eFloras 2008). The plant grows well in acidic, neutral, and alkaline soils. Pyracantha angustifolia can tolerate a wide range of soil conditions and is known to invade high-altitude grasslands, erosion channels, rocky ridges, and riparian habits (Carbutt Reference Carbutt2012; Weber Reference Weber2017). The ability to inhabit a wide range of soil types and pH ranges makes P. angustifolia a highly competitive invasive alien species in disturbed areas where soil conditions have been altered. For example, P. angustifolia is invading areas of degraded native forest with deep, high clay content, slightly acidic soils in the Cape Peninsula, South Africa (Alston and Richardson Reference Alston and Richardson2006). In southeast Queensland, Australia, P. angustifolia appears to prefer alluvial soils along the banks of creeks, adjacent to habitats that have either been cleared or are heavily disturbed by grazing cattle (Csurhes et al. Reference Csurhes, Weber and Zhou2016).
Communities in Which the Species Occurs
In its native range, P. angustifolia grows in disturbed habitats among thickets on slopes or roadsides (eFloras 2008). When growing in favorable habitats, especially riparian areas running through dry sclerophyll forest and woodland, P. angustifolia forms dense thickets that exclude other plants and makes access difficult due to its thorns (Csurhes et al. Reference Csurhes, Weber and Zhou2016) (Figure 5D and E). The plant typically grows in grassland biomes, characterized by rolling terrain with grasses and herbaceous plants (Figure 5A and B), and open woodlands, but can invade a variety of habitats. For example, in addition to invading lowland grasslands and grassy woodland, P. angustifolia in Victoria, Australia, has also invaded dry and damp sclerophyll forests (towering Eucalyptus spp. with open canopy) and riparian areas (Carr et al. Reference Carr, Yugovic and Robinson1992).
In the Córdoba mountains of central Argentina, P. angustifolia grows in mosaics of grassland, shrubland, and open woodland that are a result of human activities such as livestock grazing, logging, and frequent fires (Tecco et al. Reference Tecco, Díaz, Gurvich, Perez-Harguindeguy, Cabido and Bertone2007). The dominant shrubs are P. angustifolia and the native Condalia montana A. Cast. (Rhamnaceae). The open space between these shrubs is dominated by herbaceous species such as Leonurus sibiricus L., Conium maculatum L., Eupatorium argentinum Ariza, Hyptis mutabilis (A. Rich.) Briq., Baccharis cordifolia DC., Bidens pilosa L., Carduus acanthoides L., and Senecio pampeanas Cabrera. Studies have shown that the presence of P. angustifolia in these communities enhances the recruitment of other exotic (e.g., Ligustrum lucidum W.T. Aiton; Oleaceae) and native woody species (Giantomasi et al. Reference Giantomasi, Tecco, Funes, Gurvich and Cabido2008; Tecco et al. Reference Tecco, Gurvich, Díaz, Pérez-Harguindeguy and Cabido2006, Reference Tecco, Díaz, Gurvich, Perez-Harguindeguy, Cabido and Bertone2007).
Invasion History (History of Introductions)
Europe
Pyracantha spp. have been grown in Britain for several centuries. They were recorded by John Parkinson, a leading herbalist and botanist to Charles I, who classified them as evergreen hawthorn, published in Paradisi in Sole Paradisus Terrestris in 1629 (Coats Reference Coats1964). The first species introduced to Britain was probably Pyracantha coccinea; however, several other species were introduced over the next few centuries, including P. angustifolia. There is a record of a direct introduction of P. angustifolia into Kew Gardens from western China by Lieutenant Jones in 1899 (Prain Reference Prain1910). Since that time, the weed has spread to Spain, where the first botanical record was in Señorío de Bértiz near the French border in 1983. The weed was also introduced into cultivation in Les Barres (France) through seeds obtained from eastern Tibet (China) in 1895 (Prain Reference Prain1910).
Australia
The origin of P. angustifolia in Australia is well described by Mulvaney (Reference Mulvaney1991:33), who states that “between 1890–1920 plant collecting trips to China during this period resulted in an increased use of Chinese plants, including many newly described Chinese plants, such as P. angustifolia and Cotoneaster glaucophyllus being brought into cultivation for the first time beyond China’s borders.” Mulvaney (Reference Mulvaney1991) also noted that P. angustifolia was recorded in several nursery records between 1920 and 1940 across Australia, including in Melbourne, Adelaide, and Sydney. The first herbarium record of Pyracantha found outside cultivation in Australia was in the Australian Capital Territory in 1947 (Csurhes et al. Reference Csurhes, Weber and Zhou2016). There is information suggesting that a species known only as Crataegus pyracantha (a synonym of Pyracantha) was available from Queensland nurseries as early as 1867 (Csurhes et al. Reference Csurhes, Weber and Zhou2016), but it is not clear that this was P. angustifolia.
United States
One of the earliest reports of P. angustifolia growing in the United States was made by Grier (Reference Grier1928), who recorded several Pyracantha spp., including P. angustifolia, growing in the Long Island region of New York. In California, Ripley (Reference Ripley1980) recorded the species growing on Angel Island, Marin County, in 1967. The first records in Hawaii are in Fosberg’s checklist of vascular plants in Hawaii Volcanoes National Park (Fosberg Reference Fosberg1975).
South Africa
Pyracantha angustifolia is featured extensively in most of the conventional gardening reference books of the 1950s to 1980s when it was widely recommended for groupings with other shrubs such as Cotoneaster, Spanish broom (Spartium junceum L.), privet (Ligustrum spp.), and other rose (Rosa spp.)species for gardens where growing conditions were difficult. Henderson and Musil (Reference Henderson and Musil1984) identified P. angustifolia to be invading regions of Mpumalanga. Pyracantha angustifolia only began invading the grassland biome in the early 1980s. It then spread very rapidly, and dense stands of this shrub now occur in many high-altitude grasslands (Richardson et al. Reference Richardson, Foxcroft, Latombe, Le Maitre, Rouget and Wilson2020).
New Zealand
The earliest record in New Zealand is from north Auckland in 1958, with China noted as the plant’s origin (Given Reference Given1982).
Argentina
The species is recorded as being introduced into Argentina as an ornamental or hedge plant. One of the first recorded occurrences in Argentina was in Sierra Chica, Córdoba Province in 1984 (Delucchi Reference Delucchi1991).
Dispersal and Establishment
Dispersal and Invasion Pathways
Pyracantha angustifolia, like all Pyracantha spp., mainly reproduces from seeds (PIER 2018). Seeds are dispersed by animals, water, gravity, soil movement, and discarded vegetation (Bass Reference Bass1996; Debussche and Isenmann Reference Debussche and Isenmann1994; Williams et al. Reference Williams, Karl, Bannister and Lee2000). Birds are probably the most important dispersal vector (Williams et al. Reference Williams, Karl, Bannister and Lee2000). Pyracantha spp. are among the best-known bird-dispersed plants, because their bright red fruits are very attractive to a variety of bird species (Staples et al. Reference Staples, Herbst and Imada2009). Birds spread Pyracantha spp. seeds some distance from their habitation, by consuming fruits and excreting seeds when they perch in new areas or are in flight (Adams Reference Adams2020; Cal-IPC 2006). For example, in New South Wales, pied currawongs (Strepera graculina Shaw 1790) are a major dispersal vector and prefer the fruits of Pyracantha spp. to those of other plant species (Crossman et al. Reference Crossman, Bass, Virtue and Jupp2002). Bird dispersal assists the escape of cultivated specimens from gardens to bushland (Bass Reference Bass1996). In South Africa, bird species such as dark-capped bulbuls (Pycnonotus tricolor Hartlaub 1862), red-eyed bulbuls (Pycnonotus nigricans Vieillot 1818), speckled mousebirds (Colius striatus Gmelin 1789), and red-winged starlings (Onychognathus morio Linnaeus 1766) have been observed feeding on P. angustifolia fruits in the field (Adams Reference Adams2020).
Mammals are also important vectors for the dispersal of P. angustifolia. The European fox (Vulpes vulpes Linnaeus 1758) and coyote (Canis latrans Say 1823) have been suggested as dispersal vectors of Pyracantha spp., because viable seeds have been extracted from their scat in southern Australia and Southern California, respectively (Muyt Reference Muyt2001; Silverstein Reference Silverstein2005). In New Zealand, introduced black rats (Rattus rattus Linnaeus 1758) and brushtail possums (Trichosurus vulpecular Kerr 1792) have also been recorded excreting viable seeds of P. angustifolia (Williams et al. Reference Williams, Karl, Bannister and Lee2000). In South Africa, two rodent species, the four-striped mouse (Rhabdomys pumilio Sparrman 1784) and the Karoo bush rat (Otomys unisulcatus Cuvier 1829), have been recorded feeding on P. angustifolia fruits that have fallen to the ground. It is uncertain if these seeds are viable after being defecated by the rodents (Adams Reference Adams2020). Additionally, in South Africa, Pyracantha spp. fruits/seeds have also been observed in chacma baboon (Papio ursinus Kerr 179) dung, raising a suspicion that baboons might be dispersing Pyracantha seeds (Adams Reference Adams2020). Domestic animals have also been observed feeding on P. angustifolia fruits. These include horses (Equus ferus caballus Linnaeus 1758), goats (Capra aegagrus hircus Linnaeus 1758), and cattle (Bos taurus Linnaeus 1758) in the eastern Free State Province of South Africa (Adams Reference Adams2020).
Humans also play a significant part in invasion by the plant through horticultural sales. Additionally, garden escapees are often found close to towns or old farmhouses, often on roadsides under trees and fences (ESC 2020). The weed is also spread through branch and fruit collection (e.g., for wreaths), landscape debris dumping (spreading fruit to new locations where birds can further distribute seeds), and pruning and dumping during landscape maintenance (PIER 2018).
Establishment
Disturbances and alterations of soil conditions typically increase the chances of establishment of P. angustifolia. For example, P. angustifolia is typically found in alluvial soils along the banks of creeks in relatively cool (warm temperate) tableland areas around Warwick and Stanthorpe in southeast Queensland, Australia (Csurhes et al. Reference Csurhes, Weber and Zhou2016). These habitats have either been cleared or are heavily disturbed by grazing cattle, but in places that are probably naturally open (Csurhes et al. Reference Csurhes, Weber and Zhou2016). As such, the plant is rare in adjacent state forests where there has been less disturbance (Csurhes et al. Reference Csurhes, Weber and Zhou2016). Soil disturbance and removal of vegetation cover promotes the establishment of Pyracantha spp., but despite the resultant high propagule pressure and high germination rates, Pyracantha spp. may fail to become abundant in regions with long dry summers (e.g., some Mediterranean ecosystems) due to their inability to avoid germination just before or during the long dry summers. Most native woody species in these areas are adapted to the dry summers, with seeds that remain dormant over summer (see de Villalobos et al. Reference Villalobos, Vazquez and Martin2010).
Invasion Risk
Many recognize that the outcome of an invasion event is a function of the combined influence of three basic factors: propagule pressure (frequency of introduction), environmental conditions, and plant competition (Bazzichetto et al. Reference Bazzichetto, Malavasi, Bartak, Acosta, Rocchini and Carranza2018). Hence, areas that are conducive to the germination and proliferation of P. angustifolia seeds, seedlings, and grown plants are at the greatest risk of invasion. Heavily disturbed soils in largely open areas (see Csurhes et al. Reference Csurhes, Weber and Zhou2016) are likely to be conducive to the spread of the weed, especially in cool-warm climates, as the plant favors high-altitude grasslands and cool-warm climates with moderate water availability and full sun or part shade (Carbutt Reference Carbutt2012). Such areas are at high risk of invasion if the vectors have access to them. Grasslands are often at high risk of invasion by woody plant species, because they are easily outcompeted in the presence of herbivores that preferentially attack grasses and forbs. Apart from grasslands and open woodlands, riparian areas also have a high risk of invasion (Swarbrick and Skarratt Reference Swarbrick and Skarratt1994). However, successful new introductions are limited in areas that do not have a cool, moist climate (Cal-IPC 2006).
Maximum entropy modeling (MaxEnt) was used to estimate the potential distribution of P. angustifolia based on relationships between its known presence and background data in relation to environmental covariates (Phillips et al. Reference Phillips, Dudík and Schapire2020). Details of this modeling are provided in the Appendix. Grassland biomes (savanna and tropical) and some temperate forests appear to be areas most suited to invasion by P. angustifolia (Figure 6). Because the model was trained using sites that were considered to represent naturalized populations, it estimates the potential for naturalization under natural climatic conditions, and we expect that P. angustifolia could be found outside the modeled area under cultivation. Another bioclimatic modeling package, CLIMATCH (BRS 2009), suggested that cool (warm temperate) upland areas of southeast Queensland, Australia, are most suitable for P. angustifolia. Using CLIMATCH, it is estimated that P. angustifolia could invade mainly riparian habitats running through forests and woodlands (Csurhes et al. Reference Csurhes, Weber and Zhou2016).
Growth and Development
Pyracantha angustifolia seems to be a broad climate tolerator, rather than being a specialized stress tolerator, capable of germinating and growing across wide elevational ranges and environmental changes such as soil temperature, moisture, and chemical properties (e.g., nitrogen content, organic matter, and carbon) (Tecco et al. Reference Tecco, Pais-Bosch, Funes, Marcora, Zeballos and Cabido2016). It is a relatively cold-tolerant species surviving at temperatures down to –18.9 C (Henderson and Musil Reference Henderson and Musil1984; Shin Reference Shin2011). Pyracantha angustifolia is a hardy shrub that is tolerant of frost and seasonally dry conditions (Weber Reference Weber2017). Additionally, it can withstand strong winds, but not maritime exposure (VRO 2020), and is also reported to be moderately tolerant of atmospheric pollution (VRO 2020).
Ecophysiology
Pyracantha spp. are vegetatively unresponsive to variations in the length of day or night, unlike many other woody plant species that cold acclimate in response to both short daylength and low temperatures characterizing winter periods (Welling et al. Reference Welling, Moritz, Palva and Junttila2002). It is considered to be day-neutral in its vegetative and flowering responses (Nitsch Reference Nitsch1957). When plants are exposed to nonfreezing low temperatures, they acquire increased freezing tolerance, which is known as cold acclimation (Guo et al. Reference Guo, Liu and Chong2018). Daylength is not important (day-neutral) for the initiation of cold acclimation that enables P. angustifolia to be cold tolerant during winters (Williams et al. Reference Williams, Pellett and Klein1972).
Phenology
Pyracantha angustifolia is evergreen. The species is a hermaphrodite (has both male and female organs) and is mainly pollinated by bees. The peak of seedling emergence is at the beginning of autumn, coming out of summer, when conditions are warm and moist (Tecco et al. Reference Tecco, Pais-Bosch, Funes, Marcora, Zeballos and Cabido2016). Flowers generally appear in spring and summer, and fruits develop from late summer, maturing in late autumn (Villalobos et al. Reference Villalobos, Vazquez and Martin2010). In the mountain chaco woodland of Argentina, fructification of P. angustifolia is largely uncoupled from that of most native species, which develop fruits from spring to summer, while P. angustifolia has fruit in autumn to winter (Vergara-Tabares et al. Reference Vergara-Tabares, Badini and Peluc2016). In the Southern Hemisphere, fruit dispersion of P. angustifolia occurs mostly during winter (Tecco et al. Reference Tecco, Díaz, Gurvich, Perez-Harguindeguy, Cabido and Bertone2007).
Mycorrhiza and Bacterial Symbionts
Arbuscular mycorrhizal fungi colonize P. angustifolia plant roots and provide the plant access to limited nutrients such as phosphorus. Experimental evidence shows that phosphorus nutrition in P. angustifolia seedlings is generally enhanced by the presence of arbuscular mycorrhizal fungi (Urcelay et al. Reference Urcelay, Longo, Geml and Tecco2019).
There are no known bacterial symbionts of P. angustifolia, but it can act as the host for fire blight (Erwinia amylovora Burrill 1882), a disease normally observed on apples and pears (Pyrus spp. L.) (Bastas Reference Bastas2012; Douglas Reference Douglas2006; ESC 2020).
Reproduction
Floral Biology
Studies on the pollination of Pyracantha spp. are depauperate, and most information sources state that these species are pollinated by bees in the spring flowering season in South Africa. The open-cluster flowers of Pyracantha spp. conform to a generalist insect pollination system, in that they do not appear to have any specialized traits filtering pollinators (they have white petals, are bowl-shaped, have a weak scent, and accessible rewards). Pyracantha spp. produce pollen as the main reward to floral visitors, and limited amounts of nectar. The open landing platforms of the flowers are conducive to visits by a variety of insects. Adams (Reference Adams2020) recorded visits from 12 insect species to P. angustifolia in the Free State high-altitude grasslands of South Africa, including Hymenoptera (Apidae: Apis mellifera Linnaeus 1758); 10 species of Diptera (Calliphoridae: Bellardia, Calliphora, Syritta, Chrysomya, Pollenia; Asilidae: Dysmachus; Syrphidae: Eristalinus, Eristalis; Sarcophagidae: Sarcophaga; Hippoboscidae: Lucilia), and 1 species of Hemiptera (Lygaeidae: Spilostethus). While many of these floral visitors are not typical pollinators (e.g., Lucilia louse flies [Lucilia spp. Robineau-Desvoidy 1830] and Spilostethus milkweed bugs [Spilostethus rivularis Germar 1837]), and their effectiveness as pollen vectors still remains unknown, they did all carry near-pure loads of P. angustifolia pollen on their bodies. In the Free State high-altitude grasslands of South Africa, the most common floral visitor, and presumed main pollinator, based on behavioral observations (visitation frequency, visitation rates, and interaction with anthers and stigmas of flowers) and trends in the literature for other Rosaceae species, is the honeybee (A. mellifera) (Adams Reference Adams2020). Other Rosaceae species in the area also attract honeybees (e.g., indigenous Leucosidea sericea Eckl. & Zeyh., invasive Cotoneaster and Rosa species) as well as economically important crop species such as apples (Malus spp.) and cherries (Prunus spp.) (both Rosaceae). These plants may be competing for pollinators or, if they flower asynchronously, may be supporting native pollinators year-round. Pollinator exclusion experiments showed that when pollinators were not excluded, there was a fruit yield of 0.91 (± 2.4 SE, n = 44) compared with pollinator-excluded flowers, which still yielded 0.66 (± 5.1 SE, n = 8) fruits per flower. All fruits sampled from both treatments produced normal numbers of seeds (five seeds per fruit) (S-LS, unpublished data). Overall, this species reproduces prolifically using native generalist insect pollinators, particularly honeybees.
Seed Production
Fruits from Pyracantha spp. (all species in the genus) have three to six, but predominantly five seeds per fruit (Adams Reference Adams2020; Demaio et al. Reference Demaio, Karlin and Medina2002). Because of the very high production of fruits per season (Hickman Reference Hickman1993), millions of seeds are available for wide distribution by dispersal agents. One mature plant can produce more than 1 million seeds annually, translating to more than 1,000 seeds m−2 (Hickman Reference Hickman1993). In a study conducted in the grassland biome of South Africa, it was shown that P. angustifolia produces approximately 2 million seeds m−2. The plant was reported to produce double the amount of seed in open grassland compared with a rocky outcrop grassland (Adams Reference Adams2020).
Pyracantha seed density is typically highest under the shrub canopy and decreases with increasing distance from the source plant. Perching structures such as fence lines and other shrubs used by birds seem to be important places where the seeds of this species are dispersed (L Adams, personal observations).
Three factors synergistically influence the success of invasion by P. angustifolia in new areas. These are: the number of seeds per fruit, the number of fruits per branch (that may contribute to attractiveness to seed-dispersing birds), and the level of fruit consumption by seed-dispersing birds (Vergara-Tabares et al. Reference Vergara-Tabares, Badini and Peluc2016). In the western slopes of Sierras Grandes, Argentina, the fruiting season of P. angustifolia is largely uncoupled from that of most native fruiting species, hence affecting frugivorous bird abundance, which in autumn–winter is greater in invaded sites and in spring–summer is similar between invaded and non-invaded sites (Vergata-Tabares et al. Reference Vergara-Tabares, Toledo, García and Peluc2018), likely contributing to the effectiveness of dispersal of P. angustifolia. Domestic animals also increase the chances of seed dispersal if seeds survive their ingestion and the animals’ movement is not restricted by fences. The effect of seed ingestion by rodents and domestic animals remains poorly studied.
Seed Viability and Germination
Pyracantha seeds are largely distributed by birds and mammals of which scat-derived seeds have a better probability of germinating than those that simply fall off the plant (Silverstein Reference Silverstein2005). A study in the Free State Province of South Africa revealed that the ingestion of P. angustifolia seeds by aviary birds, P. tricolor, purple-crested turacos (Tauraco porphyreolophus Vigors 1831), C. striatus, and O. morio, does not significantly affect seed germination (Adams Reference Adams2020). Furthermore, seedling germination and regrowth are optimal on bare ground or in highly disturbed soils (PIER 2018; Weedbusters n.d.). The seeds of P. angustifolia are capable of germinating and growing across a wide range of elevational and environmental conditions such as soil temperature, moisture, and chemical properties (Tecco et al. Reference Tecco, Pais-Bosch, Funes, Marcora, Zeballos and Cabido2016), making P. angustifolia more invasive across a diversity of regions. A study conducted in the mountains of Argentina revealed that sown seeds of P. angustifolia can germinate along the whole altitudinal gradient, and seedlings successfully establish and overwinter well above the current altitudinal distribution (up to 2,400 m); however, above 1,800 m most seedlings die (Tecco et al. Reference Tecco, Pais-Bosch, Funes, Marcora, Zeballos and Cabido2016). During this study, most seeds failed to germinate below 5/10 C (minimum/maximum temperatures), and the few that germinated died within a few days. However, at 5/15 C (minimum/maximum temperatures), more than 60% of the sown seeds germinated and developed (Tecco et al. Reference Tecco, Pais-Bosch, Funes, Marcora, Zeballos and Cabido2016). Tecco et al. (Reference Tecco, Pais-Bosch, Funes, Marcora, Zeballos and Cabido2016) also revealed that P. angustifolia germinates and develops at altitudes where soil moisture ranges from 10% to 35%.
Some form of cold treatment is often required to break seed dormancy in cultivation, but more empirical evidence is required to better understand optimal germination conditions for P. angustifolia. However, germination trials of P. angustifolia conducted in South Africa are showing that seeds can germinate without cold treatment in the greenhouse, though the seeds used in this trial may have experienced cold stratification from frost during the winter season while still on the parent shrub (LDA, unpublished data).
Vegetative Reproduction
Pyracantha angustifolia reproduces sexually through seeds only.
Management Options
Although P. angustifolia is known to occur in more than 20 countries, there is generally sparse knowledge on the distribution and invasive status of this plant in many of those countries. This affects the amount of available information on suitable or successful management strategies.
Legislation and Prevention Measures
In Australia, P. angustifolia is not a prohibited or restricted invasive plant under the Australian government’s Biosecurity Act 2014, but it is declared under legislation in the Australian Capital Territory and Western Australia State (Csurhes et al. Reference Csurhes, Weber and Zhou2016). In the Australian Capital Territory, any propagation or supply of the plant is prohibited, while the plant is on the prohibited species list and not permitted entry into the Western Australia State (Csurhes et al. Reference Csurhes, Weber and Zhou2016).
In South Africa, there is existing legislation that prohibits planting, maintaining, multiplying, or propagating the plant, except for the purposes of establishing a biological control reserve. According to the National Environmental Management: Biodiversity Act (NEMBA; 2004), P. angustifolia is categorized as a Category 1b invader requiring compulsory control as part of an invasive species control program, and must be removed and destroyed (DEA 2014). Under the NEMBA act, landowners must control the plant in accordance with any invasive species management program and allow an authorized official from the department to enter into the property to monitor, assist with, or implement the containment of listed invasive species or compliance with the invasive species management program (DEA 2014). It is prohibited to import, sell, or acquire propagating material of P. angustifolia, except with the written exception of the executive officer (government official).
Chemical
There are several chemicals that can be used to control all invasive Pyracantha spp., for example, glyphosate, hexazinone, imazapyr, picloram, tebuthiuron, and triclopyr (DiTomaso et al. Reference DiTomaso, Kyser, Oneto, Wilson, Orloff, Anderson and Prather2013). These herbicides are administered and applied in a variety of ways, such as basal bark, cut-stump, foliar, and stem injection treatments (DiTomaso et al. Reference DiTomaso, Kyser, Oneto, Wilson, Orloff, Anderson and Prather2013). While there is currently no registered herbicide that is recommended for control of Pyracantha in Queensland (Australia), Hawaii, or South Africa, an off-label use permit (PER11463) allows the use of various herbicides for the control of environmental weeds in nonagricultural areas, bushland, and forests in Queensland, Australia (Csurhes et al. Reference Csurhes, Weber and Zhou2016). For example, glyphyosate 360 g L−1 (dose = 1 L 2 L−1 water) and metsulfuron-methyl 600 g kg−1 (dose = 2 g 1 L−1 water at 1 ml 2 cm−1 of hole or cut) can be administered into the stems of P. angustifolia by drilling or injecting the stems with the chemicals (DAF 2016). Drilling and injecting are necessary methods required for the chemical to reach the sapwood (DAF 2016). Other chemicals such as triclopyr 600 g L−1 (dose = 17 ml 1 L−1 diesel), fluroxypyr 200 g L−1 (dose = 35 ml 1 L−1 diesel or kerosene), and the combination of triclopyr 240 g L−1 + picloram 120 g L−1 (dose = 1 L 60 L−1 diesel) can be used to spray the bark (DAF 2016; Motooka et al. Reference Motooka, Castro, Nelson, Nagai and Ching2003).
All of these chemicals are systemic herbicides that disrupt the internal growth processes of the plants, resulting in death within a few weeks. However, P. angustifolia is somewhat tolerant of triclopyr and may require crop oil as an adjuvant or carrier to enhance herbicide uptake (Motooka et al. Reference Motooka, Castro, Nelson, Nagai and Ching2003). For example, cut-stump treatments with oils of glyphosate or triclopyr are generally more effective than spraying stems or canopies (K Cassel, personal communication). The application of triclopyr to frills or basal bark treatment causes slow and erratic results compared with glyphosate, which tends to be more effective (Motooka et al. Reference Motooka, Castro, Nelson, Nagai and Ching2003). Treatment of cut stumps should be carried out in spring or early summer, before fruit development (Motooka et al. Reference Motooka, Castro, Nelson, Nagai and Ching2003).
Cultural and Mechanical
In Australia, there has been moderate success through prescribed burning of P. angustifolia fields, but burned plants often resprout and colonize the bare ground. Similarly, cut stems resprout, and seeds germinate easily in bare areas. Replanting of bare areas with dense groundcover plants or shrubs will minimize P. angustifolia seedling germination and regrowth (PIER 2018; Weedbusters n.d.). Where feasible, clearance of entire areas, rather than partial clearances, is beneficial, as it minimizes reseeding by birds from nearby plants. Large plants are often cut and painted with herbicide, while seedlings and smaller plants can be hand pulled or dug out. Root suckers are likely to arise after cutting the parent plant; hence they will need follow-up cutting and painting or spraying with chemical herbicides (ESC 2020).
Goats tend to preferentially graze many weeds rather than desirable pasture species required for sheep and cattle production, thus placing the weed at a competitive disadvantage (MLA 2007). Such grazing activity can structurally weaken the weed, prevent the weed from flowering and dispensing seeds, and reduce its stored energy reserves (MLA 2007). Pyracantha species are generally considered to be highly palatable to goats (MLA 2007; Simmonds et al. Reference Simmonds, Holst and Bourke2000), but the thorniness of P. angustifolia makes it less desirable for browsers, reducing the efficiency of grazing as a cultural control method (DiTomaso et al. Reference DiTomaso, Kyser, Oneto, Wilson, Orloff, Anderson and Prather2013).
Biological
Biological control has not been used on P. angustifolia before. However, the feasibility of biological control is currently being considered in South Africa.
Response to Herbivory, Disease, and Higher Plant Competition
In its native range, P. angustifolia likely has numerous specialist herbivores that play a significant role in the suppression of its reproductive rates and vegetative vigor, but published information is scarce. Funk and Throop (Reference Funk and Throop2010) found that a population of P. angustifolia in its introduced range in Hawai’i allocated relatively little resource to plant defenses, providing indirect evidence in support of the enemy release hypothesis (Keane and Crawley Reference Keane and Crawley2002).
Frugivory and Seed Predation
Seed predation and fruit consumption may significantly impact the demography and population abundance of invasive alien plants (Adams Reference Adams2020; Louda Reference Louda1982; Louda and Potvin Reference Louda and Potvin1995). As noted earlier, Pyracantha spp. are among the best-known bird-dispersed plants because their bright red fruits are very attractive to a variety of bird species (Staples et al. Reference Staples, Herbst and Imada2009). Examples of P. angustifolia fruit-consuming birds in New South Wales include: the Australian king parrot (Alisterus scapularis Lichtenstein 1816), blackbird (Turdus merula Linnaeus 1758), crimson rosella (Platycercus elegans Gmelin 1788), eastern rosella (Platycercus eximius Shaw 1792), gray currawong (Strepera versicolor Latham 1802) (Lepschi Reference Lepschi1993), S. graculina, sulfur-crested cockatoo (Cacatua galerita Latham 1790), and the yellow-faced honeyeater (Lichenostomus chrysops Latham 1802). Similarly, the following species have been observed feeding on P. angustifolia in South Africa: the African black duck (Anas sparsa Eyton 1838), brimstone canary (Crithagra sulphuratus Linnaeus 1766), bush blackcap (Lioptilus nigricapillus Vieillot 1818), Cape glossy starling (Lamprotornis nitens Linnaeus 1766), Cape rock-thrush (Monticola rupestris Vieillot 1818), Cape turtle-dove (Streptopelia capicola Sundevall 1857), Cape white-eye (Zosterops virens Sundevall 1850), house sparrow (Passer domesticus Linnaeus 1758), Karoo thrush (Turdus smithi Bonaparte 1850), olive thrush (Turdus olivaceus Linnaeus 1766), red-faced mousebird (Urocolius indicus Latham 1790), C. striatus, and the white-backed mousebird (Colius colius Linnaeus 1766) (Adams Reference Adams2020). Rodents have also been observed feeding on P. angustifolia seeds, but there is no evidence of any significant impacts on the plant’s populations (Adams Reference Adams2020; Williams et al. Reference Williams, Karl, Bannister and Lee2000).
Browsing
Typically, browsers can suppress populations of invasive plants, but apart from goats, to our knowledge, there is no information on browsers of P. angustifolia. Pyracantha spp. are generally considered to be highly palatable to goats (MLA 2007; Simmonds et al. Reference Simmonds, Holst and Bourke2000), but the thorniness of P. angustifolia makes it less desirable for other browsers, reducing the efficiency of grazing as a cultural control method (DiTomaso et al. Reference DiTomaso, Kyser, Oneto, Wilson, Orloff, Anderson and Prather2013).
Insect Herbivory
The literature on insects associated with P. angustifolia in China is sparse, presumably because it is not an economically important plant there. In its native range it is reportedly mainly attacked by scale insects (Ceroplastes japonicus Green 1921, Icerya purchasi Maskell 1879, and species in the Diaspididae family), white flies (Aleurocanthus spiniferus Quaintance 1903), and aphids (Aphididae). However, outside its native range (where it has been recognized for its economic and horticultural importance), several other insect pests have been recorded. Additionally, extracts of P. angustifolia have been investigated for their acaricidal and insecticidal properties on pests such as the red spider mite (Tetranychus urticae Koch 1836) (Kim et al. Reference Kim, Park, Kim, Kuk, Jang and Kim2005).
The firethorn leaf miner (Phyllonorycter leucographella Zeller 1850), is indigenous to southern Europe, where its primary host is P. coccinea, but has spread to other countries where it lives and reproduces on other Pyracantha spp. (Nash et al. Reference Nash, Agassiz, Godfray and Lawton1995; Walczak et al. Reference Walczak, Baraniak and Jerzak2010; Wąsala Reference Wąsala2009). Larvae develop a leaf blotch mine (an area of internal plant damage) in which they overwinter. Usually, two generations occur per year, and the resulting damage by the moth is mainly aesthetic (Kirichenko et al. Reference Kirichenko, Augustin and Kenis2019). This insect also mines the leaves of other woody rosaceous shrubs, but mostly completes its life cycle on Pyracantha spp. (Walczak et al. Reference Walczak, Baraniak and Jerzak2010).
The black vine weevil (Otiorhynchus sulcatus Fabricius 1775) is a common pest of cultivated P. angustifolia in the horticultural industry. The adults feed nocturnally by notching the margins of the foliage. The larvae of this weevil injure the plant in nurseries and ornamental plantings by feeding on the roots. The small grubs devour the small roots and progress to chewing the bark from the larger roots, often girdling them. The tops of girdled plants first turn yellow, then brown, and the severely injured plants ultimately die (CAES 2020). Another pest, the apple aphid (Aphis pomi De Geer 1773) damages rapidly growing terminal shoots. Both the nymphs and adults suck the sap from the leaves and young stems (CAES 2020). Additionally, the berries of firethorn may allow fruit flies to overwinter (Csurhes et al. Reference Csurhes, Weber and Zhou2016).
Pyracantha angustifolia is also a host for pests of other crops. For example, this plant is an alternative host of a polyphagous beetle (black and white citrus longhorn, Anoplophora chinensis Forster 1771) and a polyphagous scale insect (camphor beetle or scale beetle, Pseudaonidia duplex Cockerell 1896) that are pests of citrus and tea plantations, respectively (CABI 2020). The weed is also a host for other polyphagous insects, for example, the light brown apple moth (Epiphyas postvittana Walker 1863) and O. sulcatus (CABI 2020).
Diseases
Fungi
The fungal species Spilocaea pyracanthae G.H. Otth, infects Pyracantha spp., resulting in the disease scab. Scab is characterized by circular, olive-black, velvety spots on the leaves and dark spots on the red berries resulting in leaf fall, loss of flowers, and disfigured fruits (CAES 2020). The fungus mainly infects Pyracantha spp. but has been recorded on other plant species in the Rosaceae family (e.g., Butt et al. Reference Butt, Mukhtar, Batool, Aslam, Kayani and Hussain2015).
Bacteria
As noted earlier, Pyracantha angustifolia can act as the host for fire blight, a disease normally observed on apples and pears (Bastas Reference Bastas2012; Douglas Reference Douglas2006; ESC 2020). Symptoms are similar to those found on apples. Pyracantha angustifolia flowers wither and blacken and young twigs and branches die from the terminals back and appear as though they were burned (Douglas Reference Douglas2006). In horticulture, the management of this disease relies mainly on pruning and removing the infected branches, making sure to cut at least 30 cm (12 in.) below visible symptoms when the bark is dry. Cultivars ‘Mojave’ and ‘Shawnee’ have been reported to be resistant (Douglas Reference Douglas2006).
Response to Plant Competition
Although the seeds of P. angustifolia are capable of germinating and growing across wide temperature and soil moisture ranges and environmental changes (Tecco et al. Reference Tecco, Pais-Bosch, Funes, Marcora, Zeballos and Cabido2016), germination and regrowth are optimal on bare ground and in highly disturbed soils (PIER 2018; Weedbusters n.d.). This suggests that the plant is largely an opportunistic invader and perhaps is an inferior competitor in the presence of other woody plant species, although it faces weak competition for growth from grasses and forbs in grasslands (Csurhes et al. Reference Csurhes, Weber and Zhou2016). In regions with long dry summers, the seeds of native plant species are adapted to withstand harsh conditions such as prolonged dry periods, which invasive populations of P. angustifolia are not (Villalobos et al. Reference Villalobos, Vazquez and Martin2010). Even if P. angustifolia seeds and seedlings escape such mortality factors they may still die before reaching the juvenile stage because of competition from other plant species in the vicinity. However, P. angustifolia trees often enhance seedbanks of other plant species through shading (Giantomasi et al. Reference Giantomasi, Tecco, Funes, Gurvich and Cabido2008), as well as protecting seedlings of other plant species against ungulate browsing (Tecco et al. Reference Tecco, Gurvich, Díaz, Pérez-Harguindeguy and Cabido2006).
General Outlook
Pyracantha angustifolia has a broad distribution globally but has not yet reached its full potential. Due to its sharp thorns and growth structure, P. angustifolia forms dense thickets that are impenetrable barriers to grazing animals, reducing the value of grazing lands and harboring pests (e.g., foxes, rodents, and rabbits). However, because of its extensive use within the horticultural industry, it is suggested P. angustifolia will spread into new regions and countries, especially because it has the ability to invade a wide variety of habitats and climatic zones. The copious amounts of brightly colored fruits produced by P. angustifolia make it very attractive to birds and small mammals that facilitate its spread outside the cultivated range. Viable seeds excreted by the dispersal agents are capable of germinating and growing across wide elevational ranges and environmental changes, often resulting in high propagule pressure and germination rates. Mediterranean, tropical, and subtropical climates with disturbed soils and low woody vegetation cover are the most ideal habitats for P. angustifolia and are therefore at the greatest risk of establishment of P. angustifolia populations. The plant’s tolerance to cold, frost, strong winds, and seasonally dry conditions puts more habitats at high risk of invasion.
Once established, the spread of P. angustifolia can be quite rapid, as observed in the grassland biome of South Africa. In such cases, the species becomes a formidable invader that is difficult to manage because of large monocultures consisting of robust shrubs with large sharp spines that make fields inaccessible. It is suggested that P. angustifolia will become increasingly problematic in more regions around the world, especially the grasslands of South Africa, Argentina, and Australia. MaxEnt modeling suggests that much of southern Africa and parts of western America are climatically suitable for the growth and proliferation of P. angustifolia (Figure A9), putting them at high risk for invasion. Due to extensive bird-assisted dispersal and its ability to establish in remote regions, P. angustifolia will be difficult to manage using conventional control measures. Biological control agents that target the reproductive components of the species may offer sustainable management options. The presence of specialized (mono- and oligophagous) insect and fungal feeders of P. angustifolia suggests that biological control may be feasible, but extensive native range surveys are required to identify the full suite of potential biological control agents of P. angustifolia. However, careful host-specificity testing would be required in the recipient country, because P. angustifolia is a secondary host of insect pests and diseases that affect many crops.
Acknowledgments
The South African Working for Water (WfW) Programme of the Department of Environmental Affairs: National Resource Management is acknowledged for providing funding. Funding for this work was also provided by the South African Research Chairs Initiative of the Department of Science and Technology; the Afromontane Research Unit, South African National Biodiversity Institute, Centre for Invasion Biology; and the National Research Foundation (NRF) of South Africa. Any opinions, findings, conclusions, or recommendations expressed in this material are those of the authors and the NRF does not accept any liability in this regard. No conflicts of interest have been declared.
Appendix
We modeled the potential distribution of P. angustifolia using areas that were climatically representative of the species based on the Koppen-Geiger climate classifications, as recommended by Webber et al. (Reference Webber, Yates, Le Maitre, Scott, Kriticos, Ota, McNeill, Le Roux and Midgley2011) and Hill and Terblanche (Reference Hill and Terblanche2014). The climate data were downloaded from the World Maps of Köppen-Geiger Climate Classification (http://koeppen-geiger.vu-wien.ac.at). Only Köppen-Geiger climate zones that contained at least one P. angustifolia occurrence record were used as the background area from which pseudo-absences were drawn for model calibration. Plant localities were taken from the Southern African Plant Invaders Atlas (SAPIA; Henderson Reference Henderson2007; L Henderson, personal communication), Atlas of Living Australia (n.d.), and GBIF (2019). Locality data were appropriately refined: (1) duplicates were removed, (2) coordinate errors were corrected where possible, (3) coordinates lacking sufficiently fine-scale precision were excluded, (4) coordinates older than 50 yr with no new locations near them were removed, and (5) localities that were visually inspected and deemed to be a locational error or potentially growing under artificial conditions (garden records, golf courses, cultivated fields, university campuses, botanical gardens, etc.) were removed.
Bioclimatic variables are used in niche-based plant distribution modeling studies. These can be freely downloaded from the WorldClim database (www.worldclim.org; Hijmans et al. Reference Hijmans, Cameron, Parra, Jones and Jarvis2005) and the CliMond database (www.climond.org; Kriticos et al. Reference Kriticos, Webber, Leriche, Ota, Macadam, Bathols and Scott2012). For this study, climate data were obtained by downloading the standard set of bioclimatic variables from the WorldClim v. 2 database (Fick and Hijmans, Reference Fick and Hijmans2017). A jackknife analysis was used to identify the most informative variables. As a result, seven layers were selected: BIO1 = annual mean temperature; BIO2 = annual precipitation; BIO8 = mean temperature of wettest quarter; BIO10 = mean temperature of warmest quarter ; BIO12 = mean annual precipitation; BIO15 = precipitation seasonality (coefficient of variation); BIO18 = precipitation of warmest quarter. These grids have a 30 arc-second spatial resolution; this is equivalent to about 0.86 km2 at the equator (and less elsewhere) and is commonly referred to as “1-km” spatial resolution (Fick and Hijmans, Reference Fick and Hijmans2017). Bootstraps were conducted on each variable to determine which variables to the predictive distribution of the species.
We used MaxEnt (MaxEnt v. 3.3.3; BCCVL 2019; Phillips et al. Reference Phillips, Anderson and Schapire2006; https://biodiversityinformatics.amnh.org/open_source/maxent/ wschapire/maxent) to model areas climatically suitable for P. angustifolia. In MaxEnt, we used the Auto Features function to automatically limit how complex (either a linear or quadratic analysis) the model can be based on the number of occurrence locations (BCCVL 2019). However, the Extrapolate and Clamping options were not selected. Additionally, the default MaxEnt parameters of 500 iterations and 0.00001 convergence threshold were used when running the program’s “logistic output,” which creates a continuous, linear-scaled map that allows fine-scale distinctions to be made between the modeled probabilities of habitat suitability. To help avoid overfitting, a regularization value of 1, which restricts the number of occurrence points to 1 per grid cell, was used. There can be considerable variation in the performance of models when choosing a particular random selection of points for the training and testing sets (Anderson et al. Reference Anderson, Lew and Peterson2003). Therefore, we created six random bootstrap data sets for each model set that were randomly partitioned into a “testing data set,”, consisting of 30% of the species occurences, and a “training data set,” consisting of the remaining 70% of the species occurences. The testing data set was used to assess the accuracy of the model through jackknife testing (Trethowan et al. Reference Trethowan, Robertson and McConnachie2011). The final model produced for each set of models was the mean of the six model replicates. The minimum training presence used the minimum threshold from the set of six models. This threshold avoids ignoring any “known” risk areas, which is important in risk management for invasive species.
Response curves
These curves show how each environmental variable affects the probability that a location is climatically suitable for the organism. The curves show how, within the defined background, the estimated probability of presence changes as each environmental variable is varied, keeping all other environmental variables at their average sample values. Note that the curves can be hard to interpret if variables are strongly correlated, as the model may depend on the correlations in ways that are not evident in the curves. In other words, the curves show the marginal effect of changing exactly one variable, whereas the model may take advantage of sets of variables changing together. Excessive complexity in these functions can indicate model overfitting or the inclusion of erroneous or misleading records in the training data set (e.g., including records in which the species is able to persist only because of artificial cultivation practices such as irrigation.
In contrast to the marginal response curves in Figure A1, each of the following curves represents a different model, namely, a MaxEnt model created using only the corresponding variable. These plots reflect the dependence of predicted suitability both on the selected variable and on dependencies induced by correlations between the selected variable and other variables. They may be easier to interpret if there are strong correlations between variables.
Global distributions
MaxEnt marginal response curves. 1 = Annual mean temperature; 3 = isothermality; 8 = mean temperature of wettest quarter; 10 = mean temperature of warmest quarter; 12 = mean annual precipitation; 15 = precipitation seasonality (coefficient of variation); 18 = precipitation of warmest quarter. Bioclim variable definitions are included in Kriticos et al. (Reference Kriticos, Jarošik and Ota2014).

MaxEnt marginal response curves. 1 = Annual mean temperature; 3 = isothermality; 8 = mean temperature of wettest quarter; 10 = mean temperature of warmest quarter; 12 = mean annual precipitation; 15 = precipitation seasonality (coefficient of variation); 18 = precipitation of warmest quarter. Bioclim variable definitions are included in Kriticos et al. (Reference Kriticos, Jarošik and Ota2014)

Comparison of the environmental similarity of variables in ASCII to the environmental data used for training the model. In the first picture, the multivariate environmental similarity surfaces (MESS) maps, the areas in red have one or more environmental variables outside the range present in the training data, so predictions in those areas should be treated with strong caution. The second picture shows the most dissimilar variable, i. e., the one that is furthest outside its training range. For details, see Elith et al. (Reference Elith, Kearney and Phillips2010).

Definitions of classes in the Köppen–Geiger climate classification.

Known locations of Pyracantha angustifolia in its native region (China) and part of its invaded range (Japan). Colored shading represents climatic zones based on the Köppen-Geiger classification system (Kottek et al. Reference Kottek, Grieser, Beck, Rudolf and Rubel2006). Red dots represent refined data used in MaxEnt modeling, and blue dots represent additional available distribution data. Data sourced from GBIF (2019).

Known locations of Pyracantha angustifolia in Australia and New Zealand. Colored shading represents climatic zones based on the Köppen-Geiger classification system (Kottek et al. Reference Kottek, Grieser, Beck, Rudolf and Rubel2006). Red dots represent refined data used in MaxEnt modeling, and blue dots represent additional available distribution data. Data sourced from GBIF (2019) and Atlas of Living Australia (n.d.).

Known locations of Pyracantha angustifolia in France and Spain. Colored shading represents climatic zones based on the Köppen-Geiger classification system (Kottek et al. Reference Kottek, Grieser, Beck, Rudolf and Rubel2006). Red dots represent refined data used in MaxEnt modeling, blue dots represent all available distribution data. Data sourced from GBIF (2019).

Known locations of Pyracantha angustifolia in South Africa. Colored shading represents climatic zones based on the Köppen-Geiger classification system (Kottek et al. Reference Kottek, Grieser, Beck, Rudolf and Rubel2006). Red dots represent refined data used in MaxEnt modeling, and blue dots represent all available distribution data. Data sourced from GBIF (2019) and Southern African Plant Invaders Atlas (Henderson Reference Henderson2007).

Known locations of Pyracantha angustifolia in South America. Colored shading represents climatic zones based on the Köppen-Geiger classification system (Kottek et al. Reference Kottek, Grieser, Beck, Rudolf and Rubel2006). Red dots represent refined data used in MaxEnt modeling, and blue dots represent all available distribution data. Data sourced from GBIF (2019).

Known locations of Pyracantha angustifolia in North America. Colored shading represents climatic zones based on the Köppen-Geiger classification system (Kottek et al. Reference Kottek, Grieser, Beck, Rudolf and Rubel2006). Red dots represent refined data used in MaxEnt modeling, and blue dots represent additional available distribution data. Data sourced from GBIF (2019).


 Open access