

1. Introduction
Along-strike variation deformation style within present-day crustal deformation belts is best understood in the context of underlying pre-existing or inherited structures in the region (Holdsworth, Butler & Roberts, Reference Holdsworth, Butler and Roberts1996; Audet & Burgmann, Reference Audet and Burgmann2011; Huerta & Harry, Reference Huerta and Harry2012). On a large scale, pre-existing deep-seated faults typically partition the overlying deformation belt into zones of distinct deformational style. Major faults may show complex, partial reactivation structures such as compartmentalizing the belt structures, nucleating folds and controlling the basement contractions (Butler, Tavarnelli & Grasso, Reference Butler, Tavarnelli and Grasso2006). A clear example of this is the longitudinal variation in the geometry of the Zagros Simply Folded Belt, where N–S-oriented faults such as the Kazerun Fault separate the Fars and Lurestan salients from the Dezful embayment (Hessami, Koyi & Talbot, Reference Hessami, Koyi and Talbot2001; Bahroudi & Koyi, Reference Bahroudi and Koyi2003; Sepehr & Cosgrove, Reference Sepehr and Cosgrove2005). Present literature typically considers the relationship of reactivated fault zones to regions of economic importance (e.g. McMechan, Reference McMechan2012; Burberry, Reference Burberry2015b ). Studies of specific structures (e.g. Molliex et al. Reference Molliex, Bellier, Terrier, Lamarche, Martelet and Espurta2010; Said et al. Reference Said, Baby, Chardon and Ouali2011; Huerta & Harry, Reference Huerta and Harry2012) indicate that both subsequent structure and facies changes are affected by the motion of reactivated, deep-seated faults. Many economically viable deposits in Canada are associated with reactivated, deep-seated fault zones, expected to be related to fluid flow patterns (McMechan, Reference McMechan2012). An alternative view of longitudinal variation in structural style can be ascribed to variations in sediment thickness and therefore wedge width (Boyer, Reference Boyer1995). In this model, the deformation of thicker sediments gives rise to a wider thrust belt than does the deformation of thinner sedimentary packages (Boyer, Reference Boyer1995). Sedimentary prism thickness variations along strike may be constrained by the geometry of the basement; thus this model is not independent of the contribution of basement features. Similarly, along-strike changes in stratigraphy contribute to along-strike changes in structural style in the Zagros Simply Folded Belt. The Hormuz Salt is present in the Fars and Lurestan salient, and not in the Dezful embayment (Bahroudi & Koyi, Reference Bahroudi and Koyi2003). Again, however, the distribution of the Hormuz Salt is constrained by the locations of the basement faults (Burberry, Reference Burberry2015a ).
The nature of the displacement on a pre-existing fault, affected by a subsequent stress, is a function primarily of the obliquity of the fault to the imposed stress (Letouzey, Reference Letouzey and Letouzey1990). Former reverse faults may be reactivated as strike-slip or transpressive systems, particularly at low convergence angles, which explains the geometry of the Giudicarie fault system in the Eastern Italian Alps (Viola, Odonne & Mancktelow, Reference Viola, Odonne and Mancktelow2004). Compression across a previously deformed basement shear zone is thought to be responsible for the pattern of transpressional cover faulting and folding in the Itacaiunas belt, Brazil (Pinheiro & Holdsworth, Reference Pinheiro and Holdsworth1997). Compressional deformation across an existing deformed basement in the Junggar Basin, NW China, is accommodated by partitioning between pure strike-slip faults on the basin margins and transpressional thrusting within the basin itself (Allen & Vincent, Reference Allen and Vincent1997). Natural systems therefore display a range of behaviours above a pre-existing fault depending on the obliquity of the imposed stress to the pre-existing structure.
Analogue models have been used to demonstrate the effect of inherited structures on large-scale thrust-belt geometry (Marshak, Wilkerson & Hsui, Reference Marshak, Wilkerson, Hsui and McClay1992; Macedo & Marshak, Reference Macedo and Marshak1999; Lickorish et al. Reference Lickorish, Ford, Burgisser and Cobbold2002; Bahroudi & Talbot Reference Bahroudi and Talbot2003; Lacombe et al. Reference Lacombe, Mouthereau, Angelier, Chu and Lee2003; Weil & Sussman, Reference Weil, Sussman, Sussman and Weil2004; Gutowski & Koyi, Reference Gutowski and Koyi2007). For example, Macedo and Marshak (Reference Macedo and Marshak1999) demonstrated the strong effect that basement geometry may have on the development of an orogenic arc, as has been postulated for the Appalachian chain (e.g. Thomas, Reference Thomas1977, Reference Thomas2004). On a smaller scale, Viola, Odonne & Mancktelow (Reference Viola, Odonne and Mancktelow2004) used analogue models to demonstrate the reactivation of a thrust fault under a transpressive regime, explaining the geometry of the Guidicarie fault system in the Italian Eastern Alps. Large-scale finite-element modelling demonstrates that a pre-existing structural system can exert significant control on subsequent deformation styles (Huerta & Harry, Reference Huerta and Harry2012). Nilfouroushan et al. (Reference Nilfouroushan, Pysklywec, Cruden and Koyi2013) used numerical models to demonstrate that basement rheology and depth of the brittle–ductile transition zone affect the ways in which basement faults can be reactivated. Basement-involved thrusts in the hinterland of a fold–thrust belt are most likely where the brittle–ductile transition is deep, whereas more distributed deformation and a lack of major hinterland basement-involved thrusts are modelled where the brittle–ductile transition is relatively shallow.
Analogue modelling has also been used to demonstrate the deformation patterns expected above a pre-existing fault reactivated as a strike-slip system (Richard, Mocquet & Cobbold, Reference Richard, Mocquet and Cobbold1991). These models demonstrate the en échelon pattern of folding and thrusting expected in a pure strike-slip system. As the obliquity of the imposed stress to the existing fault increases, the faulting patterns in the overlying cover become more complex (Richard, Naylor & Koopman, Reference Richard, Naylor and Koopman2008). Some deformation, particularly in brittle systems, only occurs at depth and is not visible at the surface (Richard & Krantz, Reference Richard and Krantz1991). Oblique slip on a reactivated basement fault produces localized deformation in the cover sequence above the reactivated fault in a brittle system, and a wider zone of deformation in a system where the basement and cover are decoupled by a thick ductile layer (Richard, Reference Richard1991). Thus, it is apparent that natural deformation patterns can be reproduced by carefully scaled analogue models, and the controlling factor is again the obliquity between the imposed stress and the existing fault.
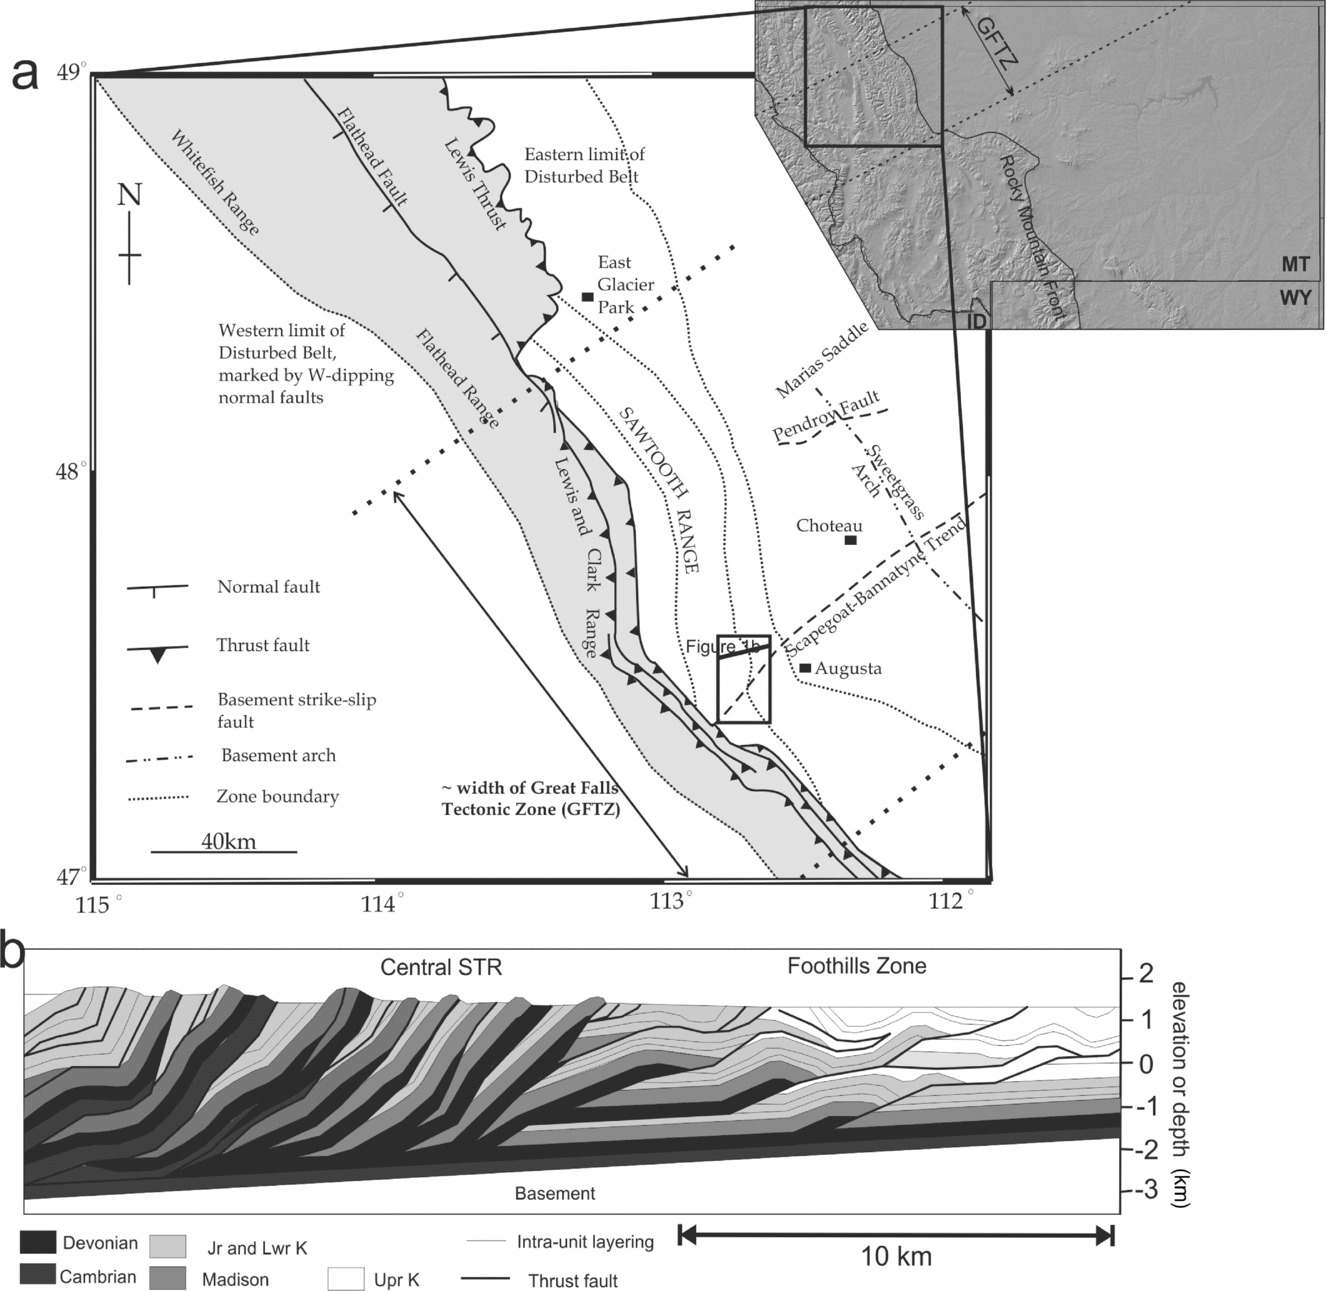
The aim of the present contribution is to investigate the deformation patterns produced in surface thrust sheets of the Sawtooth Range (hereinafter STR) deforming over a previously faulted lower-cover section (the Cambrian section developed above the Great Falls Tectonic Zone, GFTZ). The study area is shown in Figure 1. We begin with the hypothesis that the pre-existing faults of the GFTZ, such as the Scapegoat-Bannatyne Trend, are the main influencing factor on the pattern of branch lines within the thrust sheets of the Sawtooth Range. We test several configurations of lower-cover faults overlain by an entirely brittle system, in order to suggest a probable configuration for the faults making up the Scapegoat-Bannatyne Trend. Lastly, we add a detachment layer between the lower and upper cover, to demonstrate that, even when the faulted section and upper cover are separated by a detachment, the surface deformation is still affected by the fault geometry. All model scenarios are simplified relative to the natural system. The pre-existing faults are thought to be only slightly oblique to the imposed compression in the study area, and this situation is replicated in our models.
Regional geology of the Sawtooth Range, Montana, with an inset map showing the regional context. The inset base map is from Geomapapp, and GFTZ marks the extent of the Great Falls Tectonic Zone. The main map (a) is compiled from references within the text. Key basement features mentioned in the text are marked. The black box shows the location of the study area in Figures 3, 5 and 18. (b) A cross-section modified from Fuentes, DeCelles & Constenius (Reference Fuentes, DeCelles and Constenius2012).

The study area has been chosen because of the apparent large-scale effect of the edges of the GFTZ on the overall architecture of the STR. To the north, there is a significant lateral ramp in the overlying Precambrian thrust sheets (grey shaded in Fig. 1) and the STR plunges underneath this lateral ramp. To the south, a pronounced oroclinal bend in the Precambrian thrust sheets, in the vicinity of Augusta, marks the region where the fold–thrust belt overlies a named trend in the GFTZ, the Scapegoat-Bannatyne Trend (Fig. 1; Reinecke, Reference Reinecke, French and Grabb1989; Gardner & Achuff, Reference Gardner, Achuff, French and Grabb1989). This trend also appears to affect fault geometries at the top of the Madison Group within the STR, and may influence the folding geometries noted in the area (Gardner & Achuff, Reference Gardner, Achuff, French and Grabb1989). In addition, fault reactivation within the GFTZ has also created the Marias Saddle within the Sweetgrass Arch – Kevin-Sunburst Dome structure (Lorenz, Reference Lorenz and Powers1982). Thus, it is plausible that individual trends within the GFTZ have affected the geometry of the overlying thrust sheets.
2. Geologic setting
The Sawtooth Range forms the frontal region of the Northern Disturbed Belt (Sevier Orogen) in the Northern Rocky Mountains, North America. The Northern Disturbed Belt of Montana can be divided into four sub-belts (Reference Mudge and PowersMudge, 1982b ) of which the Sawtooth Range makes up sub-belts 2 and 3 (labelled Sawtooth Range in Fig. 1a), and the Lewis-Eldorado-Hoadley thrust slab makes up sub-belt 4 (grey shaded area in Fig. 1a). The Lewis-Eldorado-Hoadley thrust slab may be the youngest fault system in the area, forming concurrently with the Continental Divide Syncline in the same stress field (Mudge & Earhart, Reference Mudge and Earhart1980). Beneath this slab, the Sawtooth Range is a thin-skinned foreland fold–thrust belt, and consists of a narrow band of regional-scale thin-skinned thrust faults and related folds (Reference MudgeMudge, 1982a ; DeCelles, Reference DeCelles2004; Fig. 1b). On closer inspection, the Sawtooth Range consists of abundant imbricate thrusts with small offsets and tight asymmetric folds. Seismic and well data indicate that potential detachment surfaces occur in the upper Cambrian, top Devonian and intra-Mississippian units in the hinterland, and within the Cretaceous section in the foreland (Singdahlsen, Reference Singdahlsen1984; Holl & Anastasio, Reference Holl and Anastasio1992). Crustal-scale seismic lines (e.g. Consortium for Continental Reflection Profiling, COCORP) suggest that the crystalline basement underlying the Sawtooth Range is not always included in the thrust sheets, despite basement involvement in the hinterland and that the belt can be considered dominantly thin-skinned (Yoos et al. Reference Yoos, Potter, Thigpen and Brown1991; Boyer, Reference Boyer and McClay1992, Holl & Anastasio, Reference Holl and Anastasio1992).
The Sawtooth Range is underlain by the NE-trending Great Falls Tectonic Zone (GFTZ), a 250 km wide zone of intense basement deformation that stretches from the Idaho batholith into Saskatchewan (Mudge & Earhart, Reference Mudge and Earhart1977; Boerner et al. Reference Boerner, Craven, Kurtz, Ross and Jones1998; Sims et al. Reference Sims, O'Neill, Bankey and Anderson2004). The GFTZ is defined by a variety of NE-trending features (Finn & Sims, Reference Finn, Sims, Karlstrom and Keller2005), including a series of high-angle faults and shear zones, dyke swarms and gravity and magnetic anomalies, forming a broad zone of collinear NE-trending structures across the western Montana thrust belt (O'Neill & Lopez, Reference O'Neill and Lopez1985). Landsat imagery also reveals a marked lineament with surface structures aligned over the Scapegoat-Bannatyne Trend (Mudge & Earhart, Reference Mudge and Earhart1979). In later work, the Scapegoat-Bannatyne Trend and the similarly oriented Pendroy Fault were considered fracture systems in the subsurface (Mudge, Reference Mudge and Powers1982b). Within the Sawtooth Range and associated foreland basin, there are a number of small hydrocarbon pools, such as the Teton Knowlton Field (Napier, Reference Napier and Powers1982), that appear to be associated with these lineaments. The GFTZ is considered to have been episodically active from the late Proterozoic to the Holocene (O'Neill & Lopez, Reference O'Neill and Lopez1985).
The GFTZ was previously considered an Archaean shear zone, periodically reactivated throughout geological history (Boerner et al. Reference Boerner, Craven, Kurtz, Ross and Jones1998); however, recent data imply that the GFTZ is a Palaeoproterozoic suture between the Wyoming and Medicine Hat Archaean basement blocks, related to the subduction of an ocean basin around 1.8 Ga and thus analogous to the Churchill–Superior boundary (O'Neill & Lopez, Reference O'Neill and Lopez1985; Holm & Schneider, Reference Holm and Schneider2002; Mueller et al. Reference Mueller, Heatherington, Kelly, Wooden and Mogk2002). Glacier National Park, north of the Sawtooth Range, is the continuation of this structural low (Kulik, Reference Kulik and Powers1982) which is bounded to the south by a transverse basement structure associated with a ramp in the Lewis Thrust. In addition, some authors locate the Sawtooth Range (and other parts of the Rocky Mountain chain) above the rifted margin of the supercontinent Columbia (Sears & Price, Reference Sears and Price2002; Dickinson, Reference Dickinson2004). This, therefore, creates a highly heterogeneous basement, indicating that basement geometry must have some influence on the development of the overlying fold–thrust belt, despite the mostly thin-skinned nature of the fold–thrust belt (Hardebol et al. Reference Hardebol, Callot, Faure, Bertotti, Roure, Lacombe, Lave, Roure and Verges2007).
Broadly, the sedimentary structure is that of a composite prism, with the older wedge composed of continental margin shelf deposits and the younger wedge composed of marine and non-marine clastics shed from uplifts in the west (Fig. 2). The oldest sediment in the region is the Precambrian Belt Supergroup, a sequence of homogeneous fine-grained clastic sediments deposited in a shallow salt-water basin that covered a wide area (Childers, Reference Childers1963; Windley, Reference Windley1986). This unit crops out in the Lewis-Eldorado-Hoadley thrust system. Rifting of the basement to form the Columbia Rift Margin and deposition of the overlying clastic slope deposits, followed by uplift and erosion, occurred at the end of the Precambrian. The Cambrian–Cretaceous sequence can be summarized as Cambrian–Devonian shale-rich passive margin units overlain by the Misissippian Madison Group and overlying Jurassic – lower Cretaceous clastic formations. This sequence is overlain by the Colorado Group Shales from the upper Cretaceous, followed by clastic Cretaceous units related to the transgressions and regressions of the Cretaceous Interior Seaway.
Tectonostratigraphic column for the study area, compiled from references within the text.

The Cambrian succession of shales and limestones was deposited on the Alberta Shelf, of which the Sawtooth Range is the southern portion. The upper five Cambrian units are exposed within the central Sawtooth Range (Deiss, Reference Deiss1943; Reference Mudge and PowersMudge, 1982b ) although only the upper Cambrian unit is exposed within the study area. The total thickness of the Cambrian units in the study area is c. 385 m (Gardner & Achuff, Reference Gardner, Achuff, French and Grabb1989), but isopach maps show that the Cambrian units vary in thickness around the GFTZ (O'Neill & Lopez, Reference O'Neill and Lopez1985), suggesting that active faulting influenced the deposition of this unit. The Ordovician–Silurian hiatus is overlain by Devonian units averaging 300 m thick (Deiss, Reference Deiss1943; Gardner & Achuff, Reference Gardner, Achuff, French and Grabb1989). The Devonian units consist of interlayered shale and dolomite units, and frequently behave as a detachment unit within the Sawtooth Range (e.g. Holl & Anastasio, Reference Holl and Anastasio1992). The Mississippian Madison Group, averaging 440 m in thickness (Deiss, Reference Deiss1943; Gardner & Achuff, Reference Gardner, Achuff, French and Grabb1989), unconformably overlies the Devonian Three Forks Formation. The Madison Group consists of the lower Allan Mountain Limestone, and the upper Castle Reef Dolomite members (Nichols, Reference Nichols1983).
The boundary between the Madison and the Ellis group is an unconformity which spans at least 140 Ma (Paull & Paull, Reference Paull and Paull1991; Dickinson & Gehrels, Reference Dickinson and Gehrels2003). The early Jurassic Ellis is unconformably overlain by the Morrison formation, which is considered to be the backbulge sediments of a classic foreland basin system, as thrusting began to the west (DeCelles, Reference DeCelles2004). The Jurassic series is c. 100 m thick (Deiss, Reference Deiss1943; Gardner & Achuff, Reference Gardner, Achuff, French and Grabb1989; Fuentes et al. Reference Fuentes, DeCelles, Constenius and Gehrels2011). The basal Cretaceous unconformity represents the passage of the forebulge towards the east, modified by dynamic subsidence of the lithosphere, and the non-marine Mount Pablo and Kootenai formations are deposited in the foredeep. The Kootenai and Blackleaf Formations together average 400 m in thickness (Deiss, Reference Deiss1943; Gardner & Achuff, Reference Gardner, Achuff, French and Grabb1989). In the Aptian, marine inundation begins as the Cretaceous Interior Seaway engulfs the foreland basin system. This is seen in the deposition of the Colorado Group Shales, which average 500 m in thickness. Various authors (Boyer, Reference Boyer and McClay1992; Holl & Anastasio, Reference Holl and Anastasio1992; Fuentes et al. Reference Fuentes, DeCelles, Constenius and Gehrels2011; Fuentes, DeCelles & Constenius, Reference Fuentes, DeCelles and Constenius2012) place the majority of STR deformation as occurring in the Late Cretaceous, after the deposition of the Colorado Group, and synchronous with the deposition of the overlying Montana Group. The Montana Group, and overlying units up to Paleocene in age, are dominantly terrestrial units, representing deposition as the Interior Seaway receded (Fuentes, DeCelles & Constenius Reference Fuentes, DeCelles and Constenius2012). Thus, the composite prism can reasonably be modelled as a brittle system of interlayered sandstone and carbonates, modified in the last model by the inclusion of the Devonian detachment surface.
3. Methods
We used existing maps (e.g. Fuentes, DeCelles & Constenius Reference Fuentes, DeCelles and Constenius2012), United States Geological Survey (USGS) data and aerial photographs and satellite images to create a map of the thrust geometry in the study area. During this process, particular attention was paid to the location of branch lines within the thrust patterns. We then examined a series of key transects in the field (Fig. 3), in order to search for evidence of transport direction and small-scale deformation in individual thrust sheets. Field measurements included attitude of bedding in the thrust sheets, lithology, location and orientation of small-scale structures and orientation of any mineral lineations or fractures indicating transport direction in the thrust sheets. We then compared the field observations with the thrust map in order to predict some potential orientations of lower-cover faults for testing in the modelling phase of this study. Results from field investigations will be discussed in Section 4.a.
Simplified geologic map of the study area, modified after Fuentes, DeCelles & Constenius (Reference Fuentes, DeCelles and Constenius2012). Solid black lines mark thrust faults. Key areas and the location of Figure 7 are marked. Field sites are marked as black stars.

The experimental set-up consists of a box with one moving wall driven by a stepper motor, and two cameras set up and levelled to photograph the top surface of the model and the side view (Burberry, Reference Burberry2015b ). The modelling apparatus is 48 cm wide and each experiment had a starting length of c. 63 cm, but only 30 cm of the model were used in the final analysis. The base, moving wall and fixed wall are made of waterproofed plywood, and the side walls are made of glass, resulting in a model with a relatively high basal friction. Side walls are not lubricated during experimental runs, as the model apparatus is sufficiently wide to obtain results in the centre of the apparatus which are free from edge effects. An empirical rule for avoiding the section of the model affected by edge effects is to avoid a margin equal to or greater than the height of the sedimentary wedge. Typically, representative sections are sliced between 8 and 40 cm from one side wall, thus leaving a margin of 8 cm that contains areas of the model affected by edge effects, and 32 cm that can reasonably be used for analysis. The apparatus is allowed to dry out between experiments and thoroughly cleaned.
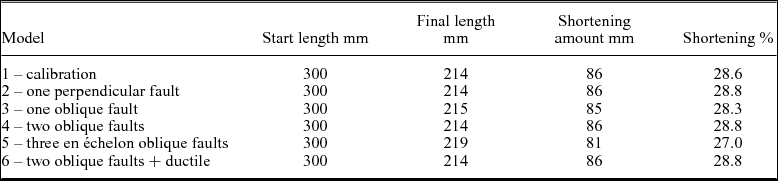
Models 1–5 in this study consisted of a lower-section layer of coarser sand (1 cm thick), overlain by four 5 mm thick layers of finer sand. Sand is poured into the deformation apparatus and smoothed using a scraper, but not compacted. The sand is sifted before use, to separate the finer and coarser fractions. A standard test sieve (#35) is used, so the material used in the ‘fine’ layers has a grain-size of less than 0.5 mm and the material used in the ‘coarse’ layers has a grain-size of c. 0.5 mm. Marker layers made of dyed fine quartz sand were used to separate the layers and were used as marker units to visualize subsurface deformation. Model 1 was run as the calibration model, with no lower-cover heterogeneity introduced. Models 2–5 had vertical, linear cuts (equivalent to inactive fault planes and hereafter referred to as faults) introduced into the lower layer with a knife, in configurations shown in Figure 4. These configurations were chosen based on results from the remote-sensing phase of the study. Faults were introduced vertically, with a knife, creating a zone of dilation and thus a genuine anisotropy in the material layers (Morley, Reference Morley1999). Model 6 also had faults introduced into the lower layer, but the cover stratigraphy varied from the other models by including a ductile layer, composed of 4 mm of a silicon polymer between the lower layer and the upper cover. In nature, this ductile unit is the Devonian mudstone, shale and limestone sequence which acts as a detachment in the thrust sheets of the Sun River Canyon (Holl & Anastasio, Reference Holl and Anastasio1992). Table 1 shows start lengths, final lengths (as used in analysis) and shortening amounts of the models. Shortening percentages in the cross-sections and maps are calculated based on the first 30 cm of the model only, so the long section of the model that is undeformed is ignored. This makes the shortening percentages more comparable with real-world examples.
Initial configurations of Models 1–6, showing the locations of lower-cover faults. (a–e) The initial configurations of Models 1–5 respectively. (f) The configuration of Model 6, with the grey box representing the location of the silicon layer. (g) The stratigraphy used in Models 1–5. (h) The stratigraphy used in Model 6.

Scaling parameters
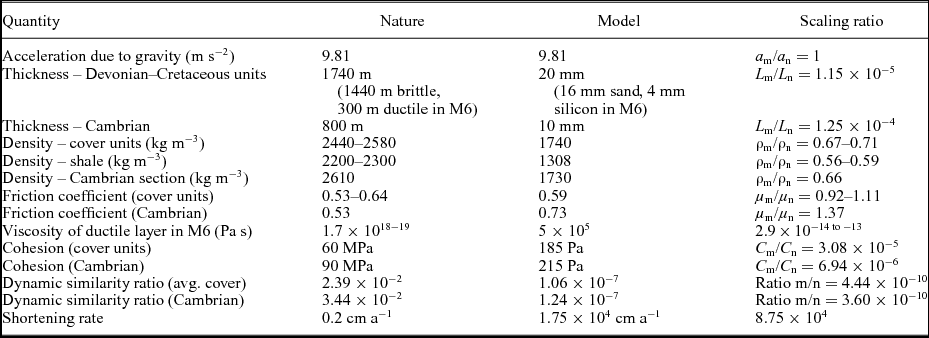
Material properties in nature from Daly, Manger & Clark (Reference Daly, Manger, Clark and Clark1996) and Schellart (Reference Schellart2000).
Photographs were taken of the model surface during set-up, to record the positions of the faults introduced into the lower-cover unit. During shortening, photographs were taken at every ~8 mm shortening increment as well as of the initial and final configurations. Top-surface photographs were used to track the appearance of new thrust sheets and the geometries of the developing thrust sheets. During analysis, the appearance of each new thrust was documented and the trace of the new thrust fault was marked on the photograph. Any branch lines were also marked. The traces of previously formed thrusts were also marked on the images. Lastly, the positions of the pre-existing faults were overlain, in order to assess the effect of these faults on the geometry of the developing thrust traces, and the density of branch lines visualized using choropleth maps. Side-view photographs were taken to estimate the geometry of the faults at each shortening increment, and to validate the appearance of new thrusts. These images were generally used to confirm the formation of additional thrust faults, so the effect of rotation in the fault strike due to edge effects does not affect the result.
Once each model had been shortened to the desired amount (Table 2), a sand pack was added to preserve the topography and the model was wetted with a soap solution and sliced into cross-sections. If the soap solution is introduced slowly via syringe and light spray at the edges of the model and the top of the sand pack, the liquid does not affect the configuration of the sand grains as seen in side view. Slices were made using a flat-bladed knife, and, with practice, clean cuts can be made that do not distort the structure of the models. Photographs were taken of every cross-section, and representative cross-sections chosen for comparison between models, to assess whether the lower-cover faults affect the geometry of the thrust faults in cross-section. Line drawings of representative cross-sections were produced, the location of the lower-cover faults calculated and marked, and any deviation of thrust fault geometry from the expected shape was noted.
Model data
In order to provide realistic simulations of natural examples, analogue models must be geometrically and dynamically scaled to their prototype. A length ratio of 1.15×10⁻⁵ is used in these models, so 5 mm in the model represents 435 m in nature. This ratio has been chosen such that the Devonian – Colorado Group sedimentary sequence in the Sawtooth Range, which averages 1740 m thick, can be represented by a sand pack 20 mm thick. The ‘lower section’ or ‘basement’ in the models consists of the Cambrian units, here modelled at the maximum thickness of 800 m (O'Neill & Lopez, Reference O'Neill and Lopez1985). In Model 6, the 20 mm sand pack is replaced by a sand pack 16 mm thick underlain by a ductile layer 4 mm thick. This represents the 300 m of Devonian shale-rich units which act as a detachment in the study area and are more representative of the rheology of the study area. Models 1–5 are therefore a simplified system, run to test the influence of lower-cover faults where the upper cover is not detached from the lower cover. Model 6 is not intended to directly replicate the deformation in the Sawtooth Range, as the silicon used has a viscosity more comparable to salt than shale. However, the model does demonstrate that even with a ductile detachment, faults in a lower unit can affect the geometries of a thrust belt overlying a detachment.
In order to satisfy the requirement for dynamic similarity, a set of dimensionless ratios which relate the physical properties of the natural and analogue materials, respectively, must be similar. The coefficient of internal friction of the material used must be equal or close to the value of the simulated rocks. The coefficient of internal friction of the cover sequence is taken to be 0.53–0.64 (Schellart, Reference Schellart2000). In contrast, the coefficient of internal friction of the loose sand used in the models is measured as 0.59 (fine sand) and 0.73 (coarse sand), using shear and normal stress measurements within the laboratory (Koyi and Petersen, Reference Koyi and Petersen1993; Weijermars, 1993; Maillot & Koyi, Reference Maillot and Koyi2006). A ratio that indicates dynamic similarity is the ratio of cohesion to density (Schreurs et al. Reference Schreurs, Buiter, Boutelier, Corti, Costa, Cruden, Daniel, Hoth, Koyi, Kukowski, Lohrmann, Ravaglia, Schlische, Withjack, Yamada, Cavozzi, Del Ventisette, Brady, Hoffman-Rothe, Mengus, Montanari, Nilforoushan, Buiter and Schreurs2006). In these experiments, for the cover rocks, C n/ρ n = 3.37 × 10⁻² and C m/ρ m = 1.06 × 10⁻⁷ (subscripts n and m represent nature and model, respectively). The lower-cover units have ratios in nature and the model of 3.44 × 10⁻² and 1.24 × 10⁻⁷, respectively. Dynamic similarity is maintained when the ratios between values for model and nature, in the upper cover and in the lower cover, are similar. The ratio obtained for the upper cover is 4.44 × 10⁻¹⁰ and for the lower cover is 3.60 × 10⁻¹⁰, indicating that dynamic similarity can be considered to be maintained. Finally, the ductile material used in these models, a silicone gum, which is a Newtonian viscous material, approximately simulates the behaviour of less competent shale at shallow crustal levels.
4. Results
4.a. Structures within the southern Sawtooth Range
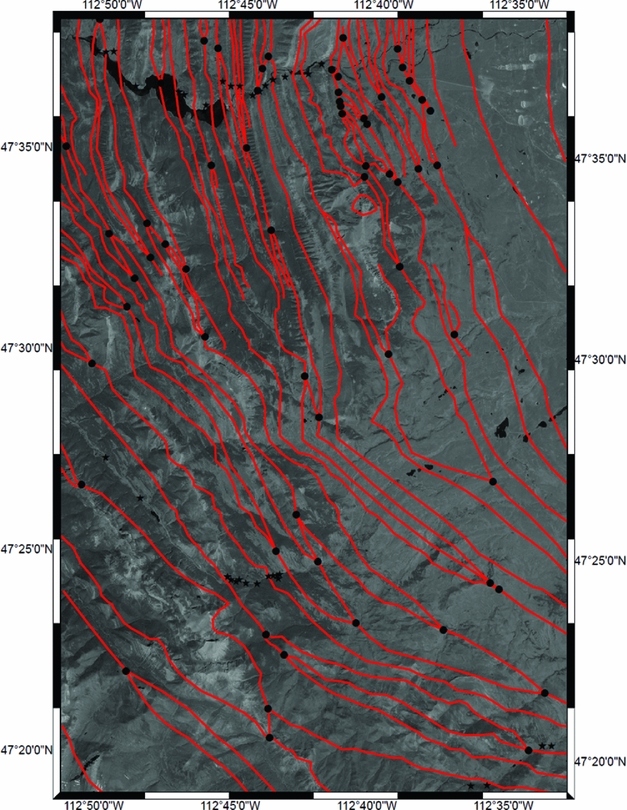
The southern Sawtooth Range is characterized by an oroclinal bend, and by a series of stacked thrust sheets in the Palaeozoic section (Figs 1b, 5). The NE–SW-oriented Scapegoat-Bannatyne Trend passes through the region (Fig. 1a). In general, the thrust traces have a low sinuosity, and to the north of the Gibson Reservoir area are oriented N–S. South of the Gibson Reservoir, the thrust traces are oriented NNW–SSE across the rest of the study area. The locations of branch lines between thrust faults are marked in Figure 5 with black dots. There are several clusters of branch lines, such as those to the east of the Gibson Reservoir, those south of the Gibson Reservoir, and those between 4730′00″N and 47°35′00″N. An additional trend of branch lines occurs from the SW corner of the map, to 47°30′00″N on the east side. These clusters or trends appear to be discrete and are separated by zones of linear thrust traces. This observation suggests that there may be discrete underlying structures, forming part of the GFTZ, that affect the surface faults in this area.
Structural map of the study area overlain on the satellite image from Figure 3. Thrust faults are generated after Fuentes, DeCelles & Constenius (Reference Fuentes, DeCelles and Constenius2012), the USGS map of Montana and remote-sensing observations.
Fracture data along the Gibson Reservoir transect show four pronounced orientations (Fig. 6a). These directions are ~N–S, ~E–W, NE–SW and NW–SE. The most prominent fracture orientation is N–S, subparallel to the strike of the thrust faults in this area, and interpreted to be formed from outer-arc stretching as the thrust sheet forms a fold over the growing thrust tip. The E–W-oriented fractures are interpreted to be the down-dip direction of the thrust sheets, suggesting an overall shortening direction. The remaining two orientations are thought to be conjugate shear fractures, as at least one of these directions shows sub-horizontal mineral lineations (Fig. 6b). Sub-horizontal mineral lineations are also noted on the E–W-oriented fractures. This distribution of fractures and mineral lineations suggests an overall W–E to WSW–ENE compression direction in this area. However, in the Cataract Falls area, to the south of the study area, a series of minor folds and faults is observed at the base of a large thrust sheet (Fig. 7a; fold hinge lines arrowed black, faults arrowed white). The thrust sheet strikes WNW–SSE (Fig. 5). The fold hinge lines are sub-horizontal and are oriented NW–SE, indicating a SW–NE regional shortening direction (Fig. 7b). Sub-horizontal mineral lineations on a fault surfaces at this location indicate some NW–SE-oriented strike-slip faults within the thrust sheet, indicating a strike-slip component of the deformation. Thus, in this region, the overall deformation style is transpressional, and the regional shortening is likely to be W–E directed, as inferred further north.
(a) Orientations of macrofractures along the Gibson Dam transect, indicating four key fracture orientations. Two are parallel to the strike and dip of the thrust faults respectively, and a set of conjugate shears can also be seen. (b) Orientations of the fractures containing sub-horizontal mineral lineations. Transport is inferred to be W–E.

(a) Photograph of folding within the Cambrian units at Cataract Falls. (b) Stereonet showing the orientations of fold hinge lines and a strike-slip fault within the outcrop.

These observations suggest that the Scapegoat-Bannatyne Trend in this area is made up of a series of discrete faults, underlying the complex zones in the thrust sheets. These fault strands appear to be oblique to the regional compression direction. Complexity is noted in the large-scale oroclinal bend to the south of the present study area, which may also be related to the Scapegoat-Bannatyne Trend. Thus, the series of experiments described above and illustrated in Figure 4 was designed, testing the effect of obliquity in the lower-section fault orientation (Model 2 v. Model 3, containing one fault, parallel to or oblique to the compression direction) and the effect of multiple lower-section fault strands (Models 3–5, testing the effects of one, two or three fault strands). A final model is designed to demonstrate that the lower-section faults can affect surface deformation patterns even when the upper and lower sections are decoupled by a detachment. This model is not intended to produce structures identical to those in the study area, but to be a proof of concept. These results will be described below.
4.b. Analogue modelling results: map view
In discussing the analogue model results, we will first consider the models in map view, before comparing representative cross-sections from each model. Figure 8 shows successive map-view images of Model 1, the model run without any pre-existing faults (Fig. 8a) as a calibration. Thrusts develop close to the moving wall and propagate into the foreland in a piggyback style. The first and second thrusts (Fig. 8b, c) form with a nearly linear trace. The third thrust (Fig. 8d) forms as segments linked by branch lines. Successive thrusts form with some sinuosity and the development of randomly distributed branch lines (Fig. 8e, f, g, h, i). The deflections and segmentation of the thrusts are not systematic, and a clustering of thrust branch lines is not observed. Observation of the model between photographs suggests that thrusts initiate in the centre of the model and propagate to the edges, a situation captured in Figure 6f and h.
(a–h) Stepwise plan views from Model 1, at successive stages of shortening. The scale bar at the lower right is 3 cm long. The number at the lower left indicates the percentage shortening at the point the image was taken. Thrust traces are interpreted on each image. Black dots represent branch lines. (i) A choropleth map of branch line density.

Sequential map-view photographs of Model 2, the model with one pre-existing fault, cut perpendicular to transport direction (Fig. 9a). The first thrusts develop with a slightly sinuous trace (Fig. 9b, c). Thrust 3 develops in two segments, a small segment close to the edge of the box, and a longer, more linear segment (Fig. 9d). Thrust 4 develops in two segments, a shorter one near the edge of the box and a longer segment with some minor deflections in the trace (Fig. 9e). One of the deflections in this trace is close to the location of the pre-existing fault. The next thrust begins to develop in the centre of the model (Fig. 9f) and then propagates across the model with a linear trace (Fig. 7g). Figure 7g also shows the next thrust, thrust 6, initiating in the centre of the model. Again, this thrust propagates across the model with a linear trace (Fig. 9h). Figure 9i shows that the branch lines are not closely clustered around the location of the pre-existing fault. Whilst it is tempting to ascribe the initiation of thrusts in the centre of the model to the presence of the pre-existing fault, this cannot be defended, as the same occurrence was noted in Model 1.
Same as Figure 8, but for Model 2. The locations of the pre-existing faults are shown.

Figure 10 contains sequential map-view photographs of Model 3. This model contained one pre-existing fault, but cut to be slightly oblique to the transport direction (Fig. 10a) following interpretation from the remote images as discussed above. The first thrust develops with a nearly linear trace (Fig. 10b) with a deflection that does not appear related to the pre-existing fault location. The second thrust, however, develops with a deflection around the location of the pre-existing fault (Fig. 10c). The next thrust develops branching off from thrust 2 close to the pre-existing fault, and propagating to the edge of the model (Fig. 10d). Figure 10d also shows a thrust developing to one side of the pre-existing fault and propagating between the fault and the model edge. Figure 10e, f shows a series of thrusts developing, initiating from the edge of the model, from deflections in other thrust sheets, or ahead of branch lines in hinterland thrust sheets. Figure 10g shows a thrust initiating with a large deflection to one side of the pre-existing fault, and the thrust immediately to the hinterland is segmented, with one segment edge occurring over the pre-existing fault. In the final model configuration (Fig. 10h) this initiating thrust has amplified and there is a pronounced deflection over the pre-existing fault. Compared to the previous two models, this pattern of developing thrusts and branch lines suggests that the presence of the oblique pre-existing fault has disrupted the standard pattern of thrusts initiating in the centre of the model. In addition, the presence of the pre-existing fault appears to promote thrust segmentation, with some branch lines clustering around the location of the pre-existing fault (Fig. 10i).
Same as Figure 8, but for Model 3. The locations of the pre-existing faults are shown.

The sequential development of Model 4 is shown in Figure 11. This model had two faults cut into the lower section, oblique to the direction of transport (Fig. 11a). The first thrust develops as three separate segments, with the segment boundaries above the locations of the pre-existing faults (Fig. 11b). The next thrusts are also segmented (Fig. 11c) and some of the segment boundaries coincide with the locations of the pre-existing faults. The same pattern of segment boundaries above the pre-existing faults, or deflections in the thrust traces above the faults, is observed in Figure 11d. Branch lines tend to fall within a few cm of the pre-existing fault location. Figure 11e shows a new thrust initiating between the edge of the model and one of the faults. This thrust merges with a hinterland thrust near a pre-existing fault (Fig. 11f), and a new thrust initiates between the model edge and the other pre-existing fault. In Figure 11g, the new thrust can be seen initiating between the two pre-existing faults. In the final model configuration (Fig. 11h) this segment has amplified between the pre-existing faults, and two additional segments have developed. Compared to the previous models, the segmentation of the thrust faults appears to be controlled by the locations of the two pre-existing faults, and the branch lines between thrust faults fall in a zone close to the pre-existing fault locations, or cluster near the pre-existing faults (Fig. 11i).
Same as Figure 8, but for Model 4. The locations of the pre-existing faults are shown.
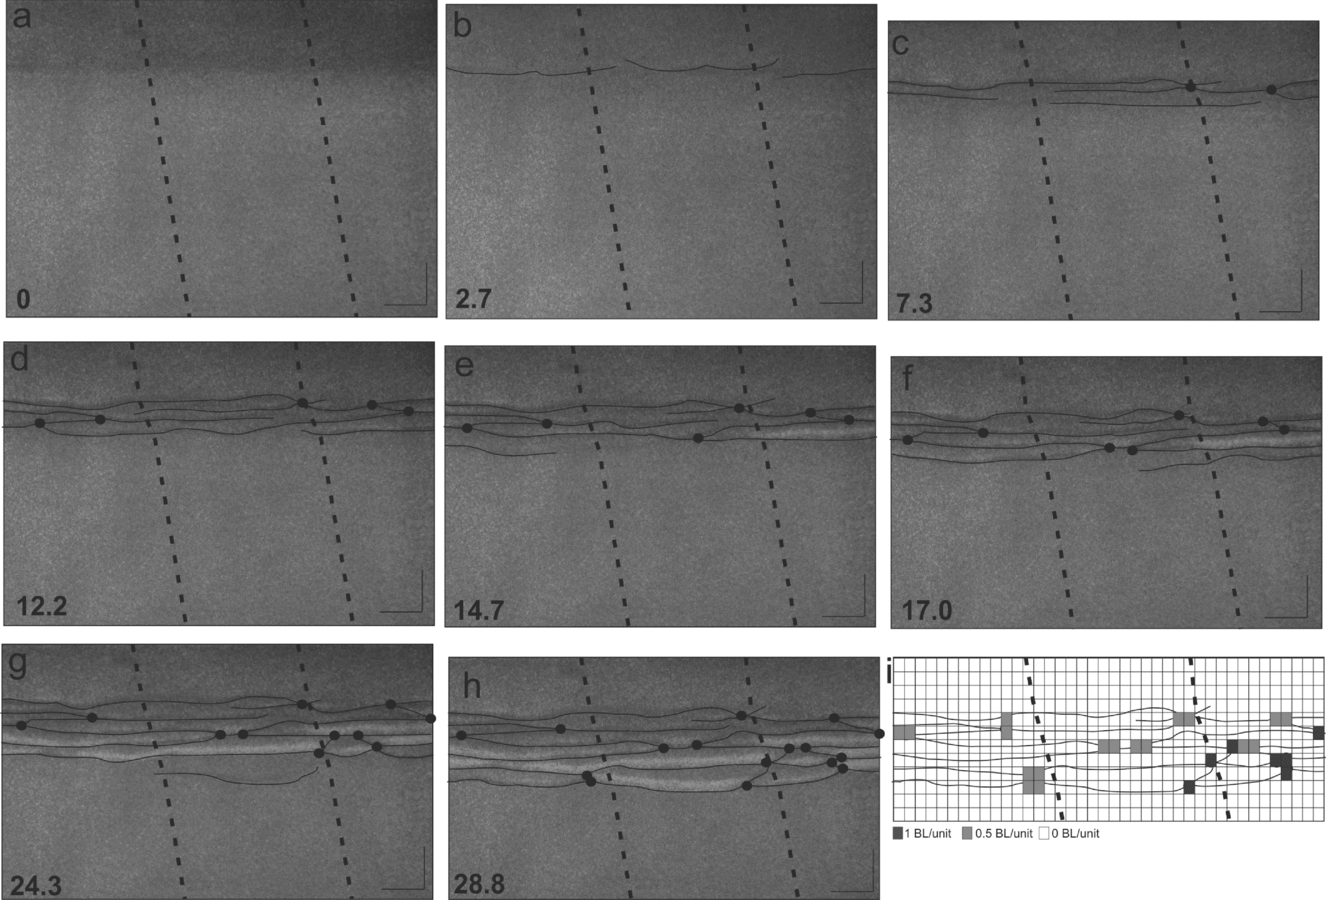
Figure 12 shows the sequential development of Model 5, the model with three right-stepping pre-existing faults (Fig. 12a). The first thrust forms with a deflection around one of the pre-existing faults, and divides into two segments near the hinterland of the second pre-existing fault (Fig. 12b). The next thrust also shows a deflection around one of the pre-existing faults, and has not propagated across the whole model (Fig. 12c). The next thrusts to develop form as two segments, with an overlap zone between two of the pre-existing faults (Fig. 12d). At this time step, the third pre-existing fault is not yet affecting the developing fold–thrust belt. Figure 12e shows an additional thrust developing between the second pre-existing fault and the edge of the model. This thrust develops across the whole model in the next time step (Fig. 12f) and has a deflection across the middle pre-existing fault. At the same time, a thrust develops which merges with the deflected thrust near the pre-existing fault and propagates to the edge of the model. Figure 12g shows the next thrust propagating across the model with a linear trace. In the final model configuration (Fig. 12h) the developing thrust from Figure 12g has propagated across the model and has amplified significantly. A final thrust is initiating to the foreland, with a distinct deflection near the middle of the pre-existing faults. This model demonstrates that a deformed foreland region can also affect the developing thrust trace (Fig. 12b). As in the previous model, the segmentation of the thrust faults appears to be controlled by the locations of the pre-existing faults, and the branch lines between thrust faults fall in a zone close to the pre-existing fault locations (Fig. 12i). The middle pre-existing fault in this configuration appears to have the most pronounced effect on the branch line locations, deflections and segmentation of the thrust faults.
Same as Figure 8, but for Model 5. The locations of the pre-existing faults are shown.

Model 6, the proof of concept, has a different stratigraphy from the other models, and as a result the map-view images look very different. Instead of a series of closely spaced thrust faults, large, broad, doubly vergent structures develop in the model (Fig. 13). Two faults are cut into the lower section of the model (Fig. 13a), and the cover sequence is separated from the lower section by a ductile layer that covers the entire width of the model, and the first 30 cm used in analysis. The first thrust develops across the model with subtle deflections that may be related to the positions of the two faults (Fig. 13b). Displacement on this fault continues to accumulate, creating a large folded structure (Fig. 13c), and the deflections on the thrust trace are masked. Once the second thrust starts to develop, slight deflection can be seen on the trace, again possibly related to the locations of the pre-existing faults (Fig. 13d). The third fore-thrust in the model develops with a clear deflection around one of the imposed pre-existing faults although there is limited influence from the other fault (Fig. 13e). In the final configuration, a backthrust can be identified, related to this third fold-thrust feature (Fig. 13f). The backthrust trace geometry mimics that of the fore-thrust. This model demonstrates that although the presence of the ductile layer mutes the influence of the pre-existing faults, and changes the deformation style of the model, the surface thrust geometries can still be influenced by lower-section heterogeneity.
Same as Figure 8, but for Model 6. The locations of the pre-existing faults are shown.

Figure 14 shows all choropleth maps from Models 1–5, showing clustering of branch lines around the pre-existing faults, and an increase in branch lines in models with faults compared to Model 1. The pre-existing faults which are slightly oblique to the compression direction affect the geometry of the thrust traces developed in the cover sequence, but there is no discernible effect from a pre-existing fault parallel to the compression direction. Where there are multiple faults in the pre-existing, the interaction between those faults enhances the effect of the faults and promotes segmentation of the surface thrusts and the development of clusters of branch lines around the pre-existing fault traces.
All choropleth maps from Figures 8–12 (Models 1–5) for comparison. Branch lines cluster around the locations of the pre-existing faults.

4.c. Analogue modelling results: cross-section view
In cross-section, thrust faults and associated folding in the layers can be identified in representative cross-sections from each model. In Model 1, the thrust faults become steeper to the hinterland, as expected for piggyback-style thrusting. Offsets on individual thrusts are relatively small, and deformation is also accommodated by folding (Fig. 15 a, b). In Model 2, representative cross-sections (Fig. 15c, d) cannot be geometrically distinguished from the cross-section from Model 1. A cross-section from the zone in Model 3 that is unaffected by the pre-existing faults contains fewer thrusts than in Models 1 and 2, but is geometrically similar to the previous representative cross-sections (Fig. 15 e, f). A subtle change in the angle of the youngest thrust may be observed in Model 3, where the thrust overlies the pre-existing fault (Fig. 15g, h), but the marker representing the top of the lower section does not appear to be deformed. In other respects, the geometry of the fold–thrust belt is similar to that noted in other representative sections in Figure 15. In Model 4, a representative section away from the pre-existing fault (Fig. 16a, b) shows a geometry similar to representative sections from Figure 15. There may be a slight change in the angle of the thrust overlying the pre-existing fault in Model 4 (Fig. 16c, d) but again the top lower-section marker does not appear to be deformed. Similar results are noted in Model 5, that the region of the model away from any pre-existing faults resembles a typical fold–thrust belt as in the other models (Fig. 16e, f). A slight change in the thrust angle and possible subtle deformation of the top lower-section marker unit may be observed where the frontal thrust crosses the pre-existing fault (Fig. 16g, h). Figure 17 shows representative sections from Model 6. This cross-section contains the characteristic doubly vergent pop-up type structures expected when a brittle unit overlies a ductile detachment. Some interaction of the pre-existing faults can be identified in both representative sections. In the first section (Fig. 17a, b) the ductile layer thickens slightly above the pre-existing fault, and a small fold begins to develop in the cover. A similar thickening in the ductile layer is observed above the pre-existing fault in the second cross-section (Fig. 17c, d). To the foreland of the pre-existing fault, the ductile layer has thickened, and to the hinterland the ductile layer has thinned.
Representative cross-sections from Models 1–3. (a, b) A representative section from Model 1. (c, d) Representative sections from Model 2. (e–h) Representative sections from Model 3. Thrusts are interpreted in the right-hand line drawings, and the positions of the pre-existing faults are marked where relevant.

Representative cross-sections from Models 4–5. (a–d) Representative sections from Model 4. (e–h) Representative sections from Model 5. Thrusts are interpreted in the right-hand line drawings, and the positions of the pre-existing faults are marked where relevant.

Representative cross-sections from Model 6. Thrusts and the deformation of the ductile layer are interpreted in the line drawings in (b) and (d), and the positions of the pre-existing faults are marked.

In summary, the pre-existing faults do not appear to markedly influence the geometry of the thrust sheets in cross-section. In an entirely brittle system, there may be slight variation in the trajectory of the thrust sheet directly overlying the pre-existing fault, but the effect is subtle. In the system decoupled by a ductile layer, there are subtle thickness changes in the ductile layer directly overlying the pre-existing faults. In neither scenario do the pre-existing faults explicitly appear to reactivate as dip-slip faults and propagate into the cover.
5. Discussion
Our results have demonstrated that complexity in surface thrust sheets can be related to heterogeneity within the lower sedimentary section. This complexity is best observed in the map-view thrust traces, as the models do not show the lower-cover faults propagating into the upper cover. The lower-cover faults are more likely to be reactivated as strike-slip features, given the low obliquity between compression direction and fault orientation. These results are consistent with findings from Richard (Reference Richard1991) and Richard, Naylor & Koopman (Reference Richard, Naylor and Koopman2008), that obliquity of the pre-existing fault with respect to the compression is a controlling factor on reactivation, and that decoupling basement and cover by a ductile horizon mutes the influence of a basement fault but does not completely mask it.
5.a. Predicted basement faults in the Scapegoat-Bannatyne Trend in the Sawtooth Range
Based on these results, we predict four to five discrete fault strands in the basement of the study area (Fig. 18). Each strand is oriented NE–SW, following the orientation of the Scapegoat-Bannatyne Trend (Fig. 1). Each strand passes through a region of non-linear thrust faulting, as described previously. One fault strand passes south of the Gibson Dam area, with additional faults forming to the SW. A further strand is proposed further south, and there may also be a basement fault passing through the Cataract Falls area. We postulate that the interaction between the basement fault and the oblique transport direction promotes the complex deformation observed in the thrust sheet in this area.
Structural map of the study area overlain on the satellite image from Figure 3. The positions of proposed basement fault strands are marked with heavy dashed lines.

These predictions are consistent with other work in the region. Reinecke (Reference Reinecke, French and Grabb1989) notes several discrete faults in the overlying Precambrian thrust sheet (grey shaded in Fig. 1) in the same area and with the same orientation as our proposed faults. Alpha (Reference Alpha1955) shows a map in which the Scapegoat-Bannatyne Trend is predicted to divide into two strands close to our southernmost two fault strands in Figure 18. In addition, processed aeromagnetic and gravity anomaly data from Mankinen et al. (Reference Mankinen, Hildenbrand, Zientek, Box, Bookstrom, Carlson and Larsen2004) indicate that there are at least two NE–SW-oriented lineaments in the study area (arrowed in Fig. 19).
Major density boundaries (solid lines) within the middle to upper crust, marking structural trends in the study area. Base map is from Mankinen et al. (Reference Mankinen, Hildenbrand, Zientek, Box, Bookstrom, Carlson and Larsen2004). The dotted line marks the approximate deformation front of the Sawtooth Range, and the grey area marks the extent of the Rocky Mountains in this region. The black box marks the present study area, that shown in Figures 3, 5 and 18. The arrowed density boundaries are interpreted to be faults within the GFTZ that continue into the study area and are consistent with predicted faults in Figure 18.

5.b. Limitations of the models in this study
These models are most applicable to thrust belts that are considered thin-skinned, without significant basement involvement. We have assumed that the lower cover section is heterogeneous, whereas the upper cover is not. Our results could also be applied to the hinterland of fold–thrust belts, where basement rocks are involved in the thrust sheets along with cover rocks. One example of this situation is the Kishenen Basin in southern Alberta, where Proterozoic units are involved in the major thrust sheets (Fuentes, DeCelles & Constenius, Reference Fuentes, DeCelles and Constenius2012). Another situation where basement units are involved in thrusting is the Magura zone of the northern Carpathians, Slovakia, where slivers of the basal Marmarosh Ridge are incorporated into thrust sheets (Gagala et al. Reference Gagala, Verges, Saura, Malata, Ringenbach, Werner and Krzywiec2012). A third example of hinterland basement involvement in thrust sheets comes from the eastern Dolomites, Italy, where significant thrusts in the basement section are interpreted to underlie the Croda Russa to Mount Grappa region (Schonborn, Reference Schonborn1999). The numerical models of Nilfouroushan et al. (Reference Nilfouroushan, Pysklywec, Cruden and Koyi2013) indicate that basement involvement in hinterland thrust sheets is most likely where the brittle–ductile transition zone is deep within the basement units.
No analogue model in this study exactly reproduced the cross-sectional geometry of the Sawtooth Range, a foreland-verging series of Palaeozoic thrust sheets, as mapped by Holl & Anastasio (Reference Holl and Anastasio1992) or Fuentes et al. (Reference Fuentes, DeCelles, Constenius and Gehrels2011). The brittle models (Models 1–5) show greater involvement of the lower layer in the deformation than is seen in nature. In nature, the Palaeozoic thrust sheets detach within the Devonian sequence in the Gibson Reservoir area (Holl & Anastasio, Reference Holl and Anastasio1992) and in the upper Cambrian units in the Cataract Falls area (Raines & Johnson, Reference Raines and Johnson1995). However, in our Model 6, the ductile material is a more accurate representation of the behaviour of a salt system, rather than the shale and limestone nature of the detachment in the region (Deiss, Reference Deiss1943). This means that the modelled situation decouples the lower units and the upper cover more efficiently than the natural situation is expected to. Thus, the effect of the basement faults is expected to be less pronounced in nature than in Models 4 and 5, where the multiple basement fault strands generate significant complexity in the overlying thrust sheets. However, the effect of the basement faults is not expected to be as muted as in Model 6. We also did not attempt to model the larger-scale curvature of the Sawtooth Range in this area, as this is outside the limits of the apparatus available to us. Nonetheless, despite these caveats, we consider that our models are informative and valuable in demonstrating the likely evolution of a fold–thrust belt deforming above a basement with multiple existing fault strands.
6. Conclusions
This study has considered the effects of basement faults on overlying thrust systems, with application to the Sawtooth Range, Montana. Our results have demonstrated that complexity in surface thrust sheets can be related to heterogeneity within the basement or lower cover, even when there is a detachment between the faulted unit and the remaining cover. This complexity is best observed in the map-view thrust traces, as the models do not show the lower-cover faults propagating into the cover. The basement faults are more likely to be reactivated as strike-slip features, given the low obliquity between compression direction and fault orientation. In map view, the lower-cover faults which are slightly oblique to the compression direction affect the geometry of the thrust traces developed in the cover sequence, but there is no discernible effect from a lower-cover fault parallel to the compression direction. Where there are multiple faults in the lower cover, the interaction between those faults enhances the effect of the faults and promotes segmentation of the surface thrusts. En échelon lower-cover faults promote the most segmentation of the surface thrusts. These results were then applied to the study area in the Sawtooth Range, predicting five discrete fault strands associated with what is generally mapped as the Scapegoat-Bannatyne Trend. More generally, these results can be used to govern evaluation of thrust belts deforming over faulted basement, and to predict the locations of specific fault strands in a region where this information is unknown.
Acknowledgements
We thank two anonymous reviewers for comments which improved the manuscript, and Jonas Ruh for editorial comment. J.M.P. thanks Jake Bruihler for assistance in the field. We would also like to thank undergraduate researchers Amanda Jones and Bailey Lathrop, as well as graduate research assistant Matthew Peppers for invaluable assistance in running and slicing the various models in this suite.