





Introduction
Seed dispersal fundamentally drives the formation and development of plant populations and communities (Zong et al., Reference Zong, Liang, Liu, Liu, Baskin, Baskin, Tian, Li, Xin, Luo, Wang, Zhou, Qin and Zhai2023a). Wind-dispersed seed dispersal is a key process, especially in grassland and desert ecosystems, that shapes seed spatial distribution and influences plant population diversity, community succession and ecosystem stability (Zhou et al., Reference Zhou, Liu, Xin, Daryanto, Wang, Li, Wang, Liang, Qin, Zhao, Li, Cui and Liu2020). Seed secondary wind dispersal refers to the horizontal and vertical movement processes occurring from seed deposition on the ground surface to germination, representing wind-driven seed redistribution following its primary dispersal (i.e., the process by which seeds fall from the parent plant; Schurr et al., Reference Schurr, Bond, Midgley and Higgins2005; Vander Wall et al., Reference Vander Wall, Kuhn and Beck2005; Gu et al., Reference Gu, Yue, Li, Pan and Khaliya2012). Secondary wind dispersal modifies the initial spatial distribution of seeds, reshaping the spatio-temporal distribution dynamics of plant populations (Schurr et al., Reference Schurr, Bond, Midgley and Higgins2005; Tian et al., Reference Tian, Liang, Liu, Liu, Phartyal, Zong, Xin, Ba, Li, Liu, Wang, Zhou, Qin and Zhai2023). The process enables seeds to reach suitable habitats for establishment, thereby enhancing colonization success (Zhu et al., Reference Zhu, Liu, Xin, Liu and Schurr2019; Tian et al., Reference Tian, Liang, Liu, Liu, Phartyal, Zong, Xin, Ba, Li, Liu, Wang, Zhou, Qin and Zhai2023). It also facilitates spatial reorganization and the restoration of natural vegetation in degraded ecosystems (Tackenberg et al., Reference Tackenberg, Poschlod and Kahmen2003; Vásquez et al., Reference Vásquez, Miranda, Delpiano and Becerra2022; Qu et al., Reference Qu, Zhao, Yang, Wang, Zhang and Qu2024).
Plant dispersal strategies represent integrated mechanisms through which plants optimize seed dispersal and reproductive success, shaped by morphological evolution and ecological adaptation (Orth et al., Reference Orth, Harwell and Inglis2006; Wright et al., Reference Wright, Trakhtenbrot, Bohrer, Detto, Katul, Horvitz, Muller-Landau, Jones and Nathan2008). Seed morphological and aerodynamic characteristics of wind-dispersed species are strongly influenced by natural selection acting on seed dispersal (Levin et al., Reference Levin, Muller-Landau, Nathan and Chave2003; Ran et al., Reference Ran, Schurr, Spiegel, Steinitz, Trakhtenbrot and Tsoar2008). Vegetation structure (e.g., coverage, height and density) regulates seed dispersal processes by altering surface roughness and near-surface wind velocity (Qin et al., Reference Qin, Liu, Liu, Liang, Baskin, Baskin, Xin, Li, Wang, Zhou, Luo, Gao and Naren2020; Li et al., Reference Li, Zhou, Liu, Che, Jiang, Zhang, Yu, Zong, Tian and Wang2024). For instance, vegetation obstructions may force seeds to adopt non-aerial movement modes (e.g., rolling and saltation), while distinct morphological appendages (e.g., balloon or disc-shaped structures) could further modulate their secondary wind dispersal strategies by altering the contact area with the ground (Horn et al., Reference Horn, Nathan and Kaplan2001; Damschen et al., Reference Damschen, Baker, Bohrer, Nathan, Orrock, Turner, Brudvig, Haddad, Levey and Tewksbury2014; Heydel et al., Reference Heydel, Cunze, Bernhardt-Römermann and Tackenberg2014). However, how secondary wind-dispersal strategies can be characterized, and the mechanisms by which seed morphology and vegetation structure jointly regulate these strategies, remain unclear.
Previous studies have shown that, in wind-dispersed species, seed size, shape, mass and appendage type, as well as mass per projected area and terminal velocity (maximum descent speed in still air), critically affect secondary wind dispersal (Soons et al., Reference Soons, Heil, Nathan and Katul2004; Zhou et al., Reference Zhou, Liu, Xin, Daryanto, Wang, Qian, Wang, Liang, Qin, Zhao, Li, Cui and Liu2019). For example, seeds possessing specialized dispersal structures (e.g., pappus, wing and balloon), as well as those with low mass, wing loading and terminal velocity, are more easily uplifted by wind, enabling secondary long-distance dispersal (Schulz et al., Reference Schulz, Doring and Gottsberger1991; Sakai et al., Reference Sakai, Sakai and Ishii1997; Ran and Muller-Landau, Reference Ran and Muller-Landau2000; Zheng et al., Reference Zheng, Sang and Ma2004; Zhu et al., Reference Zhu, Buchmann and Schurr2022). However, the secondary wind dispersal strategies adopted by these seeds in habitats with different vegetation structures (e.g., low-coverage desert steppe and bare ground, or high-coverage typical steppe and meadow steppe) still require further investigation.
We collected data on seed morphology and aerodynamic traits, as well as lift-off wind velocities (LWVs) and dispersal velocities (DVs), determined by a large-scale wind tunnel to simulate the secondary wind dispersal processes of 12 wind-dispersed species across simulated vegetation structures of bare ground, desert steppe (including sparse short-grass, sparse tall-grass and sparse shrub-grass), typical steppe and meadow steppe. We measured seed mass, wing loading, shape index and terminal velocity for 12 species (20 seeds per trait; 960 seeds total). LWV for seeds of the 12 species was tested across 6 vegetation structures, with 10 seeds per test and 5 replicates, resulting in 3,600 seeds released. DV of seeds from the 12 species was tested at 6 wind velocities and 6 vegetation structures, with 10 seeds per test and 5 replicates, resulting in a total of 10,800 seeds. We applied K-means and hierarchical clustering analyses to identify the number of seed secondary-dispersal strategy categories based on seed morphological and aerodynamic traits. The aims of the study are: (1) to categorize seed secondary wind dispersal strategies; (2) to reveal the mechanisms underlying the secondary wind dispersal strategies of seeds with different morphologies; and (3) to analyze how the interaction between seed morphology and vegetation structures influences secondary wind seed dispersal strategies. The findings will provide theoretical support for understanding the mechanisms underlying secondary wind dispersal of seeds and the adaptive strategies of anemochorous plants in heterogeneous environments.
Materials and methods
Seeds collection
Seeds with six types of appendages (thorn, pappus, one wing, disc-shaped, balloon and four wings) were selected. Two species were selected for each appendage type, but differed in shape or mass, to compare the effects of seed morphology on secondary wind-dispersal strategies. Thus, a total of 12 species were used as a model system to study secondary wind-dispersal strategy (Fig. 1). During the seed maturation season (August to October), 500 seeds per species were collected by randomly selecting 10 plants. Fifty intact seeds were collected from each plant. After natural air-drying, the seeds were stored for subsequent experiments.
Image of the 12 seed species used in this study. Appendage type: O, one wing; P, pappus; T, thorn; D, disc-shaped; B, balloon; F, four wings. O-1, Acer tataricum subsp. Ginnala (Maxim.) Wesmael.; O-2, Acer truncatum Bunge.; P-1, Cynanchum thesioides (Freyn) K. Schum.; P-2, Cynanchum rostellatum (Turcz.) Liede & Khanum.; T-1, Calligonum arborescens Litv.; T-2, Calligonum klementzii Losinsk.; D-1, Koelreuteria paniculata Laxm.; D-2, Ulmus pumila L.; B-1, Oxytropis racemosa Turcz.; B-2, Sphaerophysa salsula (Pall.) DC.; F-1, Calligonum leucocladum (Schrenk) Bunge.; F-2, Calligonum rubicundum Bunge.

Figure 1 Long description
Twelve seed species are displayed in two rows, each labeled with a code. The top row includes seeds labeled O-1, P-1, T-1, D-1, B-1 and F-1. The bottom row includes seeds labeled O-2, P-2, T-2, D-2, B-2 and F-2. Each seed has a distinct appendage type, such as one wing, pappus, thorn, disc-shaped, balloon and four wings. The seeds vary in shape and texture, showcasing different morphological features.
Measurement of morphological and aerodynamic traits
Seed mass was determined using an electronic balance (precision 0.01 g). Seed length, width and height were measured using a vernier caliper (accuracy 0.01 mm; Zong et al., Reference Zong, Liang, Liu, Liu, Baskin, Baskin, Tian, Li, Xin, Luo, Wang, Zhou, Qin and Zhai2023a). Seed projected area was calculated using skimage. The measure module of Python software library is based on seed images obtained with a digital scanner (Zong et al., Reference Zong, Liang, Liu, Liu, Baskin, Baskin, Tian, Li, Xin, Luo, Wang, Zhou, Qin and Zhai2023a). Seed terminal velocity, defined as the maximum velocity attained in by a seed when falling in still air, was determined by a video recording method (Liu et al., Reference Liu, Xin, Su, Zhao, Li, Liu, Cony, Liang, Qin, Qian, Cui and Zhou2021). Seed shape index, which reflects the degree to which a seed approximates a sphere, was calculated as follows (Li et al., Reference Li, Zhou, Liu, Che, Jiang, Zhang, Yu, Zong, Tian and Wang2024):
 \begin{equation*}{\text{SI = Var(}}\frac{{\text{L}}}{{\text{L}}}{\text{, }}\frac{{\text{W}}}{{\text{L}}}{\text{, }}\frac{{\text{H}}}{{\text{L}}}{\text{)}},\end{equation*}
where L is the seed length, W is the seed width, H is the seed height.
Wing loading, defined as seed mass divided by projected area, was calculated as follows (Zong et al., Reference Zong, Liang, Liu, Liu, Baskin, Baskin, Tian, Li, Xin, Luo, Wang, Zhou, Qin and Zhai2023a):
 \begin{equation*}{\text{WL = }}\frac{\text{W}}{{{\text{PA}}}},\end{equation*}
where W is the seed weight, and PA is the seed projected area.
Wind tunnel experiments
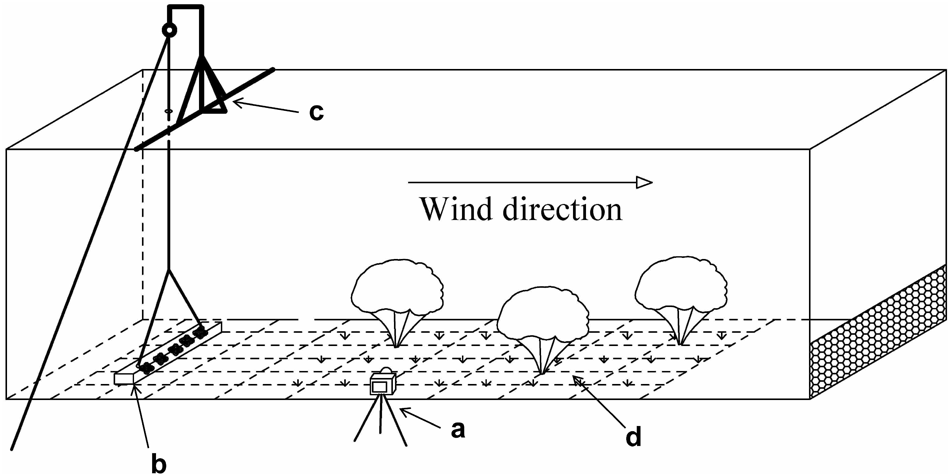
The wind tunnel used in this study was 2 m × 2 m in cross-section and 20 m in length with a 5 m experimental section situated 10 m from the air outlet (Fig. 2; Tian et al., Reference Tian, Liang, Liu, Liu, Phartyal, Zong, Xin, Ba, Li, Liu, Wang, Zhou, Qin and Zhai2023; Zong et al., Reference Zong, Liang, Liu, Liu, Baskin, Tian, Xin, Zhou and Ba2023b). We used a pulley system to control seed release, a camera (DCR-SR100) to record seed movement, and hot-wire anemometers (AirPro Velocity Meter AP500, TSI, USA) to monitor wind velocity (Zong et al., Reference Zong, Liang, Liu, Liu, Baskin, Baskin, Tian, Li, Xin, Luo, Wang, Zhou, Qin and Zhai2023a).
Diagram of the wind tunnel and apparatus used in the experiments. A, camera; b, seed cover; c, pulley system; d, simulated vegetation.

Figure 2 Long description
The diagram shows a wind tunnel setup. A camera is labeled as 'a', positioned to record activities inside the tunnel. A seed cover is marked as 'b', located on the ground. A pulley system, labeled 'c', is mounted above to control seed release. Simulated vegetation is indicated as 'd', placed along the tunnel floor. The wind direction is shown with an arrow pointing from left to right.
We used plastic grasses and shrubs to simulate different steppe vegetation types, including desert steppe, typical steppe and meadow steppe. Top-view photographs combined with Adobe Photoshop were used to quantify vegetation coverage. We used bare ground as control (V0); randomly distributed short grass to simulate sparse low-grass desert steppe (V1); randomly distributed tall-grass to simulate sparse tall-grass desert steppe (V2); randomly distributed short grass and shrub to simulate sparse shrub-grass desert steppe (V3); mixed sparser short and tall-grasses to simulate the typical steppe (V4); and denser short and tall-grasses to simulate the meadow steppe (V5, Table 1).
Simulation of vegetation structures

Table 1 Long description
The table compares different simulated vegetation structures by their composition, plant density, coverage, and height. Bare ground has no vegetation, while meadow steppe has the highest plant density at 101.6 plants per square meter and 80% coverage. Sparse low-grass and high-grass desert steppes both have 20% coverage but differ in plant density and height, with low-grass being denser but shorter. Sparse shrub-grass desert steppe combines short grass and shrubs, maintaining 20% coverage with a mean height of 17 cm. Typical steppe and meadow steppe both reach a height of 60 cm, but meadow steppe has significantly higher plant density and coverage. The data highlights the variation in vegetation structure and density across different steppe types.
Measurement of LWV and DV of seeds
A row of 10 seeds spaced 3 cm apart was placed within each simulated steppe vegetation type. The wind velocity in the tunnel gradually increased from 0 m · s−1. When two seeds began to move or roll, the wind velocity was recorded as LWV. The experiment was repeated five times for each species under the same vegetation conditions.
Another row of 10 seeds, spaced 3 cm apart, was placed at the centre of each simulated vegetation plot. The wind velocity was set to 2, 4, 6, 8, 10 and 12 m · s−1 to measure seed movement velocity. The seeds were shielded by a cover until the wind reached the pre-set velocity. The cover was lifted once the wind reached the predetermined velocity. A camera was placed at the outlet of the wind tunnel to monitor the movement of seeds from a starting point to a finish line (5 m). The measurement was repeated five times for each steppe vegetation type at each wind velocity. Seed DV was calculated based on the recorded video data.
There are three scenarios for calculation for seed velocity: (a) remaining stationary, (b) reaching the finish line and (c) stopping before the finish line. For the first scenario, the DV was 0 m · s−1. For the second scenario, the DV was calculated as follows:
 \begin{equation*}{\text{DV = }}\frac{{\text{L}}}{{\text{T}}},\end{equation*}
where L is the seed movement distance, and T is the movement time of the seed.
For the third scenario, we measured the distance that the seed had moved. By analyzing the videos, we found that the movement time of different seeds ranged from 0.42 to 12 s. We defined the seed velocity as the ratio of the moving distance to the longest movement time (12 s).
Data analysis
The six types of seed appendages and six vegetation structures were each subjected to one-hot encoding, generating a total of 12 binary dummy variables, allowing categorical attributes to be incorporated into subsequent quantitative analyses. Using the descriptive statistics module in Origin 2021, the frequency distributions and percentages for each variable were calculated. A three-factor analysis of variance (ANOVA) model was constructed using its ANOVA tool, with appendage type and vegetation structure as fixed effects and wind speed gradient as a random-effects term. A three-way ANOVA was conducted with appendage type, vegetation structure and wind velocity as fixed effects, using seed DV as the response variable. Tukey’s Honestly Significant Difference (HSD) test was applied to identify statistically significant differences among all pairwise combinations of factor levels (p < 0.01). The K-means clustering algorithm (Python) was utilized to cluster LWVs and seed DVs separately. To determine the optimal number of clusters, the Elbow Method was used to plot the Within-Cluster Sum of Squares (WCSS; based on seed LWVs and DVs) against the number of clusters, where the decrease in WCSS slows down. The number of seed appendages and vegetation types in each cluster was counted, and a heatmap was generated to visualize seed distribution patterns. Based on seed appendage types and vegetation structures, hierarchical cluster analysis was used to cluster the LWVs and seed DVs using Euclidean distance and Ward’s linkage method to examine the effects of seed morphology and vegetation structure on seed dispersal strategies.
Results
Effects of appendage and vegetation on velocities
Seed morphological and aerodynamic indicators of the 12 species (classified as 6 groups according to appendage types) differed significantly (p < 0.01). Most seed indicators within appendage groups showed significant differences (p < 0.01). However, the variation within groups was generally lower than the total variation observed across all groups (Table 2).
Seed morphological and wind dynamic characteristics in 12 selected species (mean ± standard deviation)

Table 2 Long description
The table compares seed morphological and wind dynamic characteristics across 12 species, focusing on appendage type, mass, wing loading, shape index, and terminal velocity. Calligonum klementzii exhibits the highest wing loading, indicating a potential for greater wind resistance, while Cynanchum rostellatum has the lowest mass and wing loading, suggesting minimal wind resistance. Species with balloon appendages, like Oxytropis racemosa, generally have lower terminal velocities compared to those with thorn appendages, such as Calligonum arborescens. Disc-shaped seeds like Ulmus pumila have a higher shape index, indicating a more circular form. The data highlights significant differences in seed dispersal potential based on appendage type and associated characteristics.
Note: Different letters indicate significant differences between vegetation structures (p < 0.05).
The LWV and DV of seeds varied significantly with appendage type and vegetation structure (p < 0.05; Table 3). Seeds with one wing consistently exhibited the highest LWV and the lowest DV across all kinds of steppe vegetation. In contrast, seeds with pappi demonstrated the lowest LWV and the highest DV. Seeds with disc-shaped, four wings, balloons and thorn appendages showed intermediate LWV and DV between seeds with one wing and seeds with pappi. Seeds in lower and sparser vegetation (V0–V3) showed lower LWV and higher DV, but LWV increased markedly, and DV decreased significantly in denser vegetation (V4, V5; p < 0.01, Table 2).
Comparison of lift-off velocity (LWV) and dispersal velocity (DV) of seeds with different appendage types across six vegetation structures (mean ± standard deviation)

Table 3 Long description
The table compares lift-off and dispersal velocities of seeds with different appendage types across six vegetation structures. Seeds with one wing consistently exhibit the highest lift-off velocity, reaching a maximum in meadow steppe. In contrast, pappus seeds generally have the highest dispersal velocity, particularly in bare ground and sparse vegetation. Balloon, disc-shape, and four-wing seeds show moderate lift-off velocities but low dispersal velocities. Thorn seeds have moderate lift-off velocities and low dispersal velocities, except in bare ground where they are higher. The data highlights significant differences in seed dispersal strategies depending on appendage type and vegetation structure.
Notes: Different capital letters (A–F) in parentheses indicate significant differences (p < 0.05) in velocity within the same appendage type across different vegetation structures (V0–V5); different lowercase letters (a–f) indicate significant differences (p < 0.05) among different appendage types within the same vegetation structure. V0, bare ground; V1, sparse low-grass desert steppe; V2, sparse high-grass desert steppe; V3, sparse shrub-grass desert steppe; V4, typical steppe; V5, meadow steppe.
Seed secondary wind dispersal characteristics determined by seed appendage types
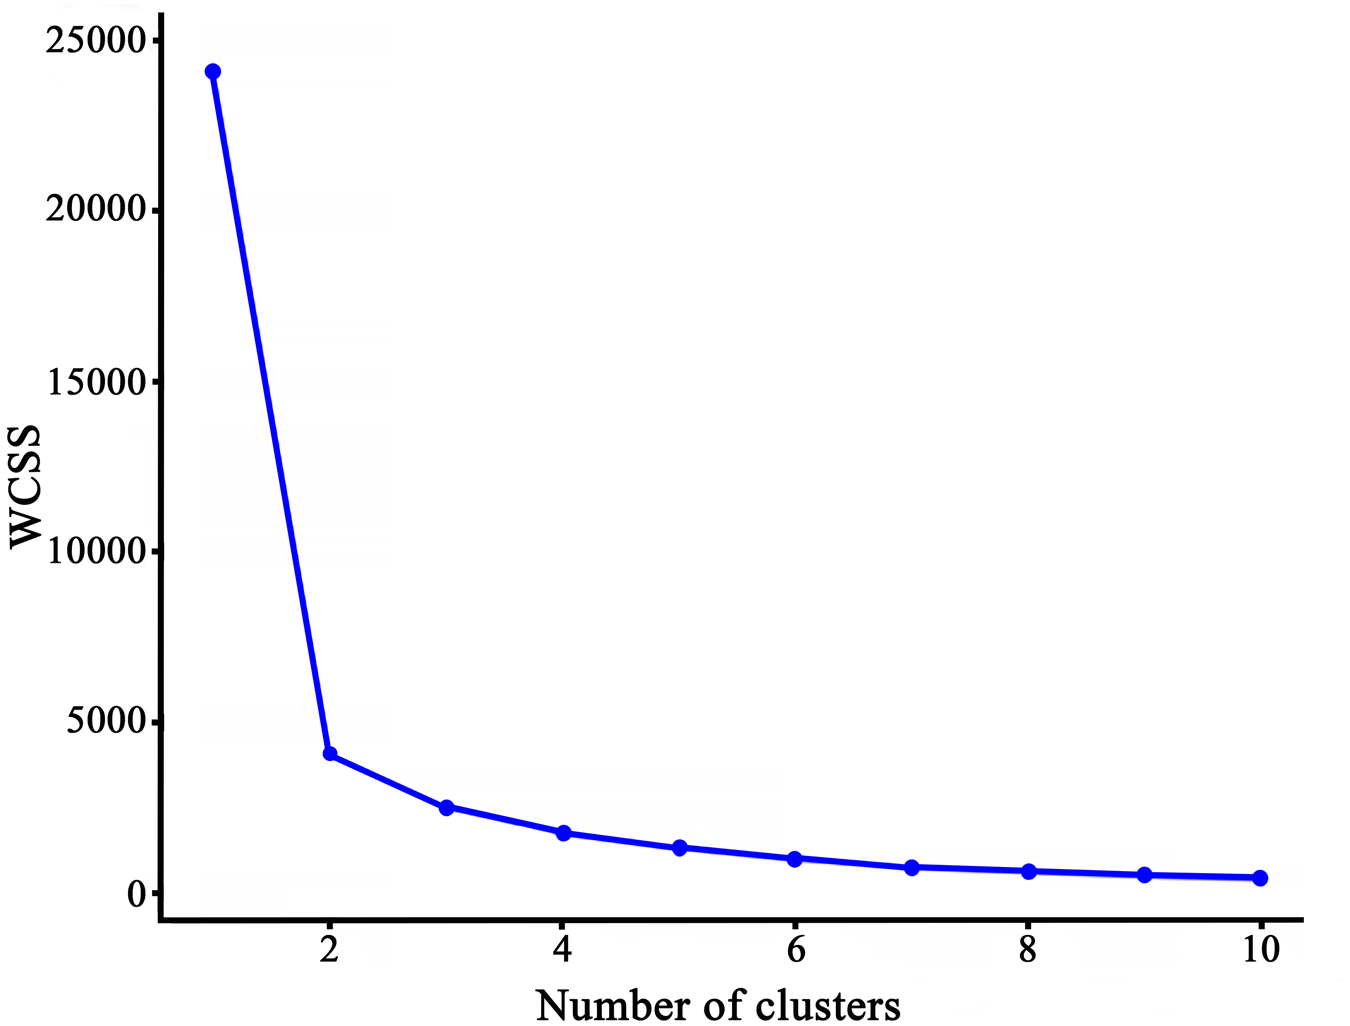
Based on the LWV and DV of seeds, three clusters were considered optimal for classifying the secondary wind-dispersal characteristics of the 12 wind-dispersed species (Fig. 3).
Elbow curve used to determine the optimal number of clusters based on the characteristics of seed secondary wind dispersal.

Figure 3 Long description
A line graph showing the relationship between the number of clusters on the x-axis and the within-cluster sum of squares (WCSS) on the y-axis. The x-axis ranges from 1 to 10 and the y-axis ranges from 0 to 25000. The graph shows a steep decline in WCSS from 1 to 3 clusters, after which the decrease levels off, indicating an elbow point around 3 clusters.
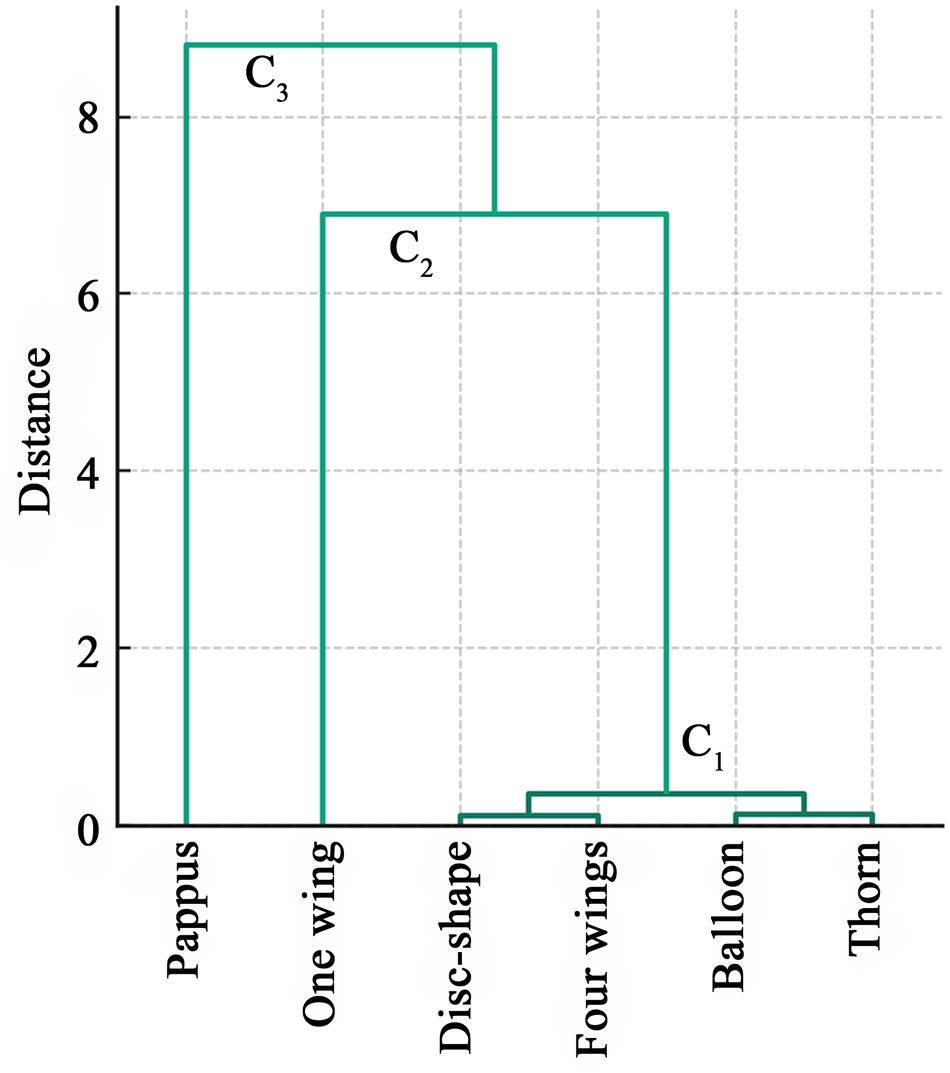
According to the elbow chart and seed LWVs and DVs, seeds with different types of appendages were clustered into three categories. The first category (C1) included seeds with disc-shaped, four-winged, balloon-like and thorn appendages (Euclidean distance < 1, Fig. 4). Their LWVs and DVs of seeds were intermediate between those of seeds with one wing and those with pappus (Table 2). Seeds with one wing were the second category (C2, Euclidean distance > 6 from C1, Fig. 3). They consistently showed the highest LV and the lowest DV (Table 2). Seeds with pappi formed the third category (C3; Euclidean distance of approximately 2 from C2; Fig. 3). They consistently exhibited the lowest LV and the highest DV (Table 2).
Hierarchical clustering dendrogram of seeds with six types of appendages.

Figure 4 Long description
A dendrogram illustrating the hierarchical clustering of seeds with six types of appendages: pappus, one wing, disc-shape, four wings, balloon and thorn. The y-axis is labeled 'Distance' and ranges from 0 to 8. The seeds are grouped into three categories: C subscript 1, C subscript 2 and C subscript 3. C subscript 1 includes disc-shape, four wings, balloon and thorn appendages, showing a low distance. C subscript 2 includes seeds with one wing, showing a higher distance. C subscript 3 includes seeds with pappus, showing the highest distance.
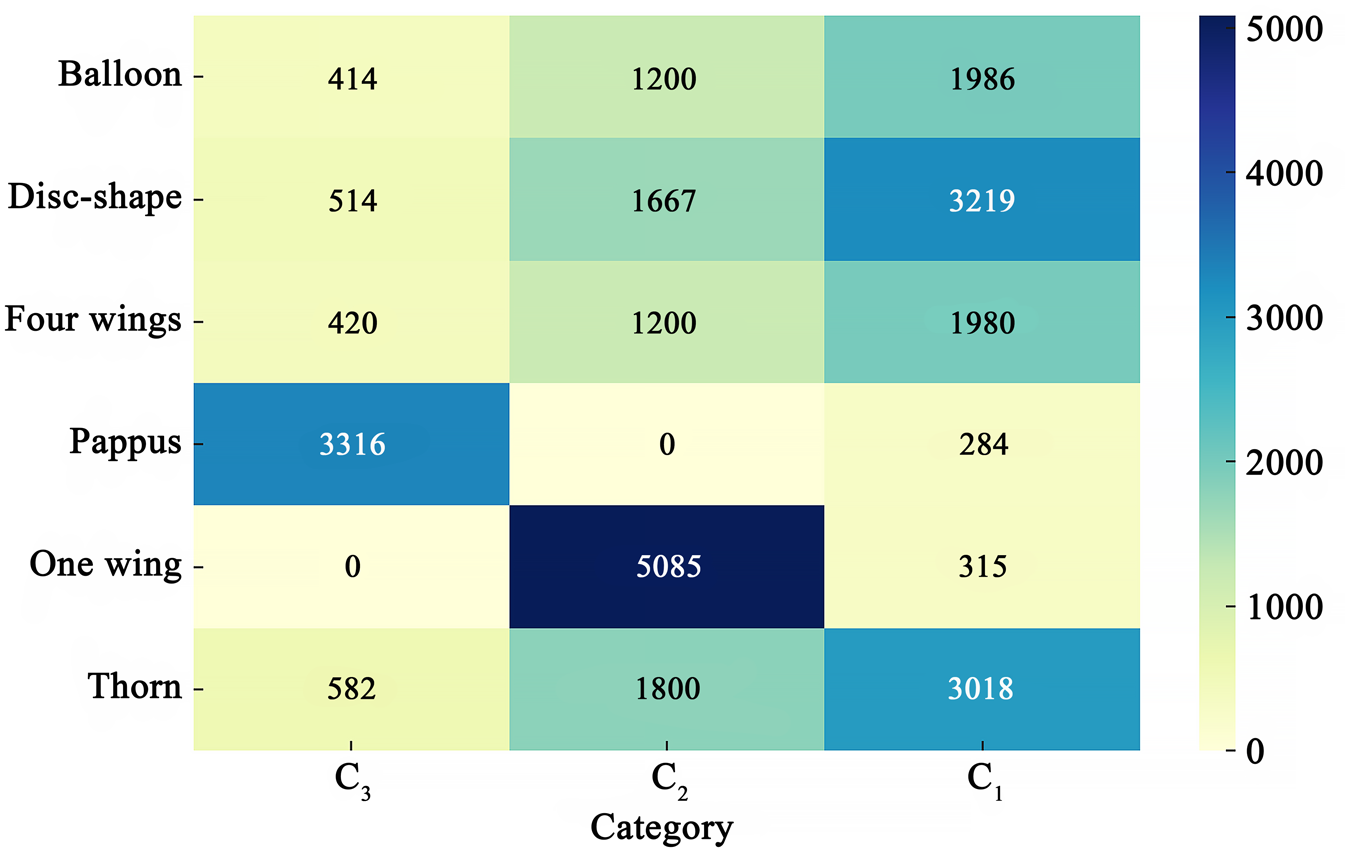
The distribution heat map of seeds with different secondary wind-dispersal characteristics showed that 92% of seeds with pappi were in the third category (C3). Ninety-four percent of the seeds with one wing were in the second category (C2). Seeds with disc-shaped, four wings, balloons and thorns had 59%, 55%, 55% and 56% were in the first category (C1), respectively, and 31%, 33%, 33% and 33% were in the second category (C2), respectively (Fig. 5).
Distribution heat map of seeds with different secondary wind dispersal characteristics.

Figure 5 Long description
A heat map displays the distribution of seeds across three categories (C subscript 3, C subscript 2, C subscript 1) for six dispersal types: Balloon, Disc-shape, Four wings, Pappus, One wing and Thorn. The values for Balloon are 414 in C subscript 3, 1200 in C subscript 2 and 1986 in C subscript 1. Disc-shape shows 514 in C subscript 3, 1667 in C subscript 2 and 3219 in C subscript 1. Four wings have 420 in C subscript 3, 1200 in C subscript 2 and 1980 in C subscript 1. Pappus records 3316 in C subscript 3, 0 in C subscript 2 and 284 in C subscript 1. One wing has 0 in C subscript 3, 5085 in C subscript 2 and 315 in C subscript 1. Thorn shows 582 in C subscript 3, 1800 in C subscript 2 and 3018 in C subscript 1. The color gradient represents values from 0 to 5000.
Effect of vegetation structures on seed secondary wind dispersal characteristics
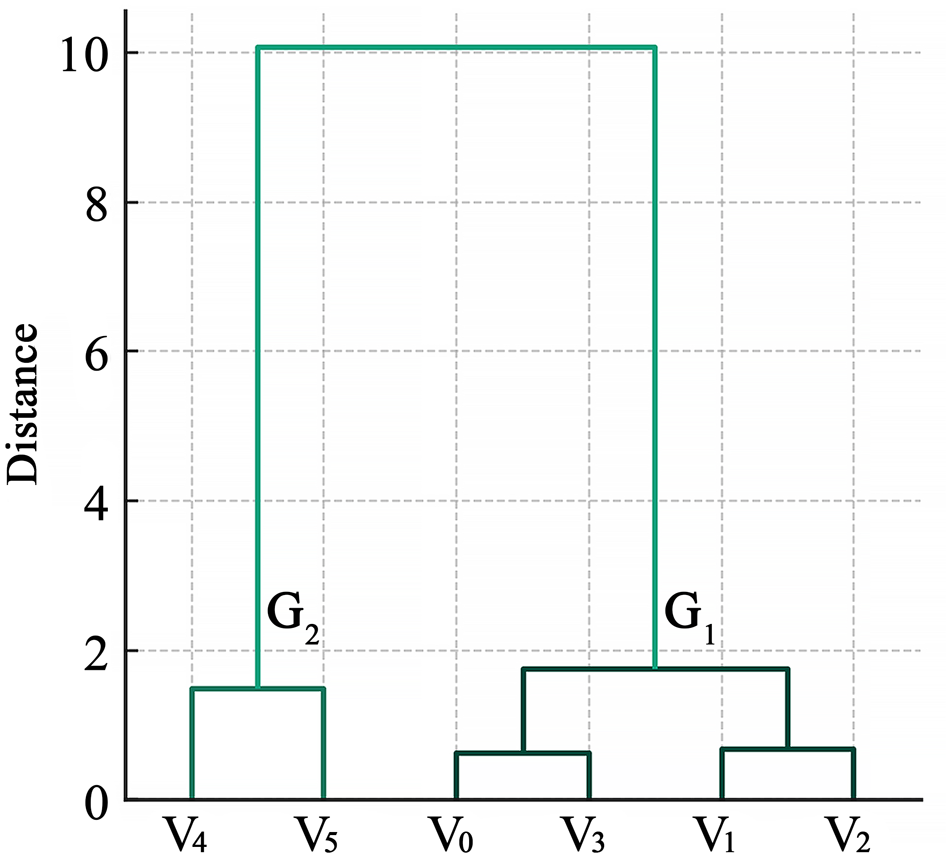
Based on seed LWVs and DVs in different vegetation structures, the six simulated steppe vegetation structures were clustered into two groups. The first group (G1) included four simulated vegetation structures: the bare ground (V0), sparse low-grass desert steppe (V1), sparse high-grass desert steppe (V2), and sparse shrub-grass desert steppe (V3; the Euclidean distance < 2 among these four vegetation types). In the first group, V0 and V3 were clustered into one subgroup, and V1 and V2 into another (Euclidean distance < 1). The second group (G2) included simulated typical steppe (V4) and meadow steppe (V5; Euclidean distance < 2 between these two vegetation types), whereas the Euclidean distance between G1 and G2 exceeded 8 (Fig. 6).
Hierarchical clustering dendrogram of six simulated vegetation structures. V0, bare ground; V1, sparse low-grass desert steppe; V2, sparse high-grass desert steppe; V3, sparse shrub-grass desert steppe; V4, typical steppe; V5, meadow steppe.

Figure 6 Long description
A dendrogram illustrating the hierarchical clustering of six vegetation structures labeled as V subscript 4, V subscript 5, V subscript 0, V subscript 3, V subscript 1 and V subscript 2. The y-axis is labeled 'Distance'. Two main groups are identified: G subscript 2, which includes V subscript 4 and V subscript 5 and G subscript 1, which includes V subscript 0, V subscript 3, V subscript 1 and V subscript 2. The distance between G subscript 1 and G subscript 2 is shown to be greater than 8.
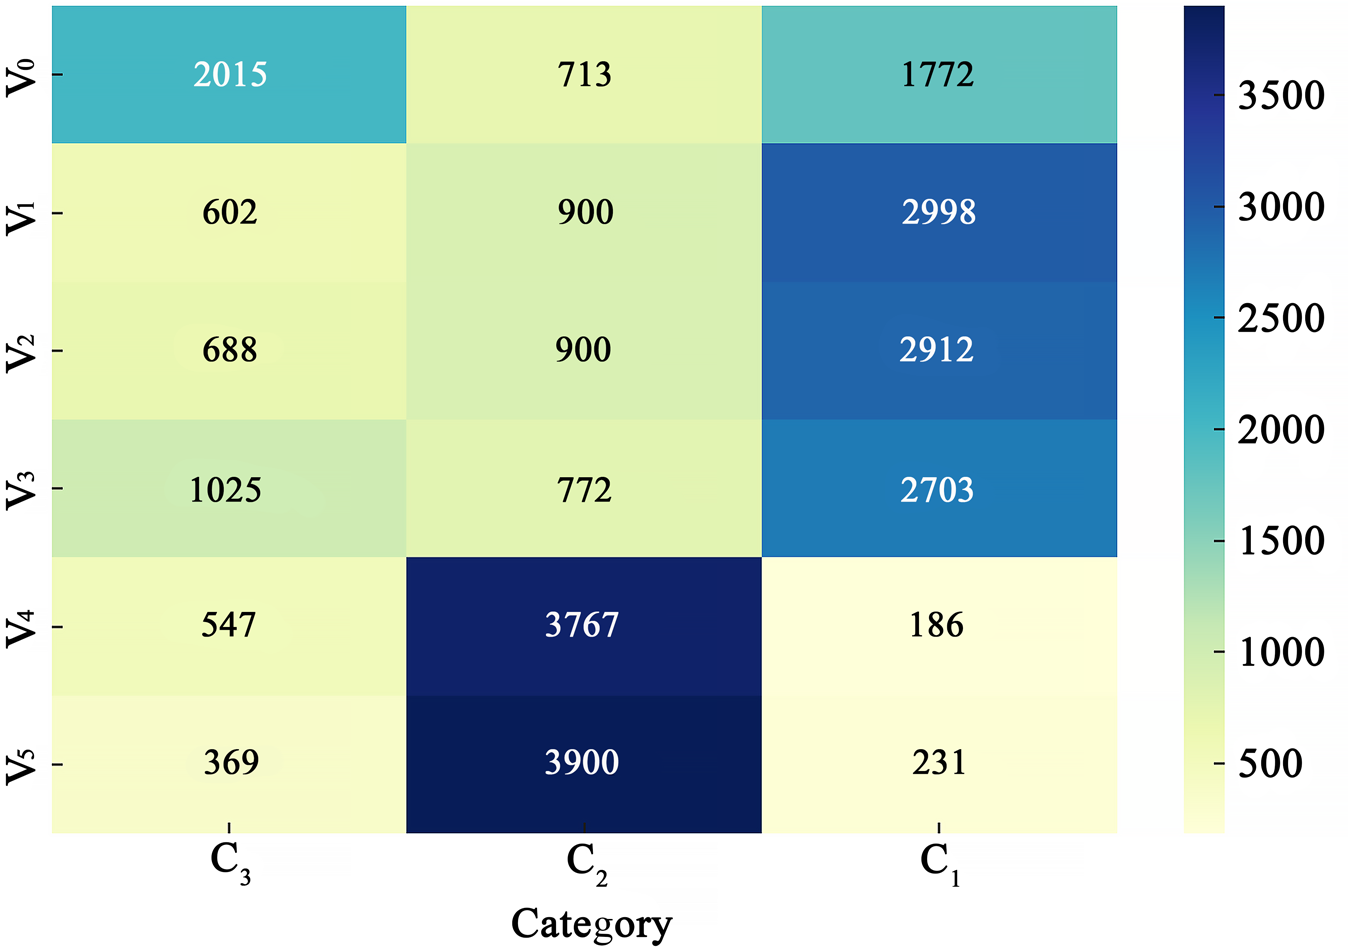
Statistical analysis showed that on bare ground (V0), more than 45% of seeds were C3, and 39% were C1. In the simulated desert steppe of sparse low-grass (V1), sparse high-grass (V2) and sparse shrub-grass (V3) desert steppe (vegetation cover 20%), there were 67%, 64% and 60% of the seeds belonging to C1, respectively. In the simulated typical (V4) and meadow (V5) steppe (vegetation cover > 40%), 83% and 87% of seeds belonged to C2, respectively (Fig. 7). Therefore, seed dispersal characteristics in vegetation structures of the first group (V0, V1, V2 and V3, G1) tended to be in C1 or C3, whereas those in vegetation structures of the second group (V4 and V5, G2) tended to be in C2.
Heat map showing the effects of vegetation structure on the distribution of seeds with different secondary wind dispersal characteristics. V0, bare ground; V1, sparse low-grass desert steppe; V2, sparse high-grass desert steppe; V3, sparse shrub-grass desert steppe; V4, typical steppe; V5, meadow steppe.

Figure 7 Long description
The heat map displays seed distribution across three categories: C subscript 3, C subscript 2 and C subscript 1. The vegetation types are labeled as V subscript 0, V subscript 1, V subscript 2, V subscript 3, V subscript 4 and V subscript 5. Each cell contains numerical values representing the distribution of seeds within each category for the corresponding vegetation type. The color gradient on the right indicates the range of values from 500 to 3500.
Discussion
Secondary wind dispersal strategies of seeds with different appendages
The results show that wind-dispersed seeds with different appendages exhibit distinct wind dispersal strategies. We defined seeds belonging to C1 as adopting an atelechory strategy, in which they lack morphological characteristics that facilitate long-distance secondary wind dispersal. Those belonging to C2 were defined as adopting an antitelechory strategy in which the morphological characteristics of seeds restrict their long-distance secondary wind dispersal. And those belonging to C3 were defined as a telechory strategy in which seeds possess morphological characteristics that facilitate long-distance secondary wind dispersal (Oudtshoorn and Rooyen, Reference Oudtshoorn and Rooyen1999; Ran et al., Reference Ran, G, S, M, Ram, Roni, W and A2002).
Seeds with pappi, adopting telechory strategy, generally have morphological characteristics that promote long-distance movement. Their morphological and aerodynamic features are mostly characterized by a large projected area and low mass, wing loading, density and terminal velocity (Oudtshoorn and Rooyen, Reference Oudtshoorn and Rooyen1999; Soons and Ozinga, Reference Soons and Ozinga2005; Orth et al., Reference Orth, Harwell and Inglis2006; Hua and Tian, Reference Hua and Tian2017; Wei et al., Reference Wei, Zhimin, Minghu, Xuanping, C, M, Zhiming, Zhigang, Zhi and Quanlai2020). These plants are commonly found in the Asteraceae family, such as Taraxacum mongolicum Hand.-Mazz., Sonchus wightianus DC. and Lactuca tatarica (L.) C. A. Mey., and in the Asclepiadaceae family, such as Cynanchum chinense R. Br., Periploca sepium Bunge. and Vincetoxicum pycnostelma Kitag (Andersen, Reference Andersen1993; Orth et al., Reference Orth, Harwell and Inglis2006). Seeds with telechory strategy are easily carried by turbulence into the air, where they remain airborne for extended durations (Tackenberg, Reference Tackenberg2003; Wright et al., Reference Wright, Trakhtenbrot, Bohrer, Detto, Katul, Horvitz, Muller-Landau, Jones and Nathan2008). Under strong wind conditions, these seeds can be dispersed over considerable distances, achieving dispersal distances ranging from 200 m to several kilometres or more (Tian and Han, Reference Tian and Han2018).
Seeds with one wing, adopting an antitelechory strategy exhibit morphological structures (e.g., large mass and small projected area) or are frequently trapped in positions (e.g., being blocked by vegetation) that significantly constrain their long-distance dispersal. Their morphological and aerodynamic characteristics mostly include a small projected area, a large mass and wing loading, high density and high terminal velocity (Zhu and Liu, Reference Zhu and Liu2012; Tian et al., Reference Tian, Liang, Liu, Liu, Phartyal, Zong, Xin, Ba, Li, Liu, Wang, Zhou, Qin and Zhai2023; Li et al., Reference Li, Zhou, Liu, Che, Jiang, Zhang, Yu, Zong, Tian and Wang2024). Alternatively, some seeds have characteristics conducive to wind dispersal, but they are easily trapped by surface structures or blocked by vegetation during secondary dispersal (Pan et al., Reference Pan, Wang, Wang, Zhu, Ren, Huo, Ai and Duan2014; Tian et al., Reference Tian, Liang, Liu, Liu, Phartyal, Zong, Xin, Ba, Li, Liu, Wang, Zhou, Qin and Zhai2023). These seeds are mobilized only by strong winds and predominantly move via saltation, resulting in short dispersal distances (Tian et al., Reference Tian, Liang, Liu, Liu, Phartyal, Zong, Xin, Ba, Li, Liu, Wang, Zhou, Qin and Zhai2023). For example, seeds of Acer nikoense Maxim. (Aceraceae) and Fraxinus chinensis Roxb. (Oleaceae) often accumulate close to near the parent plant (Li et al., Reference Li, Zhou, Liu, Che, Jiang, Zhang, Yu, Zong, Tian and Wang2024).
Seeds with disc-shaped, four-winged, balloon-like and thorny structures, adopting an atelechory strategy, lack morphological structures that promote long-distance dispersal. Most plants that undergo secondary wind dispersal and possess diverse appendage types, including spherical, balloon-like, disc-shaped and winged structures, adopt this strategy (Zhu and Liu, Reference Zhu and Liu2012; Zhou et al., Reference Zhou, Liu, Xin, Daryanto, Wang, Qian, Wang, Liang, Qin, Zhao, Li, Cui and Liu2019, Reference Zhou, Liu, Xin, Daryanto, Wang, Li, Wang, Liang, Qin, Zhao, Li, Cui and Liu2020). Their aerodynamic characteristics, such as projected area, mass, wing loading, density and terminal velocity, are intermediate between those of telechory and antitelechory plants (Li et al., Reference Li, Zhou, Liu, Che, Jiang, Zhang, Yu, Zong, Tian and Wang2024). These seeds are easily dispersed under conditions of high wind speeds and sparse vegetation (Schurr et al., Reference Schurr, Bond, Midgley and Higgins2005; Liang et al., Reference Liang, Liu, Liu, Qin, Xin, Lv, Li, Wang, Su and Zhou2019). Their movement modes are diverse, including creeping, rolling and saltation under different wind speeds (Liang et al., Reference Liang, Liu, Liu, Qin, Xin, Lv, Li, Wang, Su and Zhou2019; Zhou et al., Reference Zhou, Liu, Xin, Daryanto, Wang, Li, Wang, Liang, Qin, Zhao, Li, Cui and Liu2020). Therefore, their dispersal distances are typically intermediate between those of seeds with telechory and antitelechory strategies. These seeds are mostly dispersed away from the parent plant (Oudtshoorn and Rooyen, Reference Oudtshoorn and Rooyen1999; Vittoz and Engler, Reference Vittoz and Engler2007). These seeds are abundant, including those of Calligonum junceum (Fisch. & C. A. Mey.). Litv. (Polygonaceae) and Calligonum caput-medusae Schrenk. (Polygonaceae), Ulmus macrocarpa Hance. (Ulmaceae) and Pugionium cornutum (L.) Gaertn. (Cruciferae) (Zhou et al., Reference Zhou, Liu, Xin, Daryanto, Wang, Li, Wang, Liang, Qin, Zhao, Li, Cui and Liu2020; Tian et al., Reference Tian, Liang, Liu, Liu, Phartyal, Zong, Xin, Ba, Li, Liu, Wang, Zhou, Qin and Zhai2023).
Effect of vegetation structure and seed morphology interaction on secondary wind dispersal strategies
In the first group of vegetation structures (G1: bare ground and desert steppes), with vegetation coverage < 20% and plant density < 12 plant · m−2, seeds tend to adopt telechory or atelechory strategies (Fig. 7). However, in the second group (G2: typical steppes or meadow steppes with vegetation coverage > 40%, plant density > 21 plant · m−2), most seeds shift to antitelechory strategies (Fig. 7). The results indicated that changes in vegetation coverage, height and density alter the aerodynamic properties of the land surface, reshaping the structure of the surface wind field (Ma et al., Reference Ma, Wang, Liu, Wei, Li and Sun2009). The possible reasons are as follows. First, an increase in vegetation coverage, height and density elevated shear stress on vegetation while reducing ground surface shear stress, thereby increasing surface roughness and decreasing near-surface wind velocity (Zhao et al., Reference Zhao, Ma and Chen2007; Ma et al., Reference Ma, Wang, Liu, Wei, Li and Sun2009; Zhi et al., Reference Zhi, Wang, Xiao, Xin and Li2024). Therefore, the LWV required for seed movement increased, and thus seed dispersal strategies tend to shift from telechory to atelechory or antitelechory strategies (Redbotorstensson and Telenius, Reference Redbotorstensson and Telenius1995; Schurr et al., Reference Schurr, Bond, Midgley and Higgins2005; Tian et al., Reference Tian, Liang, Liu, Liu, Phartyal, Zong, Xin, Ba, Li, Liu, Wang, Zhou, Qin and Zhai2023). Second, as vegetation density increases, the probability of seeds being intercepted by vegetation rises, particularly for seeds with appendages, that are large, and that move on the ground. Consequently, rising vegetation density shifts seed dispersal strategies from telechory to atelechory or antitelechory strategies (Tian et al., Reference Tian, Liang, Liu, Liu, Phartyal, Zong, Xin, Ba, Li, Liu, Wang, Zhou, Qin and Zhai2023).
Nevertheless, secondary wind dispersal strategies are determined by the interaction between vegetation structure and seed traits. Seeds with pappi are characterized by low mass, low wing loading, low density and slow terminal velocity (Tian et al., Reference Tian, Liang, Liu, Liu, Phartyal, Zong, Xin, Ba, Li, Liu, Wang, Zhou, Qin and Zhai2023). Vegetation structure, therefore, has relatively limited influence on their LWVs and DVs, enabling them to adopt a telechory strategy under varying vegetation structures. Seeds with this strategy can easily overcome vegetative barriers and reach microhabitats suitable for germination (Oudtshoorn and Rooyen, Reference Oudtshoorn and Rooyen1999). In contrast, seeds with one wing are characterized by a small projected area, high mass, wing loading and terminal velocity (Li et al., Reference Li, Zhou, Liu, Che, Jiang, Zhang, Yu, Zong, Tian and Wang2024). Vegetation structure has a limited effect on their LWVs and DVs, enabling them to mainly adopt an antitelechory strategy under varying vegetation structures. Seeds with this strategy are well-suited to occupying resource-rich, stable habitats near their parent plants to achieve high seed survival rates (Oudtshoorn and Rooyen, Reference Oudtshoorn and Rooyen1999). However, seeds with disc-shaped, four-winged, balloon-like and thorn appendages are characterized by higher mass, wing loading, density and terminal velocity (Li et al., Reference Li, Zhou, Liu, Che, Jiang, Zhang, Yu, Zong, Tian and Wang2024). Their dispersal strategies shift from telechory or atelechory to antitelechory strategies depending on vegetation structures. On bare ground, most seeds employ telechory or atelechory. In desert steppe, most seeds adopt atelechory, while a small proportion adopt antitelechory. In typical and meadow steppes, most seeds adopt antitelechory, with only a minority adopting atelechory. Seeds with this strategy are an adaptation to highly heterogeneous habitats (e.g., deserts and steppes), enabling them to quickly escape adverse conditions and reach microhabitats suitable for germination (Oudtshoorn and Rooyen, Reference Oudtshoorn and Rooyen1999).
This study includes some limitations on the experimental setup. First, when using plastic plants to simulate real plants, there are differences in material texture, morphological structure, and the effects of reducing wind speed and intercepting seeds compared to real plants. Second, the density, height and plant distribution pattern of the simulated vegetation differ from those of real vegetation structures. Third, the artificially simulated ground surface differs from the soil structure and texture of the natural ground surface, affecting seed DVs and LWVs. Fourth, the small number of species per appendage type limits the generalizability of our conclusions across each appendage category. Finally, wind velocities in wind tunnels are relatively stable and continuous, whereas natural winds often consist of intermittent gusts with large fluctuations. These differences between artificial simulation environments and natural environments may influence wind field, seed lift-off and movement characteristics and seed entrapment rates.
Conclusions
Seed secondary wind dispersal strategies are jointly determined by the interaction between vegetation structure and seed morphology. Light pappi-bearing seeds with low mass, low wing loading, low density and slow terminal velocity are less affected by vegetation obstruction and often adopt telechory across all vegetation types. One-wing-bearing seeds with small projected area, high mass, wing loading and terminal velocity are less affected by vegetation type and mostly adopt an antitelechory strategy. Seeds with disc-shaped, four-winged, balloon-like and thorn appendages characterized by higher mass, wing loading, density and terminal velocity adapt to heterogeneous vegetation types and adopt a shift from telechory, atelechory or antitelechory strategies. In sparse vegetation types, they mostly adopt telechory or atelechory strategies, whereas in dense vegetation types, they adopt antitelechory or atelechory strategies. Clarifying these strategies is critical to understanding plant adaptive responses to environmental conditions and the ecological mechanisms that underlie biodiversity maintenance.
Acknowledgements
We thank the Experimental Center of Desert Forestry, the Chinese Academy of Forestry and the First Forestry Station for providing accommodation during the experiment. We are grateful to Wulanaodu Desertification Combating Ecological Research Station, Institute of Applied Ecology, Chinese Academy of Sciences for providing the experimental and relevant supports.
Funding statement
This study was supported by Inner Mongolia Academy of Forestry Sciences Open Research Project (KF2024ZD03), National Natural Science Foundation of China (31971732 and 32471970), Inner Mongolia Academician Workstation for Protective Forest Program and Desertification Control, and Liaoning Province Science and Technology Funds (2023JH2/101700357), Special Fund Project for Talent Work (14110025131T200000155).
Competing interest
The authors declare that they have no known competing financial interests or personal relationships that could have appeared to influence the work reported in this paper.




 Open access

