

Introduction
Health technology assessments (HTA) provide a comprehensive framework for integrating evidence of economic, social, and health consequences into decision-making (Reference Drummond, Sculpher, Claxton, Stoddart and Torrance1). Globally, healthcare systems increasingly rely on HTA to guide resource allocation (Reference Fontrier, Visintin and Kanavos2–4). In HTA, cost-effectiveness analysis (CEA) of new health technologies using quality-adjusted life years (QALYs) as the health effects measure is the most recommended form of economic evaluation (Reference Fontrier, Visintin and Kanavos2;Reference Sharma, Aggarwal, Downey and Prinja5). However, estimating QALYs is technically challenging as it requires measuring and valuing patients’ health-related quality of life (HRQoL). Consequently, analysts often rely on HRQoL and health-state utility (HSU, valuation of HRQoL) data from the literature, which can be limited in both quantity and quality.
HSU data can be estimated directly by describing a specific health condition using vignettes and capturing preferences through elicitation methods such as the time trade-off (TTO) and discrete choice experiments (DCE). However, the indirect method of using standardized preference-weighted HRQoL instruments, or multi-attribute utility instruments (MAUIs) such as EQ-5D to obtain HSU data is more commonly used (6). In recent years, there has been significant progress in developing new methods and instruments for measuring and valuing HRQoL. For example, there is an increasing application of DCE in the valuation of HRQoL (Reference Wang, Rowen, Brazier and Jiang7). Since DCE can be used in self-administered online surveys, it significantly lowers costs and shortens data collection timelines compared to traditional preference elicitation methods, which entail interviewer administration. Consequently, it has enabled more MAUIs to be developed, including disease-specific instruments such as the QLU-C10D and FACT-8D (Reference King, Revicki and Norman8–Reference Xu, Wong and Luo10). Other examples include “bolt-on” research to enhance existing EQ-5D instruments (Reference Wang, Chong, Tan and Luo11;Reference Kangwanrattanakul and Phimarn12) and the EQ-HWB instrument to broaden the ‘Q’ in QALY to cover both health and well-being (Reference Brazier, Peasgood and Mukuria13). A bolt-on dimension refers to a supplementary item, or set of items, capturing specific aspects of health-related quality of life that may not be adequately represented by the original five dimensions of the EQ-5D instrument (14). Despite their attractive features, these new methods and instruments also have disadvantages. For instance, DCE and widely used traditional preference elicitation methods, such as TTO, have been shown to have poor agreement (Reference Shiroiwa, Murata, Morii, Hoshino and Fukuda15;Reference Augustovski, Belizán and Gibbons16). Additionally, the primary challenge of DCEs arises during the analysis, as it requires careful assessment of whether respondents have completed the tasks appropriately. The use and testing of newer instruments may not be extensive, resulting in a lack of psychometric evidence and utility weights to inform decision-making. Given the wide range of methods and instruments available, and the proliferation of new ones, it remains unclear how existing instruments and methods are being used, and whether or when the new ones will be adopted by HTA practitioners for routine use.
HTA agencies or bodies (hereafter referred to as ‘HTA agencies’ for simplicity) are authoritative entities or divisions responsible for HTA evidence assessment and/or appraisal of health technologies. Although their size, capacity, and mandate vary, HTA agencies play a pivotal role in using HTA evidence to inform healthcare decisions. Moreover, because of their authority, HTA agencies’ practices and views on evidence generation methods significantly influence practice and therefore, are highly valuable to researchers. One source of information for understanding HTA agencies’ views and preferences is the methods guide they publish (17). However, this approach is suboptimal, particularly if the interest concerns HRQoL measurement and valuation methods. First, published methods guides may become outdated as practices and views continuously evolve, yet these guides are not updated frequently. Second, the guides for certain methodological aspects may be ambiguous or missing. Third, some recommendations in methods guides may not reflect unanimous opinions within HTA agencies. Last but not least, the absence of published methods guides by many HTA agencies limits their use as a resource for understanding these agencies’ practices.
An alternative way to understand HTA agencies’ views and preferences regarding HRQoL measurement and valuation is to survey HTA agency personnel responsible for preparing or reviewing HTA dossiers. This approach offers the advantage of obtaining first-hand, contemporary, and detailed information, which could be very useful for HRQoL researchers to set their priorities. However, to the best of our knowledge, such an approach has not been explored before. Our primary objective was to understand HTA practitioners’ views on and needs for HRQoL-related methods and instruments. Our secondary objective was to understand their current practices and views on the availability and quality of HRQoL data and research priorities.
Methods
We conducted a cross-sectional online survey of HTA agency personnel from April 2023 to January 2024. In order to achieve broad geographic coverage of this hard-to-reach population, we used purposive sampling and invited survey respondents through the professional networks of the diverse international study team. The study received ethics approval from the Institutional Review Board of National University of Singapore (IRB number: NUS-IRB-2022–426).
Sampling and recruitment design
We employed a two-stage recruitment procedure. In the first stage, we identified target HTA agencies, defined as independent organizations or governmental divisions authorized to generate and/or review HTA evidence for market access or reimbursement decisions at the health system level. We targeted surveying HTA agencies in fifty countries. We used the search strategy adopted by Kennedy-Martin et al., who identified forty-six countries with existing HTA agencies in 2019 (Reference Kennedy-Martin, Slaap and Herdman18). We complemented this strategy with other sources, including the Gear4Health database (19), ISPOR’s Pharmacoeconomic Guidelines Around the World database (17), the WHO Health Technology Assessment and Health Benefit Package Survey 2020/2021 webpage (4), the INAHTA Members List (20), and consulted with EuroQol Group members and colleagues for additional input.
In the second stage, we identified members of the EuroQol Group or their acquaintances as recruiters for the countries we intended to survey. Recruiters sent invitations with country-specific survey links to potential respondents working in the target HTA agencies. Alternatively, they identified a contact person within each HTA agency to extend the survey invitations internally. A survey administrator monitored survey yields and prompted recruiters and/or contact persons to send reminders to potential respondents weekly for at least three consecutive weeks after the survey commenced in each country.
Participants
Rather than surveying official representatives of the target agencies, we sought to recruit all personnel involved in handling CUA or HRQoL evidence, specifically, individuals responsible for reviewing, generating, and/or using QALY-based evidence. Additionally, those involved in HTA-related work but not directly handling QALY-related tasks were also invited to participate if interested.
The inclusion criteria for the survey were: 1) being an employee of an HTA agency (e.g., governmental or public agency, division, body, or committee) whose agency responsibilities included evaluating or appraising health technologies for the purpose of listing/delisting, reimbursement, or pricing/repricing at the national level, or being a contracted professional, consultant, or advisor to such HTA organization(s); 2) being able to understand the English survey form and complete open-ended questions in their language of choice; and 3) providing informed consent.
Survey form
After obtaining consent, participants were invited to complete an electronic survey form powered by Qualtrics anonymously at their convenience. The survey form was developed by the study team, aiming to create a short survey that can be self-completed by most respondents in no more than 20 minutes. An iterative question drafting procedure was used, with multiple rounds of pilot-testing conducted with personnel from HTA agencies in Singapore, Indonesia, Canada, England, Norway, Australia, New Zealand, Colombia, and Argentina until the development goal was achieved.
The final survey started off with screening questions followed by a consent-taking question. Eligible and consenting participants were invited to complete six sections of questions revolving around their experience with and opinions on Utility Instruments, Elicitation Methods, Data Source, Data Quality and Appropriateness, and Research Topics of Importance. Further information on the survey form can be found in the Supplementary Material.
We used a four-point Likert-type response scale to assess frequency in Sections One to Four (“never”/ “not sure,” “occasionally,” “often,” and “very often”). In Sections One to Five, text fields were provided for respondents to explain their responses and elaborate on other methods, instruments, concerns, or research topics not covered in the survey.
Statistical analysis
Descriptive analyses were performed for responses to closed-ended survey questions. For Likert-type questions in Sections One to Four, we first used the mode (or median if no or multiple modes were present) as the summary of the responses for each country, and then used the median of relevant country summaries as the summary of the responses for six regions (Commonwealth – Australia/Canada/New Zealand/United Kingdom, Western Europe, Central/Eastern Europe, Asia, Latin America, and Middle East/Africa).
To analyze the nominated research priorities in Section Five, we calculated a country-specific importance score for each research topic by averaging the scores from all respondents in the relevant country. Once the importance scores for all countries were available, a regional score was calculated by averaging scores from relevant countries in the region and a global score was calculated by averaging the regional scores. More information on how respondent-level scores were assigned is provided in the Supplementary Material.
All statistical analysis was performed using STATA v14 (StataCorp, College Station, TX, USA). All qualitative responses to the open-ended questions were collated and systematically reviewed. Non-English responses were translated using a forward-backward approach. We then undertook a structured content analysis, involving iterative coding and categorization of the data, to identify recurrent themes, underlying concepts, and salient patterns across respondents. This analytic approach facilitated a deeper understanding of the key issues raised by participants and allowed us to synthesize their viewpoints into coherent thematic domains (Reference Curry, Nembhard and Bradley21).
Results
Sample characteristics
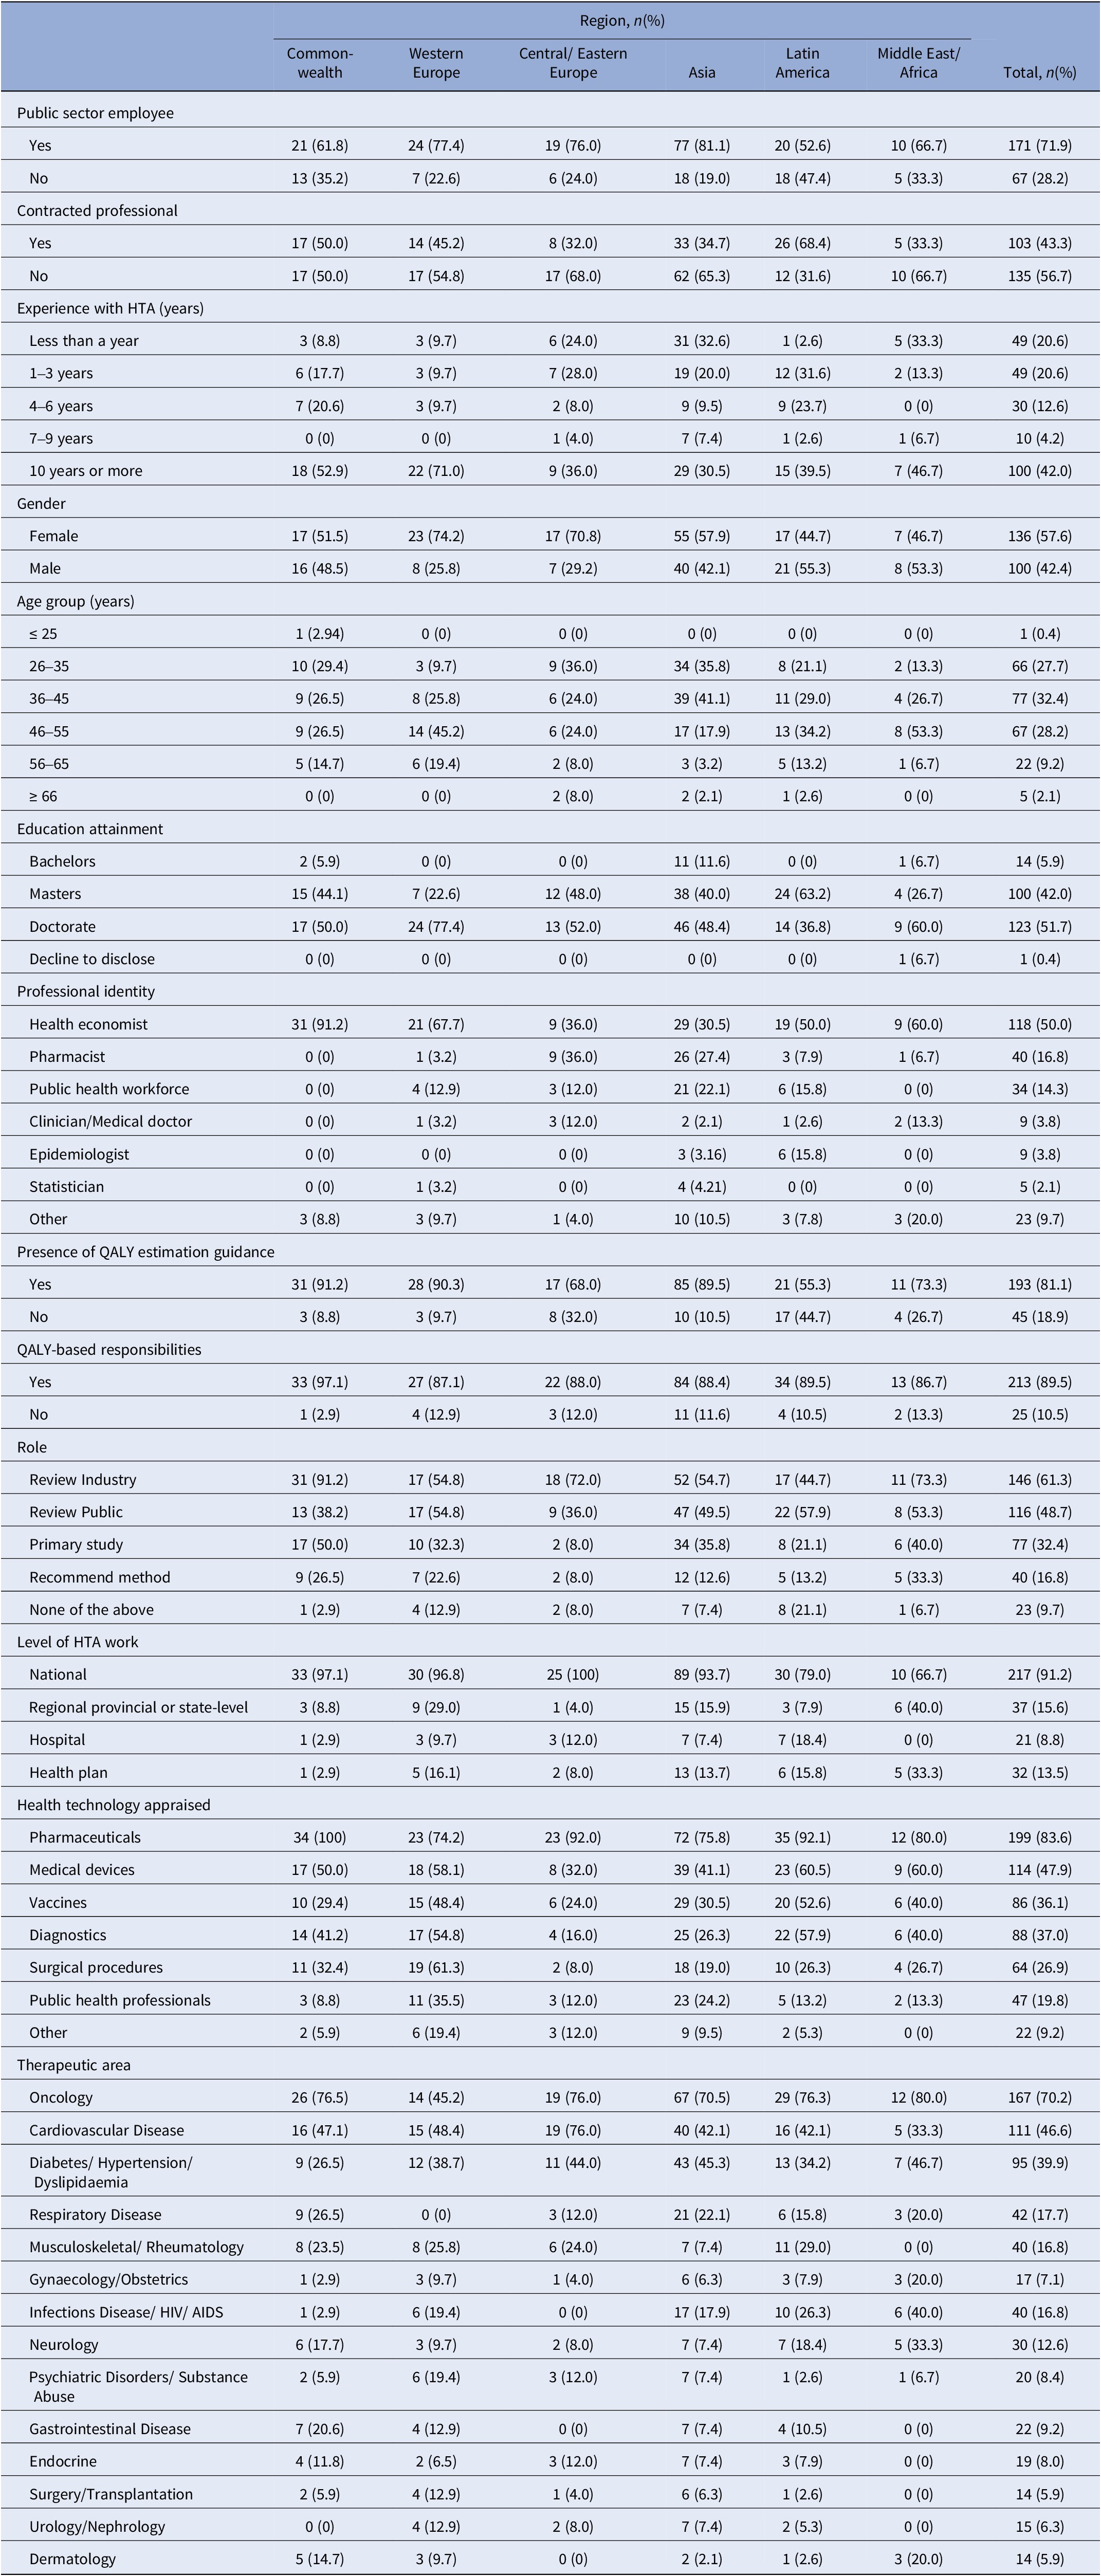
Of the sixty countries enlisted and approached, the survey was distributed in forty-nine countries. The remaining eleven countries were excluded for various reasons, including non-responsiveness (N = 2), infancy of HTA (N = 2), or the non-use of CUA (N = 3), declination/technical difficulty (N = 2), or political turmoil (N = 2). In forty-five of these countries, we received at least one completed survey (median: 4; interquartile range: 2 to 6), while in the remaining four countries, there were zero responses despite multiple follow-ups. Supplementary Table 1 outlines the distribution of responses and reasons for non-responses from the eleven countries approached. In total, 238 individuals in 45 countries and 65 HTA agencies completed and submitted the survey (Table 1 and Supplementary Table 1). Overall, the majority of the responses came from public sector employees (71.9 percent) and had at least four years of experience in HTA work (58.8 percent). Additionally, 81.1 percent of the respondents reported the presence of QALY estimation guidance in their work setting, and 89.5 percent were involved in QALY-related work responsibilities. More than half (61.3 percent) reviewed QALY-based cost-effectiveness evidence submitted by industry or contractors, and 91.2 percent performed HTA work at the national level. Of the 238 respondents surveyed, 25 did not have work responsibilities related to reviewing, generating, and/or using QALY-based cost-effectiveness evidence. These respondents mainly came from Vietnam (N = 10), Slovenia (N = 3), Austria (N = 2), Colombia (N = 2), and South Africa (N = 2).
Characteristics of respondents (N = 238)

Note: Government employee: In terms of employment type, the respondent is an employee of a governmental or public agency, division, body, or committee whose responsibilities include evaluation or appraisal of health technologies for the purpose of listing/delisting, reimbursement, or pricing/repricing at the national level; Contracted professional: The respondent is a contracted professional, consultant, or advisor of the above-mentioned HTA organisation(s); QALY-based Responsibilities: The respondents’ responsibilities in the above work include reviewing, generating, and/or using QALY-based cost-effectiveness evidence; Role: Review Industry: I review QALY-based cost-effectiveness evidence submitted by industry or contractors; Review Public: I review publicly available QALY-based cost-effectiveness evidence; Primary study: I conduct primary studies to generate QALY-based cost-effectiveness evidence; Recommend method: I develop or recommend methods for generating QALY-based cost-effectiveness evidence; I do none of the above. One person from the Commonwealth and Central/ Eastern Europe each did not disclose their gender; Health technology appraised: Public health professionals refer to appraisals in which workforce capacity or staffing models constituted the object of comparison.
Total number of responses from each region and country: Asia = 95 (China:4, India:5, Indonesia:6, Japan:3, Malaysia:9, Philippines:3, Singapore:15, South Korea:16, Taiwan:11, Thailand:5, Vietnam:18), Central/Eastern Europe = 25 (Bulgaria:6, Croatia:1, Czech Republic:1, Estonia:1, Hungary:5, Latvia:1, Poland:3, Romania:1, Slovenia:6), Western Europe = 31 (Austria:3, Denmark:4, Italy:2, Netherlands:6, Portugal:6, Spain:7, Sweden:3), Latin America = 38 (Argentina:2, Brazil:10, Chile:3, Colombia:12, Ecuador:6, Mexico:3, Peru:2), Middle East/ Africa = 15 (Egypt:2, Saudi Arabia:1, South Africa:5, Tunisia:3, UAE:4), Commonwealth = 34 (Australia:7, Canada:4, England:17, New Zealand:4, Scotland:1, Wales:1).
Use and importance of utility instruments
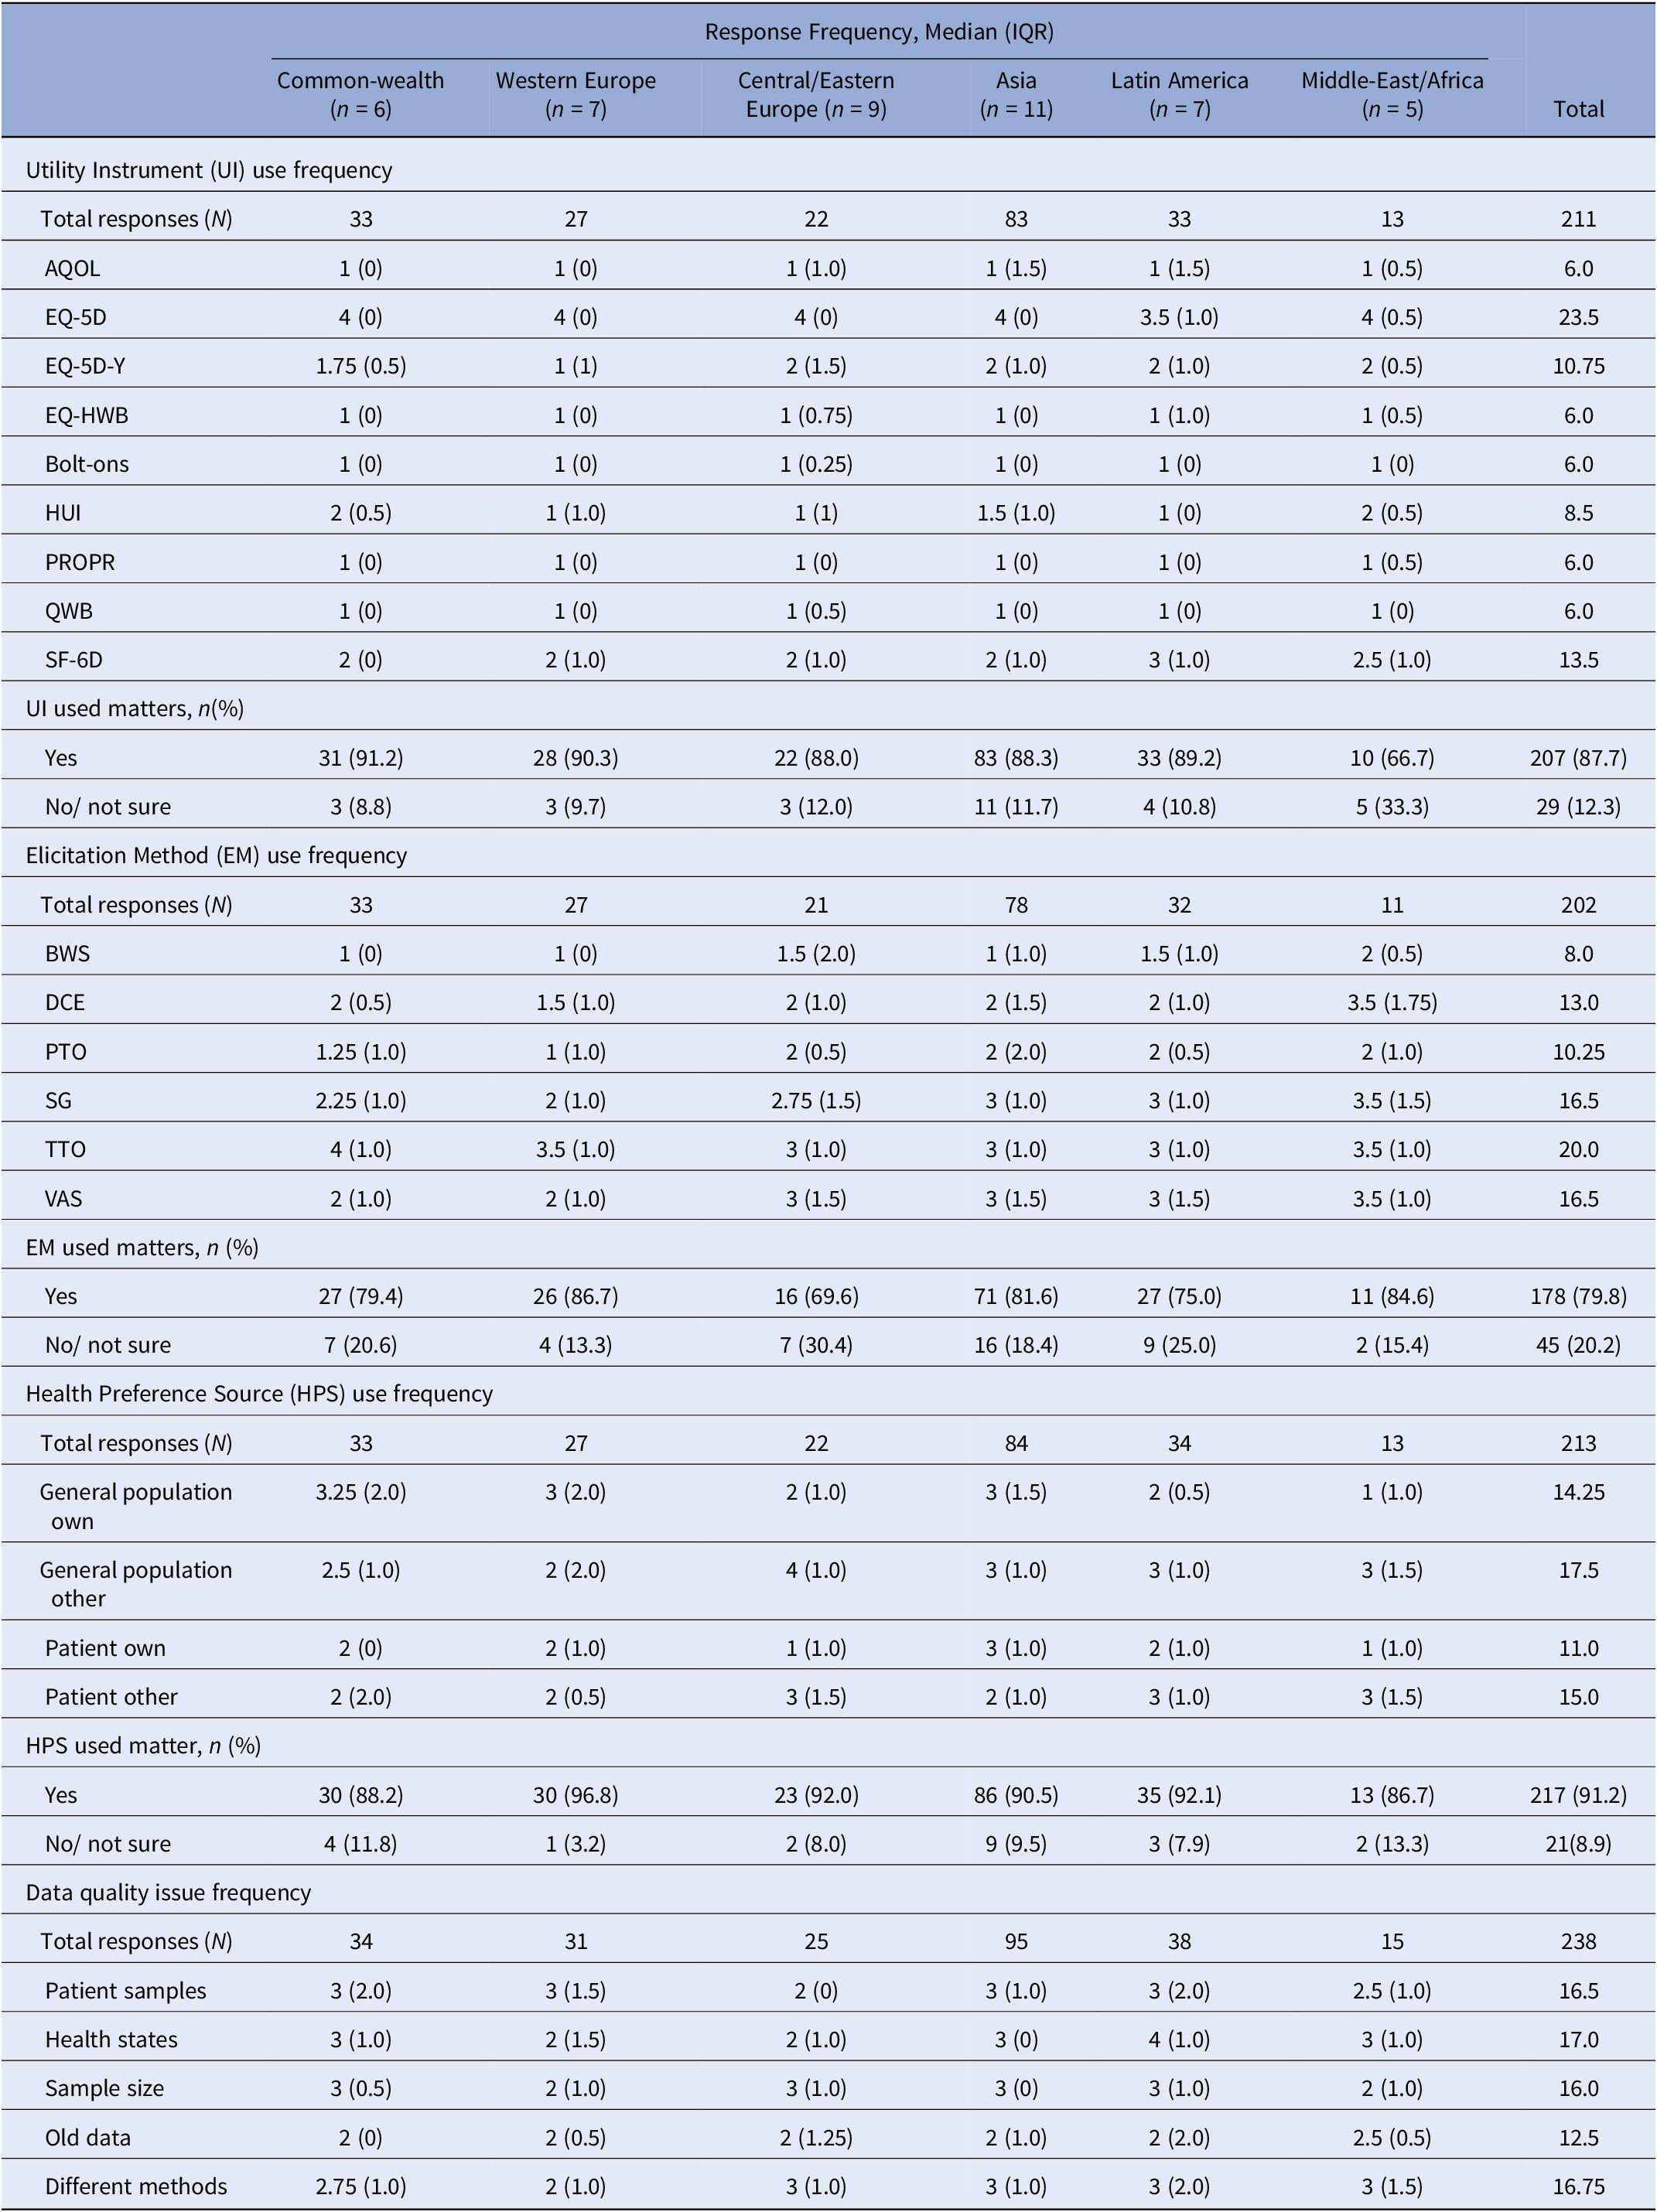
Overall, the top three most frequently used utility instruments by HTA practitioners involved with QALY-related work (n = 213) were the EQ-5D (“very often”), SF-6D (“occasionally”), and EQ-5D-Y (“occasionally”) (Table 2). Other instruments respondents have come across during their HTA-related work are listed in Supplementary Table 2. Regionally, the use frequency trend was consistent with a few exceptions. In Western Europe, the use frequency for the EQ-5D-Y was “never,” while in Latin America, it was “often” for SF-6D (Supplementary Table 3).
Median (IQR) responses by region

Abbreviations: Responses: 1: Never/not sure; 2: Occasionally; 3: Often; 4: Very often; Elicitation Methods: BWS: best-worst scaling; DCE: discrete choice experiment; PTO: person trade-off; SG: standard gamble; TTO: time trade-off; VAS: visual analogue scale; Health preference source: Refers to general population/ patients of one’s own country or other country; Data quality issue: Patient samples: The patient samples from which HRQoL/utility data was collected were inappropriate (e.g. poor representativeness); Health states: The health states (e.g. the vignettes) for which utility data was available do not match the health states in the CEA model; Sample size: The population samples from which HRQoL/utility data was collected were too small; Old data: The HRQoL/utility data was too old; Different methods: The utility values of different health states used in the same model were derived using different methods/instruments.
Countries in each region: Asia (China, India, Indonesia, Japan, Malaysia, Philippines, Singapore, South Korea, Taiwan, Thailand, Vietnam), Central/Eastern Europe (Bulgaria, Croatia, Czech Republic, Estonia, Hungary, Latvia, Poland, Romania, Slovenia), Western Europe (Austria, Denmark, Italy, Netherlands, Portugal, Spain, Sweden), Latin America (Argentina, Brazil, Chile Colombia, Ecuador, Mexico, Peru), Middle East/ Africa (Egypt, Saudi Arabia, South Africa, Tunisia, UAE), Commonwealth (Australia, Canada, England, New Zealand, Scotland, Wales).
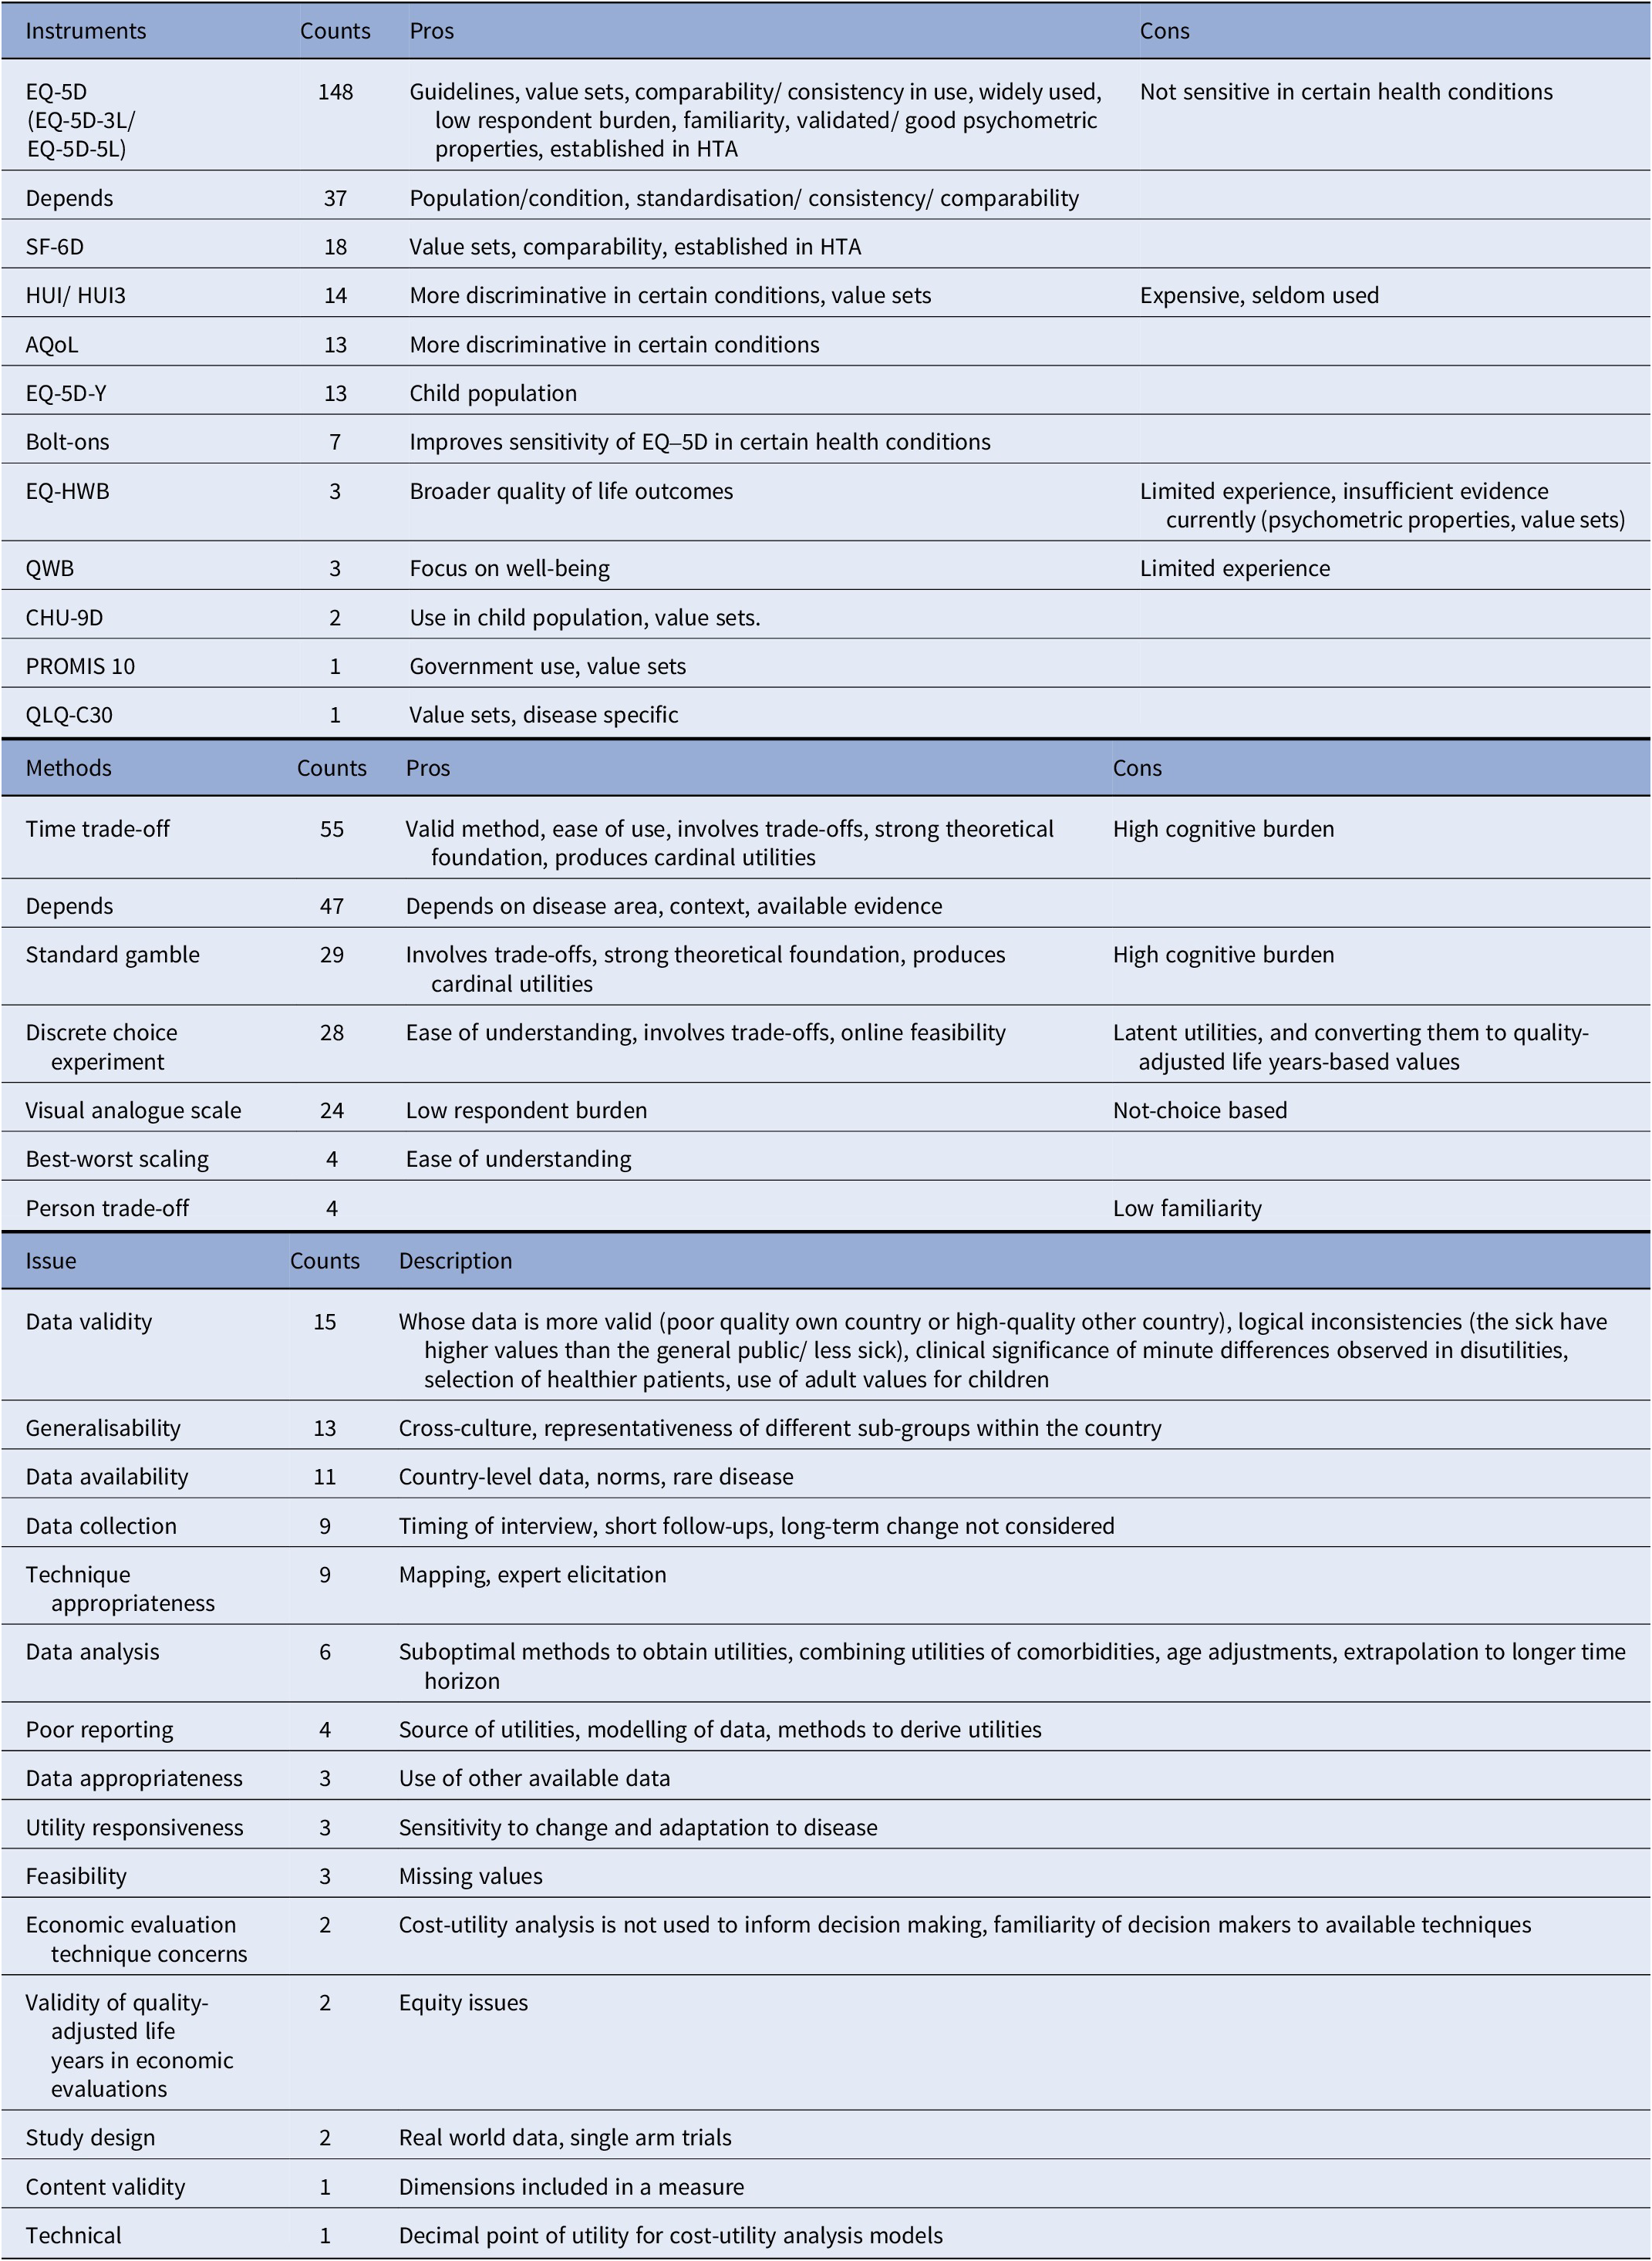
Respondents across the regions (Table 3) generally agreed that the choice of utility instrument matters (87.7 percent), ranging from 66.7 percent (Middle East/ Africa) to 91.2 percent (Western Europe). Content analysis revealed that the EQ-5D (EQ-5D-3L/ EQ-5D-5L) instrument was most often selected as the more fit-for-purpose instrument (Table 3) mainly due to its low respondent burden, good psychometric properties, availability of value sets, HTA guide recommendations, and its wide usage that promotes comparability and consistency in the HTA setting.
More fit-for-purpose tool and their pros and cons and data source issues encountered

Use and importance of preference elicitation methods
The top three most frequently used utility elicitation methods were TTO, VAS, and SG, all of which were “often” used (Table 2). Across regions, the TTO was either “often” or “very often” used to inform decision-making. SG and VAS were only “occasionally” used in Western Europe and the Commonwealth. DCE was “occasionally” used in most regions, but its frequency ranged from “often” and “very often” in the Middle East/Africa. The use frequency of BWS and PTO ranged between “never” and “occasionally” in all regions (Supplementary Table 4).
Respondents across the regions generally agreed that the choice of elicitation method matters (79.8 percent), ranging from 69.6 percent (East and Central Europe) to 86.7 percent (Western Europe). A total of fifty-five respondents mentioned the TTO method as the more fit-for-purpose elicitation method (Table 3). Common reasons (Table 3) included that the TTO had a strong theoretical foundation, involved trade-offs, produced cardinal utilities, was a validated method, and was easy to use. However, the high cognitive burden of the method was often recognized as a limitation of the technique. Many respondents (n = 47) mentioned that the elicitation method would need to depend on the disease area, the context of the study, and the availability of evidence.
Use and importance of health preference data sources
The general public of another country was more frequently used (“often”) than the preferences of the local public (“occasionally”) (Table 2). Region-wise, in Western Europe and the Commonwealth countries, the general population of one’s own country was most frequently used (“often”). In Asia, the general public (own and other countries) and patients (own country) had parallel high usage (“often”). In Latin America, the Middle East/Africa, and Central/Eastern Europe, data of other countries (both general population and patient values) were “often” or “very often” used while the values of one’s own country were only “occasionally” or even “never” utilized (Supplementary Table 5).
Respondents across the regions had a strong consensus that the health preference data source matters (91.2 percent), ranging from 86.7 percent (Middle East/Africa) to 96.8 percent (Western Europe). Of the 144 qualitative responses received, 81 respondents mentioned that the general public’s preferences should determine the utility values. Commonly cited reasons include HTA/country guide’s recommendations, consistency reasons, taxpayers being the most appropriate in a publicly funded healthcare system, and the tendency of patients to adapt to disease, thereby underestimating the disutilities. Conversely, fifty-three respondents felt that patients’ preferences should determine the values, as they reflect the patient voice and capture the disease experience better. Ten people felt it should come from both, either combining both preferences or using them to address different research questions. A total of seventy-nine respondents mentioned that these preferences should come from one’s own country population, as they reflect the culture and context of the preferences more accurately. None explicitly preferred utility values from other countries over their own.
Use of data with quality concerns
Data quality issues that were “often” encountered across regions included poor sample representativeness, small sample size, poor matching of available data with that needed for CEA models, and data used in the same CEA model generated from multiple elicitation methods/utility instruments (Table 2). These concerns were generally shared across regions. The issue with using outdated data was less of a concern, with most regions reporting it only “occasionally” (Supplementary Table 6).
Research priorities
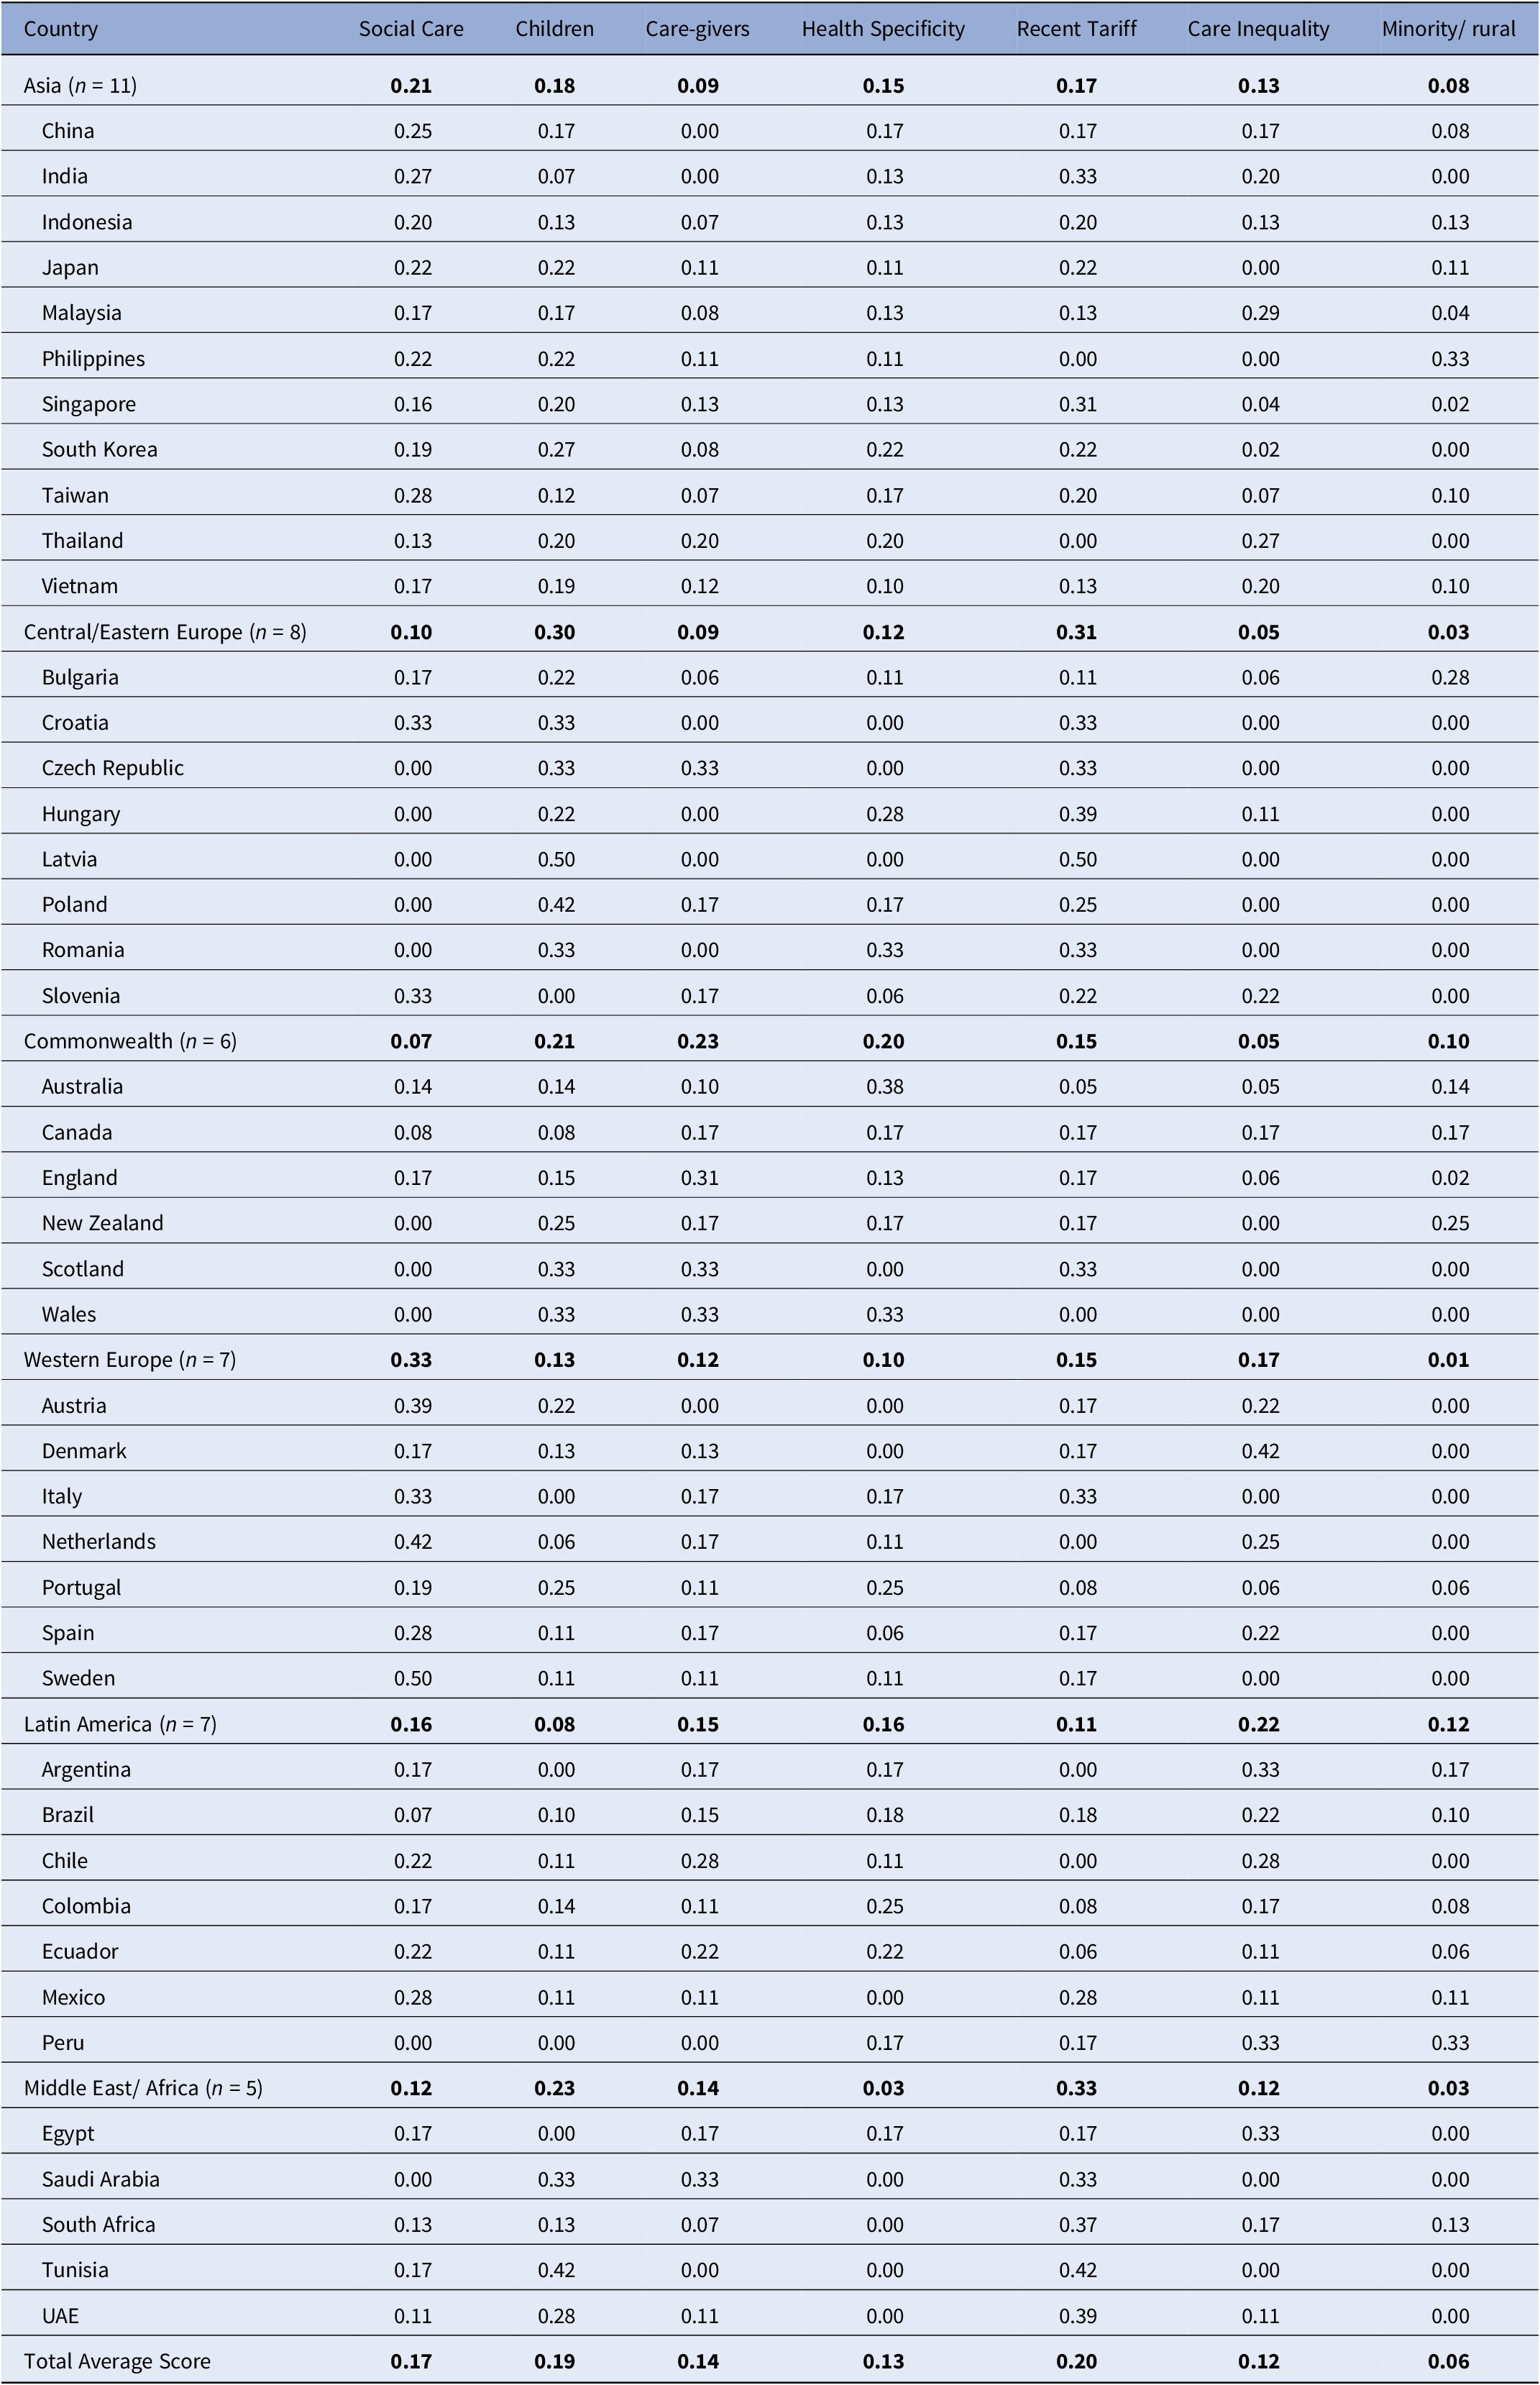
Table 4 depicts the research priority by country and region. The top three research priorities globally were i) to make more recent utility values available (recent tariff, importance score (IS) = 0.20), ii) to develop utility instruments to capture the impact of treatment on children and adolescents (children, 0.19), and iii) to develop utility instruments to capture both healthcare and social care impact (social care, 0.17). In Asia (importance score, 0.21) and Western Europe (0.33), the top-voted research priority was related to social care. In the Middle East/Africa (0.33) and Central/Eastern Europe (0.31), the primary research priority was related to recent tariffs. In the Commonwealth (0.23), the priority was to develop utility instruments to capture the impact of treatment on carers; In Latin America (0.22), the top research topic was to develop utility instruments addressing inequality in care. In all regions except for Western Europe and Latin America, children were the second highest research priority (IS = 0.18 to 0.30). In Asia (0.17) and Western Europe (0.15), recent tariffs remain the third highest research priority.
Research priority by mean sum score

Note: Social care: To develop utility instruments to capture the impact of both health care and social care; Children: To develop utility instruments to capture the impact of treatment on children and adolescents; Caregivers: To develop utility instruments that capture the impact of a treatment on carers and caregivers; Health Impact: To develop utility instruments that capture the impact of treatment on more specific aspects of health (e.g. vision hearing etc.); Recent Tariff: To make more recent utility data and value sets/tariffs available; Care Inequality: To develop utility instruments that can address inequality in care; Minority/Rural: To develop utility instruments that can reflect the health preferences of minority groups (e.g. indigenous populations) or rural population.
For example, respondent A from Thailand endorsed two research priorities; social care and children. Each of these two topics received a score of 0.5 and remain topics received a score of 0. To calculate the score for the social care research priority for Thailand, these scores belonging to the individuals from Thailand were averaged. If 10 respondents from Thailand endorsed at least one topic, and the score for social care was 0.5 for five respondents and 0.2 for the remaining five respondents, the importance score for social care in Thailand is 0.35 (i.e., ([0.5 x 5] + [0.2 x 5]) / 10).
Discussion
In this study, we obtained global insights into the practices, views, and needs of HTA agency personnel across six regions on a broad range of topics related to the measurement and valuation of health. Additionally, we explored data quality issues encountered by HTA practitioners and identified research topics perceived as important.
In general, the respondents’ practices regarding the choice of utility instruments and elicitation methods were consistent with HTA guideline recommendations of using indirect measures such as the EQ-5D instrument as the reference case, and preferring choice-based preference elicitation methods (Reference Sharma, Aggarwal, Downey and Prinja5;17;Reference Kennedy-Martin, Slaap and Herdman18).
Interestingly, only in Western Europe and the Commonwealth were local public health-state preferences used more frequently than those of foreign sources, possibly highlighting the prevalent issue of data availability in the field of HTA (Reference Zisis, Pavi, Geitona and Athanasakis22;Reference O’Rourke, Werkö, Merlin, Huang and Schuller23). Additionally, patient preference data is only occasionally used in Western Europe and the Commonwealth, aligning with most HTA guideline recommendations and empirical study findings (Reference Hiligsmann, Liden and Beaudart24;Reference van Overbeeke, Forrester, Simoens and Huys25). However, patient preference data is often used in regions outside Western Europe and the Commonwealth, perhaps motivated by interest in patients’ views and/or unavailability of preference data from the general public. While respondents’ views regarding the choice of instrument, methods, and health preference data sources generally reflect HTA guidance recommendations, some preferred patient preferences, arguing that the patient voice and disease experience are important. Additionally, some respondents expressed concerns about the shortcomings of the widely used EQ-5D and the TTO method. The main disadvantage of the EQ-5D, as cited by respondents, is poor responsiveness in certain health conditions, while TTO poses a high cognitive burden to respondents. Similar concerns have been documented in the literature (Reference Brazier, Ara, Rowen and Chevrou-Severac26–Reference Qian, Tan, Chuang and Luo28). Interestingly, those respondents did not consider using new instruments such as EQ-HWB, PROPr, “bolt-ons” or new valuation methods such as DCE, perhaps because they were not aware of or familiar with those new alternatives.
This study identified widespread suboptimal use of HRQoL and HSU data in current HTA practice across regions. Data-related issues included sample representativeness, sample size, use of mismatched data, and data generated using different instruments and methods. These issues are likely due to the scarcity of quality and appropriate data, underscoring the need for research to improve data availability (Reference Claire, Elvidge and Hanif29). Respondents’ comments suggested that HTA practitioners are aware of the data quality issues and the validity of the methods used to address them. This finding echoes the increasing concerns about the methodological rigor in using HSU data for CUA (Reference Ara, Brazier, Lloyd and Chevrou-Severac30–Reference Brazier, Ara and Azzabi32). However, the magnitude of such issues is largely unknown. A recently conducted systematic review of published CUAs from Asia found that the overall reporting quality for HRQoL or HSU data was very poor (Reference Yang, Zeng and Huang33).
Regarding research priorities, developing instruments to capture the impact of treatments on children and adolescents emerged as an important topic in most regions. This may reflect a real unmet need for fit-for-purpose instruments all around the world. Instruments assessing effects of social care, caregiver needs, and specific health problems are at the top of the wish list of HTA practitioners from many regions. The need for recent tariffs globally as the top research priority further strengthens the importance of valuation work. This need was especially emphasized in the Middle East/Africa and Central/Eastern Europe, where value set generation is only starting to gain momentum (Reference Al-Jedai, Almudaiheem and Al-Salamah34–Reference Prevolnik Rupel and Ogorevc36). Countries in these regions generally lack preference-based values. In line with the growth of HTA in these countries, the presence of value sets becomes essential in expanding the use of CUAs and in implementing HTA for wider coverage of healthcare decision-making (Reference Callenbach, Ádám, Vreman, Németh, Kaló and Goettsch37–Reference Kaló, Gheorghe, Huic, Csanádi and Kristensen39). An interesting research topic proposed by a respondent is to develop public depositories of HSU data. Such a depository would act as a library, storing data from different population groups, facilitating crosswalks to other country value sets, and being referenced by HTA practitioners as needed. A properly regulated HSU depository would alleviate the issue of scarce data faced by HTA practitioners globally. These research topics, along with insights from the content analysis, highlight the global need for greater generation of HSUs in different areas to better capture the health preferences of populations.
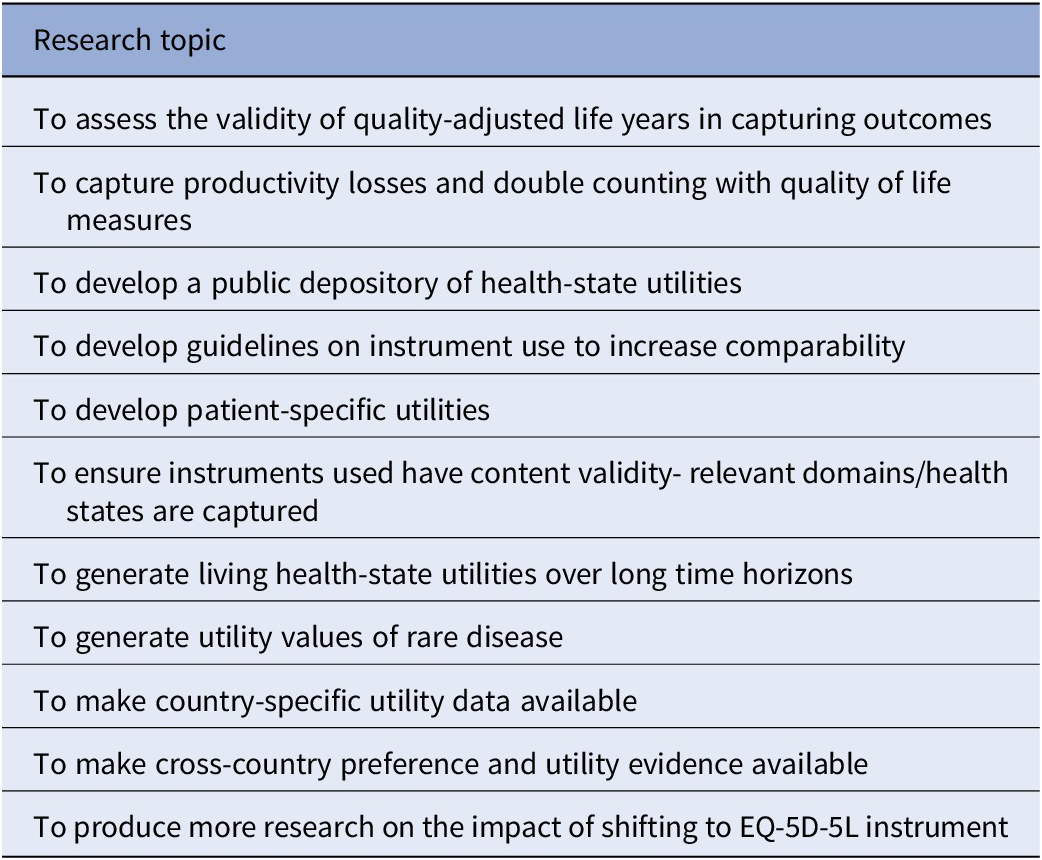
The above findings on the current practice and views of HTA personnel on instruments, methods, and data for generating QALY-based evidence may provide useful guidance for future research. First, research on instruments targeting children and adolescents, such as EQ-5D-Y, may be prioritized due to a global need for such tools. Compared to HRQoL instruments for adults, those for children and adolescents are fewer and less developed (40). The methods review completed by NICE in 2022 found insufficient evidence for recommending any existing HRQoL instruments for use in pediatric HTA and therefore called for research in this area (Reference Dawoud, Lamb and Moore41). Second, researchers developing new instruments and elicitation methods may consider shifting from a pure academic approach to a user-oriented approach by engaging stakeholders, particularly HTA agencies, in the whole development process. Such a collaborative approach may increase the chance of developing a product that will be accepted or adopted sooner for use in HTA practice. This approach to involving stakeholders such as patient advocacy groups and decision-makers has been used in developing the EQ-HWB instrument (Reference Carlton, Peasgood, Mukuria, Johnson, Ogden and Tovey42). Given that instrument development is a lengthy, multi-stage process and HTA agencies are cautious in endorsing new instruments and methods, sustained engagement and long-term collaboration may be necessary to achieve a tangible impact. Moreover, given that established HTA agencies are more concerned with maintaining consistency and standardization, new instruments and methods may be more likely to be endorsed and accepted by burgeoning HTA agencies. Last but not least, research on methods for making more HRQoL and HSU data available or making better use of existing data seems equally or even more important than making new instruments available (see Table 5, which summarizes respondent-identified priority research topics related to utility values, many of which concern data availability). This is because data scarcity for endorsed HRQoL instruments such as EQ-5D may be a greater issue than the lack of more fit-for-purpose instruments, such as EQ-HWB, because those instruments are routinely used. Such research may involve systematically collecting and publishing HRQoL data from health systems, collating and compiling HRQoL data published in the literature, and developing tools for modifying or transforming HRQoL data for use across health systems. Databases providing HSU data and guidelines promoting appropriate use of HSU data (Reference Brazier, Ara and Azzabi32;Reference Wolowacz, Briggs and Belozeroff43) have been available. However, those may not be sufficient and more work is needed to fill in this data gap and need.
Other research topic of importance-related to utility values

This study had several limitations. In twelve of the forty-five countries, there were fewer than three responses despite repeated reminders, limiting the representativeness of these countries. A further limitation is the difficulty in identifying the most appropriate respondent within an HTA agency. Senior personnel may be well-positioned to speak on behalf of the organisation, but may not possess detailed knowledge of the specific research area. Conversely, analysts may have relevant expertise but may not be able to represent the agency’s official position, for example, due to limited seniority or differing personal views. Another limitation concerns the snowball-type recruitment method we employed. Potential respondents were identified through the network of EuroQol Group members. As a result, HTA personnel who are familiar with or favor EuroQol instruments may be overrepresented in our sample. However, EuroQol Group members come from diverse backgrounds and regions, and many actively participate in HTA development in their respective countries, making them ideal recruiters for this by-invitation-only global survey. A related limitation relates to our recruitment strategy. Because recruitment was organized at the country level rather than at the level of specific HTA bodies, respondents were encouraged to provide their views as individuals rather than as formal representatives of their organizations. Consequently, we were unable to identify respondents by specific HTA agency within each country and therefore could not reanalyze the data using the HTA body as the unit of analysis. Although we considered additional subgroup analyses, for example, examining differences by type of technology appraised or therapeutic area, we judged that such analyses would not yield reliable or interpretable findings. Many respondents reported involvement across multiple therapeutic areas, multiple health technology types, or held several HTA roles, making clear classification challenging. Moreover, the study was not powered to detect meaningful subgroup differences, and uneven distribution across categories would further limit the validity of any conclusions drawn. Lastly, we were not able to verify the eligibility of the respondents. Country-specific survey links were distributed by recruiters to potential respondents in the target HTA agencies. Although screening questions were included at the start of the survey, personal identifiers such as respondent names or the agencies they worked for were not collected to encourage more candid responses.
Conclusions
This study addresses important knowledge gaps regarding the current practices of measuring and valuing HRQoL in HTA and the views on the challenges and needs of HTA agency personnel worldwide. Findings from this study may guide research aimed at developing tools and methods for providing high-quality QALY evidence for economic evaluations.
Supplementary material
The supplementary material for this article can be found at http://doi.org/10.1017/S0266462326103602.
Data availability statement
Data generated for the current study are included in this published article (and its supplementary files). They are also available from the corresponding author on reasonable request.
Acknowledgements
We extend our deepest gratitude to the following individuals who acted as recruiters for the study and contributed to the success of our study: Aureliano Finch, Claire Gudex, Fanni Rencz, Fatima Al Sayah, Gan Yan Nee, Haarathi Chandriah, Jan Busschbach, Jazmin Joanna Pinzon, Jennifer Jelsma, Juan M. Ramos-Goñi, Marisa Santos, Mimi Astrom, Min-Woo Jo, Patricia Antunes, Petra Došenovič Bonča, Princess Allyza, Sarah Dewilde, Selenia Gomez, Sivaraj Raman, Takeru Shiroiwa, Tommy Chen, Victor Zarate, Vu Quynh Mai, Wang Pei, and Wanrudee Isaranuwatchai. We are also thankful to the following recruiters whose attempts were not successful: Gerard de Pouvourville, Henry Bailey, John Yfantopoulos, Oliver Rivero-Arias, Sarah Dewilde, and Wolfgang Greiner.
Author contribution
Concept and design: NL and NB. Acquisition of data: NL, NB, AVT, PL, LL, LRA, FP, DG, FA, KR, and RV. Analysis and interpretation of data: NL, NB, and AVT. Drafting of manuscript: NL, NB, and AVT. Critical revision of paper for important intellectual content: NL, NB, AVT, PL, LL, LRA, FP, DG, FA, KR, and RV. Statistical analysis: AVT, KR, NL, and NB. Supervision: NL and NB.
Funding statement
This project is supported by the EuroQol Research Foundation (Grant Number: 1505-RA), Rotterdam, the Netherlands.
Competing interests
Lorgelly, Longworth, Rey-Ares, Purba, Golicki, Augustovski, Rand, Viney, Bansback, and Luo are members of the EuroQol Research Foundation. Vasan Thakumar declares no conflict of interest.


 Open access

