


1. Introduction
After years of increasing globalization, recent times have witnessed a shift in global economic relations. In this context, the Russian invasion of Ukraine constitutes a “Zeitenwende,” which has highlighted how geopolitical risk (GPR) can upset hydrocarbon supply chains and result in weaponized international trade. Consequently, the war has put countries’ risk–reward calculus under renewed scrutiny.
Even before the Russian invasion of Ukraine, geopolitical considerations have gained importance. The US-China trade war and the military threats in the Taiwan Strait and the South China Sea have exemplified the importance of political tensions and GPR as determinants of economic activity. In both instances, the lesson is to reduce economic dependencies that could be exploited for geopolitical gain. In addition to governmental de-risking initiatives, businesses move to blocs of like-minded countries—a strategy sometimes referred to as “nearshoring,” or “friendshoring.” One may say they are moving from “just in time” to “just in case” to make supply chains less vulnerable to geopolitical tides.Footnote 1
Reshaping the world’s supply chains comes at a cost. The shift towards a more fragmented form of globalization may have profound economic implications, driven predominantly by differences in comparative cost advantage. The empirical literature provides varying estimates of the impact of increased geopolitical fragmentation. While some studies suggest that decoupling could result in a manageable 0.2% reduction in global GDP (Aiyar et al., Reference Aiyar, Chen, Ebeke, Garcia-Saltos, Gudmundsson, Ilyina, Kangur, Kunaratskul, Rodriguez, Ruta, Schulze, Soderberg and Trevino2023), others emphasize a more concerning decline ranging from 2% to 7%, depending on the extent of fragmentation (Aiyar et al., Reference Aiyar, Chen, Ebeke, Garcia-Saltos, Gudmundsson, Ilyina, Kangur, Kunaratskul, Rodriguez, Ruta, Schulze, Soderberg and Trevino2023; IMF, 2023, 91−114).
Against the backdrop of heightened political tensions and the associated GPR undermining economic prospects, our study makes three contributions. First, we revisit the relationship between geopolitical risk originating from Russia and business cycles. Geopolitical fragmentation risk feeds through into real economic activity because uncertainty causes businesses and consumers to delay investment and consumption decisions. Alongside other risks, one can refer to an uncertainty triumvirate of economic uncertainty, policy uncertainty, and GPR. Economic uncertainty refers to the risk that occurs during the business cycle, while policy uncertainty is concerned with government interventions of different kinds. Here, we focus on geopolitical risk but recognize that periods of heightened geopolitical risk may contain elements of each going hand-in-hand. Given the transformative “Zeitenwende” described above, the particular focus of this study is on the GPR originating from Russia and their macroeconomic impacts on advanced economies. Second, we provide evidence on cross-country geopolitical shock transmission. Despite the particular prominence of this issue, there are only a few studies on the cross-country economic knock-on impacts of the war in Ukraine. In contrast to our multi-country Bayesian Global Vector Autoregression (BGVAR) modeling approach, Bruhin et al. (Reference Bruhin, Scheufele and Stucki2023) have estimated separate structural vector autoregressions (VARs) with sign restrictions for five European countries considered in the study (France, Germany, Italy, Switzerland, and the United Kingdom). In terms of the conflict shock series, the authors draw on historical geopolitical conflicts that were associated with fears of and/or actual disruptions in energy supply and impose sign restrictions on their effects (the Yom Kippur War in 1973, the Middle East Conflicts in the 1980s, the Gulf War in the 1990s, the Iraq War in the early 2000s, and the Ukraine War). Those conflicts and the GPR shocks, which date back quite some time, are not the focus of our study. Finally, while other studies have analyzed the GPR impacts on specific markets (see Afonso et al., Reference Afonso, Alves and Monteiro2023; Aizenman et al., Reference Aizenman, Lindahl, Stenvall and Uddin2023; Federle et al., Reference Federle, Meier, Müller and Sehn2022; Li et al., Reference Li, Tu, Zeng, Gong and Yuan2022; Phan et al., Reference Phan, Tran and Iyke2022 and Wang et al., 2022), we are interested in the macroeconomic repercussions of the GPR shocks originating from Russia.
We employ the Bayesian GVAR approach as implemented by Boeck et al. (Reference Boeck, Feldkircher and Huber2022) to close this research gap and to make an empirical contribution to this topical question. Since the seminal studies by Doan et al. (Reference Doan, Litterman and Sims1984) and Litterman (Reference Litterman1986), Bayesian VARs have become workhorse models in macroeconomic modeling and forecasting. It is well known that shrinkage generally improves the forecasting performance of reduced-form VARs, and Bayesian methods offer an effective way to shrink parameters by using prior information. In BGVARs studies such as Crespo Cuaresma et al. (Reference Crespo Cuaresma, Feldkircher and Huber2016, Reference Crespo Cuaresma, Doppelhofer, Feldkircher and Huber2019, Reference Crespo Cuaresma, Huber and Onorante2020), Dovern et al. (Reference Dovern, Feldkircher and Huber2016) and Huber (Reference Huber2016), each country-specific VAR is augmented with weakly exogenous foreign variables, constructed by aggregating other countries’ variables with international trade flows as weights. Then, country-specific models are combined to form a global model for spillover analysis and forecasting. A particular advantage of this approach is that the uneven reverberations of geopolitical shocks across countries can be pinpointed.Footnote 2 To our knowledge, this paper presents the first application of this appealing modeling approach to the geopolitical risk issue.
The main results of the paper are as follows: First, a shock in Russian GPR of the magnitude of the Russian invasion of Ukraine results in a profound and encompassing reduction of economic activity. The shock propagates internationally through the trade channel, with decreasing terms of trade. Rising prices affect consumption adversely, and a deteriorating business climate reduces investments. It takes over two years before the knock-on effects begin to subside. Second, the magnitude of geopolitical risk matters. Russian GPR shocks prior to the invasion of Ukraine in February 2022, including the Crimean annexation and the separatist movement in eastern Ukraine, had little to no economic impact on the rest of the world - a sharp contrast to the repercussions of the current full-blown war. Given these results and viewed in a broader context, this paper thus provides evidence on the impact of geopolitical and geostrategic challenges on the Euro-Atlantic region to uphold a free and open international order. Finally, our results add to the conclusions of prior studies on the economic ramifications of wars. Glick and Taylor (Reference Glick and Taylor2010) have studied the effects of wars on bilateral trade with available data extending back to 1870. They found large and persistent impacts of wars on trade and GDP. Caldara et al. (Reference Caldara, Conlisk, Iacoviello and Penn2022) quantified the global economic impact of the recent rise in global text-mining geopolitical risk measures, finding that the increase in global geopolitical risk constitutes a sizable drag on world GDP and boosts world inflation.
The layout of this paper is as follows: Section 2 describes how we assess geopolitical risk. Section 3 introduces the empirical GVAR methodology, encapsulating several potential shock propagation channels. The presentation of the data and the GVAR model specification is given in Section 4, followed by various model structural stability tests in Section 5. In Section 6, we report on our empirical results, with a special focus on how the war in Ukraine has increased geopolitical risk. We present our supplementary robustness tests in Section 7, while we present our conclusion in Section 8.
2. Geopolitical risk data
To estimate the effects of rising geopolitical risk tensions, we employ the geopolitical risk (GPR) indices of Caldara and Iacoviello (Reference Caldara and Iacoviello2022) as proxy. The authors consider geopolitical risk as risk associated with wars, terrorist acts, and tensions between states that affect the normal and peaceful course of international relations. They aim to identify situations in which the power struggle between governments over territories is not resolved peacefully and democratically.
The GPR index is part of the rapidly growing literature on text search methods using newspaper archives. To create the GPR index, Caldara and Iacoviello (Reference Caldara and Iacoviello2022) gathered articles from electronic archives of the Chicago Tribune, the Daily Telegraph, Financial Times, The Globe and Mail, The Guardian, the Los Angeles Times, The New York Times, USA Today, The Wall Street Journal, and The Washington Post with broad worldwide coverage featuring events and threats associated with geopolitical conflicts such as wars, terrorist acts, ethnic and political violence, and geopolitical tensions. The automated text-mining search separately identifies war threats, peace threats, military buildups, nuclear threats, terror threats, beginning of war, escalation of war, and terror acts. Complementing the global geopolitical situation, GPR indices for 44 different countries are available. Country-specific indices are calculated analogously based on the overall GPR index, but with the supplementary requirement that articles must explicitly mention the name of the country or its major cities to be considered for inclusion. For each of the 10 newspapers, the authors collect monthly counts of GPR-related articles as a proportion of the total number of articles. Subsequently, the authors divide each monthly count by the mean from the year 2000 to the year 2009 of the series and multiply it by 100.Footnote 3 In essence, the GPR index acts as a barometer that captures the ebbs and flows of geopolitical risk in real-time.Footnote 4
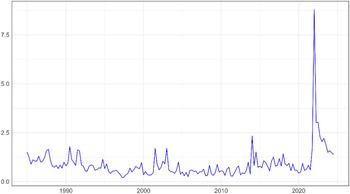
Figure 1 plots the movements in the Russian GPR index from 2000Q1 through 2024Q1. The calculated Russian GPR scores line up well with past geopolitical events that would typically be associated with high levels of uncertainty and, likewise, the recent GPR spike in the wake of the Russian invasion of Ukraine. The time series is characterized by various armed conflicts and terrorist acts since the turn of the millennium. First, at the beginning of the 2000s, the guerrilla phase of the 2nd Chechen War led to several GPR spikes of different sizes. Among others, these include the killing of civilians by armed Chechen extremists in the Moscow theater hostage crisis in October 2002. Second, Russia’s war in Georgia over the breakaway territories of Abkhazia and South Ossetia in August 2008 is discernible in another GPR rise. Third, the Euromaidan, the Russian annexation of Crimea in February–March 2014, and the war in the Donbas are evident in an especially pronounced GPR increase. Fourth, the recurring GPR spikes from 2015 onwards were the result of repeatedly flaring tensions between Ukraine and Russia over Donbas. The long-run average of these spikes is about 0.8, and the standard deviation is 0.6. Fifth, in the first quarter of 2022, the score reached 5.2, highlighting the significance of the Russian invasion of Ukraine in fueling political and economic insecurity around the world.Footnote 5 Finally, the Russian GPR index has declined, even as the war in Ukraine continues in full. This reflects that an initial uncertainty overshooting has abated, and energy markets have shown a great deal of adaptiveness. European countries which were tied to Russian pipeline gas managed to switch to natural gas suppliers, which required building new liquefied natural gas (LNG) infrastructures.
Quarterly Russian GPR index from 2000Q1 through 2024Q1.
Notes: The quarterly text-mining GPR indices are calculated by the temporal aggregation of the monthly GPR indices. The GPR data were sourced from https://www.matteoiacoviello.com/gpr_country.htm.

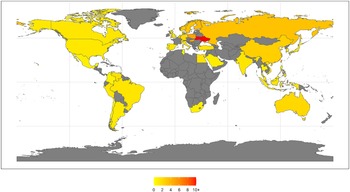
Figure 2 depicts a comparison between the average pre- and post-war geopolitical risk levels by country. In this visualization, changes in GPR indices are represented using varying colors, with darker shades indicating higher GPR scores. First, it is evident from the Figure that there has been a notable global increase in average geopolitical risk across most countries since the outbreak of the full-blown war in February 2022. The dark orange shading of Russia confirms the assessment that the Russian war of aggression has turned the security and defense architecture of Europe upside down. Second, Ukraine, being the target of unprovoked Russian military aggression, is depicted with red GPR values, symbolizing the greatly elevated risk it faces. Finally, the map emphasizes the pivotal role of geographical proximity since countries located closer to the Russian-Ukrainian battleground have witnessed the most significant surge in domestic geopolitical risk.
The worldwide geopolitical risk landscape (2022Q1–2024Q1).
Notes: The map shows the average GPR indices from 2022Q1 to 2024Q1 (Index: 1985Q1–2021Q4 = 1). No GPR scores are available for countries marked in gray. The country-specific GPR indices were sourced from https://www.matteoiacoviello.com/gpr_country.htm.

In the following chapter, we will analyze how the empirical evidence stacks up, including an in-depth analysis of the impact of Russia’s invasion of Ukraine.
3. Model
In order to capture the transmission of heightened GPR, we employ the BGVAR framework (Boeck et al., Reference Boeck, Feldkircher and Huber2022) offering a balanced trade-off between parsimony and complexity. Consider that we have a panel structure with $N+1$
units. Each of the first
$N+1$
units. Each of the first $N$
units,
$N$
units, $i=1,\cdots ,N$
, is modeled as a reduced VAR model with exogenous variables (VARX) of the form
$i=1,\cdots ,N$
, is modeled as a reduced VAR model with exogenous variables (VARX) of the form
 \begin{equation} {\boldsymbol{y}}_{i,t}={{b}}_{i}+ {\boldsymbol{B}}_{p}^{i}{\boldsymbol{y}}_{i,t-p}+{\boldsymbol{G}}_{i,0}{\boldsymbol{x}}_{i,t}+\ldots {\boldsymbol{G}}_{i,q}{\boldsymbol{x}}_{i,t-q}+{\boldsymbol{H}}_{i,0}{\boldsymbol{z}}_{t}+\ldots +{\boldsymbol{H}}_{i,r}{\boldsymbol{z}}_{r}+ \boldsymbol{\varepsilon }_{i,t}, \end{equation}
where ${\boldsymbol{y}}_{t}$
is a vector with
${\boldsymbol{y}}_{t}$
is a vector with $n_{i}$
variables for country i in time t and is a function of its past p lags as well as a function of (weakly) exogenous variables
$n_{i}$
variables for country i in time t and is a function of its past p lags as well as a function of (weakly) exogenous variables ${\boldsymbol{x}}$
and
${\boldsymbol{x}}$
and ${\boldsymbol{z}}$
, which have q and r lags, respectively. In order to capture better volatile events, such as the pandemic lockdowns or the breakout of the war, we assume that the residuals follow a stochastic volatility process and thus have a time-varying variance-covariance matrix
${\boldsymbol{z}}$
, which have q and r lags, respectively. In order to capture better volatile events, such as the pandemic lockdowns or the breakout of the war, we assume that the residuals follow a stochastic volatility process and thus have a time-varying variance-covariance matrix $\boldsymbol{\varepsilon }_{i,t}\sim N(\mathbf{0},\boldsymbol{\unicode{x1D6F4}}_{\mathrm{t}}^{\mathrm{i}})$
.Footnote
6
The vector
$\boldsymbol{\varepsilon }_{i,t}\sim N(\mathbf{0},\boldsymbol{\unicode{x1D6F4}}_{\mathrm{t}}^{\mathrm{i}})$
.Footnote
6
The vector ${\boldsymbol{x}}_{i,t}$
has
${\boldsymbol{x}}_{i,t}$
has $n_{i}^{*}$
elements and is a weighted average of the variable of other units relevant for unit i, i.e.
$n_{i}^{*}$
elements and is a weighted average of the variable of other units relevant for unit i, i.e.
 \begin{equation}{\boldsymbol{x}}_{i,t}=w_{i,1}{\boldsymbol{y}}_{1,t}+ w_{i,2}{\boldsymbol{y}}_{2,t}+\cdots + w_{i,i}{\boldsymbol{y}}_{t}^{i}+\ldots + w_{i,N}{\boldsymbol{y}}_{N,t},\end{equation}
with weights $w_{i,j}$
denoting the weight associated with unit j with respect to unit i, as measured by an international trade metric. Additionally, it holds
$w_{i,j}$
denoting the weight associated with unit j with respect to unit i, as measured by an international trade metric. Additionally, it holds $w_{i}^{i}=0$
and
$w_{i}^{i}=0$
and $\sum _{j}w_{j}^{i}=1$
. The vector
$\sum _{j}w_{j}^{i}=1$
. The vector ${\boldsymbol{z}}_{t}$
collects
${\boldsymbol{z}}_{t}$
collects $n_{z}$
variables which are not unit specific (note the omission of superscript i) and affect all countries. The dynamics of the
$n_{z}$
variables which are not unit specific (note the omission of superscript i) and affect all countries. The dynamics of the $n_{z}\times 1$
vector
$n_{z}\times 1$
vector ${\boldsymbol{z}}$
are given by the
${\boldsymbol{z}}$
are given by the $N^{th}+1$
unit and also follow a VAR form with a stochastic volatility process with s lags.
$N^{th}+1$
unit and also follow a VAR form with a stochastic volatility process with s lags.
 \begin{equation}{\boldsymbol{z}}_{t}={\boldsymbol{d}}+ {\boldsymbol{D}}_{1}{\boldsymbol{z}}_{t-1}+\ldots +{\boldsymbol{D}}_{s}{\boldsymbol{z}}_{s}+ \boldsymbol{\varepsilon }_{z,t}, \boldsymbol{\varepsilon }_{z,t}\sim N(\mathbf{0},\boldsymbol{\unicode{x1D6F4}}_{z,t})\end{equation}
For example, Dées et al. (Reference Dées, di Mauro, Pesaran and Smith2007) name the $N^{th}+1$
unit the “dominant unit,” which collects commodities prices such as oil, raw materials, and metal prices. The distinction in equation (1) between the exogenous variables
$N^{th}+1$
unit the “dominant unit,” which collects commodities prices such as oil, raw materials, and metal prices. The distinction in equation (1) between the exogenous variables ${\boldsymbol{x}}$
and
${\boldsymbol{x}}$
and ${\boldsymbol{z}}$
is for expositional purposes and thus the model may be written more compactly as
${\boldsymbol{z}}$
is for expositional purposes and thus the model may be written more compactly as
 \begin{equation}{\boldsymbol{y}}_{i,t}={\boldsymbol{b}}_{i} +\sum _{j=1}^{p}{\boldsymbol{B}}_{i,j}{\boldsymbol{y}}_{i,t-j}+\sum _{j=0}^{q}\boldsymbol{\Lambda }_{i,j}{\boldsymbol{y}}_{i,t-j}^{\boldsymbol{*}}+ \boldsymbol{\varepsilon }_{i,t}, \boldsymbol{\varepsilon }_{i,t}\sim N\left(\mathbf{0},\boldsymbol{\unicode{x1D6F4}}_{i,t}\right)\end{equation}
where ${\boldsymbol{y}}^{\boldsymbol{*}}=[{\boldsymbol{x}}\boldsymbol{'}, {\boldsymbol{z}}\boldsymbol{'}]\boldsymbol{'}$
collects the non-domestic variables and
${\boldsymbol{y}}^{\boldsymbol{*}}=[{\boldsymbol{x}}\boldsymbol{'}, {\boldsymbol{z}}\boldsymbol{'}]\boldsymbol{'}$
collects the non-domestic variables and $\boldsymbol{\Lambda }_{i,j}$
are block-diagonal matrices with
$\boldsymbol{\Lambda }_{i,j}$
are block-diagonal matrices with ${\boldsymbol{G}}_{i,j}$
and
${\boldsymbol{G}}_{i,j}$
and $ {\boldsymbol{H}}_{i,j}$
along the diagonals with dimensions
$ {\boldsymbol{H}}_{i,j}$
along the diagonals with dimensions $n_{i}\times (n_{i}^{*}+n_{z})$
.
$n_{i}\times (n_{i}^{*}+n_{z})$
.
Given the constructed weighted averages the full GVAR specification is given by equations (3) and (4). The final assumption is that the unit residuals are uncorrelated, i.e. $\boldsymbol{\varepsilon }_{i,t}$
and
$\boldsymbol{\varepsilon }_{i,t}$
and $\boldsymbol{\varepsilon }_{j,t}$
are independent for all i and j and hence the joint variance-covariance matrix is block-diagonal
$\boldsymbol{\varepsilon }_{j,t}$
are independent for all i and j and hence the joint variance-covariance matrix is block-diagonal $\boldsymbol{\unicode{x1D6F4}}_{t}=\text{diag}(\boldsymbol{\unicode{x1D6F4}}_{1,t}, \ldots , \boldsymbol{\unicode{x1D6F4}}_{N,t},\boldsymbol{\unicode{x1D6F4}}_{z,t})$
. This allows for unit-by-unit estimation which greatly facilitates computation.
$\boldsymbol{\unicode{x1D6F4}}_{t}=\text{diag}(\boldsymbol{\unicode{x1D6F4}}_{1,t}, \ldots , \boldsymbol{\unicode{x1D6F4}}_{N,t},\boldsymbol{\unicode{x1D6F4}}_{z,t})$
. This allows for unit-by-unit estimation which greatly facilitates computation.
The multi-country modeling framework can be motivated in two ways. Dées et al. (Reference Dées, di Mauro, Pesaran and Smith2007) have derived the GVAR approach as an approximation to a global factor model, while Chudik and Pesaran (Reference Chudik and Pesaran2011) have obtained the GVAR model as an approximation to a large system in which all variables are endogenous.
A special GVAR feature is the sparse parameterization, which allows practitioners to bypass the curse of dimensionality problem in large unrestricted VARs. By contrast, in the GVAR modeling framework, the number of parameters to be estimated for each of the units for $i=1, \cdots ,N$
is independent of
$i=1, \cdots ,N$
is independent of $N$
and amounts to
$N$
and amounts to $[n_{i}p+1+n_{i}^{*}(q+1)+n_{z}(r+1)]$
coefficients. This independence from
$[n_{i}p+1+n_{i}^{*}(q+1)+n_{z}(r+1)]$
coefficients. This independence from $N$
also applies to the
$N$
also applies to the $0.5n_{i}(n_{i}-1)$
parameters of the variance-covariance matrices
$0.5n_{i}(n_{i}-1)$
parameters of the variance-covariance matrices $\boldsymbol{\unicode{x1D6F4}}_{i,t}$
. Nonetheless, the model offers extremely rich dynamics, as all countries mutually affect each other even in the absence of explicit cross-correlation. Thus, even at low numbers of lags, complex relationships arise (Crespo Cuaresma et al., Reference Crespo Cuaresma, Feldkircher and Huber2016).
$\boldsymbol{\unicode{x1D6F4}}_{i,t}$
. Nonetheless, the model offers extremely rich dynamics, as all countries mutually affect each other even in the absence of explicit cross-correlation. Thus, even at low numbers of lags, complex relationships arise (Crespo Cuaresma et al., Reference Crespo Cuaresma, Feldkircher and Huber2016).
An important consideration for the estimation stage is that the weighted variables of the other countries are at least weakly exogenous - a property that can be evaluated. Including a large variety of countries is a natural remedy, as within the limit, each VARX becomes a small open-economy specification (Chudik and Pesaran, Reference Chudik and Pesaran2011; Georgiadis, Reference Georgiadis2017). This is also important if the weights are constructed to sum to one, as a lower number of countries could overestimate the relative importance of a country.
3.1 Parameter inference
We follow Boeck et al. (Reference Boeck, Feldkircher and Huber2022) using a Bayesian approach. Since each unit can be estimated independently, parameter inference follows the classical Bayesian VAR paradigm. Estimating each unit, given by either (3) or (4) boils down to introducing a prior on the parameters and drawing from the posterior using Markov-Chain Monte Carlo (MCMC) methods.
Beginning with the coefficient matrices, we stack the parameters for country i in a large vector $\boldsymbol{\theta }_{i}=vec({\boldsymbol{b}}_{{\boldsymbol{i}}}, {\boldsymbol{B}}_{i,1},\ldots , {\boldsymbol{B}}_{i,p},\boldsymbol{\Lambda }_{1,j},\ldots ,\boldsymbol{\Lambda }_{q,j})$
and impose the popular Minnesota prior that implies the following distributions before introducing the model to the data
$\boldsymbol{\theta }_{i}=vec({\boldsymbol{b}}_{{\boldsymbol{i}}}, {\boldsymbol{B}}_{i,1},\ldots , {\boldsymbol{B}}_{i,p},\boldsymbol{\Lambda }_{1,j},\ldots ,\boldsymbol{\Lambda }_{q,j})$
and impose the popular Minnesota prior that implies the following distributions before introducing the model to the data
 \begin{equation}\boldsymbol{\theta }_{i}\sim N\left(\theta _{Mn},V_{Mn}\right),\end{equation}
where $\theta _{Mn}$
are entries of ones corresponding to the first lag of each variable and zero otherwise and the elements of the prior variance
$\theta _{Mn}$
are entries of ones corresponding to the first lag of each variable and zero otherwise and the elements of the prior variance $V_{Mn}$
have the following structure:
$V_{Mn}$
have the following structure:
 \begin{equation}\underline{V}_{i,jj}=\begin{cases} \dfrac{\lambda _{1}}{l^{2}}, & \text{for coefficients on own lag}\, l\text{ for }l=1,\ldots ,p \\[7pt] \dfrac{\sigma _{j}\lambda _{1}^{2}\lambda _{2}^{2}}{l^{2}\sigma _{s}}, & \text{for coefficients on lag}\, l\, \text{of variable}\, j\neq i\text{ for }l=1,\ldots ,p \\[7pt] \dfrac{\sigma _{j}\lambda _{1}^{2}\lambda _{3}^{2}}{\left(l+1\right)^{2}\sigma _{s}} & \text{ for }\text{coefficients on exogenous variables on lag}\, l \\[7pt] \lambda _{4}, & \text{for deterministic parts of the model} \end{cases}\end{equation}
Here, $\lambda _{1},\lambda _{2},\lambda _{3},\lambda _{4}$
are the standard hyperparameter of the Minnesota prior and specify the shrinkage of the model which are also estimated from the data using hierarchical Gamma prior.
$\lambda _{1},\lambda _{2},\lambda _{3},\lambda _{4}$
are the standard hyperparameter of the Minnesota prior and specify the shrinkage of the model which are also estimated from the data using hierarchical Gamma prior.
The classical Minnesota setup assumes that the variance-covariance matrix is known and samples only the $\boldsymbol{\theta }_{i}$
coefficients. Since we model the errors as a stochastic volatility process, we therefore use MCMC to iterate between the conditional distributions of drawing
$\boldsymbol{\theta }_{i}$
coefficients. Since we model the errors as a stochastic volatility process, we therefore use MCMC to iterate between the conditional distributions of drawing $\boldsymbol{\theta }_{i}$
and
$\boldsymbol{\theta }_{i}$
and $\boldsymbol{\Sigma}_{i}$
. To complete the specification, we express
$\boldsymbol{\Sigma}_{i}$
. To complete the specification, we express $\boldsymbol{\unicode{x1D6F4}}_{i,t}={\boldsymbol{V}}_{i}{\boldsymbol{D}}_{i,t}{\boldsymbol{V}}_{i}^{'}$
with
$\boldsymbol{\unicode{x1D6F4}}_{i,t}={\boldsymbol{V}}_{i}{\boldsymbol{D}}_{i,t}{\boldsymbol{V}}_{i}^{'}$
with ${\boldsymbol{V}}_{i}$
being lower triangular matrix
${\boldsymbol{V}}_{i}$
being lower triangular matrix ${\boldsymbol{D}}_{i,t}$
is a diagonal matrix with a diagonal
${\boldsymbol{D}}_{i,t}$
is a diagonal matrix with a diagonal $\exp \{d_{i,1t},\ldots ,d_{i,nt}\}$
following a log AR(1) process.Footnote
7
The
$\exp \{d_{i,1t},\ldots ,d_{i,nt}\}$
following a log AR(1) process.Footnote
7
The $d_{i,1t}$
are sampled using a Metropolis-Hastings algorithm. The elements of
$d_{i,1t}$
are sampled using a Metropolis-Hastings algorithm. The elements of ${\boldsymbol{V}}_{i}$
are sampled as in Carriero et al. (Reference Carriero, Clark and Marcellino2019) using a normal prior equation by equation, a feature given by the triangular decomposition.Footnote
8
${\boldsymbol{V}}_{i}$
are sampled as in Carriero et al. (Reference Carriero, Clark and Marcellino2019) using a normal prior equation by equation, a feature given by the triangular decomposition.Footnote
8
Once posterior inference on each individual unit is complete the large global system can be solved for via an algebraic transformation of the individual units. Consider for example eq. (4) with p = 1 and q = 1, collecting all variables with time period t on the left hand-side yields
 \begin{equation}{\boldsymbol{y}}_{i,t}-\boldsymbol{\Lambda }_{i,1}{\boldsymbol{y}}_{i,t}^{\boldsymbol{*}}={\boldsymbol{b}}_{i} +{\boldsymbol{B}}_{i,1}{\boldsymbol{y}}_{i,t-1}+\boldsymbol{\Lambda }_{i,1}{\boldsymbol{y}}_{i,t-1}^{\boldsymbol{*}}+ \boldsymbol{\varepsilon }_{i,t}.\end{equation}
Defining a global vector ${\boldsymbol{y}}_{{\boldsymbol{t}}}=({\boldsymbol{y}}_{\mathbf{1},{\boldsymbol{t}}}\boldsymbol{'},\ldots ,{\boldsymbol{y}}_{{\boldsymbol{N}},{\boldsymbol{t}}}\boldsymbol{'},{\boldsymbol{y}}_{{\boldsymbol{z}},{\boldsymbol{t}}}\boldsymbol{'})\boldsymbol{'}$
we can express the above equation from the perspective of unit i in the large system. Introducing a selection matrix that chooses the variables
${\boldsymbol{y}}_{{\boldsymbol{t}}}=({\boldsymbol{y}}_{\mathbf{1},{\boldsymbol{t}}}\boldsymbol{'},\ldots ,{\boldsymbol{y}}_{{\boldsymbol{N}},{\boldsymbol{t}}}\boldsymbol{'},{\boldsymbol{y}}_{{\boldsymbol{z}},{\boldsymbol{t}}}\boldsymbol{'})\boldsymbol{'}$
we can express the above equation from the perspective of unit i in the large system. Introducing a selection matrix that chooses the variables ${\boldsymbol{y}}_{i,t}$
and
${\boldsymbol{y}}_{i,t}$
and ${\boldsymbol{y}}_{i,t}^{*}$
associated with unit i from the global vector,
${\boldsymbol{y}}_{i,t}^{*}$
associated with unit i from the global vector, ${\boldsymbol{S}}_{i}$
, and a an appropriately defined weighting matrix,
${\boldsymbol{S}}_{i}$
, and a an appropriately defined weighting matrix, ${\boldsymbol{W}}_{i}$
, for the foreign variables from eq. (2)
${\boldsymbol{W}}_{i}$
, for the foreign variables from eq. (2)
 \begin{equation}\underset{{\boldsymbol{A}}_{i}}{\underbrace{({\boldsymbol{S}}_{i}-\boldsymbol{\Lambda }_{i,0}{\boldsymbol{W}}_{i})}}{\boldsymbol{y}}_{t}={\boldsymbol{b}}_{i} +\underset{{\boldsymbol{F}}_{i}}{\underbrace{({\boldsymbol{S}}_{i}{\boldsymbol{B}}_{i,1}+\boldsymbol{\Lambda }_{i,1}{\boldsymbol{W}}_{i})}}{\boldsymbol{y}}_{t-1}+ \boldsymbol{\varepsilon }_{i,t}\end{equation}
Stacking equation (8) over all units then yields the full global system, which may be formulated either with the contemporaneous matrices determined by the weights and parameters $\boldsymbol{\Lambda }_{i,0}{\boldsymbol{W}}_{i}$
for each unit or as a reduced form global VAR, i.e.
$\boldsymbol{\Lambda }_{i,0}{\boldsymbol{W}}_{i}$
for each unit or as a reduced form global VAR, i.e.
 \begin{equation}{\boldsymbol{A}} {\boldsymbol{y}}_{t}={\boldsymbol{b}}+{\boldsymbol{F}} {\boldsymbol{y}}_{t-1}+\boldsymbol{\epsilon }_{t}, \boldsymbol{\epsilon }_{t}\sim N\left(\mathbf{0}, \boldsymbol{\unicode{x1D6F4}}_{\mathrm{t}}\right),\end{equation}
where ${\boldsymbol{A}}$
,
${\boldsymbol{A}}$
, ${\boldsymbol{F}}$
, and
${\boldsymbol{F}}$
, and ${\boldsymbol{b}}$
are constructed from stacking their respective unit specific representations.
${\boldsymbol{b}}$
are constructed from stacking their respective unit specific representations.
3.2 Structural inference
Established identification procedures prevalent in the VAR literature are, in principle, applicable to the global solution of the GVAR model. However, given that the GVAR framework incorporates an exogenous measure of cross-sectional unit connectivity and the exceedingly high dimensionality of the model, the identification of shocks in a GVAR is complicated. Traditional structural identification approaches of the global system according to some a-priori economic theory would therefore be an overstretch of the data. Therefore, the literature has mostly employed local identification schemes, i.e. a shock is identified only in one unit in a structural manner (through ordering assumptions or sign restrictions) while the responses of the other units are generalized. We are following this state-of-the-art approach.
The generalized impulse response functions (GIRF) are defined as the difference between the forecast for a variable k, ${\boldsymbol{y}}_{t}^{k}$
, with a shock δ
j
to variable j and the forecast in the absence of the shock, given an information set
${\boldsymbol{y}}_{t}^{k}$
, with a shock δ
j
to variable j and the forecast in the absence of the shock, given an information set $\Omega _{\mathrm{t}-1}$
, namely
$\Omega _{\mathrm{t}-1}$
, namely
The GIRF is calculated for every draw of the parameters and integrating across the posterior distribution yields the probability intervals for assessing the statistical validity of the results. The GFEVDs are calculated as in Lanne and Nyberg (Reference Lanne and Nyberg2016), where the h-step ahead forecast error of the j-th shock from the k-th variable is decomposed as
 \begin{equation} \gamma _{kj}\left(h\right)=\frac{\sum _{l=0}^{h}\,\mathrm{G}IRF_{kj}^{2}\left(l\right)}{\sum _{j=1}^{K}\sum _{l=0}^{h}\,\mathrm{G}IRF_{kj}^{2}\left(l\right)}, i,j=1,\ldots ,K. \end{equation}
It is worth noting that both the GIRFs and the GFEVDs are invariant to different orderings of the variables (Pesaran and Shin, Reference Pesaran and Shin1998) and Lanne and Nyberg, Reference Lanne and Nyberg2016).
4. Model specification and data
This section gives details on the countries and country clusters in the BGVAR model. We also describe the data in detail.
4.1. Country selection
We focus our analysis on the members of the European Economic Area (EEA) and the Group of Seven (G7) countries. In the BGVAR, the twenty-six countries are grouped, as shown in Table 1. The G7 countries comprise the United States, Canada, Japan, Germany, France, Italy, and the UK. These seven major industrialized countries are modeled individually in the BGVAR. Norway, given its status as a major oil exporter, is also modeled individually to reflect its unique economic position with respect to a Russian GPR shock. The remaining countries are grouped into different country clusters. The Baltic region (BAL) subgroup consists of Estonia, Latvia, and Lithuania. The Nordics subgroup (NRD) is made up of Finland, Denmark, and Sweden, while the Central and Eastern Europe (CEE) grouping comprises Bulgaria, the Czech Republic, Hungary, Poland, Romania, and Slovakia. Finally, the remaining EEA countries in our dataset, namely Austria, Belgium, Greece, Netherlands, Portugal, and Spain, form the EEA subgroup.Footnote 9 Overall, the formation of country groups allows for a parsimonious modeling while still estimating heterogeneous shock responses across countries.
Individual countries and groups of countries in the BGVAR model

4.2 Data
We use the Russian GPR index as a proxy of the geopolitical tensions from Russia and model it as a weakly exogenous variable ${\boldsymbol{z}}_{t}$
. We estimate the GPR impacts on the following variables: economic expectations (PMI), output (Y), consumption (
${\boldsymbol{z}}_{t}$
. We estimate the GPR impacts on the following variables: economic expectations (PMI), output (Y), consumption ( $C$
), investment (I), inflation (P), and interest rates (R). Economic expectations are predictably an important channel through which GPR shocks affect the real economy. For the expectations variable, we chose the Purchasing Manager Index (PMI) from S&P Global, which is available for the G-7 countries. The PMI data is closely watched to better understand where economies and markets are heading. For the remaining countries in the dataset, the Economic Sentiment Index (
$C$
), investment (I), inflation (P), and interest rates (R). Economic expectations are predictably an important channel through which GPR shocks affect the real economy. For the expectations variable, we chose the Purchasing Manager Index (PMI) from S&P Global, which is available for the G-7 countries. The PMI data is closely watched to better understand where economies and markets are heading. For the remaining countries in the dataset, the Economic Sentiment Index ( $ESI$
) from the European Commission is employed. Furthermore, we take real GDP, real personal consumption, and real investment from the OECD database. Prices are measured by the consumer price index (CPI) or the harmonized consumer price index (HICP) for the euro area from Eurostat. Given the nature and diversity of recent central bank balance sheet policies, we employ the shadow short rate as a consistent representation of the monetary policy stance (Krippner, Reference Krippner2013, Reference Krippner2020).Footnote
10
For the European countries that joined the euro area later than the beginning of our sample, we take their domestic overnight bank rates until the accession date. Finally, we include fossil fuel prices as an additional weakly exogenous variable in the GVAR framework. To this end, we employed the “HWWI Energy Raw Materials Price Index” (https://www.hwwi.org/en/data-offers/commodity-price-index/). The HWWI fossil fuel price index consists of the three most relevant forms of energy commodities: crude oil, coal, and natural gas. The index weightings calculated from the corresponding import shares of the OECD countries for 2017–2019 are 70% for crude oil, 8% for coal, and 22% for natural gas, respectively. Given Russia’s role as a major energy exporter, shifts in fossil fuel prices—such as those resulting from sanctions imposed in response to Russia’s attack on Ukraine—can significantly impact the global economy. The inclusion of the HWWI energy price index provides a conceptual decomposition of the entire Russian GPR shock impact into the pure weaponized fossil fuel price impact on the one hand and all remaining GPR-induced impediments to the growth process on the other hand. The latter include, among others, slowing global trade and foreign direct investments, declining exports to Russia in consequence of the sanctions decisions, heightened uncertainty taking a toll by delaying consumption and investment decisions, tightened financing conditions for households and businesses due to central banks’ need to bring inflation back to target rates, the economic fallout of supply chain disruptions, and governments facing higher sovereign bond yields to finance their fiscal deficits. The decomposition thus opens the door to a richer understanding of the transmission process of the Russian GPR shock on economic growth while at the same time pointing to potential levers for economic policy. Alternatively, the modeling approach can be thought of as de-noising the GPR variable. Our data is quarterly and runs from 2000Q1 to 2024Q1.Footnote
11
$ESI$
) from the European Commission is employed. Furthermore, we take real GDP, real personal consumption, and real investment from the OECD database. Prices are measured by the consumer price index (CPI) or the harmonized consumer price index (HICP) for the euro area from Eurostat. Given the nature and diversity of recent central bank balance sheet policies, we employ the shadow short rate as a consistent representation of the monetary policy stance (Krippner, Reference Krippner2013, Reference Krippner2020).Footnote
10
For the European countries that joined the euro area later than the beginning of our sample, we take their domestic overnight bank rates until the accession date. Finally, we include fossil fuel prices as an additional weakly exogenous variable in the GVAR framework. To this end, we employed the “HWWI Energy Raw Materials Price Index” (https://www.hwwi.org/en/data-offers/commodity-price-index/). The HWWI fossil fuel price index consists of the three most relevant forms of energy commodities: crude oil, coal, and natural gas. The index weightings calculated from the corresponding import shares of the OECD countries for 2017–2019 are 70% for crude oil, 8% for coal, and 22% for natural gas, respectively. Given Russia’s role as a major energy exporter, shifts in fossil fuel prices—such as those resulting from sanctions imposed in response to Russia’s attack on Ukraine—can significantly impact the global economy. The inclusion of the HWWI energy price index provides a conceptual decomposition of the entire Russian GPR shock impact into the pure weaponized fossil fuel price impact on the one hand and all remaining GPR-induced impediments to the growth process on the other hand. The latter include, among others, slowing global trade and foreign direct investments, declining exports to Russia in consequence of the sanctions decisions, heightened uncertainty taking a toll by delaying consumption and investment decisions, tightened financing conditions for households and businesses due to central banks’ need to bring inflation back to target rates, the economic fallout of supply chain disruptions, and governments facing higher sovereign bond yields to finance their fiscal deficits. The decomposition thus opens the door to a richer understanding of the transmission process of the Russian GPR shock on economic growth while at the same time pointing to potential levers for economic policy. Alternatively, the modeling approach can be thought of as de-noising the GPR variable. Our data is quarterly and runs from 2000Q1 to 2024Q1.Footnote
11
The vector of endogenous variables for each country is, thus, ${\boldsymbol{y}}_{t}= [PMI, Y,C, I, P, R]'$
, and they are transformed as follows. The PMI and
${\boldsymbol{y}}_{t}= [PMI, Y,C, I, P, R]'$
, and they are transformed as follows. The PMI and $ESI$
time series are standardized to make them compatible with the GVAR framework, relying on identical units. Y, C, and I are in log levels and are seasonally adjusted, just like the CPI. The data have been obtained through Macrobond, while the GPR time series have been sourced from https://www.matteoiacoviello.com/gpr_country.htm. The HWWI Energy Raw Materials Price Index enters the model in year-on-year growth rates. The vector of weakly exogenous variables is
$ESI$
time series are standardized to make them compatible with the GVAR framework, relying on identical units. Y, C, and I are in log levels and are seasonally adjusted, just like the CPI. The data have been obtained through Macrobond, while the GPR time series have been sourced from https://www.matteoiacoviello.com/gpr_country.htm. The HWWI Energy Raw Materials Price Index enters the model in year-on-year growth rates. The vector of weakly exogenous variables is ${\boldsymbol{z}}_{t}= [GPR, HWWI]'$
. Thus, our “dominant unit” in equation (3) gives the law of motion for the GPR index and the HWWI with time-varying variance with stochastic volatility as captured by
${\boldsymbol{z}}_{t}= [GPR, HWWI]'$
. Thus, our “dominant unit” in equation (3) gives the law of motion for the GPR index and the HWWI with time-varying variance with stochastic volatility as captured by $\boldsymbol{\unicode{x1D6F4}}_{z}$
. In this unit we identify the shock. The main assumption is that geopolitical tensions with Russia, as measured by the GPR proxy of Caldara and Iacoviello (Reference Caldara and Iacoviello2022), are exogenous to the movements of the commodity prices within the same quarter, i.e. these were not the cause for the invasion in Ukraine, or the annexation of Crimea, for example. For the remaining units, as discussed in Section 3.2. the responses to the shocks are of the generalized type.
$\boldsymbol{\unicode{x1D6F4}}_{z}$
. In this unit we identify the shock. The main assumption is that geopolitical tensions with Russia, as measured by the GPR proxy of Caldara and Iacoviello (Reference Caldara and Iacoviello2022), are exogenous to the movements of the commodity prices within the same quarter, i.e. these were not the cause for the invasion in Ukraine, or the annexation of Crimea, for example. For the remaining units, as discussed in Section 3.2. the responses to the shocks are of the generalized type.
The GVAR and BGVAR literature primarily employs trade-weights to model the multi-country relationships (e.g. Dees et al., Reference Dées, di Mauro, Pesaran and Smith2007 or Crespo Cuaresma et al., Reference Crespo Cuaresma, Feldkircher and Huber2016), while also financial weights have been used for modeling the financial markets (e.g. Eickmeier and Ng, Reference Eickmeier and Ng2015). We follow the former and use “The Atlas of Economic Complexity” for obtaining the trade weights, which compiles trade data originally sourced from the United Nations Statistical Division (Hausmann et al., Reference Hausmann, Hidalgo, Bustos, Coscia, Chung, Jimenez, Simoes and Yildirim2019). To aggregate the regions, we use GDP in purchasing power parity (PPP) based weights obtained from the World Bank. Next, we present a variety of econometric tests to validate the empirical approach.
5. Model validation and estimation
Before turning to the estimation, we present the calculated trade shares in Figure 3. We see an elevated level of international integration among the countries and country clusters considered, which is important for the BGVAR framework that relies on the interconnected country assumption at the estimation stage. Although Canada, Japan, and the USA have high two-way trade flows, they are also major trading partners for the remaining countries. Unsurprisingly, Germany is an important trading partner for all countries, and Canada trades predominantly with the USA.
To set the number of lags for the endogenous and exogenous variables (p, q, r, s), we use the Bayesian information criteria, which support one lag for each variable. One of the advantages of the BGVAR modeling framework is that it offers rich dynamics even without the presence of many lags due to the interconnectedness of all countries (Crespo Cuaresma et al., Reference Crespo Cuaresma, Feldkircher and Huber2016).
F-tests for weak exogeneity of the exogenous variables in the BGVAR

Note: A star (*) denotes a rejection of the weak exogeneity assumption at the 5% significance level.
Calculated trade shares.

Furthermore, the BGVAR relies on the assumption that the linear combination of the foreign variables is weakly exogenous. We follow the testing approach used by Dées et al. (Reference Dées, di Mauro, Pesaran and Smith2007), which is an F-test of the joint significance of the error-correction terms in a regression for each foreign variable. Table 2 presents the results of the test, indicating compelling evidence for no rejection of the weak exogeneity assumption.
In the existing GVAR literature, estimation has typically employed a frequentist approach, as seen in foundational works such as Pesaran et al. (Reference Pesaran, Schuermann and Weiner2004) and other contributions like Dées et al. (Reference Dées, di Mauro, Pesaran and Smith2007) and Georgiadis (Reference Georgiadis2015). However, Bayesian methods have also been utilized, for example by Crespo Cuaresma et al. (Reference Crespo Cuaresma, Feldkircher and Huber2016) and Boeck et al. (Reference Boeck, Feldkircher and Huber2022). Both approaches generally aim to achieve the same objectives, but there are some important differences in their implementation.
Test for serial autocorrelation of cross-unit residuals

Note: P-values and shares at various significance levels, shares above 0.1 are desired.
Test for pairwise cross-unit correlation of unit-model residuals

Note: P-values and shares at various significance levels, shares below 0.1 are desired.
The frequentist approach uses variables in (log) levels as it is specified in a Vector Error Correction (VECM) form to capture both short and long-term relationships. In contrast, the Bayesian approach relies entirely on the likelihood function, which remains Gaussian even in the presence of non-stationarity (Sims et al., Reference Sims, Stock and Watson1990). As a result, Bayesian VARs are typically specified in log levels, with the error-correction component frequently omitted, as is common in GVAR applications (e.g., Crespo Cuaresma et al., Reference Crespo Cuaresma, Feldkircher and Huber2016).
More importantly for our application, the VECM approach relies on the properly identified cointegration rank of the system to specify the individual rank models, requiring careful consideration about the presence of cointegration. This can be particularly challenging during periods of large economic shocks, such as the global pandemic and the invasion of Ukraine. Both events have caused significant fluctuations and co-movement across many macroeconomic variables. For instance, the energy price shocks following the Russian invasion of Ukraine have exacerbated supply shortages and fueled inflationary pressures. The resulting high inflation has had immediate negative impacts on consumption and investment, while higher wage demands, driven by real wage losses, have raised the risk of self-reinforcing feedback loops (Battistini et al., Reference Battistini, Di Nino, Dossche and Kolndrekaj2022). This, together with the skyrocketing GPR scores, results in significant challenges even for modern cointegration tests that explicitly consider structural breaks and cross-sectional dependence (e.g. Westerlund and Edgerton, 2008; Banerjee and Carrion-i Silvestre, Reference Banerjee and Carrion-i Silvestre2015; Arsova and Örsal, Reference Arsova and Örsal2020). This is especially true when extending the estimation period until 2024Q1. Moreover, heteroskedastic errors are typically not considered in the frequentist setting.
In this paper we opt for a VAR system instead of a VECM and rely on stochastic volatility to capture the heteroskedasticity in the data, which we assess through the in-sample model fit.Footnote 12 We estimate the Bayesian model using the Minnesota prior and stochastic volatility, conducting 50,000 draws and discarding the first 35,000. We test the convergence of the Gibbs chain using the Geweke statistic, which is a test whether the means of the first 120% of the accepted draws and the means of the lasts 50% are statistically different from one another. If they are not, this indicates that the model has converged. We find that from a total of 5624 variables only 687 z−values exceed the 1.96 threshold (12.22%) suggesting good convergence. We further test for serial autocorrelation and cross-unit correlation. The serial autocorrelation test in Table 3 suggests moderate correlation across residuals, which is standard when stochastic volatility is explicitly modeled as a random walk. Table 4 shows the pairwise cross-unit correlations, which are more important to be in check as correlation across the units weakens the structural analysis (Boeck et al., Reference Boeck, Feldkircher and Huber2022, Dées et al., Reference Dées, di Mauro, Pesaran and Smith2007). We find that the tests reject the notion of pairwise correlation (values below 0.1 are desired).
6. Results
We present the estimated knock-on effects of an increase in geopolitical risk in Russia on advanced economies by computing the GIRFs of all endogenous variables to a Russian GPR shock over a period of six years. In our baseline scenario, we considered the full span of data until 2024Q1 for the estimation. The observed jump in the Russian GPR index after the invasion of Ukraine amounts to seven standard deviations. Accordingly, we simulated a Russian GPR shock of this magnitude. In Figures 4–6 and 7, we depict the GIRFs for the six variables in the BGVAR. We plotted the median response as well as the 68% and 95% probability intervals, calculated based on the posterior distribution from the Bayesian estimation.
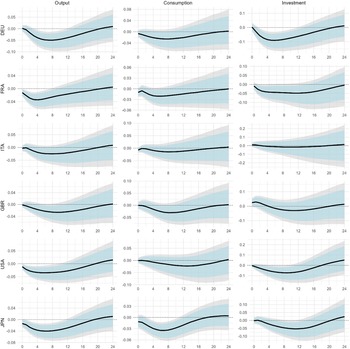
Output, consumption, and investment responses to the Russian GPR shock, 2000Q1–2024Q1.
Notes: Displayed are the GIRFs to the Russian GPR shock on impact and for the subsequent 24 quarters for Germany, France, Italy, the United Kingdom, the United States and Japan. Decimals represent percentage points (i.e., −0.02 equals a contraction of 2%). The shock is scaled to seven standard deviations, mimicking the increase in the GPR index in 2022Q2. The central median impulse response is indicated by the black line. The 68% and 95% confidence intervals (CI) are presented in the light blue and gray shaded areas, respectively.

Output, consumption, and investment responses to the Russian GPR shock, 2000Q1–2024Q1.
Notes: Displayed are the GIRFs to the Russian GPR shock on impact and for the subsequent 24 quarters for Canada, Norway, the Baltic countries, Central Eastern Europe, Nordic countries and the rest of the EEA. Decimals represent percentage points (i.e., −0.02 equals a contraction of 2%). The shock is scaled to seven standard deviations, mimicking the increase in the GPR index in 2022Q2. The central median impulse response is indicated by the black line. The 68% and 95% confidence intervals (CI) are presented in the light blue and gray shaded areas, respectively.

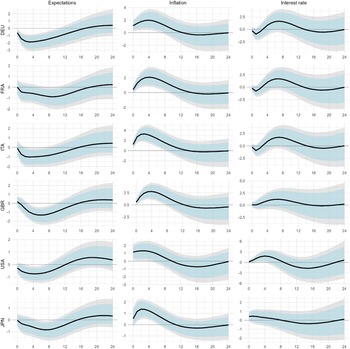
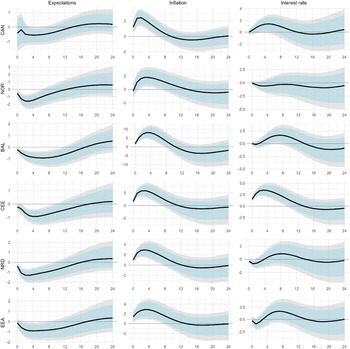
Expectations, inflation, and interest rate responses to the Russian GPR shock, 2000Q1–2023Q2.
Notes: Displayed are the GIRFs to the Russian GPR shock on impact and for the subsequent 24 quarters for Germany, France, Italy, the United Kingdom, the United States and Japan. Decimals represent percentage points (i.e., −0.02 equals a contraction of 2%). The shock is scaled to seven standard deviations, mimicking the increase in the GPR index in 2022Q2. The central median impulse response is indicated by the black line. The 68% and 95% confidence intervals (CI) are presented in the light blue and gray shaded areas, respectively.

Expectations, inflation, and interest rate responses to the Russian GPR shock, 2000Q1–2024Q1.
Notes: Displayed are the GIRFs to the Russian GPR shock on impact and for the subsequent 24 quarters for Canada, Norway, the Baltic countries, Central Eastern Europe, Nordic countries and the rest of the EEA. Decimals represent percentage points (i.e., −0.02 equals a contraction of 2%). The shock is scaled to seven standard deviations, mimicking the increase in the GPR index in 2022Q2. The central median impulse response is indicated by the black line. The 68% and 95% confidence intervals (CI) are presented in the light blue and gray shaded areas, respectively.

The BGVAR modeling results unearth several key findings. The economic knock-on effects of the Russian GPR shock are felt throughout the Western economies, whereby the BGVAR model classifies the much-elevated Russian GPR scores as a contractionary supply shock.Footnote 13 The GIRFs indicate a significant GDP decline in all countries as a result of the Russian GPR shock propagating within and across countries.Footnote 14 After the initial impact, it takes approximately four quarters for the shock’s impact on output to become significant. The decline proceeds up to 12 quarters before GDP is slowly recovering from the shock over the subsequent periods. In contrast, consumer price indices (CPI) react more quickly than GDP. The GPR shock initially causes a sharp rise in prices, with this inflationary effect lasting for nearly 12 quarters. A significant reversal in CPI occurs in most countries afterward, before tapering off towards the end of the forecast horizon. We find that the transmission process takes place via the expectation and sentiment indicators as well as via consumption and investment. Businesses adopt wait-and-see investment behavior, and consumers increase precautionary savings, exercising a drag on economic growth.Footnote 15 Finally, a GPR shock and the subsequent CPI increase also trigger a more contractionary monetary policy. Overall, the decline in investment and growth is compatible with the news shock literature and the findings of Caldara and Iacoviello (Reference Caldara and Iacoviello2022). A notable difference to the original GPR contribution is the response of fossil fuel prices. While Caldara and Iacoviello (Reference Caldara and Iacoviello2022) found a decline in oil prices as a result of GPR shocks, fossil fuel prices experienced a sharp increase in response to the Russian GPR shock. This reflects the importance of Russia for the world fossil fuel markets.
When the repercussions for the four country clusters are considered, some noticeable differences become apparent. Particularly large impacts are evident to countries geographically close to Russia and the Ukraine, e.g., Central Eastern Europe and the Baltics. Especially, the Baltics have strong economic interdependencies with Russia. As Russia has been an above-average export market, these countries have experienced weakening economic growth after sanctions were imposed against Russia following its invasion of Ukraine. In addition, Baltic countries are particularly exposed to international energy price increases. These external dependencies also explain the high inflation rates in the Baltic states. In 2022, annual CPI inflation in the Baltics (19.4% in Estonia, 18.9% in Lithuania, and 17.2% in Latvia) was the highest in the EU and significantly exceeded the euro area average (8.4%). Food and energy take up the largest share of the consumer basket in the Baltics compared to the euro area average (40% vs. 26%), whereas services take up the smaller share (27% vs. 44%). Hence, a sharp increase in energy and food prices in 2022 caused to a large extent by the Russian invasion of Ukraine raised overall inflation in the Baltics substantially more than the euro area average.
At the opposite end of the spillover spectrum are the countries most entangled from Russia’s energy markets such as the US, Canada and Japan. In these countries we observe the smallest responses of prices and output on a shock of Russia’s GPR. Norway also belongs in the list of countries least affected despite its geographical proximity, since it is a major fossil fuel exporter and less dependent on Russia’s fossil fuel resources.
In summary, one can say that the magnitude of cross-border GPR spillovers is larger for countries with above-average foreign trade with Russia, relatively high bilateral trade concentration, low export diversification, high energy import dependencies, and weaker external buffers.
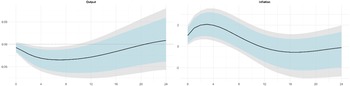
As a supplementary evaluation, Figure 8 displays the international business cycle transmission to the Russian GPR shock for the PPP-weighted aggregate of all countries and country clusters in the GVAR. The impacts may be interpreted as a proxy for the geopolitical repercussions of the Russian invasion of Ukraine on the group of like-minded sanctioning countries. The GIRFs in Figure 8 reveal a slowdown in economic growth. The contractionary GDP impact of the GPR shock becomes significant two quarters after the shock and accounts for a drop of 2-3 % per quarter, followed by a gradual recovery. The inflation impact of the contractionary supply shock is positive and strongly significant, too. Initially, prices increase by 1% per quarter up to 2% four quarters after the shock. Afterwards, the effect stays significant for another four quarters until it slowly fades out.
Weighted aggregate output and inflation impacts on the Russian GPR shock, 2000Q1–2024Q1.
Notes: The weighted aggregation was executed using purchasing power parity (PPP) USD. Displayed are the generalized impulse response functions to the Russian GPR shock on impact and for the subsequent 24 quarters. Decimals represent percentage points (i.e., −0.02 equals a contraction of 2%). The shock is scaled to seven standard deviations, mimicking the increase in the GPR index in 2022Q2. The central median impulse response is indicated by the black line. The 68% and 95% confidence intervals (CI) are presented in the light blue and gray shaded areas, respectively.

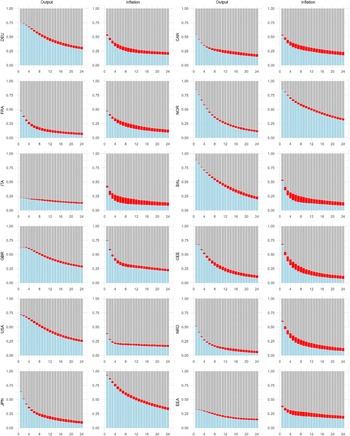
To provide a further illustration of the quantitative significance of the GPR shock, we present the FEVDs. Figure 9 shows the forecast error variance shares attributable to all domestic variables, the Russian GPR shock and the remaining foreign variables for GDP and inflation over the 24-quarter forecast horizon. In other words, the goal is to measure the vulnerability caused by GPR shocks and to explore downside risk to growth and inflation in subsequent quarters. As in the previous model evaluations, the GPR variable specifies the isolated impact of inter-state militarized GPR adjusted for energy price increases.
Generalized forecast error variance decompositions of GDP and inflation.
Notes: The figure presents results from the GEVDs, illustrating the forecast error variance proportions attributed to domestic variables (blue), the Russian GPR shock (red) and the remaining foreign variables (gray) on impact and for the subsequent 24 quarters. Displayed are the forecast error variance shares for GDP and inflation.

Zooming in on the estimation results in Figure 9, we advance two key points. First, a typical pattern in international macroeconomics emerges. Initially, a substantial portion of forecast error variance is driven by domestic factors. However, as the forecast horizon lengthens, foreign factors become more influential. In other words, the FEVDs illustrate the transmission channels of GPR shocks across countries. Second, the FEVD estimates reveal that the GPR shock has been an important driver of macroeconomic fluctuations. In terms of size, the variance shares for GDP are about 4%, while the larger variance shares for inflation amount to as much as 10%. This size comparison illustrates that the Russian invasion of Ukraine has triggered an increase in inflation in particular. Overall, the FEVDs thus underscore the importance of the geopolitical challenges originating from Russia.
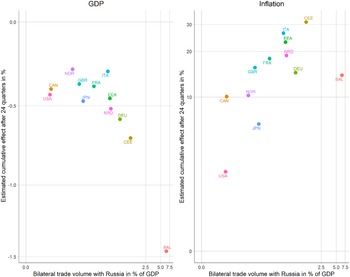
In a further evaluation step, we highlight differences across countries and explain where the heterogeneity comes from. To this end, the two scatterplots in Figure 10 illustrate the bilateral trade intensity with Russia in % of GDP in 2019 against the cumulative GPR shock impacts on GDP and inflation in %, respectively.
GPR shock differences across countries.
Notes: The scatterplot shows the cumulative IRF impact of the Russian GPR shock after 24 quarters on GDP (left panel) and inflation (right panel) in % plotted against the bilateral trade volume with Russia in 2019 in % of GDP. Bilateral trade data are sourced from the IMF.

Several cross-country differences are noteworthy. First, the graphs verify the gravity equation as a modeling framework. The left (right) panel clearly shows the expected negative (positive) impact of bilateral trade flows and distance upon the IRFs. At one end of the spectrum, countries geographically closest to the Russia-Ukraine war zone—such as BAL and CEE—exhibit the highest bilateral trade intensities with Russia and, correspondingly, the greatest economic impacts. At the other end of the spectrum, the declines in economic growth and increases in inflation are lowest in the USA, Canada and Japan. In other words, the GPR contagion effects are amplified by geographic proximity and close economic ties with Russia. Second, a significant component of the economic impact stems from the energy shock following Russia’s invasion of Ukraine. Several European economies were exposed to the Russian natural pipeline gas phase-out following Russia’s invasion of Ukraine. Countries shifted their energy sources to liquefied natural gas (LNG) and increased efficiency in their energy consumption. But there are limits to such strategies, because substitution of energy sources is difficult in the short term, and countries have remained dependent on natural gas imports for their energy use. Germany was particularly affected by the Russian pipeline natural gas import cut-off. Finally, the comparatively small GDP and inflation impacts in Norway and in the USA are inter alia due to their special status as natural gas exporters.
7. Robustness
Finally, several robustness tests are presented to complement the analysis. The supplementary tests aim to identify the specific contribution of the geopolitical shock triggered by the Russian invasion of Ukraine. To achieve a meaningful cross-comparison, the Russian GPR increase following the invasion of Ukraine is assumed to be a shock in all scenarios. In other words, possible differences in the GIRFs for different sample periods and/or BGVAR model specifications are not due to different shock sizes but rather to differing economic relationships.
As part of the multi-stage approach, the BGVAR model is first estimated up to 2019Q4, thus excluding both the COVID-19 pandemic shock and the knock-on impact of the Russian invasion of Ukraine in 2022Q1. By contrast, the illegal annexation of the Crimean Peninsula in 2014 is included in the sub-sample. Appendix A1 contrasts the generalized impulse responses and associated 95% confidence intervals up to 2019Q4 with those for the entire sample period up to 2024Q1. The head-to-head comparison reveals two findings for the pre-pandemic sample period of 2000Q1–2019Q4. First, no discernible GDP setback as a result of the hypothetical Russian GPR shock is recognizable. Second, no rise in inflation has been observed. In some countries, e.g., Germany and the US prices are even decreasing initially. These findings are reflective of the rather vaguely formulated sanctions imposed by the US, the EU, and other like-minded countries against Russia in the aftermath of the annexation of the Crimean Peninsula in 2014, including the exclusion of Russia from the G8, as well as restrictions on specific firms and individuals with close ties to the Russian government. The sanctions also included restrictions on the export and re-export of technology for the Russian defense sectors, while many other technology exports—especially those aimed at the Russian energy sector—were exempt from the trade restrictions. Russian crude oil and natural gas exports were also unaffected, partly because of the fear of Russia retaliating by cutting off natural gas supplies. Overall, the sanctions at the time were rather half-hearted and had hardly any impact.Footnote 16
In the second step of the robustness analysis, the generalized impulse responses for the baseline BGVAR model estimated over the pre-pandemic sample period 2000Q1– 2019Q4 and the pre-war sample period 2000Q1–2021Q4 were compared. The pre-war sample period 2000Q1–2021Q4 includes the COVID-19 pandemic but does not account for the impacts of the full-scale invasion of Ukraine in 2022Q1. The comparison of the GIRF to the hypothetical Russian GPR shock for both sample periods is graphically illustrated in Appendix A2. One main observation emerges. While the generalized impulse responses for the sample period from 2000Q1–2021Q4 show comparatively larger pandemic-induced downturns in GDP, these downturns are not statistically significant. Exceptions are France and the country group Rest of the Eurozone members. The responses of CPI do not indicate significant effects, either. All in all, the GPR spillovers underline that the estimation results for the entire sample period from 2000Q1–2023Q2 are not due to the effects of the COVID-19 pandemic.
The baseline BGVAR variables include economic expectation but no financial variables. In a final robustness analysis, we therefore augment the global variable set with the CBOE Volatility Index (VIX) and thus control for the VIX’s contribution to the international propagation of the Russian GPR shocks. The VIX is a forward-looking measure of expected future volatility in the stock market. It captures these expectations using prices of out-of-the-money put and call options on the S&P 500 index. Implied volatility is often seen as a way to gauge market sentiment and, particularly, the degree of uncertainty among market participants. The estimates of the baseline BGVAR model augmented with the VIX fear index over the sample period 2000Q1–2024Q4 are illustrated in Appendix A3. As in the previous robustness graphs, the GPR shock GIRFs of the baseline specification are also shown for a straightforward visual comparison. The central median GIRFs display minor changes throughout. Accordingly, the classification of the GPR shock as a supply shock is confirmed. Furthermore, the aforementioned cross-country GIRF size differences are again evident. One difference is that the volatility of the VIX variable leads to widened GIRF confidence bands. The overall conclusion, nonetheless, is that the baseline BGVAR model generalizes well to the added VIX propagation mechanism.
8. Conclusion
After years of increasing globalization, geopolitics has fundamentally changed the global economy and will continue to do so. More than anything else, the Russian invasion of Ukraine in February 2022 has altered the geopolitical landscape and triggered a seismic shift in the global order.Footnote 17 As Russia cut natural gas supplies and energy prices skyrocketed, a new preference for de-risking policies designed to avoid excessive dependencies emerged. It is, as yet, unclear how far the geoeconomic fragmentation will go. However, there is no doubt that this current period represents a significant turning point in the global order, and global economic integration is at risk of fragmentation driven by strategic considerations.Footnote 18
The unprecedented increases in Russian GPR scores after the invasion of Ukraine raise the question of the extent to which geopolitical tensions and risks threaten the outlook for industrialized economies. The multi-country BGVAR approach enables us to measure how Russian GPR disturbances propagate across interconnected countries and how this propagation mechanism evolves over time, which is a particularly appealing feature given the diversity of international countries.
As the contractionary GPR supply shocks unfold, the attendant uncertainty exercises a drag on economic growth, for example, as firms delay investment decisions and households increase precautionary savings. How these impacts will evolve in the long run is difficult to predict. The impacts are sharp at the business cycle horizon because the elasticities of substitution are lower. However, economies are adaptive. The experience of European countries in dealing with the Russian natural gas cut-off is a case in point.Footnote 19 The results from this study have notable implications for geopolitical policy designs that aim to rearrange international supply chains to make them less vulnerable to geopolitical tides. An important economic policy question in this context will be whether a “de-risk” strategy can be achieved without a prolonged growth-reducing “decoupling.”
Funding statetment
No funding was received to assist with the preparation of this manuscript and the authors declare no competing financial or personal interests.
Code availability
Code and data are available on request. Please contact the corresponding author.
Appendix A
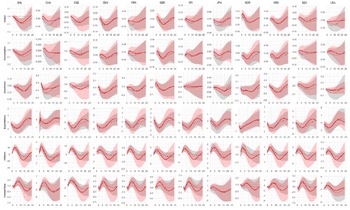
Generalized Impulse Responses to the Russian GPR Shock, 2000Q1–2019Q4 versus 2000Q1–2024Q1.
Notes: Displayed are the GIRFS to the Russian GPR shock on impact and for the subsequent 15 quarters. Decimals represent percentage points, i.e., −0.02 equals a contraction of 2%. The shock is scaled to seven standard deviations, mimicking the increase in the GPR index in 2022Q2. The central median impulse responses are given by the solid red (data until 2019Q4) and dotted black (data until 2024Q1) lines. The 95% confidence intervals are presented by the gray and red shaded areas, respectively. The countries are labeled with three-digit ISO codes. For the compilation of the country clusters, see Table 1.

Appendix B
Generalized Impulse Responses to the Russian GPR Shock, 2000Q1–2019Q4 versus 2000Q1–2021Q4.
Notes: Displayed are the GIRFS to the Russian GPR shock on impact and for the subsequent 15 quarters. Decimals represent percentage points, i.e., −0.02 equals a contraction of 2%. The shock is scaled to seven standard deviations, mimicking the increase in the GPR index in 2023Q2. The central median impulse responses are given by the solid red (data until 2019Q4) and dotted black (data until 2024Q1) lines. The 95% confidence intervals are presented by the gray and red shaded areas, respectively. The countries are labeled with three-digit ISO codes. For the compilation of the country clusters, see Table 1.

Appendix C
Generalized Impulse Responses to the Russian GPR Shock in the Baseline Model versus the VIX-Augmented Model.
Notes: Displayed are the GIRFS to the Russian GPR shock on impact and for the subsequent 15 quarters in the baseline BGVAR Model (dotted black lines) versus the VIX-augmented BGVAR model (solid red lines). The sample period is 2000Q1–2024Q4. Decimals represent percentage points, i.e., −0.02 equals a contraction of 2%. The shock is scaled to seven standard deviations, mimicking the increase in the GPR index in 2023Q2. The 95% confidence intervals are presented by the gray and red shaded areas, respectively. The countries are labeled with three-digit ISO codes. For the compilation of the country clusters, see Table 1.


 Open access