


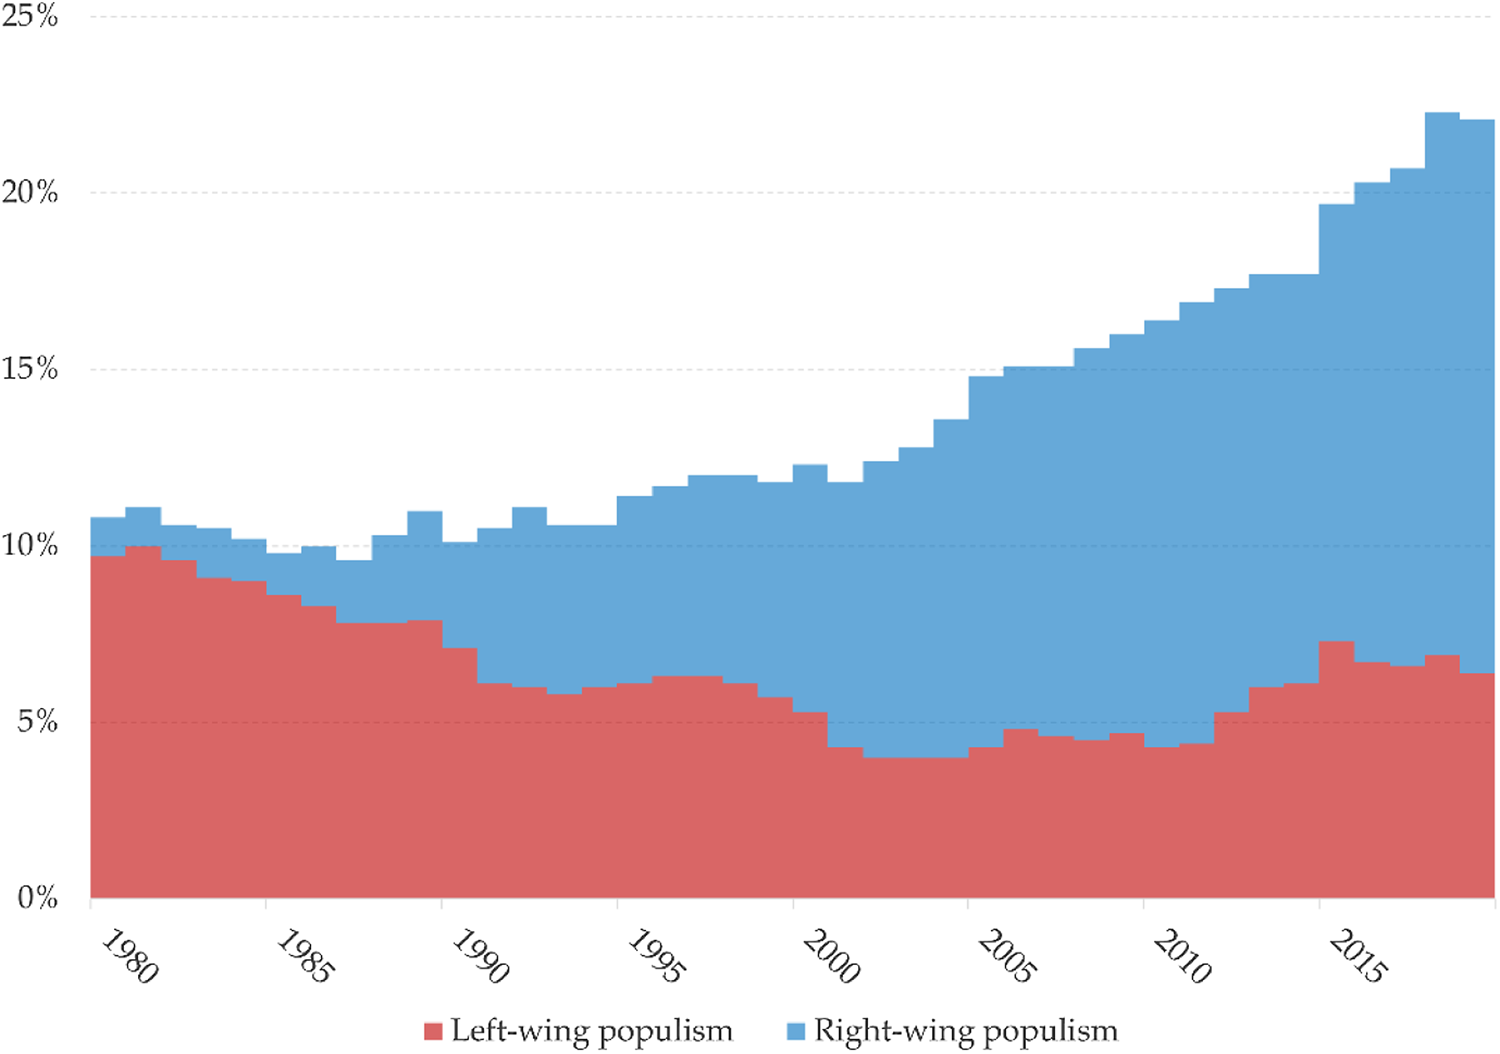
The explosive growth of populism has transformed politics to its core. In the post-Second World War era, dominated by liberal consensus, populism seemed primarily a Latin American phenomenon. Then, in the 2000s, populism – especially its right-wing variety – began to spread in Europe, as Fig. 1 shows. Its prominence jumped significantly with the 2014 European Parliament election, elevating UKIP and the Front National to the centre of attention, followed by the election of populist governments in Greece and Poland in 2015. Then, in 2016, populism reached the heartlands of the current world order with the Brexit referendum and the election of President Donald Trump.
The explosion of populism in Europe.
Notes: Aggregated populist votes 1980–2019 in 33 European countries, including the 28 members of the EU plus Iceland, Norway, Switzerland, Serbia, and Montenegro. Non-democracies and semi-authoritarian countries are excluded. Source Timbro Authoritarian Populism Database, https://populismindex.com/ (accessed 18 February 2023)

The causes of populism are at the heart of the most significant political and social science debates. One narrative contends that economic globalization resulted in real suffering among less-educated working-class voters, catalyzing populism (Colantone and Stanig Reference Colantone and Stanig2018c; Rodrik Reference Rodrik2021). Another narrative contends that populism is an adverse reaction to cultural progressivism and that economic factors are not relevant or only relevant symbolically through perceptions of loss of cultural status (Margalit Reference Margalit2019; Norris and Inglehart Reference Norris and Inglehart2019; Sides et al. Reference Sides2019). Even though the evidence suggests that the generational change argument suggested by the canonical book of Norris and Inglehart (Reference Norris and Inglehart2019) does not hold empirically (Grasso et al. Reference Grasso2019; Schäfer Reference Schäfer2022), the cultural narrative nevertheless seems to be particularly influential. In their review of the structural determinants of right-wing populist voting, Amengay and Stockemer (Reference Amengay and Stockemer2019, 35) concluded that the ‘results do not lend support to the economic hardship breeds extremism hypothesis’. Walter (Reference Walter2021, 9) concluded her review by saying, ‘the evidence that those directly hurt by globalization are more likely to vote for anti-globalization parties or proposals is mixed’. Finally, Berman (Reference Berman2021, 75–76) reached a similar conclusion, highlighting that ‘the evidence linking individual economic grievances to populist voting is not particularly strong’.
We enter the debate on the populist backlash against economic globalization by presenting the first systematic review and meta-analysis of the causal evidence that economic insecurity significantly catalyzes populism. A key factor contributing to the widespread perception concerning the lack of association between economic factors and populism is the lack of clarity about the definition of economic factors. This vagueness manifests in the one-sided focus on individual-level economic hardships in the past and the neglect of contextual-level economic shocks and the temporal dimension; that is, changes in economic factors as opposed to their level.
However, a lack of clear, cross-sectional, static association between past material deprivation and populism does not imply that economic factors are unimportant. As Mughan and Lacy (Reference Mughan and Lacy2002, 513) noted, economic insecurity is ‘a novel form of economic discontent that is distinctive … from retrospective evaluations of short-term economic performance’. We need a more fine-grained approach to the economics of populist demand, such as economic insecurity. Recent studies have shown that economic insecurity ‘has risen steadily since the mid-1980s for virtually all sub-groups of Americans’ (Hacker et al. Reference Hacker2014, S5). Insecurity is also widespread in Europe, extending ‘across income groups and occupational classes, reaching into the middle classes’ (Ranci et al. Reference Ranci2021, 539). Therefore, we focus on economic insecurity as the causal factor.
Systematic reviews (Dacombe Reference Dacombe2018) and meta-analyses (Borenstein et al. Reference Borenstein2009) are increasingly popular in political science; they explore topics such as immigration and support for anti-immigration parties (Cools et al. Reference Cools2021), the effect of framing on political attitudes and behavior (Amsalem and Zoizner Reference Amsalem and Zoizner2022), and the effect of the size of the legislature on public spending (Freire et al. Reference Freire2023). Although the term systematic review is sometimes used to denote narrative reviews conducted with a systematic intent (Obinger and Petersen Reference Obinger and Petersen2017), systematic reviews differ from narrative reviews in important ways. A systematic review ‘locates existing studies, selects and evaluates contributions, analyzes and synthesizes data, and reports the evidence in such a way that allows reasonably clear conclusions to be reached about what is and is not known’ (Denyer and Tranfield Reference Denyer, Tranfield, Buchanan and Bryman2009, 672). By conforming to the standards expected of primary research, systematic reviews can significantly reduce bias, improve transparency, and be subject to replication (Dacombe Reference Dacombe2018, 149). They also help accumulate knowledge and ‘provide a basis for planning and interpreting new primary research’ (Gough et al. Reference Gough and Gough2012, 3).
We combine an academic database search with a backward citation search of the eligible studies and a review of recently published narrative reviews. We include studies focusing on populist political behavior as the outcome and economic insecurity as the treatment and follow a research design dedicated to identifying causality. We reviewed and synthesized thirty-six studies fulfilling our inclusion criteria, extracting 144-point estimates and studying their precision. We numerically summarize the main results and formally test for publication bias. All thirty-six quasi-experimental studies report a robust causal link between economic insecurity and populism. We also identify significant geographic, methodological, and disciplinary divisions in the literature; the association is robust across these dimensions of heterogeneity. We find significant evidence of publication bias, but the causal association between economic insecurity and populism remains significant after controlling for it.
Our paper proceeds as follows. First, we describe our systematic search strategy and define populism, economic insecurity, and quasi-experiments. After describing the process of inclusion and exclusion, we present the results in three sections. First, we overview the main results and the geographic, methodological, and disciplinary divisions. Second, we synthesize the key results using the ‘vote counting’ approach, which is suitable for an exploratory numerical summary of findings from widely heterogeneous studies. Third, we perform formal statistical tests for publication bias. We start by testing the density discontinuity of the distribution of t-statistics. Next, we estimate a partial correlation coefficient to handle heterogeneity in the treatment and outcome variables and conduct a funnel plot asymmetry test. Finally, we present the conclusions.
Systematic Review Methodology
Search Strategy
We follow the updated 2020 version of the Preferred Reporting Items for Systematic Reviews and Meta-Analyses (PRISMA) guidelines (Page et al. Reference Page2021). These guidelines set standards for robust, transparent, and replicable systematic reviews. Here, we summarize the key search parameters and present a detailed overview of the search strategy in Supplement S1.
We searched three academic databases: Web of Science, Scopus, and EBSCO Discovery Service. The searches occurred between 26 January and 6 February 2022 and were repeated between 19 and 25 July 2022. We included a combination of keywords covering the outcome of interests (populism), the treatment (economic insecurity), and the research design (causal inference). Table S1.1 in the Supplement (p.1) shows the whole search strategy verbatim.
We searched for studies that analyze populist political behavior in terms of outcome. Much of the culture versus economy debate is centred on far-right or right-wing populism. However, left-wing populism is also important, especially in Latin America and Southern Europe. Some posit that different forms of populism might be competitive alternatives. For example, the availability of left-wing populism might reduce the demand for right-wing populism. Therefore, we focus on populism in general, not just right-wing populism. This approach allows us to analyze whether the literature identified significant differences in the determinants of left-wing and right-wing populism.
The most conventional approach in the literature identifies populism as a ‘thin-centred ideology’ that frames the fundamental political cleavage between the elite and the pure people (Mudde Reference Mudde2007). The strengths of this approach are that it is agnostic about the causes and the specific policy content of populism; is broad enough to capture a wide range of the phenomenon, such as left- and right-wing; inclusionary or exclusionary populism; and specific enough to exclude non-populism. Despite the ubiquity of this definition, empirical researchers often include parties influenced by the notion of anti-establishment politics, a term closely related to populism (Barr Reference Barr2009; Mudde Reference Mudde2007).Footnote 1 Our aim is not to clarify the concept of populism or decide between different approaches but to capture a wide variety of populist outcomes to reflect the heterogeneity of the literature. Thus, our definition includes the radical left, the radical right, and historical precedents of populism, such as fascism in Europe or Latin-American import-substitution populism, such as Peronism (Guriev and Papaioannou Reference Guriev and Papaioannou2022, 11–13).
We started from a ‘nearest neighbor’ systematic review and extracted the search string from Hunger and Paxton (Reference Hunger and Paxton2022), whose search strategy relied on the word stem ‘populis*’. In addition to populism, we included keywords that cover anti-establishment politics and different versions of the radical right and the radical left to cover different valances of populism, even if the word populism is not mentioned in the abstract or title.
Economic insecurity captures multiple dimensions of vulnerability and relies on a dynamic focus to analyze change across time (Whelan and Maître Reference Whelan and Maître2005). We define economic insecurity as the ‘risk of economic loss faced by workers and households as they encounter the unpredictable events of social life’ (Western et al. Reference Western2012, 342). Western et al. argue that these changes are linked to adverse events or external shocks (originating in the labor market, the housing market, the financial market, over-indebtedness, health events, etc.). Thus, we include search terms to cover various forms of material hardship and other sources of economic insecurity, such as ‘economic uncertainty’, ‘financial uncertainty’, or ‘labor market uncertainty’. Because ‘citizens’ economic worries largely track exposure to substantial economic shocks’ (Hacker et al. Reference Hacker2013, 23), we also used keywords that capture upstream shocks, such as ‘trade shocks’, ‘import exposure’, austerity, or robotization.
Studies following a causal inference research design (also called ‘natural experiments’ or ‘quasi-experiments’) ‘aim to make causal inferences about the effects of an exposure or interventionFootnote 2 of interest on outcomes by exploiting exogenous variation in treatment assignment’ (Glanville et al. Reference Glanville2017, 68). Studies following a causal inference research design try to identify causality and mimic experimental designs by identifying an exogenous ( ‘as good as random’) source of variation in treatment assignment. However, ‘quasi-experiments’ are not experiments; they rely on several identifying assumptions that are sometimes credible and sometimes more demanding.Footnote 3 Cools et al. (Reference Cools2021) conducted a systematic review of the causal evidence on populist right voting but did not provide an exact search string, so we extracted the search string from El Soufi and See (Reference El Soufi and See2019). We extended their string with other keywords based on causal inference textbooks (Cunningham Reference Cunningham2021; Huntington-Klein Reference Huntington-Klein2022) – instrumental variables, difference-in-differences, regression discontinuity, synthetic control designs, survey experiments, field experiments, and randomized controlled trials.Footnote 4
Constructing the search this way runs the risk of missing studies that do not refer to their causal design in the title or abstract. We minimized this risk by relying on two additional search strategies described below. First, we conducted a backward citation search based on the bibliography of the seventeen studies we identified after screening and eligibility. Second, we reviewed the bibliographies of recently published narrative reviews on populism.
Inclusion and Exclusion
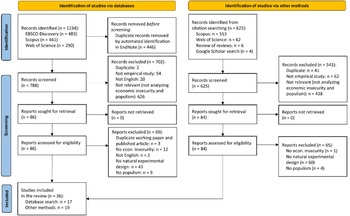
The PRISMA flow diagram in Fig. 2 describes the screening process. Our initial database search identified 1,234 studies: 483 through EBSCO Discovery, 461 through Scopus, and 290 through Web of Science. Of these, we identified 446 duplicates using automated identification in EndNote. This left 788 studies for screening. In addition, we identified 625 records through citation searching (553 on Scopus, 62 on Web of Science, and 6 through review of reviews) and 4 further studies through Google Scholar. These 625 studies were included in the second round of screening based on the inclusion and exclusion criteria detailed below. We included studies if they fulfilled the following inclusion criteria:
(a) the outcome variable is directly related to populist political behavior or orientation,
(b) the treatment is related to economic insecurity broadly defined,
(c) the study identifies a causal association through a quasi-experiment, field experiment, or survey experiment,
(d) the study relies on original, primary empirical research.
PRISMA flow diagram.

Screening the titles and abstracts of the 788 studies identified through primary database search, we excluded 702 studies. This left 86 studies whose full texts were retrieved and assessed for eligibility by reading the whole study. At this stage, we excluded 69 studies. However, we identified 17 eligible studies during the first round.
As mentioned above, we also identified 625 studies for screening through a backward citation search and a review of reviews. After screening and eligibility, we searched the bibliographies of the 17 studies we identified. We used Scopus and Web of Science to extract the references cited and found 553 further studies in Scopus and 62 in Web of Science. We reviewed the bibliographies of recently published reviews on populism (Berman Reference Berman2021; Guriev and Papaioannou Reference Guriev and Papaioannou2022; Hunger and Paxton Reference Hunger and Paxton2022; Mansfield et al. Reference Mansfield2021; Rodrik Reference Rodrik2021; Scheiring Reference Scheiring and Sajó2021; Tuğal Reference Tuğal2021; Walter Reference Walter2021) and identified 6 further studies for screening. Finally, we identified 4 studies through a Google Scholar citation search. Of these 625 studies, we excluded 541 during screening on abstract and title. We retrieved 84 full-text studies for a detailed analysis of eligibility. Of these, we excluded 65. This way, the citation search and review of reviews yielded 19 eligible studies for inclusion.
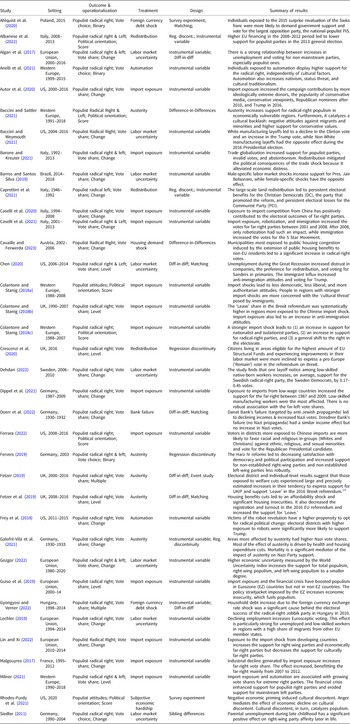
We extracted the main study parameters into a summary table, which included author(s), title, countries analyzed, sampled units, sample size, study time, primary outcome, treatment, level of the treatment and outcome variable, experimental design, data structure, modelling details, approach to missingness, and summary results, among others. This detailed review table is available as part of the replication data. Altogether, we found thirty-six eligible studies, as summarized in Table 1.
Overview of the studies

Overview of the Literature
We found significant heterogeneity in several dimensions. Most studies analyze Western Europe and North America, where most authors are located. Eastern Europe outside the EU, Latin America (except Brazil), Asia, and Africa are neglected, as Tuğal (Reference Tuğal2021) and Mansfield et al. (Reference Mansfield2021) noted.
This geographic skew leads to a neglect of specific sources of economic insecurity. Shocks related to robotization are concentrated in the most advanced economies (Anelli et al. Reference Anelli2021; Frey et al. Reference Frey2018). Eurozone countries were more exposed to import shocks than non-Eurozone European countries (Guiso et al. Reference Guiso2019). However, this does not mean that other forms of globalization shock were not crucial in emerging economies. Ahlquist et al. (Reference Ahlquist2020) and Gyongyosi and Verner (Reference Gyongyosi and Verner2022) show that foreign currency debt shocks were important factors behind the rise of right-wing populism in Eastern Europe, while Barros and Santos Silva (Reference Barros and Santos Silva2019) show that male-specific labor market insecurity fuelled support for Bolsonaro.
Most studies analyze the populist radical right in terms of the outcome variable. A smaller group of studies explores the whole populist spectrum (both left and right), some studies analyze populist attitudes, but only one concentrates on the populist left. Instrumental variables dominate the field in primary causal inference design, but difference-in-differences and regression discontinuity designs are also popular. Economists strongly prefer contextual-level measurements of populism, while political scientists are more open to individual-level variables. These disciplinary differences might influence substantive findings. Berman (Reference Berman2021, 75–6) recently noted that economic grievance-based explanations are stronger at the contextual level, while cultural explanations are stronger at the individual level. Supplement S2 (pp.3–6 of the online Supplement) presents a detailed overview of the studies' geographic, methodological, and disciplinary heterogeneity.
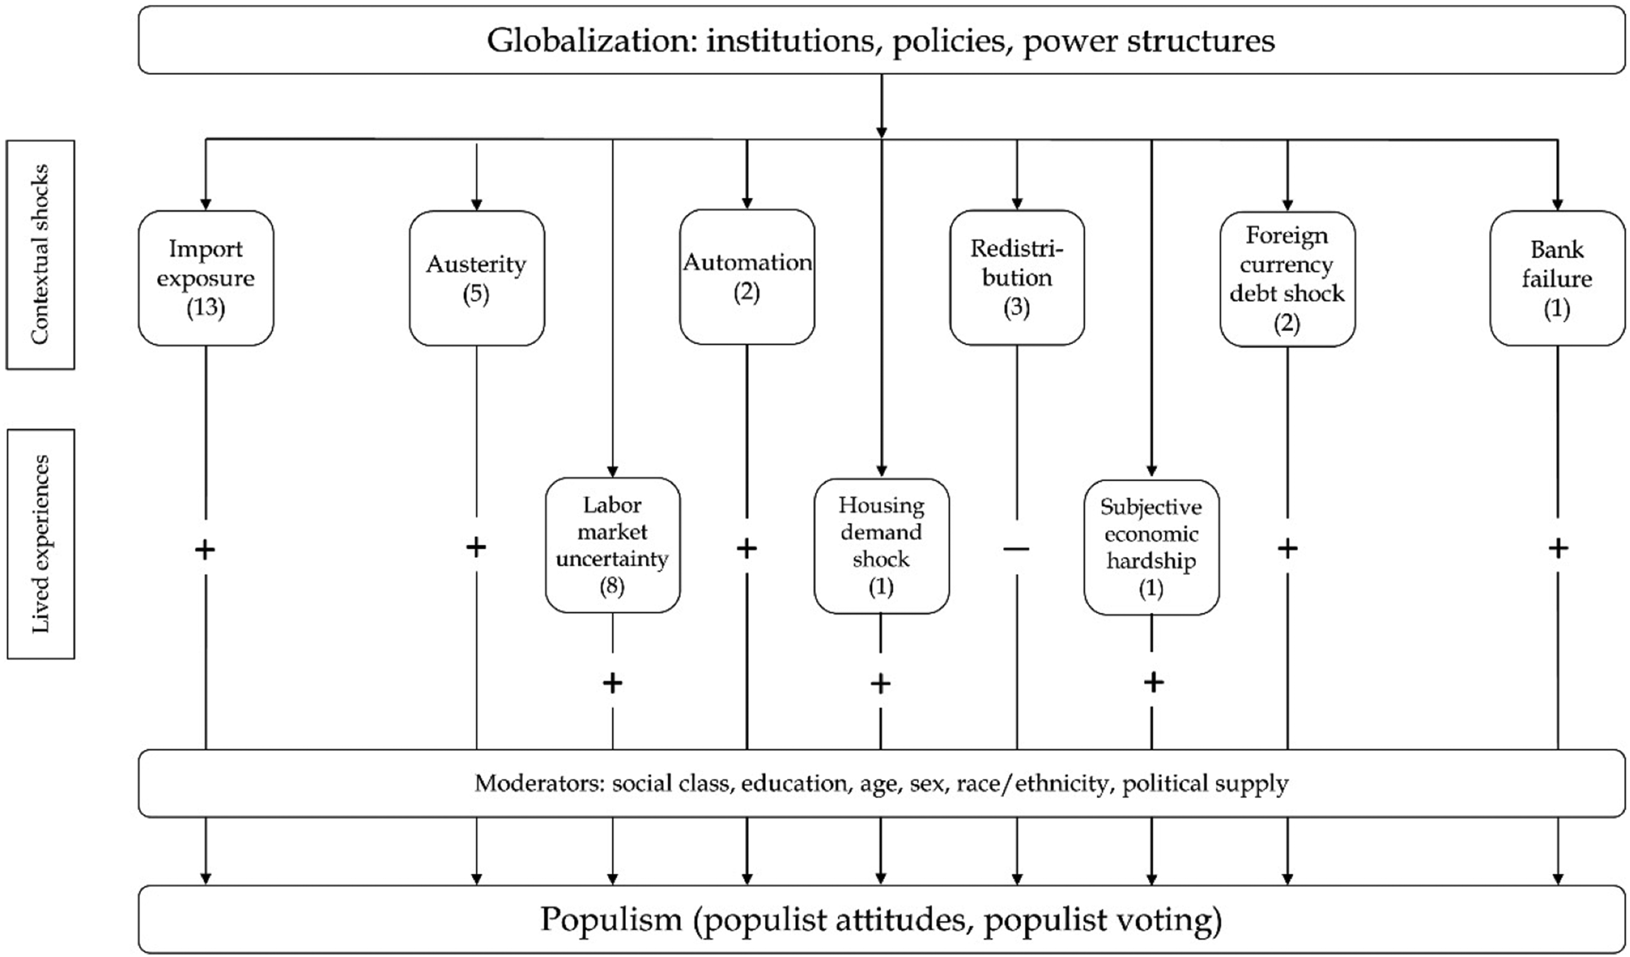
To synthesize the substantive results of the review, Fig. 3 presents a conceptual overview of the multi-channel causal relationship between economic insecurity and populism based on the reviewed studies (with the number of studies assessing the specific treatment in parentheses). Regarding the experimental treatment, the source of economic insecurity and import exposure (‘the China shock’) stands out in the number of studies that analyze it. Labor market uncertainty is the second most often analyzed cause. Other treatment variables focus on austerity, redistribution, automation, foreign currency debt shocks, subjective economic hardship, bank failure, and housing demand shock. The literature also identified important moderators, such as class, education, age, sex, race/ethnicity, political supply, and social security policies. These moderators influence how the lived experience of economic shocks translates into populism. Supplement S3 (pp.10–16) presents a detailed narrative overview of the literature focusing on the main causes of the populist backlash.
The multi-channel causal relationship between economic insecurity and populism.

All thirty-six studies report a robust causal link between economic insecurity and populism. Several studies report a strong effect. A recurring effect is that economic shocks and economic insecurity explain around one-third of recent surges in populism. Several studies also showed that higher economic security through redistribution dampens voters' enthusiasm for populism (Albanese et al. Reference Albanese2022; Crescenzi et al. Reference Crescenzi2020). As Guiso et al. (Reference Guiso2019, 101) concluded, ‘if one wants to defeat populism, one must first defeat economic insecurity’.
Some studies suggest that changes in political supply influence how economic insecurity translates into political outcomes. For example, once the Five Star Movement appeared in Italy, it successfully attracted the votes of trade victims previously channeled by radical-right parties. Thus, when presented with an alternative, victims of trade shocks do not necessarily choose a radical right populist party (Caselli et al. Reference Caselli2021). The United States offers an opposite example. Here, the Democrats benefited from the discontent of trade victims during the presidential elections before 2012. However, since 2012, Republicans have become more successful in attracting the victims of trade shocks, leading to Trump's 2016 victory (Autor et al. Reference Autor2020; Che et al. Reference Che2016). This aligns with the extant literature showing that centre-left parties are particularly vulnerable to moving toward the right in economic policy (Bagashka et al. Reference Bagashka2022; Fervers Reference Fervers2019; Mudge Reference Mudge2018; Snegovaya Reference Snegovaya2024). Without left-wing progressive policies and narratives, radical-right populists can mobilize dissent through culturally symbolic issues, using the nation as an imagined solidarity community that protects against globalization (Berman and Snegovaya Reference Berman and Snegovaya2019; Scheiring Reference Scheiring2020).
Six studies find that the cultural backlash is not an alternative mechanism but a mediator. For example, Anelli et al. (Reference Anelli2021) find that robotization increases nativism, status threats, and cultural traditionalism in Europe. Autor et al. (Reference Autor2020) find that import exposure in the United States (US) in the 2000s increased the popularity of the conservative media and conservative viewpoints. Using an innovative survey experiment, Rhodes-Purdy et al. (Reference Rhodes-Purdy2021) show that economic decline induces cultural discontent mediated by economic anger, while cultural discontent, in turn, catalyzes populism. Colantone and Stanig (Reference Colantone and Stanig2018a) find that economic insecurity through import exposure leads to a shift towards anti-liberal values in the domain of politics but not in the extra-political domain, such as child-rearing. This result implies that the populist backlash is neither a result of a persistent authoritarian outlook nor an expression of a general shift in the direction of the authoritarian personality. Instead, Colantone and Stanig (Reference Colantone and Stanig2018a) argue that scepticism towards liberal values and liberal democracy is a political manifestation of distress driven by economic insecurity. Of course, the existence of such mediation, where economic insecurity is the primary cause, does not mean that cultural factors are not important; they can be independent primary causes, too. It means that juxtaposing economy and culture is less productive than exploring their interactions.
Studies following causal inference designs are considered among the highest quality studies in the universe of observational studies. Therefore, we did not perform a systematic quality assessment. However, some studies employ less effective identification strategies that require more demanding assumptions. The field is riddled with methodological controversies and frequent innovations. Ultimately, the credibility of causal inference designs depends on the authors' ability to prove the exogeneity of the treatment. As consumers of empirical research, we should always consider these design limitations.
It is rare for a systematic review to yield such conclusive results, with all studies pointing in the same direction. This unanimity might reflect publication bias. Publishing only results that find a significant effect disturbs the quality and reliability of the overall picture emerging from the literature (Brodeur et al. Reference Brodeur2020; Thornton and Lee Reference Thornton and Lee2000). To maximize the chances of finding null results, we searched the available grey literature, including working papers and PhD theses that are more likely to report null results than published articles or conference papers (Thornton and Lee Reference Thornton and Lee2000, 211). However, non-published papers also all report a significant positive effect of economic insecurity on populism.
Meta-Analysis
Because of the considerable heterogeneity in study designs, populations, treatments, and outcomes, comparing the effect sizes across studies relying on a standard meta-regression is not appropriate. To tackle this challenge, we rely on two different approaches. First, we quantify the results using the widely used but somewhat naïve ‘vote counting’ approach, which counts the number of significant and insignificant associations (Amengay and Stockemer Reference Amengay and Stockemer2019; Bushman and Wang Reference Bushman, Wang and Cooper1994; Geys Reference Geys2006). While this method has important limitations (Stanley and Doucouliagos Reference Stanley and Doucouliagos2012, 43–5), it allows for an exploratory numerical summary of results across a wide range of heterogeneous studies.
Second, to formally test for publication bias and further analyze the heterogeneity in the results, we rely on a standardization procedure borrowed from recent meta-analysis literature by calculating a partial correlation coefficient (Borenstein et al. Reference Borenstein2009; Brodeur et al. Reference Brodeur2020; Filomena and Picchio Reference Filomena and Picchio2023; Gechert and Heimberger Reference Gechert and Heimberger2022; Jin et al. Reference Jin2015; Stanley and Doucouliagos Reference Stanley and Doucouliagos2014). We evaluate publication bias by conducting a funnel-asymmetry and precision-effect test and analyzing the density discontinuity of t-statistics.
We constructed a meta-dataset by including the main estimates reported in the thirty-six studies, which included 144 estimates from the studies (see Supplement S4 for the inclusion criteria). The number of estimates per study ranged between a minimum of 1 and a maximum of 10. For each estimate, we extracted the t-statistic and normalized their sign so that a positive sign means an increase in populism derived from increased economic insecurity.Footnote 5
‘Vote Counting’ Approach Statistics
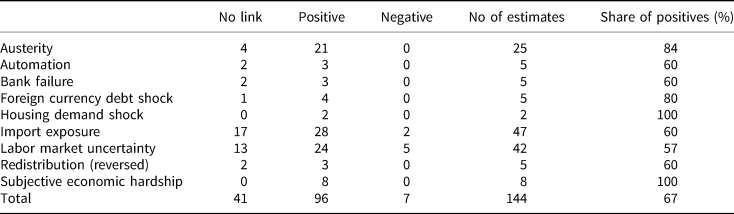
We counted the number of significant positives (sometimes called ‘successes’), significant negatives (sometimes called ‘anomalies’), and insignificant associations (also called ‘failures’) and calculated the share of positives (sometimes called the ‘success rate’ of the specific variable). The higher the share of positives, the more confident we can be in uncovering a ‘true’ association. We summarize the results of this ‘vote counting’ approach in Table 2. While each study reports at least one model that shows a significantFootnote 6 positive association, some estimates diverge from this overall picture. Of the 144 estimates, 96 show a significant positive association, 7 show a significant negative association, and 41 show no significant association. The negative anomalies come from various sub-samples, revealing interesting patterns of heterogeneity.
Summarizing the effect of economic insecurity on populism

For example, Guiso et al. (Reference Guiso2019) find that import exposure boosts populism in Eurozone countries but find a significant negative link in non-Eurozone countries (mainly Eastern Europe).Footnote 7 Another interesting example is Baccini and Weymouth (Reference Baccini and Weymouth2021), who find that non-white voters' exposure to deindustrialization led to higher support for the Democrats in 2016, while white voters exposed to deindustrialization turned to the Republicans to support Trump. These differences show that identity politics and economic dislocations interact in producing support for populism. Barros and Santos Silva (Reference Barros and Santos Silva2019) also find that gender identity interacts with labor market insecurity in Brazil: men exposed to labor market insecurity were significantly more likely to vote for Bolsonaro. The opposite is true for women.
Table 2 also shows that each treatment has a share of positives exceeding 50 per cent, with the average share reaching 67 per cent. In other words, the modal category is ‘success’ for each treatment. The sample size is small because the studies/treatments were not randomly selected. Consequently, the differences are significant across treatments, and we must be cautious when comparing the share of positives across the treatment categories. The variability across the treatments could reflect a mix of true effect heterogeneity, publication bias, specification bias, or differences in sampling. Automation, bank failure, import exposure, labor market uncertainty, and redistribution (reversed) seem more ambiguous predictors of populism than economic insecurity on ‘average’. Austerity, foreign currency debt shock, housing demand shock, and subjective economic hardship seem less ambiguous predictors to predict populism more robustly.
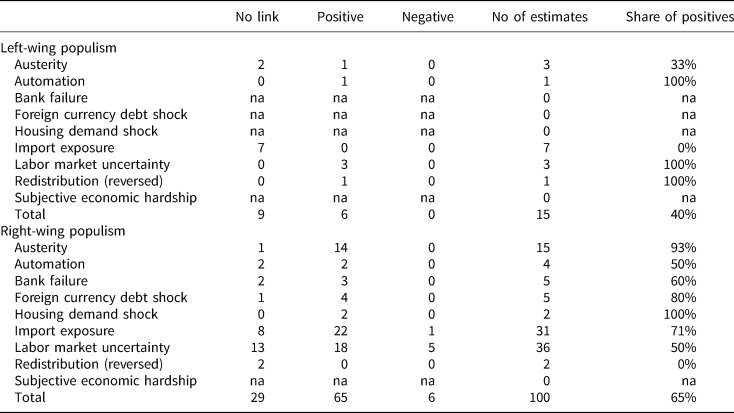
Table 3 shows the results broken down by the type of populism. Altogether, 15 models were estimated for left-wing and 100 for right-wing populism. The remaining 29 estimates do not differentiate between left and right. Overall, economic insecurity seems to predict right-wing populism more robustly (percentage of positives 65 per cent) than left-wing populism (40 per cent). Automation, labor market uncertainty, and redistribution might seem most relevant for left-wing populism. Austerity, foreign currency debt shocks, housing demand shocks, and import exposure seem more relevant for right-wing populism. The same caveat applies: we must be careful when comparing the share of positives across the treatment categories.
The effect of economic insecurity on left-wing and right-wing populism

Publication Bias
Figure 4 plots the density function of t-statistics of the estimates included in the meta-analysis. If there is no publication bias, there should be no significant discontinuities in the distribution at critical values such as t = 1.96 (when the p-value would equal 0.05). Looking at Fig. 3, we can infer a discontinuity in the distribution of t-values around these critical points.
Density discontinuity of the t-statistics.
Notes: The solid lines represent the non-parametric local polynomial density estimator of Cattaneo et al. (Reference Cattaneo2018). The colored areas around are 95 per cent confidence intervals. The null hypothesis of no discontinuity at t = 1.96 cannot be rejected at a 5 per cent significance level (p-value = 0.607). The top and bottom 1 per cent of the t-statistic distribution were excluded from the graph for illustrating purposes but not from the density estimator and the test.

However, using the non-parametric local polynomial density estimator with robust bias-correction of Cattaneo et al. (Reference Cattaneo2018), we cannot reject the null hypothesis of no discontinuities at a value t = 1.96 (p-value of the test = 0.607). Following Filomena and Picchio (Reference Filomena and Picchio2023), we ran a two-sided binomial test for the null hypothesis of equal mass across different windows around the t = 1.96 cut-off. In this case, all tests reject the null hypothesis and point toward significant publication bias (see Table S4.1 on p.17 of the Supplement).
Does publication bias invalidate the overall association? The funnel plot test can provide a statistical answer. However, as already noted, the causal effect of economic insecurity on populism is not directly comparable across the models used in each study. Therefore, we calculate the partial correlation coefficient as a standardized ‘effect size’ to make the estimates comparable. This measure has been used in previous social science meta-analyses (Filomena and Picchio Reference Filomena and Picchio2023; Stanley and Doucouliagos Reference Stanley and Doucouliagos2014) and is calculated as follows:

where t i is the t-statistic from the causal estimate, and dk i is the degrees of freedom in the model from which the estimate is derived. Since the number of covariates is not reported in most of the models, we substitute dk i by the number of observations minus one, following Filomena and Picchio (Reference Filomena and Picchio2023). The partial correlation coefficient p i varies from −1 to 1. A p i greater (lower) than zero means that populism increases (decreases) because of economic insecurity. p i measures the strength of the statistical significance of the effect, although it does not have a direct quantitative meaning of the effect size (Filomena and Picchio Reference Filomena and Picchio2023; Gechert and Heimberger Reference Gechert and Heimberger2022; Stanley and Doucouliagos Reference Stanley and Doucouliagos2014).Footnote 8
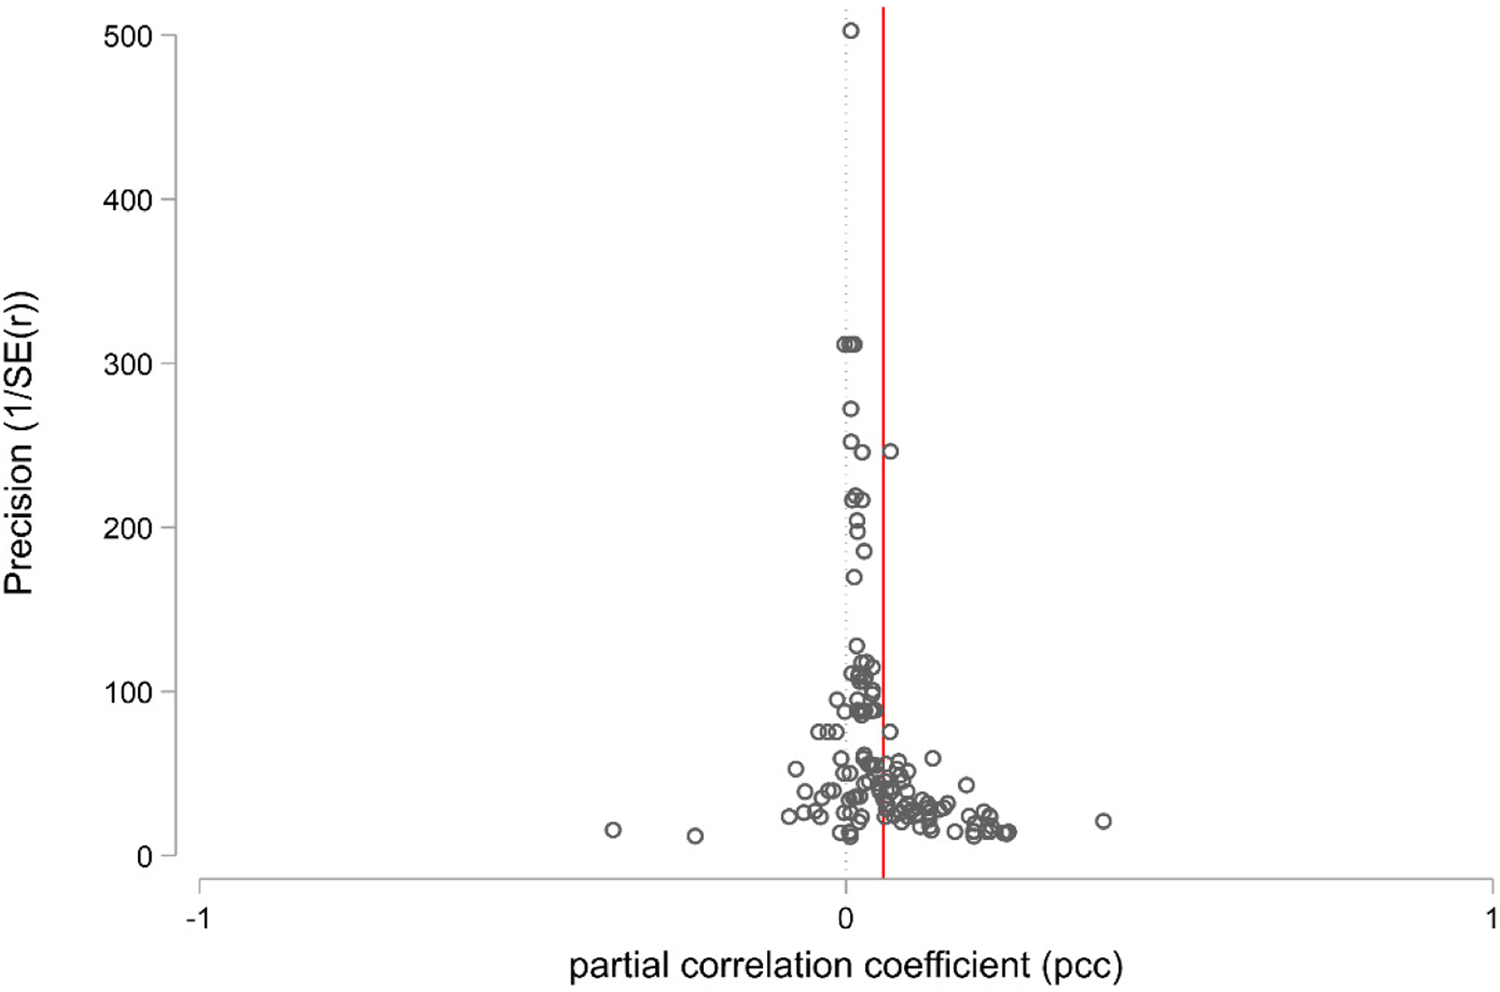
The inverse funnel plot in Fig. 5 serves as a visual inspection test for publication bias. The funnel plot in Fig. 5 does not seem to be fully symmetric.Footnote 9 Whereas more precise estimates (at the top) seem closer to zero, less precise estimates (at the bottom) are concentrated on the right, showing a stronger effect of economic insecurity on populism. This could indicate publication bias.
Inverse funnel plot.
Notes: Each circle represents the different estimates included in the meta-analysis (n = 144). The red vertical line represents the mean of the partial correlation coefficient (p = 0.0579).

The Funnel Asymmetry Precision Effect test (FAT-PET) formally tests for a correlation between the partial correlation coefficient and its standard error. It is based on the following regression:

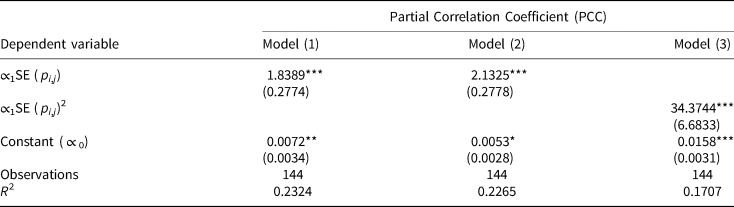
where p i,j is the partial correlation coefficient of the estimate I from study j, SE (p i,j) is the standard error, and e i,j is the error term. If ∝1 = 0, there is no evidence for publication test (Funnel Asymmetry Test, FAT). At the same time, if ∝0 ≠ 0, we can conclude that there remains a ‘true’ effect after accounting for publication bias (Precision-Effect test) (Gechert and Heimberger Reference Gechert and Heimberger2022; Stanley and Doucouliagos Reference Stanley and Doucouliagos2014). To account for heteroskedasticity, we estimate equation (2) by weighted least squares (WLS) using the inverse of the squared standard errors as weights (Gechert and Heimberger Reference Gechert and Heimberger2022; Stanley and Doucouliagos Reference Stanley and Doucouliagos2014). We cluster standard errors at the study level j to account for correlation between estimates from the same study.
Table 4 reports the results of the regression. Model (1) reports the simple model. Model (2) reports an instrumental variable estimation using the square root of the number of observations as an instrumental variable since SE (p i,j) might be endogenous due to measurement error (Filomena and Picchio Reference Filomena and Picchio2023). In Model (3), we substitute SE (p i,j) by its square to account for non-linearities, as this was the preferred model in the presence of publication bias (Stanley and Doucouliagos Reference Stanley and Doucouliagos2014).
Funnel-asymmetry precision-effect test results

Notes: Model (1) reports results from equation (2). Model (2) is a two-stage least square (2SLS) model using the square root of the number of observations as an instrumental variable. The F-test of the 1st stage is equal to 24. Model (3) substitutes SE (p i,j) from equation (2) by its square. All models are estimated through Weighted Least Squares (WLS) using as weights the inverse of the squared SE (p i,j). Standard errors are clustered at the study level in parenthesis. *** p < 0.01, ** p < 0.05, * p < 0.1.
All model results point toward the presence of publication bias; they report a significant association between the partial correlation coefficient and its standard error ( ∝ 1 > 0). However, crucially, they also show a remaining ‘true’ effect after accounting for publication bias ( ∝ 0 > 0). After adjusting for publication bias, the ‘true’ partial correlation coefficient would be 0.016,Footnote 10 compared to the mean of 0.058. While the partial correlation coefficient does not have a quantitative interpretation, these results point to a ‘true’ positive effect of economic insecurity on populism after accounting for publication bias. However, it is not as strong as the one we would get from a simple average of the standardized ‘effect sizes’.
Heterogeneity Analysis
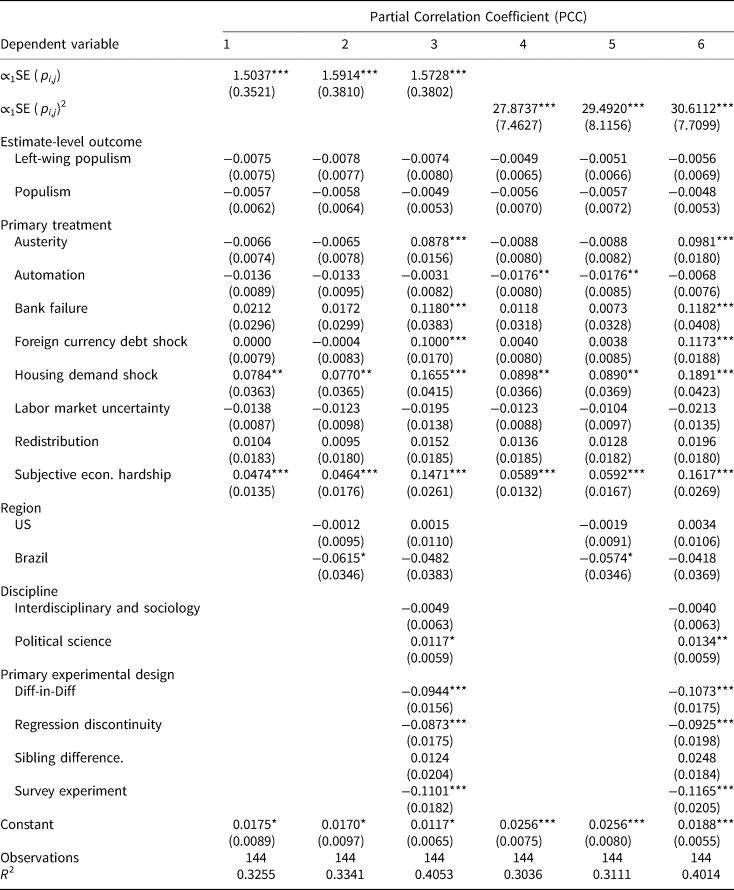
Finally, following Gechert and Heimberger (Reference Gechert and Heimberger2022) and Filomena and Picchio (Reference Filomena and Picchio2023), we test whether different study characteristics influence the likelihood of reporting a significant effect. We do this by extending Models 1 and 3 in Table 4, including the explanatory categorical variables measuring study characteristics that we also used in the vote-counting approach. These are the populism outcome variable, primary treatment variable, region, discipline, and primary experimental design. The omitted baseline categories represent the categories with the largest sample size in each case. Suppose a study characteristic significantly correlates with the Partial Correlation Coefficient (PCC). In that case, it can be interpreted as statistical evidence that studies with the characteristic in question are more likely to report a significant effect between economic insecurity and populism compared to the omitted baseline category regardless of the sample size (Stanley and Doucouliagos Reference Stanley and Doucouliagos2012).
Table 5 presents the results. First, the type of populism outcome seems to make no difference to the likelihood of finding an effect from economic insecurity. In alignment with the results based on the vote-counting approach, we find that studies testing the effect of austerity, bank failure, foreign currency debt shock, housing demand shock, and subjective economic hardship are significantly more likely to report a significant effect on populism than studies testing the effect of import exposure, net of the effect of publication bias. Studies from different regions are similarly likely to report significant effects. Studies published in political science journals are more likely to report a more significant effect than studies published in economics journals. Finally, studies relying on difference-in-differences and survey experiments to identify causality are statistically less likely to report a significant effect of economic insecurity on populism. The constant is significant in each specification, which reflects the presence of a significant ‘true’ effect of economic insecurity on populism in a ‘typical’ study,Footnote 11 net of publication bias.
Heterogeneity test results

Notes: References categories: Estimate-level outcome = Populism, Primary treatment = Import exposure, Region = Europe, Discipline = Economics, Primary experimental design = Instrumental variable. All models are estimated through Weighted Least Squares (WLS) using as weights the inverse of the squared SE (p i,j). Standard errors are clustered at the study level in parenthesis. *** p < 0.01, ** p < 0.05, * p < 0.1.
Concluding Discussion
We presented the first systematic review and meta-analysis of the causal evidence of economic insecurity as a catalyst of populism. We conducted a two-pronged systematic search to identify eligible studies, combining a database search with a search for citations of eligible studies and recently published narrative reviews. We included studies that focused on populist political behavior as the outcome of economic insecurity as treatment and followed a causal inference research design. Although we found significant heterogeneity in several dimensions, all thirty-six studies report a significant association between economic insecurity and populism. A recurring effect size is that economic insecurity explains around one-third of recent surges in populism. Tallying the number of successful, positive significant associations across 144 causes tests conducted in the thirty-six studies, we found that the overall share of significant positive associations (successes) was 67 per cent, with each causal treatment exceeding the 50 per cent threshold.
Economic insecurity seems particularly relevant for explaining right-wing populism, while the results for left-wing populism appear more ambiguous. Researchers have frequently analyzed import shocks, with robust causal evidence across thirteen studies. However, judging by the robustness of individual tests extracted from the studies, housing demand shocks, subjective economic hardship, austerity, and foreign currency debt shocks appear to be the most robust causes of populism.
Altogether, the existing scholarship presents enough evidence to conclusively disperse any doubts about the causal role of economic insecurity in the populist backlash against globalization. We explored whether the association reflects the underlying association or is contaminated by publication bias. We estimated a partial correlation coefficient to standardize the results, conducted a funnel-plot asymmetry test, and tested the density discontinuity of the distribution of t-statistics. These tests showed considerable evidence for publication bias. The underlying effect is likely smaller than the overall effect from the thirty-six studies. However, the association between economic insecurity and populism remains significant after controlling for publication bias.
The robustness of this causal association contrasts with the image emerging from some recent narrative reviews that raise doubts about the relationship between economic insecurity and populism. We can identify three factors to explain this difference. First, we defined economic security more broadly than political scientists using correlational designs with individual-level attitudinal data often do. We included measures of economic hardship, such as unemployment, and contextual-level shocks and forms of economic insecurity that did not lead to absolute material deprivation. At the individual level, political-cultural attitudes might cancel out the effect of economic hardship. By contrast, the effect of contextual-level shocks and economic insecurity on populism might be stronger.
Second, most casual designs require measuring temporal change, whereas correlational studies are often cross-sectional. Cross-sectional designs foreground the effects of slow-changing or stable attributes such as political culture. Right-wing populist attitudes are powerful predictors of right-wing populist voting. However, dynamic designs foreground change. These marginal effects might highlight the centrality of specific populations with specific experiences that change their voting behavior between elections, even if they remain a minority in the party's overall electoral base. In short, dynamic designs better capture the causes of the rise/change in support for populism. By contrast, cross-sectional designs can better capture the long-standing characteristics of populist supporters.
Third, systematic reviews and meta-analyses systematically map the available evidence. By contrast, narrative reviews are not systematic, leaving more room for the researchers' assumptions, pre-analytical visions, methodological preferences, and discipline-specific knowledge to influence the studies analyzed – as noted above. Different disciplines might also look at the causes of populism from different angles. Economists might devote more energy to analyzing economic factors, while political scientists might devote more energy to political supply or political culture. We controlled for several of these study characteristics, which did not influence the main association between economic insecurity and populism. In addition to methodological and disciplinary effects, the effect of prevalent views in scholarly publications and the public media could also influence non-systematic, narrative reviews. While our study establishes robust causal evidence between economic insecurity and populism, much remains to be done to systematize what we have learned so far. Our study is just a first step.
By focusing on causal designs, we bracket a significant body of literature that follows correlational designs. We do not think that causal designs are inherently superior to correlational designs. Correlational designs have several important advantages over causal designs. They are more versatile, their external validity is usually stronger, and they can be applied to analyze a wide range of phenomena for which it would be impossible to construct a credible causal design. However, our primary aim is to address the widespread perception in the literature that the association between economic insecurity and populism is weak. The strongest answer to this question emerges from quasi-experimental studies that establish a causal association and prioritize internal validity. We designed our search criteria with this primary aim in mind.
Despite this narrower focus on causal inference, the results of our systematic review fit well with the broader correlational literature. First, a central debate in political science has revolved around the changing political cleavage structures of advanced Western democracies. New populist right parties gained increasing momentum by combining their traditional middle-class base with working-class voters; that is, the ‘losers of modernization’ (Betz Reference Betz1993; Swank and Betz Reference Swank and Betz2003) or the ‘losers of globalization’ (Hooghe and Marks Reference Hooghe and Marks2018; Kriesi et al. Reference Kriesi2006). In the age of organized Fordist welfare capitalism, working-class members had a chance to enter the middle class. This trend has stopped or even been reversed in advanced democracies.
Second, a more recent stream of studies, partly from the cleavage literature, has examined the effects of new labour market risks and economic insecurities, arguing that juxtaposing losers vs. winners might be misleading. Support for right-wing populism is linked to the growing sense of insecurity among formerly protected ‘labor market insiders’ who have a degree of material security to lose but are not among the biggest victims (Häusermann Reference Häusermann2020; Kurer Reference Kurer2020). Researchers have highlighted several related channels, such as social decline (Engler and Weisstanner Reference Engler and Weisstanner2021), the geographical concentration of economic discontent (Rodríguez-Pose Reference Rodríguez-Pose2018), income inequality (Han Reference Han2016), housing prices (Adler and Ansell Reference Adler and Ansell2020), and relative group deprivation (Burgoon et al. Reference Burgoon2018; Rico and Anduiza Reference Rico and Anduiza2019).
Third, related to the notion of insecurity, status lossFootnote 12 (Gidron and Hall Reference Gidron and Hall2017), and status discordanceFootnote 13 (Kurer and Van Staalduinen Reference Kurer and Van Staalduinen2022) appear to be a stronger predictor of the populist vote than more direct measures of economic deprivation, such as unemployment. This underpins the importance of utilizing fine-grained measures of economic insecurity, as emphasized in our study. The notion of status loss or discordance also allows researchers to grasp the mutually reinforcing – economic and cultural – double devaluations of working-class skills, values, and lifestyles that are increasingly at odds with the demands of the globalized post-industrial economy (Friedman Reference Friedman and Friedman2003; Kalb Reference Kalb2023). Recognizing the interrelations between cultural and economic devaluations allows researchers to identify how broad populist social coalitions emerge (Halikiopoulou and Vlandas Reference Halikiopoulou and Vlandas2020). These correlational studies shed light on crucial aspects of the economic insecurity-populism mechanism, in line with the conclusions arising from the present analysis.
Our systematic review has several policy implications. The literature shows that there is not one type of populist voter but several types, which means there might be several relevant policy channels to address the rise of populism. Classic welfare policies, such as a better social safety net and more redistribution, are crucial to protect the victims of globalization. New policies that protect against emerging insecurities and risks might reduce the appetite for populism among the downwardly mobile working-middle class. We do not see these policy choices as alternatives but as complementary solutions. These insights resonate with the policy conclusions emerging from the extant correlational literature. Swank and Betz (Reference Swank and Betz2003) have already reported that globalization is more robustly associated with support for the populist right in countries with lower levels of social protection. This association was later confirmed by Foster and Frieden (Reference Foster and Frieden2019). In a related study, Vlandas and Halikiopoulou (Reference Vlandas and Halikiopoulou2019) showed that unemployment benefits and employment protection limited the impact of unemployment on far-right party support.
Regarding newly emerging risks, such as automation, Gingrich (Reference Gingrich2019) found that while compensation for automation may help left-wing parties retain vote share among the exposed, it does not seem to forestall the rise of the populist right. By contrast, Vlandas and Halikiopoulou (Reference Vlandas and Halikiopoulou2022) found that welfare state policies reduce the likelihood of supporting the far right among individuals exposed to high risks, including the unemployed, pensioners, low-income workers, employees on temporary contracts, individuals in large families, and individuals who are disabled/permanently sick. Our review confirms the relevance of multiple redistributive and protective welfare policies identified in the literature.
Finally, our systematic review and meta-analysis uncovered several blind spots and open questions. First, while the study region does not affect the likelihood of reporting a significant effect, the literature shows significant substantive effect heterogeneity across geographical contexts. For example, some causes relevant in Western Europe might be less relevant in Eastern Europe. Thus, correcting the heavy geographical skew of the literature is essential. Focusing more on the experience of developing and emerging economies could yield new insights into how economic insecurity affects populism. Second, researchers should pay more attention to cross-study comparability. The disciplinary differences in design could strengthen disciplinary silos and lead to divergent results across studies and disciplines, which should be avoided.
Third, the results suggest that a strict juxtaposition of interest-based economic determinants vs. symbolic cultural factors is not fruitful. Focusing on the lived experience of economic insecurity, co-evolution, and the interaction of cultural-symbolic and economic factors allows researchers to bypass this culture/economy dichotomy. Finally, the role of political supply and redistributive policies in mitigating the effect of economic insecurity on populism remains an under-researched area. Politics can reduce economic insecurity, taking the wind from populists' sails. Future research should pay more attention to these questions, which have not received enough attention so far.
Supplementary Material
The supplementary material for this article can be found at https://doi.org/10.1017/S0007123424000024.
Data availability statement
Replication data for this article can be found in Harvard Dataverse at: https://doi.org/10.7910/DVN/F58FVN.
Financial support
GS has received funding for this project from the European Union's Horizon 2020 research and innovation program under the Marie Skłodowska-Curie grant agreement No 890187. The final revision of the article was conducted when MSA took service at the European Commission Joint Research Centre.
Competing interest
None.


 Open access