


Introduction
Migratory birds are characterised by their ability to connect geographically distant, temporary habitats through their movements (Alerstam and Hedenström Reference Alerstam and Hedenström1998). These habitats typically make up three key stages of the annual cycle of a species, i.e. breeding, wintering, and migration (Wilson et al. Reference Wilson, LaDeau, Tottrup and Marra2011). Each stage in the annual cycle has the potential to influence the population dynamics of a species (Rushing et al. Reference Rushing, Ryder and Marra2016); however, the conservation and research priorities of a species, along with the pressures they experience, will differ substantially depending on the period (Faaborg et al. Reference Faaborg, Holmes, Anders, Bildstein, Dugger and Gauthreaux2010). The large scale associated with the annual cycle movements of a migratory species and the difficulty of tracking individuals through their annual cycle have hindered the ability to pinpoint the most influential drivers of a species decline (Rushing et al. Reference Rushing, Ryder and Marra2016). A significant proportion of migratory bird species lack adequate protection in at least one part of their range through their annual cycle (Runge et al. Reference Runge, Watson, Butchart, Hanson, Possingham and Fuller2015), highlighting the need to identify important areas used by migratory birds throughout the year.
Although researchers often attempt to break the annual cycle into discrete periods to study them individually (e.g. breeding/breeding, migration, wintering/nonbreeding), carry-over effects, the phenomenon in which the pressures that an individual experiences in one period can influence its success in others, have been identified in many taxa and may be a significant driver of individual variation in fitness (Harrison et al. Reference Harrison, Blount, Inger, Norris and Bearhop2011; Norris Reference Norris2005). For example, male Kirtland’s Warblers Setophaga kirtlandii arrived at breeding territories later and fledged fewer young following winters with less rainfall on their wintering grounds (Rockwell et al. Reference Rockwell, Bocetti and Marra2012). Whereas carry-over effects occur at the individual level, they can have important implications for populations if the number of individuals experiencing a specific pressure increase (Norris Reference Norris2005). For example, in some species, carry-over effects from the wintering grounds may influence breeding success more than the conditions experienced within the breeding habitat (Duriez et al. Reference Duriez, Ens, Choquet, Pradel and Klaassen2012; Finch et al. Reference Finch, Pearce-Higgins, Leech and Evans2014; Norris et al. Reference Norris, Marra, Kyser, Sherry and Ratcliffe2003), whereas the converse is true for others (Ockendon et al. Reference Ockendon, Leech and Pearce-Higgins2013). The ecological literature is skewed towards studies conducted during the breeding season, with fewer studies examining multiple periods and the interactions between them (Marra et al. Reference Marra, Cohen, Loss, Rutter and Tonra2015). As threats to a bird during one period can impact populations at a larger scale, effective conservation of a migratory species requires identification of the habitats used during each stage of the annual cycle, along with the links between them.
Waterbird populations throughout North America have declined by 20% since 1970 (Rosenburg et al. Reference Rosenberg, Dokter, Blancher, Sauer, Smith and Stanton2019) and 64% of North American colonial-nesting waterbirds species are considered highly imperilled or of high to moderate conservation concern (Kushlan et al. Reference Kushlan, Steinkamp, Parsons, Capp, Acosta-Cruz and Coulter2002). Breeding populations of one such species, the Little Blue Heron Egretta caerulea, have been declining in peninsular Florida at a rate of 2.3% per year (Sauer et al. Reference Sauer, Niven, Hines, Ziolkowski, Pardieck and Fallon2021). This species has been classified as a species of high concern requiring immediate action in several conservation plans (FFWCC 2013; Hunter et al. Reference Hunter, Golder, Melvin and Wheeler2006; Kushlan et al. Reference Kushlan, Steinkamp, Parsons, Capp, Acosta-Cruz and Coulter2002; LMVJV 2022; Vermillion Reference Vermillion2016), because of declines over most of its range in the USA (Hunter et al. Reference Hunter, Golder, Melvin and Wheeler2006; Sauer et al. Reference Sauer, Niven, Hines, Ziolkowski, Pardieck and Fallon2021). These population declines are reportedly driven primarily by the loss of breeding habitat from altered hydrology and land-use conversion (Hunter et al. Reference Hunter, Golder, Melvin and Wheeler2006; Vermillion Reference Vermillion2016). However, there is a paucity of knowledge on the foraging habitats, migratory flyways, and termini of this species during the wintering season, and no studies exist on its annual cycle movements (Rodgers and Smith Reference Rodgers, Smith and Poole2020), making it impossible to determine if broad-scale modification and degradation of winter foraging habitat (Kennish Reference Kennish2002) may be contributing to population declines. Thus, conservation of this species will involve identification of the wetland habitats used throughout the annual cycle, emphasising the drivers of habitat availability and pressures impacting each system (Marra et al. Reference Marra, Cohen, Loss, Rutter and Tonra2015). Therefore, in this study, we addressed this knowledge gap by deploying GPS transmitters on adult Little Blue Herons from two important wintering sites on the Gulf Coast of Florida and describing their annual cycle movements, including space use at wintering and breeding sites, colony locations, migration distances, phenology, and site fidelity.
Methods
Study area
The two study sites located on the Gulf Coast of Florida, USA (Figure 1; J.N. ‘Ding’ Darling National Wildlife Refuge; 26.445608, -82.112717; hereafter Ding, and Great White Heron National Wildlife Refuge; 26.445608, -82.112717; hereafter GWH) have supported previous studies of waterbird habitat features and nest counts (e.g. Calle et al. Reference Calle, Gawlik, Xie, Green, Lapointe and Strong2016, Reference Calle, Green, Strong and Gawlik2018; Cook and Baranski Reference Cook and Baranski2021). Both sites contain extensive tidal flats comprising a mix of bare sand substrate and seagrass interspersed with red mangrove Rhizophora mangle, black mangrove Avicennia germinans, and white mangrove Laguncularia racemosa (Harris et al. Reference Harris, Milbrandt, Everham and Bovard2010). Despite having similar habitat for wading birds, these two study sites are markedly different in terms of the availability of freshwater foraging habitat and surrounding development. Ding is an approximately 2,100-ha National Wildlife Refuge located on Sanibel Island, Florida, USA within the eastern Gulf of Mexico. Whereas Ding proper is relatively unmodified, the adjacent area to the south is primarily residential and low-intensity commercial development (<2 km from the boundary of the Refuge). Wetlands within the developed areas are primarily anthropogenic freshwater ponds. Land-cover data show that the region to the north of Ding is a majority high-intensity development, especially at the mouth of the Caloosahatchee River (approximately 15 km from Ding). In contrast, GWH is larger (2,500 ha), encompassing much of the submerged lands and mangrove (same species as Ding) islands between Key West and Marathon, Florida. For this study, we focused our bird tagging within several nocturnal roosts and foraging locations on approximately 800 ha of GWH delineated by Calle et al. (Reference Calle, Gawlik, Xie, Green, Lapointe and Strong2016). Dominant land-cover types in the system include mangrove islands, which serve as important breeding, roosting, and alternative foraging sites, interspersed with vast mud, sand, and seagrass intertidal flats serving as the primary foraging habitat when available (Calle et al. Reference Calle, Green, Strong and Gawlik2018; Nuttle and Fletcher Reference Nuttle and Fletcher2013). Unlike Ding, freshwater wetlands and urban development are entirely absent within or near to GWH (approximately 20 km from GWH).
Locations of Little Blue Heron capture and transmitter deployment within J.N. ‘Ding’ Darling (Ding) and Great White Heron (GWH) National Wildlife Refuges. Fifteen GPS transmitters at each site were deployed on adult Little Blue Herons during the 2021/2 wintering season (October–March).

Transmitter deployment
Fifteen adult Little Blue Herons were captured from each study site during the wintering season (October 2021 to March 2022), using a combination of a net gun (Herring et al. Reference Herring, Gawlik and Beerens2008) and mist-netting birds travelling to and from known roost islands within the refuges. After a successful capture, we attached a size six federal aluminium leg band and a Lotek PinPoint GPS/Argos-S Transmitter using a leg-loop harness (Jirinec et al. Reference Jirinec, Rodrigues and Amaral2021). Morphological data (wing cord, tail, culmen, tarsus, and head lengths, and mass) were collected for each captured Little Blue Heron. Transmitter weight was under 3% of body mass of the smaller sex, as per the US Banding Lab recommendation. Captured sub-adult (white-plumaged) herons were banded and processed as above but released without transmitters. Incidental captures of non-target species were immediately released without leg bands or transmitters. Transmitters were programmed to collect location fixes every 1.5 hours between 05h00 and 20h00 local Eastern Time (ET). An additional fix was collected at 01h00 ET to identify nocturnal roost locations. Location fixes were automatically uploaded from the ARGOS database to a private account on Movebank (Wikelski et al. Reference Wikelski, Davidson and Kays2023), where fixes were converted from the Argos to GPS format when applicable, and filtered for invalid locations (e.g. incorrect timestamp or latitude/longitude). We collected approximately 17,500 GPS locations and 7,500 Argos locations from the 30 transmitters. The Argos locations were not used in analyses due to large horizontal error (>100 m) compared with the horizontal error of the GPS locations (~10 m). However, these locations were used to help identify migration timing when GPS data were not available. The GPS data collected during the project period were used to perform all subsequent analyses.
Statistical analyses
Recursive movements to a location suggest a site of high ecological importance, such as a nest, roost or foraging site (Picardi et al. Reference Picardi, Frederick, Borkhataria and Basille2020). Daily diurnal visits to a specific location during the expected Little Blue Heron breeding season (March–September; Rodgers and Smith Reference Rodgers, Smith and Poole2020) were used to represent the colony location of that individual. The nestR package in R (Picardi et al. Reference Picardi, Smith, Boone and Basille2022) uses recursive movements to predict the most likely colony location(s) of an individual bird, based on several user-defined parameters, including the expected or known breeding window (March–July; Rodgers and Smith Reference Rodgers, Smith and Poole2020), length of a successful breeding attempt for the species of interest (80 days), and maximum GPS spatial error (30 m). The output provided the coordinates of the most likely colony location(s), along with the timestamp of the first and last locations at that site, providing a useful window in which a colony was utilised. The colony locations were plotted in ArcGIS Pro to ensure clustering occurred at the predicted colony location, separate roosts from colonies (roost sites only included nocturnal fixes), and to select the most likely location if nestR suggested multiple colonies for one individual. Colony locations were ground-truthed in three cases; however, most colonies were located on private land and not accessible. Picardi et al. (Reference Picardi, Frederick, Borkhataria and Basille2020) estimated the positive predictive value of nestR for predicting colonies/nests at 87–100% depending on the species examined, suggesting high confidence in predicted colony sites using this method. For each colony, we classified the colony location as either ‘coastal’ if estuarine wetland classes listed in the National Wetland Inventory (NWI) database (USFWS 2023) were found within the 95% kernel density estimates (KDE) of the individual or ‘inland’ if not. We also quantified the percentage of developed land-cover types within 1 km of the colony site using the National Land Cover Dataset (Dewitz Reference Dewitz2023). The relationship between colony start date and latitude was quantified using Pearson correlation coefficient.
The proportion of migratory individuals was estimated as the number of migrants out of the total number of individuals tagged. For individuals that migrated, we estimated the distance travelled between the wintering and breeding sites, along with the timing of spring and fall migrations. The distance travelled was estimated using ArcGIS Pro, defined as the distance between the centroid of an individual’s winter home range and the breeding colony. The annual cycle was classified into six distinct periods for each individual: wintering, spring migration, prebreeding, breeding, postbreeding, and fall migration. The breeding period was determined using nestR package as described previously, defined as the period between the first and last visit to an individual’s colony. The remaining periods were classified by visual inspection of the movement data. The postbreeding period was defined as the period between the last colony visit and the timestamp of the last location before an individual made a significant (>100 km) migratory movement. The fall migration period ended when an individual returned to its wintering site (Ding or GWH). The wintering period was defined as the period between the end of fall migration and the start of the spring migration. Lastly, the prebreeding period was defined as the period between arrival at the area surrounding the colony and date of the first visit to the colony site. For resident individuals, all parts of the annual cycle outside the breeding period were classified as wintering.
KDEs were used to quantify the home range and core area during the winter and breeding seasons. A smoothing parameter of h = 80 was selected as the best choice for visualising home ranges using a sensitivity analysis, as the default (href) tended to drastically overestimate space use estimates, and cross-validation methods failed to converge. Total home range was represented by 95% kernel contours, and 50% contours were used to represent core area. Foraging distance during the breeding period was estimated by calculating the mean straight-line distance between the colony and all suspected foraging locations. Kruskal–Wallis rank sum tests using a Bonferroni correction were used to evaluate site-level (GWH vs Ding) and seasonal (breeding vs wintering) differences in home range and core size, along with foraging distances while breeding. Collected GPS locations were classified as breeding and wintering based on the date they were obtained, with the deployment date, migration dates, and/or breeding period establishing the start and end points of the season. Nocturnal locations were filtered out of the data set, as this species does not typically forage at night (Powell Reference Powell1987). Locations within 60 m of the predicted colony were also filtered out to remove locations at the colony. All home range estimates were made using the adehabitatHR package in R (Calenge Reference Calenge2006).
For individuals with home ranges for two or more wintering seasons, site fidelity was quantified using Bhattacharyya’s Affinity Index (BAI; Bhattacharyya Reference Bhattacharyya1943) to measure overlap between an individual’s winter home ranges in subsequent winters. This method provides an overlap index ranging from 0 to 1; a value of zero indicating no overlap, whereas a value of one indicates complete overlap. This method does not require independence between home ranges, allowing for a useful comparison of home ranges among years for an individual.
Results
Annual cycle movements
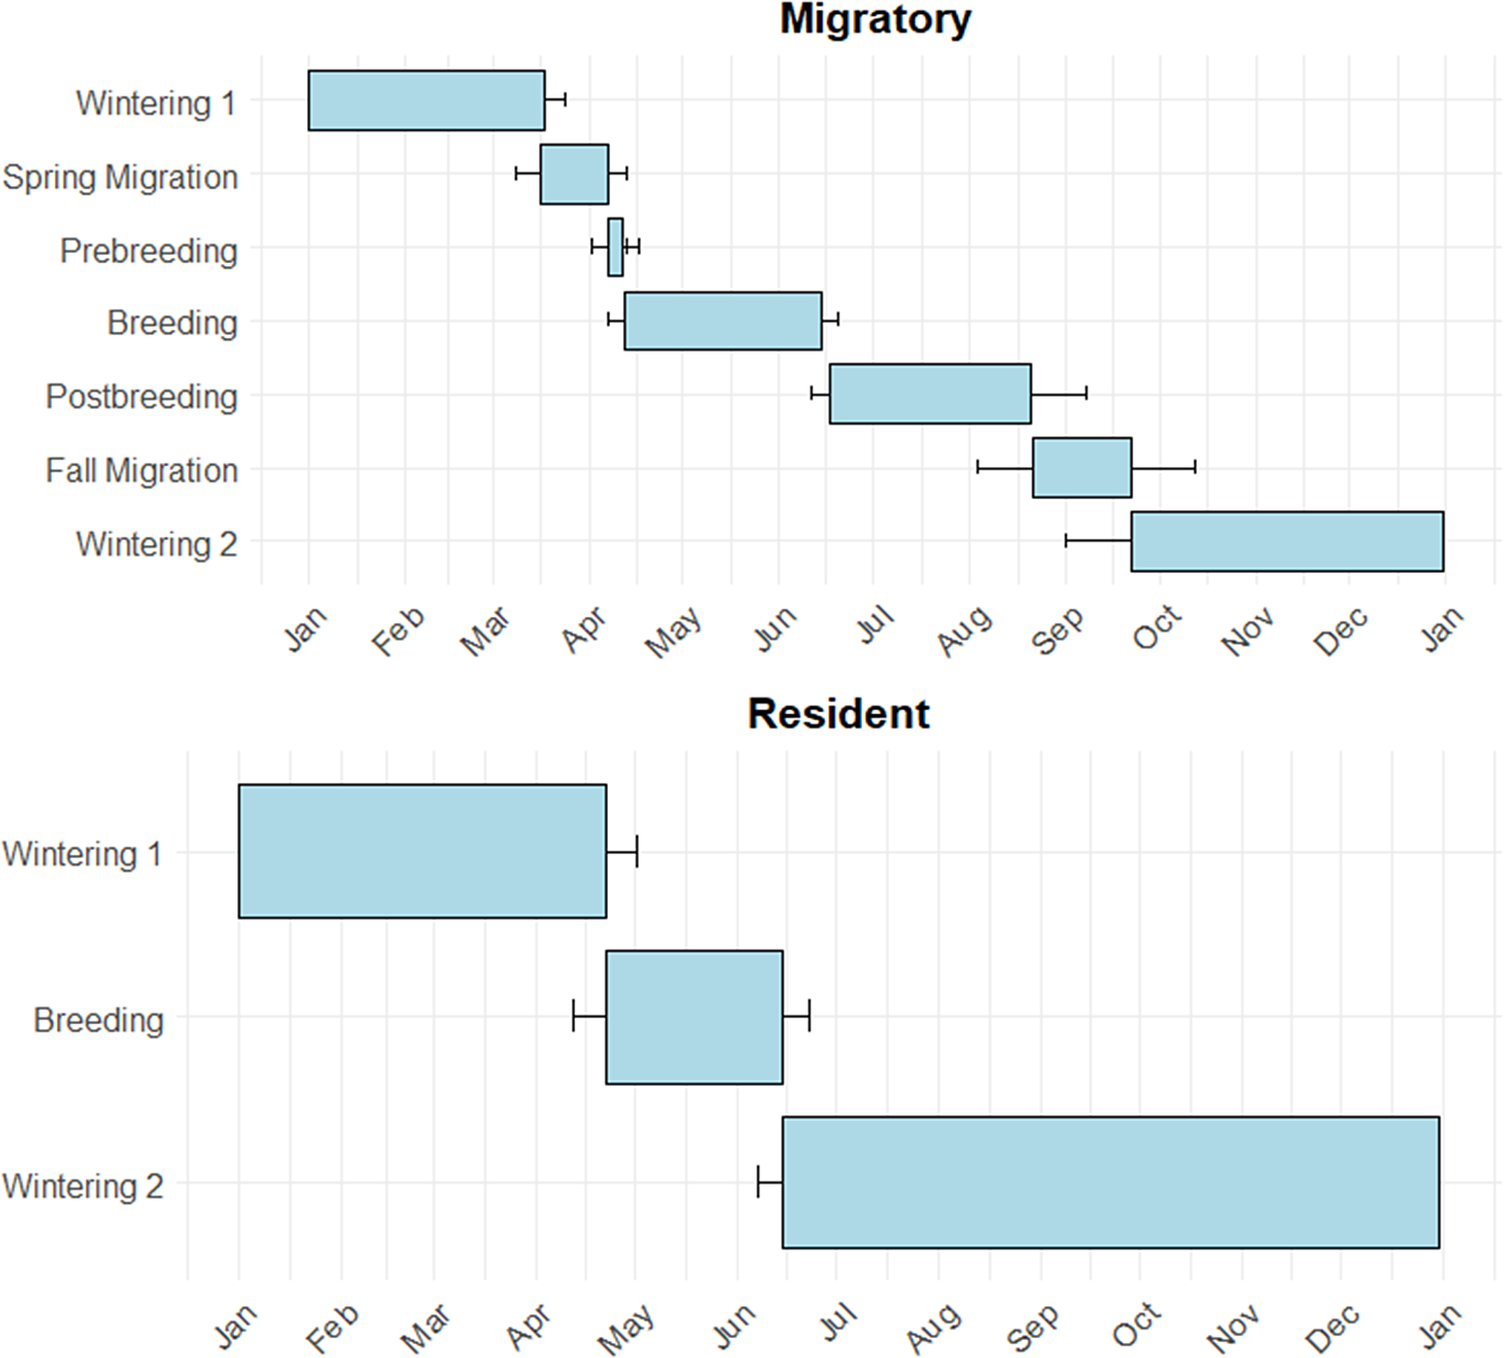
Of the Little Blue Herons tagged at GWH, 67% were classified as migratory (n = 10) and 6% as residents (n = 1). The migratory strategy of the remaining 27% was inconclusive due to transmitter quality (n = 4). In contrast, 27% of birds tagged at Ding were classified as migratory (n = 4) and 53% as residents (n = 8). The migratory strategy of the remaining 20% (n = 3) was inconclusive due to transmitter quality. One individual suffered a mortality shortly following its spring migration, so colony location could not be estimated for this individual. Little Blue Herons wintering at GWH were almost exclusively migratory, with a migratory to resident ratio of 10:1. Conversely, Little Blue Herons wintering within Ding were partially migratory, with a migratory to resident ratio of 1:2. The annual cycle of migratory Little Blue Herons can be broken up into six stages (wintering, spring migration, prebreeding, breeding, postbreeding, and fall migration; Figure 2). The wintering season was the longest stage, encompassing approximately 47% of the total annual cycle. The breeding and postbreeding stages are an average of 20% and 13% of the total annual cycle, respectively. Both migrations and the prebreeding stage made up less than 5% each of the total annual cycle (Figure 3). The annual cycle of residential Little Blue Herons can be broken into two stages, wintering and breeding, making up 85% and 15% of the total annual cycle, respectively (Figure 3).
The mean annual cycle of resident (n = 9) and migratory (n = 13) Little Blue Herons wintering within J.N. ‘Ding’ Darling (Ding) and Great White Heron (GWH) National Wildlife Refuges.
Median percentage of the days of the year spent in each stage of the annual cycle for migratory and resident Little Blue Herons wintering within J.N. ‘Ding’ Darling (Ding) and Great White Heron (GWH) National Wildlife Refuges.

Colony locations
GPS data revealed colony locations and the breeding period for 22 tagged Little Blue Herons over three breeding seasons, one during the 2021 season, 21 in 2022, and two in 2023. One colony was within the GWH study site, whereas two colonies, utilised by eight individuals, were identified on Sanibel Island just outside Ding. Colonies of migratory Little Blue Herons were distributed throughout south-east USA, ranging from 187 km to 811 km from their respective wintering sites. Tagged herons formed colonies in South Carolina, Georgia, and Florida, and Cuba (Figures 4 and 5). Apart from the colony in GWH, all colonies were established in freshwater wetlands. Migratory Little Blue Heron colonies occurred at a wide range of latitudes (22.73° to 32.96°), with a much smaller range of longitudes (−84.33° to −80.03°), suggesting a primarily north–south distribution. The mean breeding period of our sample of tagged Little Blue Herons, including suspected nest failures, was from 17 April (± 4 days) to 14 June (± 4 days) and was not significantly different based on the wintering site or migration strategy. The colony start date was strongly negatively correlated with the latitude of the colony (r = −0.69, P <0.001), with the start of breeding beginning 3.5 days earlier for every one degree increase in latitude (Figure 6).
Colony locations and migration distance of Little Blue Herons originating at J.N. ‘Ding’ Darling (Ding) National Wildlife Refuge. The stars represent the capture location/study site, while the circles represent breeding colonies. The line connecting the study site and colonies for migratory individuals are for visualisation only, and do not represent the actual path travelled. The distance values denote the straight-line distance between the centroid of the winter home range and the actual colony location. The inset map highlights where resident individuals established colonies relative to the Ding study site.

Colony locations and migration distance of Little Blue Herons originating at the Great White Heron (GWH) National Wildlife Refuge. The stars represent the capture location/study site, while the circles represent breeding colonies. The line connecting the study site and colonies for migratory individuals are for visualisation only, and do not represent the actual path travelled. The distance values denote the straight-line distance between the centroid of the winter home range and the actual colony location. The inset map highlights where resident individuals established colonies relative to the GWH study site.

Correlation between the date of nest initiation of a colony (represented by days since 1 January) and colony latitude. Each point represents a breeding colony (n = 23).

Annual cycle space use
Winter home range and core area was estimated for 27 tagged Little Blue Herons (13 at GWH and 14 at Ding) over three wintering seasons, for a total of 39 bird-years (Figure 7). Mean winter core and home range area from GWH was 30.80 ha (SE = 2.75 ha) and 193.02 ha (SE = 21.73 ha), respectively. Mean winter core area at Ding was 20.11 ha (SE = 2.56 ha), and the mean home range was 114.4 ha (SE = 13.06). Both core (X 2 = 8.7527, df = 1, adjusted P value = 0.06) and home range (X 2 = 9.4303, df = 2, adjusted P value = 0.04) area was larger at GWH than at Ding.
Collective home range of all tagged birds within J.N. ‘Ding’ Darling (n = 14) and Great White Heron (GWH) National Wildlife Refuges (n = 13), with frequency of overlap indicated by heat scale. Home ranges are defined as the 95% kernel utilisation distribution, with a smoothing parameter of h = 80 using the R package adehabitatHR. The inset map denotes the location of each study site within the state of Florida, USA.

Breeding home range and core area was estimated for 22 individual Little Blue Herons during the 2022 breeding season, the only year for which sample sizes of breeding birds were large enough to provide meaningful estimates. Mean breeding core area at GWH was 9.23 ha (SE = 1.5 ha), and the mean home range was 125.46 ha (SE = 20.03 ha). Mean breeding core area at Ding was 5.66 ha (SE = 0.85 ha), and the mean home range was 93.47 ha (SE = 18.96). Neither cores (X 2 = 3.7524, df = 1, adjusted P value = 0.25) nor home ranges (X 2 = 1.6396, df = 1, adjusted P value = 1.0) differed significantly between the two sites. Breeding core area and home ranges were significantly smaller than nonbreeding core area (X 2 = 33.788, df = 1, P <0.001) and home range (X 2 = 5.5605, df = 1, P = 0.02). During the breeding period, Little Blue Herons travelled an average of 4.46 km (SE = 0.87 km) from their colony to forage. Foraging distance did not differ by study site (X 2 = 3.2609, df = 1, adjusted P value = 0.35).
Site fidelity
Little Blue Herons showed a high degree of fidelity to their winter foraging sites over successive years. Eleven individuals, three from Ding and eight from GWH, provided data over consecutive winters to estimate site fidelity (Figure 8). The remainder of tagged birds (19 individuals) did not provide enough location data to estimate valid home ranges over two consecutive winters. Whereas all tagged Little Blue Herons showed some degree of overlap between years, mean individual home range overlap was 0.25 (SE = 0.06) at Ding and 0.58 (SE = 0.06) at GWH. The total home range overlap of all herons combined was 0.49 at Ding and 0.85 at GWH.
Site-level winter home range shifts for the 2021/2 and 2022/3 winter seasons (October–March). Within each season, all Little Blue Heron locations were combined, and home range was estimated for the entire sample. Home ranges are defined as the 95% kernel utilisation distribution, with a smoothing parameter of h = 80 using the R package adehabitatHR. The inset map denotes the location of each study site within the state of Florida, USA.

Discussion
Little Blue Herons in our study showed a partial migration strategy, with both migratory and resident birds sharing common winter locations (Chapman et al. Reference Chapman, Brönmark, Nilsson and Hansson2011). Additionally, migratory individuals showed a ‘refuge’ migration type, in which birds move to highly productive locations to breed, then retreat to coastal wetlands as breeding concludes and resource availability declines (Shaw Reference Shaw2016). Partial migration strategies have been documented in other wading bird species including the Black-crowned Night Heron Nycticorax nycticorax (Scarpagnito et al. 2021), Reddish Egret Egretta rufescens (Koczur and Ballard Reference Koczur and Ballard2024), Great Egret Ardea alba (Lumpkin et al. Reference Lumpkin, Jennings, Warnock and Condeso2023), and Wood Stork Mycteria americana (Picardi et al. Reference Picardi, Frederick, Borkhataria and Basille2020). The fact that partial migration is not documented for many waterbird species may have more to do with the lack of movement studies than a true representation of biological responses across these taxa. Indeed, it is conceivable that partial migration could be the most common migratory strategy for waterbirds, a group of birds that typically have long juvenile dispersal and a tendency to move widely in freshwater ecosystems (Frederick and Ogden Reference Frederick and Ogden2001), inhabiting both freshwater and intertidal habitats.
The proportion of resident to migrant individuals within a subpopulation may be associated with the use of different or differently distributed resources, as migrant-skewed subpopulations reflect seasonal patterns of resource availability across the range, whereas resident-skewed subpopulations may suggest use of resources that are artificially available (Picardi et al. Reference Picardi, Frederick, Borkhataria and Basille2020, Reference Picardi, Frederick and Basille2024). Migratory Little Blue Herons are likely exploiting seasonal increases in food availability in freshwater wetlands associated with changing hydrology (Herteux et al. Reference Herteux, Gawlik and Smith2020), whereas resident individuals may be using anthropogenic wetlands that are available and productive regardless of seasonal patterns (Evans et al. Reference Evans, Klassen, Gawlik and Gottlieb2023). Availability of fresh water during the nestling stage is a limitation for White Ibis Eudocimus albus due to the salt content in the prey of birds foraging in coastal wetlands (Bildstein and Johnston Reference Bildstein, Post, Johnston and Frederick1990), thus may also be a driver of migration for the Little Blue Herons from the two study sites, evidenced by a significant percentage (~95%) of individuals establishing colonies in freshwater wetlands. If a dependency on freshwater habitats during the breeding period is indeed a primary driver of a migration for coastal Little Blue Herons, then the introduction of novel freshwater wetland habitats to coastal systems will allow resident subpopulations to persist, as was likely the case at Ding. In this study, the highest proportion of resident Little Blue Herons was within the study site in which anthropogenic freshwater wetlands were readily available for foraging and breeding, whereas the study site without access to freshwater habitats contained almost exclusively migratory individuals. These findings further reinforce the growing body of literature suggesting that increased access to anthropogenic resources is driving the alteration of seasonal movement patterns in wading birds (Kidd-Weaver et al. Reference Kidd-Weaver, Hepinstall-Cymerman, Welch, Murray, Adams and Ellison2020; Picardi et al. Reference Picardi, Frederick, Borkhataria and Basille2020, Reference Picardi, Frederick and Basille2024).
Individuals spent more time within their winter site compared with any other stage of the annual cycle, with migratory individuals residing within a wintering site for approximately half of the year and residents for the entire year. As events occurring during one period can influence individuals and populations during subsequent periods (Sedinger and Alisauskas Reference Sedinger and Alisauskas2014), annual cycle studies are an essential step for identifying pressures and implementing effective approaches to reverse population declines (Marra et al. Reference Marra, Cohen, Loss, Rutter and Tonra2015). Thus, conservation plans that aim to mitigate negative effects experienced at wintering sites may benefit breeding subpopulations of this species indirectly (Zhao et al. Reference Zhao, Devries, Clark and Weegman2023), especially at locations such as Ding and GWH that support high densities of wintering Little Blue Herons for a significant portion of the year.
Coastal wintering Little Blue Herons established breeding colonies in both inland (n = 10) and coastal systems (n = 12) throughout the coastal plain ecoregion of the southern USA (n = 20), along with western Cuba (n = 2). The drivers of habitat availability during the breeding season differ greatly between the inland and coastal systems used by the Little Blue Herons in this study. For example, Carolina Bay, Cypress Dome, and other seasonally inundated freshwater wetlands used by the inland-breeding Little Blue Herons are primarily filled by increased precipitation during the winter and summer months, along with local run-off and groundwater connections (Tiner Reference Tiner2003) that stimulate prey production (Evans et al. Reference Evans, Klassen, Gawlik and Gottlieb2023). Drops in water-level are due to evapotranspiration, which concentrates prey into smaller area wetlands at a high density, which are exploited by breeding wading birds (Gawlik Reference Gawlik2002; Herteux et al. Reference Herteux, Gawlik and Smith2020). In contrast, prey availability and consequently wading bird abundance in coastal wetlands changes in response to short-term changes in water-levels from tidal cycles (Calle et al. Reference Calle, Gawlik, Xie, Green, Lapointe and Strong2016). Newly exposed foraging habitat during low tides increases access for wading bird species that are otherwise behaviourally (e.g. diurnal vs nocturnal foragers) or physically (i.e. leg length) constrained (Gawlik Reference Gawlik2002). Wading birds often select locations with higher temporal availability of shallow water foraging habitat (Calle et al. Reference Calle, Gawlik, Xie, Green, Lapointe and Strong2016, Reference Calle, Green, Strong and Gawlik2018) to maximise foraging opportunities. These results provide evidence that Little Blue Herons can exploit a wide range of ecosystems and habitat drivers, with the commonality being that they form colonies in locations with adequate food availability throughout the breeding season. However, management of individual nesting colonies should consider the drivers of food availability in that specific system, to ensure that the processes allowing colonies to persist are protected.
Wading birds such as the Wood Stork (Evans and Gawlik Reference Evans and Gawlik2020; Evans et al. Reference Evans, Klassen, Gawlik and Gottlieb2023; Shlepr et al. Reference Shlepr, Evans and Gawlik2023), White Ibis (Murray et al. Reference Murray, Kidd-Weaver, Curry, Hepinstall-Cymerman, Yabsley and Adams2018), Great Egret (Frederick and McGehee Reference Frederick and McGehee1994; McKinney and Raposa Reference McKinney and Raposa2013), and Snowy Egret Egretta thula (Frederick and McGehee Reference Frederick and McGehee1994; McKinney and Raposa Reference McKinney and Raposa2013) are widely known to exploit urban wetlands. This is the first study to document this pattern for Little Blue Herons, with 10 colonies being in created wetlands and some colonies containing up to 86% urban land cover within 1 km of the breeding colony. We suspect that urban and anthropogenic created wetlands provide reliable foraging opportunities that otherwise would not be available to breeding birds, as is the case of the Wood Stork (Evans and Gawlik Reference Evans and Gawlik2020; Picardi et al. Reference Picardi, Frederick and Basille2024). For individuals that nest in dynamic systems where water fluctuations drive prey availability, concurrent use of natural and urban resources can lead to increased productivity during years where the conditions in natural wetlands are suboptimal (Evans and Gawlik Reference Evans and Gawlik2020; Shlepr et al. Reference Shlepr, Evans and Gawlik2023). In coastal sites, birds foraging in urban wetlands show a higher rate of energy intake than those foraging in natural wetlands, most likely attributed to increased prey availability (McKinney and Raposa Reference McKinney and Raposa2013). In addition to predictable foraging opportunities, breeding in urban systems can also provide other benefits such as a reduction in predation pressure (Chamberlain et al. Reference Chamberlain, Cannon, Toms, Leech, Hatchwell and Gaston2009; Roshnath et al. Reference Roshnath, Athira and Sinu2019) and permanent fresh water directly beneath the breeding substrate (Frederick and McGehee Reference Frederick and McGehee1994).
Overall home range estimates of this species are comparable in size to the Great Egret (129–178 ha; Brzorad et al. Reference Brzorad, Allen, Jennings, Condeso, Elbin and Kays2022) and Reddish Egrets (39–75 ha; Koczur et al. Reference Koczur, Kent, Ballard, Meyer and Green2018). However, we noted significant differences in the home range size between our two study sites during the wintering period, possibly attributed to differences in the spatial and temporal availability of foraging habitat and prey availability (Koczur et al. Reference Koczur, Kent, Ballard, Meyer and Green2018). During the breeding period, home ranges were significantly smaller than the wintering period, and did not differ based on the study site, a pattern also identified in Great Egrets (Brzorad et al. Reference Brzorad, Allen, Jennings, Condeso, Elbin and Kays2022). This is likely due to the availability of foraging habitat in the tidal systems used by wintering herons compared with the availability of freshwater wetlands used by breeding herons. In the tidal systems, intertidal foraging patches are only available for a small proportion of the day (2–4 hours/day) and availability fluctuates depending on the amplitude of the tidal cycle on any given day, thus herons must move around these flats as they become available to maximise foraging opportunities. In contrast, freshwater wetlands are constantly available throughout the entire breeding period, thus herons repeatedly move back and forth between a few high-quality foraging patches, reducing the overall space use during this period. In addition, individual Little Blue Herons travelled an average of 4.5 km away from their colony to forage during the breeding season; however, foraging distances were highly variable, ranging from 0.39 km to 15.23 km. As the breeding period is more energy intensive than the winter period, foraging closer to the colony minimises energy loss from foraging flights (Maccarone et al. Reference Maccarone, Brzorad and Stone2008), thus reducing the total space used.
Little Blue Herons displayed strong inter-year site fidelity to their wintering sites. All migratory individuals returned to their respective wintering sites, whereas all resident individuals remained within the study site throughout the entire annual cycle. Strong winter site fidelity has been identified in several other wading birds that share wintering sites with this species, including the Reddish Egret (Koczur et al. Reference Koczur, Kent, Ballard, Meyer and Green2018), Wood Stork (Picardi et al. Reference Picardi, Frederick, Borkhataria and Basille2020), and Black-crowned Night Heron (Scarpignato et al. Reference Scarpignato, Stein, Cohen, Marra, Kearns and Hallager2021) A key advantage of site fidelity is knowledge of productive foraging locations, predation threats, and cover from adverse conditions (Jackson Reference Jackson1994). Intertidal wetlands are highly productive foraging habitat (Gibson Reference Gibson2003) capable of sustaining high densities of wading birds; however, tidal fluctuations rapidly alter availability of foraging habitat daily (Calle et al. Reference Calle, Gawlik, Xie, Green, Lapointe and Strong2016, Reference Calle, Green, Strong and Gawlik2018). Prior knowledge of dynamic conditions may allow individuals to select locations with the longest spatiotemporal availability (Calle et al. Reference Calle, Green, Strong and Gawlik2018), reducing searching times. On the other hand, birds that show high fidelity regardless of changing conditions are more susceptible to external pressures that degrade habitat quality within the used site (Battin Reference Battin2004).
Conservation implications
The results of this study provide the first evidence that coastal wetlands support individuals for approximately half of the full annual cycle (100% for residents). In addition, birds wintering in coastal wetland systems maintained small home ranges, did not make any significant within-season movements to other locations, and displayed strong inter-year site fidelity. The small space use of birds in this system suggests that these are areas that provide high quality habitats for wintering wading birds, justifying continued or enhanced protection. Small-scale management decisions aimed at minimising the threats to the habitat quality of high-value wintering sites will likely benefit this species. Further, ecosystem-scale projects such as the Comprehensive Everglades Restoration Plan that work toward the restoration of coastal wetlands at a much broader scale offer even more potential for reducing the external pressures affecting a wider range of important wintering locations. In addition, coastal systems with reliable freshwater availability may support resident individuals, justifying protection for this species year-round. The dependence of birds at Ding on anthropogenic freshwater areas also provides a new opportunity to educate the public and to use this species as a vehicle for teaching residents about the value and importance of wetland and freshwater conservation. Colonies in residential areas are highly visible and sometimes viewed unfavourably by their human neighbours (Telfair et al. Reference Telfair, Thompson and Tschirhart2000). However, for others, the idea of their local community supporting a charismatic species of bird is inspiring and could lead to support for conservation broadly.
Migratory herons displayed weak migratory connectivity between the wintering sites and individual breeding colonies, as individuals dispersed widely throughout the Atlantic Coastal Plain, Gulf and Atlantic Coasts, and the Caribbean. Weak migratory connectivity often suggests that wintering subpopulations are less likely to be impacted by local threats to individual breeding colonies, so management of wintering sites may have a greater effect than management of individual colonies. However, weak migratory connectivity also complicates species-specific conservation plans aimed at increasing productivity, as the drivers of breeding habitat and prey availability may vary widely depending on where colonies are located. As most wading bird breeding is strongly linked to fresh water, conservation plans for Little Blue Heron productivity should carefully consider how local and regional hydrological patterns drive the availability of breeding and foraging habitat, and tailor management to support these processes.
Conservation plans for the Little Blue Heron are heavily skewed towards habitat management in and around breeding colonies (FFWCC 2013; Hunter et al. Reference Hunter, Golder, Melvin and Wheeler2006; LMVJV 2022; Vermillion et al. Reference Vermillion2016). However, many of the recommended management actions, particularly those aimed at protecting and restoring foraging habitats, can easily be adjusted to target important wintering sites. For example, Action 20 of FFWCC (2013) recommends prioritising top nesting colonies and associated foraging habitat based on the need for protection and management, by ranking colonies based on species richness, location relative to other colonies, longevity, imminent threats, and other biological variables. Action 21 then recommends development and implementation of a state-wide monitoring programme for the highest-priority colonies. A simple change in wording of these actions from ‘top nesting colonies’ to ‘top wintering sites’ expands an already established management framework to now include important wintering sites for the conservation of this and other imperilled wading birds. Similarly, the Gulf Coast Joint Venture recommends protecting, restoring, and creating nesting and foraging habitats around colonies, with specific actions aimed at accomplishing each of these (Vermillion Reference Vermillion2016). Many of the specific actions can be applied to enhancing foraging habitat within wintering sites by shifting the location of interest from colonies and applying the same management framework to the most important wintering locations. As we revealed that individual Little Blue Herons likely rely on the same wintering site year after year, management of sites that host high densities of wintering Little Blue Herons will likely benefit this species. There is not a standardised programme for identifying where high-value wintering sites are located for this species, so developing a winter monitoring programme would be an effective first step. However, utilising other tools such as eBird and the Christmas Bird Count to identify sites with high winter abundance would be suitable until such a programme can be implemented at a large scale.
Acknowledgements
This project was funded by the United States Geological Survey, USGS AWARD NO: G19AC00430. Additional funding was provided by Florida Atlantic University and the Harte Research Institute of Gulf of Mexico Studies at Texas A&M University-Corpus Christi. Special thanks go to the staff of J.N. ‘Ding’ Darling (Special Use Permit #21037) and Great White Heron (Research Permit #FKNMS-2019-127-A1) National Wildlife Refuges for allowing access to these refuges for transmitter deployment. The protocols used in this study were approved by the Florida Atlantic University Institutional Animal Care and Use Committee (Protocol #A19-17).


 Open access