

1. Introduction
Farm owners receive substantial benefits from federal agricultural programs. Although the nature of these programs has evolved over time, extensive federal support for agriculture persists. Gardner (Reference Gardner1987) finds that these benefits are not spread evenly among the agricultural industry. They accrue instead to farmers with a comparative advantage in political organizing. According to Smart (Reference Smart1990), farmers are known to structure their operations to avoid maximum subsidy limits. Even Scottie Pippen, of Chicago Bulls fame, received more than $200,000 in payments from the Conservation Reserve Program, according to the U.S. Department of Agriculture, Farm Services Agency (USDA-FSA, 2017). Farmers have strong incentives to protect farm support programs through political action. Understanding the political activities of farmers is crucial to understanding why farm income support programs remain so firmly entrenched in modern agricultural policy.
This article studies the political activities of farmers by exploiting a vote to amend the House version of what became the 2008 Farm Bill, which would have reduced cotton subsidy payments had it passed. There are three primary research objectives. The first objective is to assess whether individual cotton farmers contribute significant sums of money to campaigns in the House of Representatives and determine if this behavior resembles that of cotton political action committees (PACs). If farmers directly contribute substantially to the same legislators that cotton PACs contribute to, then cotton farmers are likely being directed in how to donate by the PACs that represent their political interests. The second objective is to assess whether cotton farmers and cotton PACs contribute strategically in order to influence legislative outcomes. If cotton farmers and cotton PACs are contributing strategically, then they should donate to legislators that are most easily influenced. Figures 1 and 2 demonstrate that both farmers and agricultural PACs are contributing most heavily to legislators with an average cotton farming constituency, suggesting that cotton farmers and cotton PACs are donating to such legislators. The final objective is to determine if these contributions affect legislative outcomes. Because the proportion of farmers among the population has shrunk to roughly 1% according to subsidy receipt records, farmers must rely on money rather than their vote to affect policy outcomes.
Relationship between contributions to a given legislator on the House Committee of Agriculture and the number of cotton farmers living in that legislator’s district.

Relationship between contributions to a given legislator who is not on the House Committee of Agriculture and the number of cotton farmers living in that legislator’s district.

Two prior literatures inform this research. The first is the literature on the activities of agricultural PACs. Stratmann (Reference Stratmann1995) studies the impact of the timing of campaign contributions made by agricultural PACs on farm bill amendment votes, finding that contributions made in the same cycle as the vote have a stronger effect than contributions made in the prior Congress. Brooks, Cameron, and Carter (Reference Brooks, Cameron and Carter1998) study the effect of PAC campaign contributions on a failed vote to repeal sugar tariffs, finding that both pro- and anti-sugar PACs affect voting behavior in Congress. Stratmann (Reference Stratmann1998) finds that agricultural PAC campaign contributions are highly clustered around farm bill amendment votes. Stratmann (Reference Stratmann1992b) finds empirical evidence that agricultural PACs engage in log-rolling behavior. More recently, Russell (Reference Russell2018) finds evidence that the agricultural lobby effectively influenced the 2014 Farm Bill vote, while the most significant determinant of legislator vote behavior is the size of their agricultural constituency.
Several issues remain unresolved in the literature on PAC direct campaign contributions. Despite low contribution limits, most contributions are below these limits, according to Ansolabehere et al. (Reference Ansolabehere, de Figueiredo and Snyder2003). Unlike corporate PACs, farming PACs are formed, organized, and funded by individuals. Farmer interests drive the behavior of farming PACs and should be incorporated into models of PAC influence.
The second relevant literature studies campaign contributions by individuals. Much of this literature examines the actions of individuals at large, rather than individuals with an identifiable special interest. Ensley (Reference Ensley2009) looks at the impact of candidate ideology on individual campaign contributions, finding that individuals are motivated by the absolute policy positions of candidates rather than the relative difference between them. Gimpel, Lee, and Kaminski (Reference Gimpel, Lee and Kaminski2006) find that donors to both political parties tend to be affluent and come from largely the same geographic areas. Gimpel, Lee, and Pearson-Merkowitz (Reference Gimpel, Lee and Pearson-Merkowitz2008) extend this research, studying the impact of the donor location relative to the recipient’s congressional district, finding that contributors vary their contribution strategies by geography. They also find that the more powerful and senior the legislator is, the higher the percentage of campaign funding received from outside his or her district. Although this literature focuses on the actions of individuals, farmers are more than individuals. They are principals operating a business affected by the policies that legislators craft.
The individual campaign finance literature most applicable to the business motivations faced by farmers is the literature on contributions by corporate CEOs. Fremeth, Richter, and Schaufele (Reference Fremeth, Richter and Schaufele2013) find evidence that CEOs strategically donate during their tenure, increasing contributions after becoming CEOs and substantially reducing contributions after retirement. Gordon, Hafer, and Landa (Reference Gordon, Hafer and Landa2007) make a distinction between consumption and investment motivations for contributing to federal campaigns, finding that CEOs contribute disproportionately to legislators with power over their industry. Ovtchinnikov and Pantaleoni (Reference Ovtchinnikov and Pantaleoni2012) find that individuals living in close proximity to major firms will contribute to legislators with oversight functions over said firms. The implication is that individuals who are economically dependent on firms contribute to further the firms’ interests. This literature is most applicable to the question considered here because corporate CEOs and farmers face the same motivations for political giving; the prospect of gaining access to legislators and securing public policies that favor their respective industries.
Agricultural PACs are political organizations created by farmers to further their political objectives. This article adds to the literature on agricultural political action by quantifying the political behavior of individual farmers in a framework that allows for the comparison of farmer and farming PAC behavior. Furthermore, this article contributes to the literature on individual campaign contribution behavior by extending it to include a broader group of individuals with a joint policy objective. Further insight into the political activities of both individual farmers and their political organizations is critical to understanding the continued existence and expansion of federal farm support programs.
Section 2 outlines the theory of political behavior that underlies the empirical model, which is explained in Section 3. Section 4 describes the data and the method used to identify individual farmer campaign contributions. Section 5 discusses the empirical results, and Section 6 concludes.
2. Theory
In order to get advantageous policies passed into law, farmers require a simple majority of legislators to vote in favor of those policies. This has implications for what campaign contribution behavior is optimal, if the objective is influencing legislation. Stratmann (Reference Stratmann1991) finds evidence that agricultural PACs contribute the most to legislators with a median farming constituency. When faced with limited budgets, agricultural PACs have an incentive to contribute to legislators who are on the margin in terms of supporting cotton farming interests. In terms of constituency characteristics, legislators with median farm constituency characteristics are the most likely to be undecided, according to Stratmann (Reference Stratmann1992a).
Thus, if the agricultural lobby seeks to influence agricultural policy using campaign contributions as a tool, they should follow two strategies. The first is to contribute to legislators with median farming constituencies who are likely to be undecided. These legislators are necessary to secure a majority coalition. The total number of subsidy-receiving cotton farmers within a legislator’s congressional district is used to quantify this median cotton farming constituency. Second, the agricultural lobby should contribute to legislators with control over agricultural legislation. In the House of Representatives, members of the House Committee on Agriculture control bills pertaining to agricultural policy, and thus, members of this committee should receive substantial contributions from the agricultural lobby.
The primary goal of this article is to determine if individual farmer contribution behavior is consistent with the median constituency theory described by Stratmann (Reference Stratmann1992a, Reference Stratmann1996). For my purposes, it will be sufficient to compare contributions made by cotton farmers to contributions made by cotton PACs and assess whether contributions flow to legislators with a median cotton farming constituency.
Gordon, Hafer, and Landa (Reference Gordon, Hafer and Landa2007) make a delineation between two different incentives for individual campaign contributions. They call the first motivation consumption motivation. Contributions made as a form of consumption are made to increase the utility of the contributor, with no expectation of influencing the legislative process other than improving the chances that a like-minded candidate wins reelection. On the other hand, contributions made as a form of investment are intended to influence policy outcomes or gain access to legislators.
Unfortunately, the underlying motivation of the donor is unobservable. Ideally, we want to only include donations intended as a political investment in order to isolate the effect of donations intended to influence policy or gain access. In order to mitigate the influence of donations made with consumption motivations, I exploit the timing of the vote. It is highly unlikely for individuals to contribute substantially outside of primary or general election seasons unless they seek to influence policy. By choosing a vote that occurs well before an election cycle, the number of consumption-motivated donations included in the analysis should be substantially reduced. This analysis assumes that contributions made outside of election seasons are political investments, rather than personal giving intended to increase the utility of the donors. A graph of quarterly donations by cotton farmers and cotton PACs is shown in Figure 3. Cotton farmer contributions generally increase the quarter before a general election for each cycle except for 2008. After the 2006 election, contributions from cotton farmers decline and then increase in the quarter before the amendment vote. In the case of cotton PACs, they contribute substantially less during quarters with a federal election. Cotton PACs ramp up contributions ahead of the farm bill introduction and amendment vote decisions.
Line graph depicting quarterly donations (Don) by cotton farmers and cotton political action committees (PACs). Notes: Numbered quarters denote general elections. The vote line denotes the quarter in which the cotton amendment vote took place.

Thus, the ideal vote for analysis should have the following characteristics. First, it should occur in an off election year, well before the primary election season. Second, to isolate the effect of contributions, the vote should be decided by a narrow margin. Because farm bill amendment votes tend to be considered on the same day, to isolate the effect of contributions on the specific vote, the amendment should affect a narrow subset of the agricultural industry. In this study, the vote affects cotton farmers. Finally, a focus on the finalized farm bill vote should be avoided, because finalized farm bills almost always pass with a veto-proof majority. Note that all of the farm bill amendments to the 2008 Farm Bill were considered over the span of two days. Although committee specific votes within the House Committee on Agriculture would be a better object of analysis, to the best of my knowledge, data are not available on committee-specific votes.
3. Empirical model
The empirical specification is a simultaneous probit-tobit model. This empirical model, introduced by Chappell (Reference Chappell1982), allows for the simultaneous estimation of the reduced form campaign contribution equations and the structural legislative vote equation. In the empirical model that follows, the variable Vj
denotes the observed vote decision made by legislator j. This vote is determined by a latent, continuous vote propensity, denoted by $ V_j^* $
. If this latent propensity is greater than 0, then the observed vote equals 1. This vote is a function of campaign contributions made by cotton PACs, denoted by
$ {D^p}_j $
; contributions made by cotton farmers, denoted by
$ {D^f}_j $
; and other characteristics, denoted by Xj
. These other characteristics include party affiliation, ideological extremism, membership on the House Committee on Agriculture, the number of cotton farmers within their district, and spatial controls. It is expected that the size of the cotton farming constituency and membership on the House Committee on Agriculture should negatively affect the propensity to vote for a reduction in cotton subsidies.
$ V_j^* $
. If this latent propensity is greater than 0, then the observed vote equals 1. This vote is a function of campaign contributions made by cotton PACs, denoted by
$ {D^p}_j $
; contributions made by cotton farmers, denoted by
$ {D^f}_j $
; and other characteristics, denoted by Xj
. These other characteristics include party affiliation, ideological extremism, membership on the House Committee on Agriculture, the number of cotton farmers within their district, and spatial controls. It is expected that the size of the cotton farming constituency and membership on the House Committee on Agriculture should negatively affect the propensity to vote for a reduction in cotton subsidies.
The reduced form contribution equations serve two functions. The primary function is to assess what factors motivate cotton farmers and cotton PACs to contribute. The secondary function is to instrument contributions in the vote equation to control for possible endogeneity between contributions and votes. The observed contributions are based on a latent propensity to contribute. The observed contribution equals the propensity if the propensity exceeds zero. The propensity reasoning follows from the fact that whether a PAC or farmer weakly or strongly dislikes a congressional candidate, the observed contribution is still zero.
These contributions are determined in part by the same determinants as the vote decision, Xj . Membership on the House Committee on Agriculture is hypothesized to increase contributions, as is seniority on this committee. Stratmann (Reference Stratmann1992a, Reference Stratmann1995, Reference Stratmann1998), Brooks, Cameron, and Carter (Reference Brooks, Cameron and Carter1998), and Russell (Reference Russell2018) all find that membership on the House Committee on Agriculture significantly affects contributions made by farming PACs.
Yj denotes the exclusion restrictions. These exclusion restrictions include whether the legislator is a freshman, won by a landslide in the last election, or ran unopposed in the last election. The measures for whether a legislator ran unopposed or won by a landslide are chosen because they have no effect on a legislator’s attitude about farm subsidies, and because campaign contributions should have no effect on the legislator’s behavior because he or she is highly likely to win reelection without the help of donations from cotton farming special interests. Freshman legislators, on the other hand, are an unknown quantity from the perspective of the cotton farming lobby. Because they are serving their first term, the vote in question is their first vote on farm policy. How they will react to support from the cotton farming lobby is not knowable until after the vote takes place. Still, freshman status should have no effect on their intrinsic views toward cotton subsidy programs. The choice of freshman status and whether the legislator ran unopposed as instruments follows from Russell (Reference Russell2018). Other studies, such as Stratmann (Reference Stratmann1995), use the percentage of the popular vote received in prior elections. However, because all of the considered legislators are incumbents, all have high vote shares. Using the landslide and unopposed measures more effectively controls for the probability of reelection in this case and has a more convenient interpretation. All three of these measures affect the probability of reelection and the power of the legislator but are not under the direct control of the legislator. Although these characteristics influence whether or not a legislator receives campaign contributions from interest groups, they have no effect on the legislator’s intrinsic views toward cotton subsidies.
Of critical importance is the inclusion of the square of the number of cotton farmers within the legislator’s congressional district as an exclusion restriction. If cotton farmers and PACs contribute predominantly to legislators with a median cotton farming constituency, then there exists a contribution maximizing number of cotton farmers. Including the square of the number of cotton farmers allows for testing this hypothesis. A necessary condition for the existence of a contribution maximizing cotton farming constituency is a positive coefficient on cotton farming population and a negative coefficient on its square.
All of the amendments to the 2008 Farm Bill were voted on within a 48-hour period. Most of the amendments affected agriculture as a whole, rather than farmers of specific crops. Cotton farmers and cotton PACs likely made contributions to affect these unrelated amendments in addition to those made to affect the cotton subsidy reduction amendment. To control for these unrelated donations, the total amount of contributions made by noncotton farmers and noncotton PACs are included in their respective donation equations. Controlling for this variation allows for the study of the determinants of the remainder of contributions unrelated to the amendments affecting all agricultural interests.
Let α 0 − α 3, β 0 − β 2, and γ 0 − γ 2 denote vectors of parameters. Let εv, j, εp,j , and ε f,j denote error terms, and ρv,p , ρv,f , and ρp,f denote correlations between error terms. The empirical model follows.
 $$V_j^{*} = {\alpha}_{0} + {\alpha}_{1} {{D}^{p}}_{j} + {\alpha}_{2} {{D}^{f}}_{j} + {\alpha}_{3} {X}_{j} + {\varepsilon}_{v,j}$$
(1)
$$V_j^{*} = {\alpha}_{0} + {\alpha}_{1} {{D}^{p}}_{j} + {\alpha}_{2} {{D}^{f}}_{j} + {\alpha}_{3} {X}_{j} + {\varepsilon}_{v,j}$$
(1)
 $${D}^{p,*}_{j} = {\beta}_{{0}} + {\beta }_{{1}} {{X}}_{{j}} + {{\beta }}_{{2}} {{Y}}_{{j}} + {{\sigma }}_{{p}} {{\varepsilon }}_{p,j} $$
(2)
$${D}^{p,*}_{j} = {\beta}_{{0}} + {\beta }_{{1}} {{X}}_{{j}} + {{\beta }}_{{2}} {{Y}}_{{j}} + {{\sigma }}_{{p}} {{\varepsilon }}_{p,j} $$
(2)
 $${{D}}^{{{f,*}}} _{{j}} {{ = \gamma }}_{{0}} {{ + \gamma }}_{{1}} {{X}}_{{j}} {{ + \gamma }}_{{2}} {{Y}}_{{j}} {{ + \sigma }}_{{f}} {{\varepsilon }}_{{{f,j}}} $$
(3)
$${{D}}^{{{f,*}}} _{{j}} {{ = \gamma }}_{{0}} {{ + \gamma }}_{{1}} {{X}}_{{j}} {{ + \gamma }}_{{2}} {{Y}}_{{j}} {{ + \sigma }}_{{f}} {{\varepsilon }}_{{{f,j}}} $$
(3)
 $${{V}}_{{j}} = \left\{ \matrix { 1 \ {\rm{if}}\ V_j^* > 0; \cr \hskip-1pt 0\hskip1pt \ \rm {otherwise} }\right. $$
(4)
$${{V}}_{{j}} = \left\{ \matrix { 1 \ {\rm{if}}\ V_j^* > 0; \cr \hskip-1pt 0\hskip1pt \ \rm {otherwise} }\right. $$
(4)
 $${D}^{p}_{j} = \left\{ \matrix { D^{p,*}_{j}\ {\rm{if}}\ D^{p,*}_{j} > 0; \cr \hskip-9pt 0\hskip9pt\ \rm{otherwise}}\right. $$
(5)
$${D}^{p}_{j} = \left\{ \matrix { D^{p,*}_{j}\ {\rm{if}}\ D^{p,*}_{j} > 0; \cr \hskip-9pt 0\hskip9pt\ \rm{otherwise}}\right. $$
(5)
 $$D^f_{j} = \left\{ \matrix { D^{f,*}_{j} \ {\rm{if}}\ D^{f,*}_{j} > 0; \cr \hskip-7pt 0\hskip7pt\ \ \rm{otherwise}}\right. $$
(6)
$$D^f_{j} = \left\{ \matrix { D^{f,*}_{j} \ {\rm{if}}\ D^{f,*}_{j} > 0; \cr \hskip-7pt 0\hskip7pt\ \ \rm{otherwise}}\right. $$
(6)
 $$E\left[ {\varepsilon}_{v,j} \right] = E\left[ {\varepsilon}_{p,j} \right] = E \left[ {\varepsilon}_{f,j} \right] = 0$$
(7)
$$E\left[ {\varepsilon}_{v,j} \right] = E\left[ {\varepsilon}_{p,j} \right] = E \left[ {\varepsilon}_{f,j} \right] = 0$$
(7)
 $$E\left[ {{\varepsilon}^{2}}_{v,j} \right] = E \left[ {{\varepsilon}^{2}}_{p,j} \right] = E \left[ {{\varepsilon}^{2}}_{f,j} \right] = 1$$
(8)
$$E\left[ {{\varepsilon}^{2}}_{v,j} \right] = E \left[ {{\varepsilon}^{2}}_{p,j} \right] = E \left[ {{\varepsilon}^{2}}_{f,j} \right] = 1$$
(8)
 $$E\left[{\varepsilon}_{v,j} {\varepsilon}_{p,j}\right] = {\rho}_{v,p} $$
(9)
$$E\left[{\varepsilon}_{v,j} {\varepsilon}_{p,j}\right] = {\rho}_{v,p} $$
(9)
 $$E \left[ {\varepsilon}_{v,j} {\varepsilon}_{f,j} \right] = {\rho}_{v,f} $$
(10)
$$E \left[ {\varepsilon}_{v,j} {\varepsilon}_{f,j} \right] = {\rho}_{v,f} $$
(10)
 $$E \left[ {\varepsilon}_{p,j} {\varepsilon}_{f,j} \right] = {\rho}_{p, f} $$
(11)
$$E \left[ {\varepsilon}_{p,j} {\varepsilon}_{f,j} \right] = {\rho}_{p, f} $$
(11)
 $$E \left[ {\varepsilon}_{k,j} {\varepsilon}_{k',j'} \right] = 0, k \ne k', j \ne j'}}$$
(12)
$$E \left[ {\varepsilon}_{k,j} {\varepsilon}_{k',j'} \right] = 0, k \ne k', j \ne j'}}$$
(12)
The correlation coefficients ρv,p and ρv,f measure the endogeneity between votes and cotton PAC contributions and between votes and cotton farmer contributions. If these correlation coefficients are statistically significant, then contributions are endogenous and the simultaneous equations framework is necessary to obtain unbiased estimates. This model is estimated using the QLIM Procedure in SAS Software. Marginal effects are calculated using the average of partial effects approach, as explained by Wooldridge (Reference Wooldridge2010).
4. Data
Legislative voting data come from Civic Impulse LLC (2007). House amendment 715, roll call 752, sought to reduce the direct payment rate for cotton by two-thirds of a cent in order to increase funding to the Grassland Reserve Program. Given that the direct payment rate was $0.0667 per pound of cotton, the proposed amendment would have reduced direct payments to cotton farmers by 10%. Having taken place on July 27, 2007, this vote failed by a margin of 175 to 251. This vote satisfies two of the three criteria for an optimal vote to research. Although the vote margin is wide, it does occur well before the primary election season and affects farmers of a specific crop.
Cotton farmers are identified using data from the USDA-FSA (2017), obtained via Freedom of Information Act request. These data contain a record of every farm subsidy transaction made between 1995 and 2016, including the crop to which transaction pertains and the full names and mailing addresses of the recipients. The names and postal zip codes of cotton subsidy recipients are cross referenced with campaign contributors using data from the Federal Election Commission (2018). Farmers and contributors are matched using their last name, first initial, suffix, and postal zip code. Note that the Federal Election Commission only reports contributions in excess of $200. Thus, cotton farmer contributions are underreported, and their estimated effect on vote decisions should be considered a lower bound on the true effect. Note that if an individual makes multiple donations less than $200 but totaling more than $200, the donations are recorded in these data. Although it is not possible to know how many farmers donate less than $200, such small donations are unlikely to influence legislators. Information on which special interest a PAC represents comes from Center for Responsive Politics (2018).
Table 1 defines variable names. Table 2 reports summary statistics for campaign contributions. A total of 115 cotton farmers made 136 campaign contributions between January 1 and July 27, 2007, contributing $117,570.73. In contrast, 11 cotton PACs made 148 contributions during this time, totaling $198,776.23. Although cotton PACs did contribute more than cotton farmers, cotton farmer contributions are far from trivial. Using spatial shape files obtained from Lewis et al. (Reference Lewis, DeVine, Pitcher and Martis2013) and contributor postal zip codes, the congressional district in which the farmer resides is identified. Although farmers contributed slightly more to legislators within district, they made a larger number of contributions to nonlocal legislators. Contributing to legislators representing different districts strongly suggests investment motivations, because one would expect typical donors to donate to their local politicians if their goal is to help elect legislators that directly represent local interests.
Description of variable names in the following tables

Descriptive statistics for campaign contributions and the subsidies received by donating farmers between January 1 and July 27, 2007

Notes: One hundred fifteen cotton farmers made a total of 136 donations, and 11 cotton political action committees (PACs) made a total of 148 donations. All dollar amounts are adjusted to 2017 dollars.
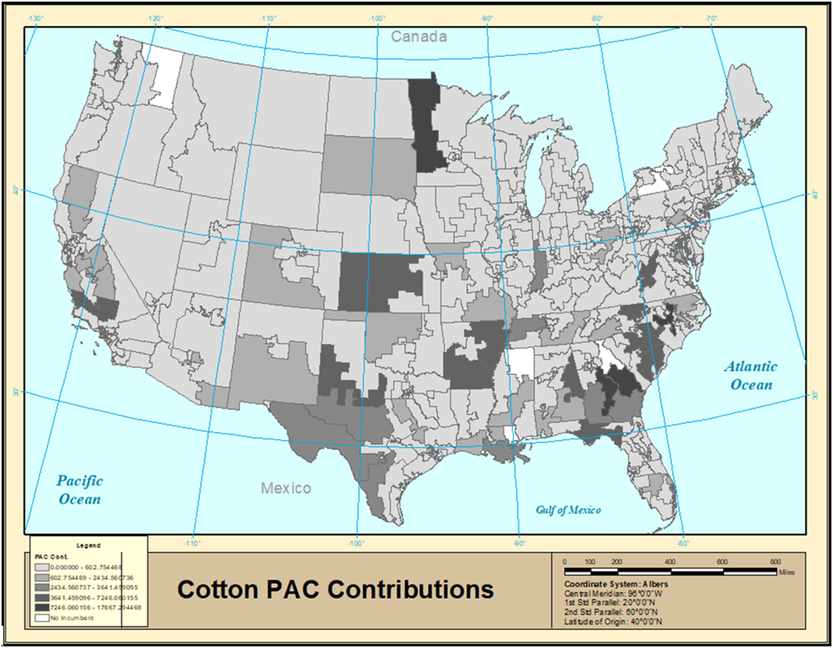
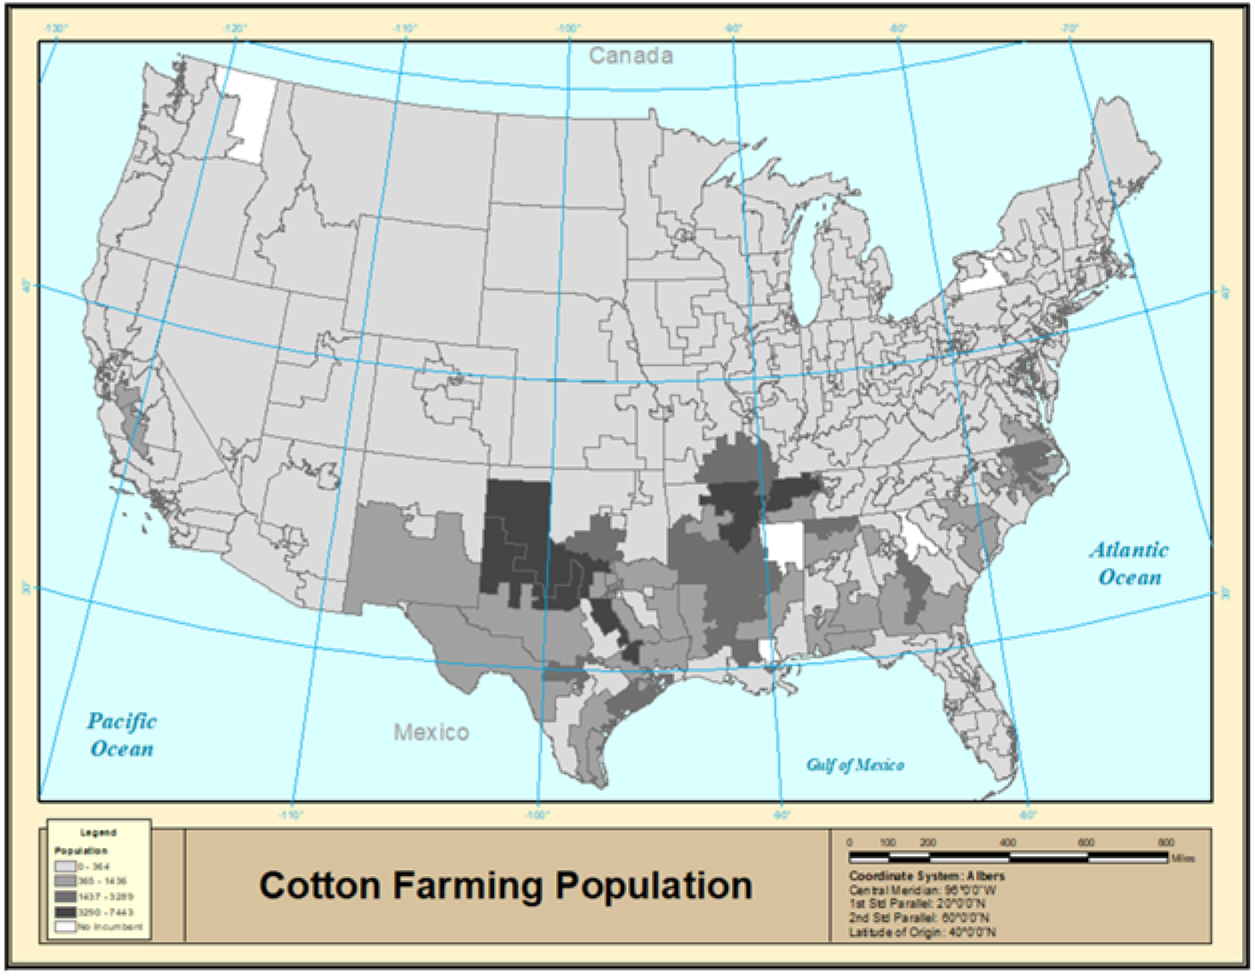
Figures 1 and 2 show scatterplots of cotton farmer and cotton PAC contributions as a function of the number of cotton farmers within a legislator’s district. Legislators representing districts with relatively few cotton farmers receive more in contributions than legislators with a large number of cotton farmers. This is consistent with the existence of a contribution maximizing number of cotton farmers, beyond which contributions decline. Figures 4 and 5 show that cotton farmers and cotton PACs are contributing predominantly to the same legislators. Many of these legislators represent districts without cotton farming, shown in Figure 6, further suggesting investment motivation. The number of cotton farmers within a legislator’s district is determined by counting how many individuals within each district received cotton farm subsidies in 2007.
Choropleth map depicting the receipts of campaign contributions from cotton farmers by congressional district.

Choropleth map depicting the receipts of campaign contributions from cotton political action committees (PACs) by congressional district.
Choropleth map depicting cotton farmer population by congressional district.
Cotton farmers that receive higher levels of cotton subsidies are more likely to contribute. Table 3 reports cotton farmer contributions by quintile of subsidy receipts. Farmers in the top quintile of farm subsidy receipts made twice as many contributions as farmers in the second quintile, who in turn made twice as many contributions as farmers in the third quintile. Although more farmers contributed in the higher quintiles, their per capita contributions were lower than in lower quintiles, suggesting a possible free rider problem.
Campaign donations from cotton farmers by cotton subsidy receipt quintile

Note: All dollar amounts are adjusted to 2017 dollars.
Descriptive statistics for model variables

Notes: All dollar amounts are adjusted to 2017 dollars. All donation variables are reported as total dollar amounts, and the farming population variable reports the total number of farmers.
Data on party affiliation, membership, and tenure on the House Committee on Agriculture come from Stewart and Woon (Reference Stewart and Woon2016). Legislators serving their first term in office are coded as freshman. Information on legislator ideology comes from Royce et al. (Reference Royce, Lewis, Lo, McCarty, Poole and Rosenthal2016). Their DW-Nominate data set plots legislator ideology on a two-dimensional space. Their first dimension coordinate, which corresponds to attitudes on economic freedom, is used to construct the extremism variable. This variable is the absolute value of the first dimension coordinate. Perfect moderates have an extremism score of zero. As their ideology deviates from moderation in terms of economic intervention, the extremism measure increases. Information on the percentage of the vote that legislators received in their last election comes from Kollman et al. (Reference Kollman, Hicken, Caramani, Backer and Lublin2016). These data are used to construct the landslide variable (defined as a vote share greater than 70%) and the unopposed variable. These binary distinctions are more appropriate than vote percentages, because nearly all incumbent legislators have high vote shares. Finally, following along the lines of Russell (Reference Russell2018), USDA Agricultural Resource Management Survey (ARMS) III production regions are manually coded to control for spatial heterogeneity.
Summary statistics for model variables are reported in Table 4. Note that contribution levels and the number of cotton farmers are rescaled in terms of thousands to facilitate estimation. All dollar amounts are adjusted to 2017 dollars using the consumer price index. Because of the fact that the Federal Election Commission only reports personal campaign contributions in excess of $200, cotton farmer campaign contributions are censored below at $241.10 after inflation adjustment.
5. Results
Estimation results are reported in Tables 5 and 6, and marginal effect estimates are reported in Table 7. Three estimations are conducted. The first estimates the complete model as described in Section 3. The second omits members of the House Committee on Agriculture. Because the House Committee on Agriculture drafts the farm bill, it is likely that donors contribute heavily to members of the committee regardless of cotton farming constituency characteristics and then follow the median voter model for nonmembers. The second estimation tests for the median voter hypothesis with members of the House Committee on Agriculture excluded. The final estimation omits the reduced form contribution equations to see how failing to instrument donations affects the results.
Estimation results for the complete model

Note: Asterisks (*, **, and ***) denote statistical significance at the 10%, 5%, and 1% levels, respectively.
Estimation results for the model omitting members of the House Committee on Agriculture, and the model that omits the contribution equations

Note: Asterisks (*, **, and ***) denote statistical significance at the 10%, 5%, and 1% levels, respectively.
Marginal effects estimates

Note: Marginal effects are calculated using the average of partial effects approach.
Results for the complete model are shown in Table 5, with marginal effects presented in Table 7. Members of the House Committee on Agriculture receive more contributions from both cotton farmers and cotton PACs, though the effect is only statistically significant in the cotton PAC equation. Members of the agricultural committee receive $392 more from cotton farmers and $278 more from cotton PACs. Tenure on the committee also increases contributions, though the effect is only weakly statistically significant in the cotton PAC contribution equation.
In both the cotton farmer and cotton PAC contribution equations, the coefficients on the cotton farming population and squared cotton farming population variables are consistent with the hypothesis that representing a median cotton farming constituency maximizes contributions. The level term has a positive coefficient, whereas the squared term has a negative coefficient, with both terms being statistically significant. The coefficient on the squared term in the cotton farmer contribution equation in the estimation that omits members of the House Committee on Agriculture, reported in Table 6, is also negative but lacks statistical significance.
Coefficients for contributions from noncotton farmers and noncotton PACs suggest a positive correlation between contributions from cotton and noncotton farming interest groups. This finding suggests that farmers of various crops are supporting the same legislators, and this result holds in the estimation that omits members of the House Committee on Agriculture. Given that all of the amendment votes occurred within a 48-hour period, this could indicate log-rolling behavior as analyzed by Stratmann (Reference Stratmann1992b) and Wright (Reference Wright1990).
In each specification, reported in Tables 5 and 6, Democrats are significantly more likely to vote for the cotton subsidy reduction than Republicans. Partisanship in the complete model has no effect on donations made by cotton farmers or cotton PACs, though cotton farmers donate less to Democrats when we omit the House Committee on Agriculture. Noting that Democrats controlled the House of Representatives during this time, this suggests cotton farmers donate to members of the committee regardless of party but donate less to Democrats who are not on the committee. Extremism lacks statistical significance in the vote equations. However, cotton farmers are significantly less likely to contribute to ideological extremists in the complete model. Further, when members of the agricultural committee are omitted, cotton PACs contribute less to more extreme legislators, though this result is weakly statistically significant. This supports the idea that farming interests prefer to contribute to moderates, though the evidence does not suggest that extremists are significantly more likely to vote for the subsidy reduction.
Also, coefficients for the freshman, landslide, and unopposed variables yield surprising results. Although freshman status does not affect contributions from cotton farmers, freshman receive between $143 and $203 more from cotton PACs, in contrast to Russell (Reference Russell2018). One would expect these coefficients to be negative, given the fact that junior legislators have less clout than senior ones, and their preferences for legislative voting have not been revealed at the time of the donation. The effects of running unopposed or winning by a landslide in the prior election do not affect contributions received from cotton farmers or cotton PACs.
In the complete estimation and the estimation omitting members of the House Committee on Agriculture, the coefficients for cotton farmer and cotton PAC contributions in the vote equation lack statistical significance. A Wald test for joint significance, reported in Table 8, also fails to find evidence of a joint effect of contributions on the vote. Estimates suggest that a $1,000 increase in cotton farmer contributions reduces the probability a legislator votes for the subsidy reduction by 13%, with the same increase in cotton PAC contributions reducing the probability by 12% to 17%. These implausibly large estimates are likely driven by the fact that the vote was defeated by a large margin. Table 9 reports predicted and counterfactual vote tallies. All models underestimate the effectiveness of campaign contributions, predicting a higher vote tally for the subsidy reduction than actually occurred. Each counterfactual vote predicts that the vote would have passed had it not been for campaign contributions. Further research should exploit a vote decision decided by a much closer margin.
Wald statistics testing for joint statistical significance

Actual vote tallies, predicted votes tallies given observed contribution levels, and counterfactual vote tallies if no contributions were made

Fit statistics for each estimation

The correlations between the error terms of the vote equation and each of the contribution equations, reported in Table 10, lacks statistical significance in both the complete model and the model omitting members of the House Committee on Agriculture. This suggests that contributions are not endogenous. Table 6 reports estimates from a probit estimation, which treats contributions as exogenous. Although the coefficients and marginal effect estimates do not change substantially, cotton farmer and cotton PAC contributions are statistically significant when reduced form contribution equations are omitted. Although there are strong theoretical motivations to believe campaign contributions are endogenous, the lack of endogeneity is consistent with Stratmann (Reference Stratmann1995), from which this empirical framework is drawn.
Wald tests of joint significance are reported in Table 8. The exclusion restrictions are highly statistically significant for the cotton PAC contribution equations, whereas they are only weakly statistically significant for the cotton farmer donation equations.
6. Conclusion
From this analysis, three implications are clear. The first is that cotton farmers contribute significantly to campaigns in the House of Representatives. Secondly, they employ a contribution strategy more sophisticated than simply contributing to local legislators, and one that closely resembles that of their PACs. In particular, both cotton farmers and cotton PACs contribute to legislators with a median cotton farming constituency rather than to legislators representing cotton farming districts, suggesting that cotton farmers, like cotton PACs, are strategic in their contribution behavior. Third, cotton farmers that receive more in subsidies from federal farm programs are more likely to contribute to House campaigns. On the other hand, there is no evidence that contributions from either cotton PACs or cotton farmers significantly affected the outcome of the vote to curtail cotton subsidies.
This empirical framework has some limitations. First, the simultaneous equations limited dependent variable model framework is limited in what types of votes can be exploited. Identification relies on choosing instrumental variables that are likely to influence donation decisions without influencing the vote decision of the legislator. Any methods relying on instrumental variables that are theoretically exogenous according to a behavioral theory carry a certain degree of risk. Identification further relies on the timing of the vote. Although this method is feasible for this vote because it occurs well before a primary election cycle, this method cannot be applied to votes occurring later in a Congress. Second, dynamic relationships between PACs and legislators are an important component of legislator and donor behavior, as demonstrated by Romer and Snyder (Reference Romer and Snyder1994), Stratmann (Reference Stratmann2002), and Krozner and Stratmann (Reference Krozner and Stratmann2005). Individuals may also form dynamic relationships with legislators. This empirical framework cannot incorporate dynamic relationships because of the study of an isolated vote. Finally, this method relies on selecting vote decisions that affect a small portion of the agricultural lobby and are decided by close margins in order to isolate the effect of donations intended to influence a very specific policy. Although the selected vote specifically targets cotton farmers, it was not decided by a close margin. If cotton farmers and PACs expected anti-cotton initiatives to fail, there was little incentive for them to invest more in campaign contributions to alter the vote. Such votes are becoming more and more rare with each farm bill regime. Of the farm bills that originated in the House of Representatives, there was a single crop specific amendment vote in 2007, two in 2002, four in 1996, and nine in 1985. Increasingly, program-specific changes seem to be settled in conference committee, which makes this type of analysis exceedingly difficult for future votes. Finally, this research ignores a major component of the individual farmer’s donation decision: how they support the farming PACs.
It is important to keep the role of agricultural PACs in perspective. These organizations are created by farmers to further their political objectives. Farmers face a collective action problem when engaged in lobbying, and the PACs are the tool used to overcome this problem. These results suggest that farmers follow similar donation strategies as the PACs that represent them. Although this research suggests that donations by cotton farmers and cotton farming PACs have no effect on the specific vote considered here, prior literature confirms that farming PACs do affect legislative vote decisions. What remains unanswered is the precise relationship between farming PACs and farmers. Farming PACs likely inform farmers about policy initiatives and may inform farmers on which legislators to support, which would explain the similarity in contribution behavior. The relationship between individual farmers and farming PACs has not been explored by this literature. Future research should focus on this relationship. Key questions include how production conditions affect the decision to donate to farming PACs, whether or not farmers form dynamic relationships with agricultural PACs, and what motivates them to donate to farming PACs versus specific candidates. These are ripe topics for future research.
Acknowledgments
I would like to thank the anonymous reviewers for their helpful feedback on this paper. All remaining errors are the fault of the author.


 Open access